Article

Scaling Pharmacodynamics from Rats to Humans to Support Erythropoietin and Romiplostim Combination Therapy to Treat Erythropoietin-Resistant Anemia

1
School of Pharmacy, Faculty of Medicine, The Chinese University of Hong Kong, Shatin, Hong Kong SAR, China
2
Department of Pharmaceutical Sciences, The State University of New York at Buffalo, Buffalo, NY 14260, USA
3
Drug Clinical Trial Center, Peking University Third Hospital, Beijing 100191, China
4
Division of Hematology, Department of Medicine and Therapeutics, Faculty of Medicine, The Chinese University of Hong Kong, Shatin, Hong Kong SAR, China
*
Author to whom correspondence should be addressed.
Pharmaceutics 2023, 15(2), 344; https://doi.org/10.3390/pharmaceutics15020344
Submission received: 21 November 2022 / Revised: 22 December 2022 / Accepted: 17 January 2023 / Published: 19 January 2023

Abstract

:
Recombinant human erythropoietin (rHuEPO) is one of the most effective drugs for the treatment of anemia in patients with chronic kidney disease. However, EPO-resistance is an important contributor to the increased risk of adverse effects. We previously showed that EPO treatment could induce precursor cell depletion, resulting in EPO-resistance. We further found that the combination of EPO with romiplostim, a thrombopoietin receptor agonist that can stimulate the expansion of hematopoietic stem cells, can treat EPO-resistance. In this study, we performed interspecies pharmacodynamic (PD) scaling of this combination therapy for human dose prediction. The pharmacokinetic parameters of both rHuEPO and romiplostim in humans were obtained from previous studies. The PD parameters obtained in rats were scaled to humans using allometric equations. The relationship between PD parameters of the megakaryocyte lineage from rats, monkeys, and humans was in agreement with those from the literature on allometric scaling. The PD response was translated to humans based on allometric scaling and agreed with the observed data. These parameters were used to simulate hemoglobin and platelet response in humans. RHuEPO 50 IU/kg thrice weekly and romiplostim 1 μg/kg once every 4 weeks from the second week is the recommended combination dosing regimen according to the model prediction. Our work successfully scaled the PD of rHuEPO and romiplostim monotherapy from rats to humans. The predicted dosing regimen of each drug in the combination therapy is less intensive than the approved starting dose of each drug, which supports additional evaluations of the combination therapy in humans.

1. Introduction

Anemia is a common complication of chronic kidney disease (CKD) and is associated with increased cardiovascular events and hospitalizations. Erythropoietin (EPO) deficiency is considered a primary etiologic factor for renal anemia [1]. Recombinant human erythropoietin (rHuEPO) has revolutionized anemia management, as it reduces the need for red blood cell (RBC) transfusions and improves anemia-related symptoms and quality of life [2,3]. Despite the great efficacy of rHuEPO, randomized controlled trials have shown that high-dose erythropoiesis-stimulating agents (ESAs) increase the risks of mortality and cardiovascular events [4,5,6]. Therefore, the United States Food and Drug Administration has recommended that the lowest possible erythropoiesis-stimulating agent dose be used when treating patients on hemodialysis for end-stage renal disease. In addition, up to 10% of CKD patients with anemia fail to achieve the hemoglobin (Hgb) target after rHuEPO treatment or require large doses of rHuEPO to maintain a target Hgb concentration. These patients are recognized as EPO-resistant or hyporesponsive [7] and are typically switched back to blood transfusion, which may lead to poor compliance and associated side effects [8,9,10,11]. Therefore, it is essential to develop novel and effective approaches to stimulate erythropoiesis, reduce the need for erythropoiesis-stimulating agent doses and transfusions, and correct EPO resistance.
Our previous study showed that intensive rHuEPO treatment can induce erythroid precursor cell depletion, resulting in EPO resistance [12], and we further reported that a combination of thrombopoietin receptor agonists (TPO-RAs) with EPO can promote erythropoiesis synergistically [13,14]. Moreover, we demonstrated that EPO can drive the fate of bipotent megakaryocyte–erythroid progenitors (MEPs) toward the erythroid lineage, thus restoring the platelet count to the normal physiological range through MEP competition and reducing the risk of thrombosis. These results support the use of EPO in combination with romiplostim, a second-generation thrombopoietin receptor agonist that can stimulate the expansion of hematopoietic stem cells, in treating EPO resistance.
It is important to ascertain how data obtained from animal models can be extrapolated quantitatively to humans. Allometric scaling has been successfully used for cross-species scaling of pharmacokinetics (PK) and pharmacodynamics (PD) [15,16,17,18]. It is based on the concept that the physiological and biochemical variables of different mammals are similar across species with respect to physiological factors such as body weight (BW) when handling certain drugs [19,20].
The objectives of this study were to scale the previously developed PK/PD model of rHuEPO and romiplostim combination therapy from rats to humans. The scaled PD responses were compared with observed effects in humans for validation. The validated PK/PD model was used to predict the combination dosing regimen in humans to support future clinical trials.

2. Materials and Methods

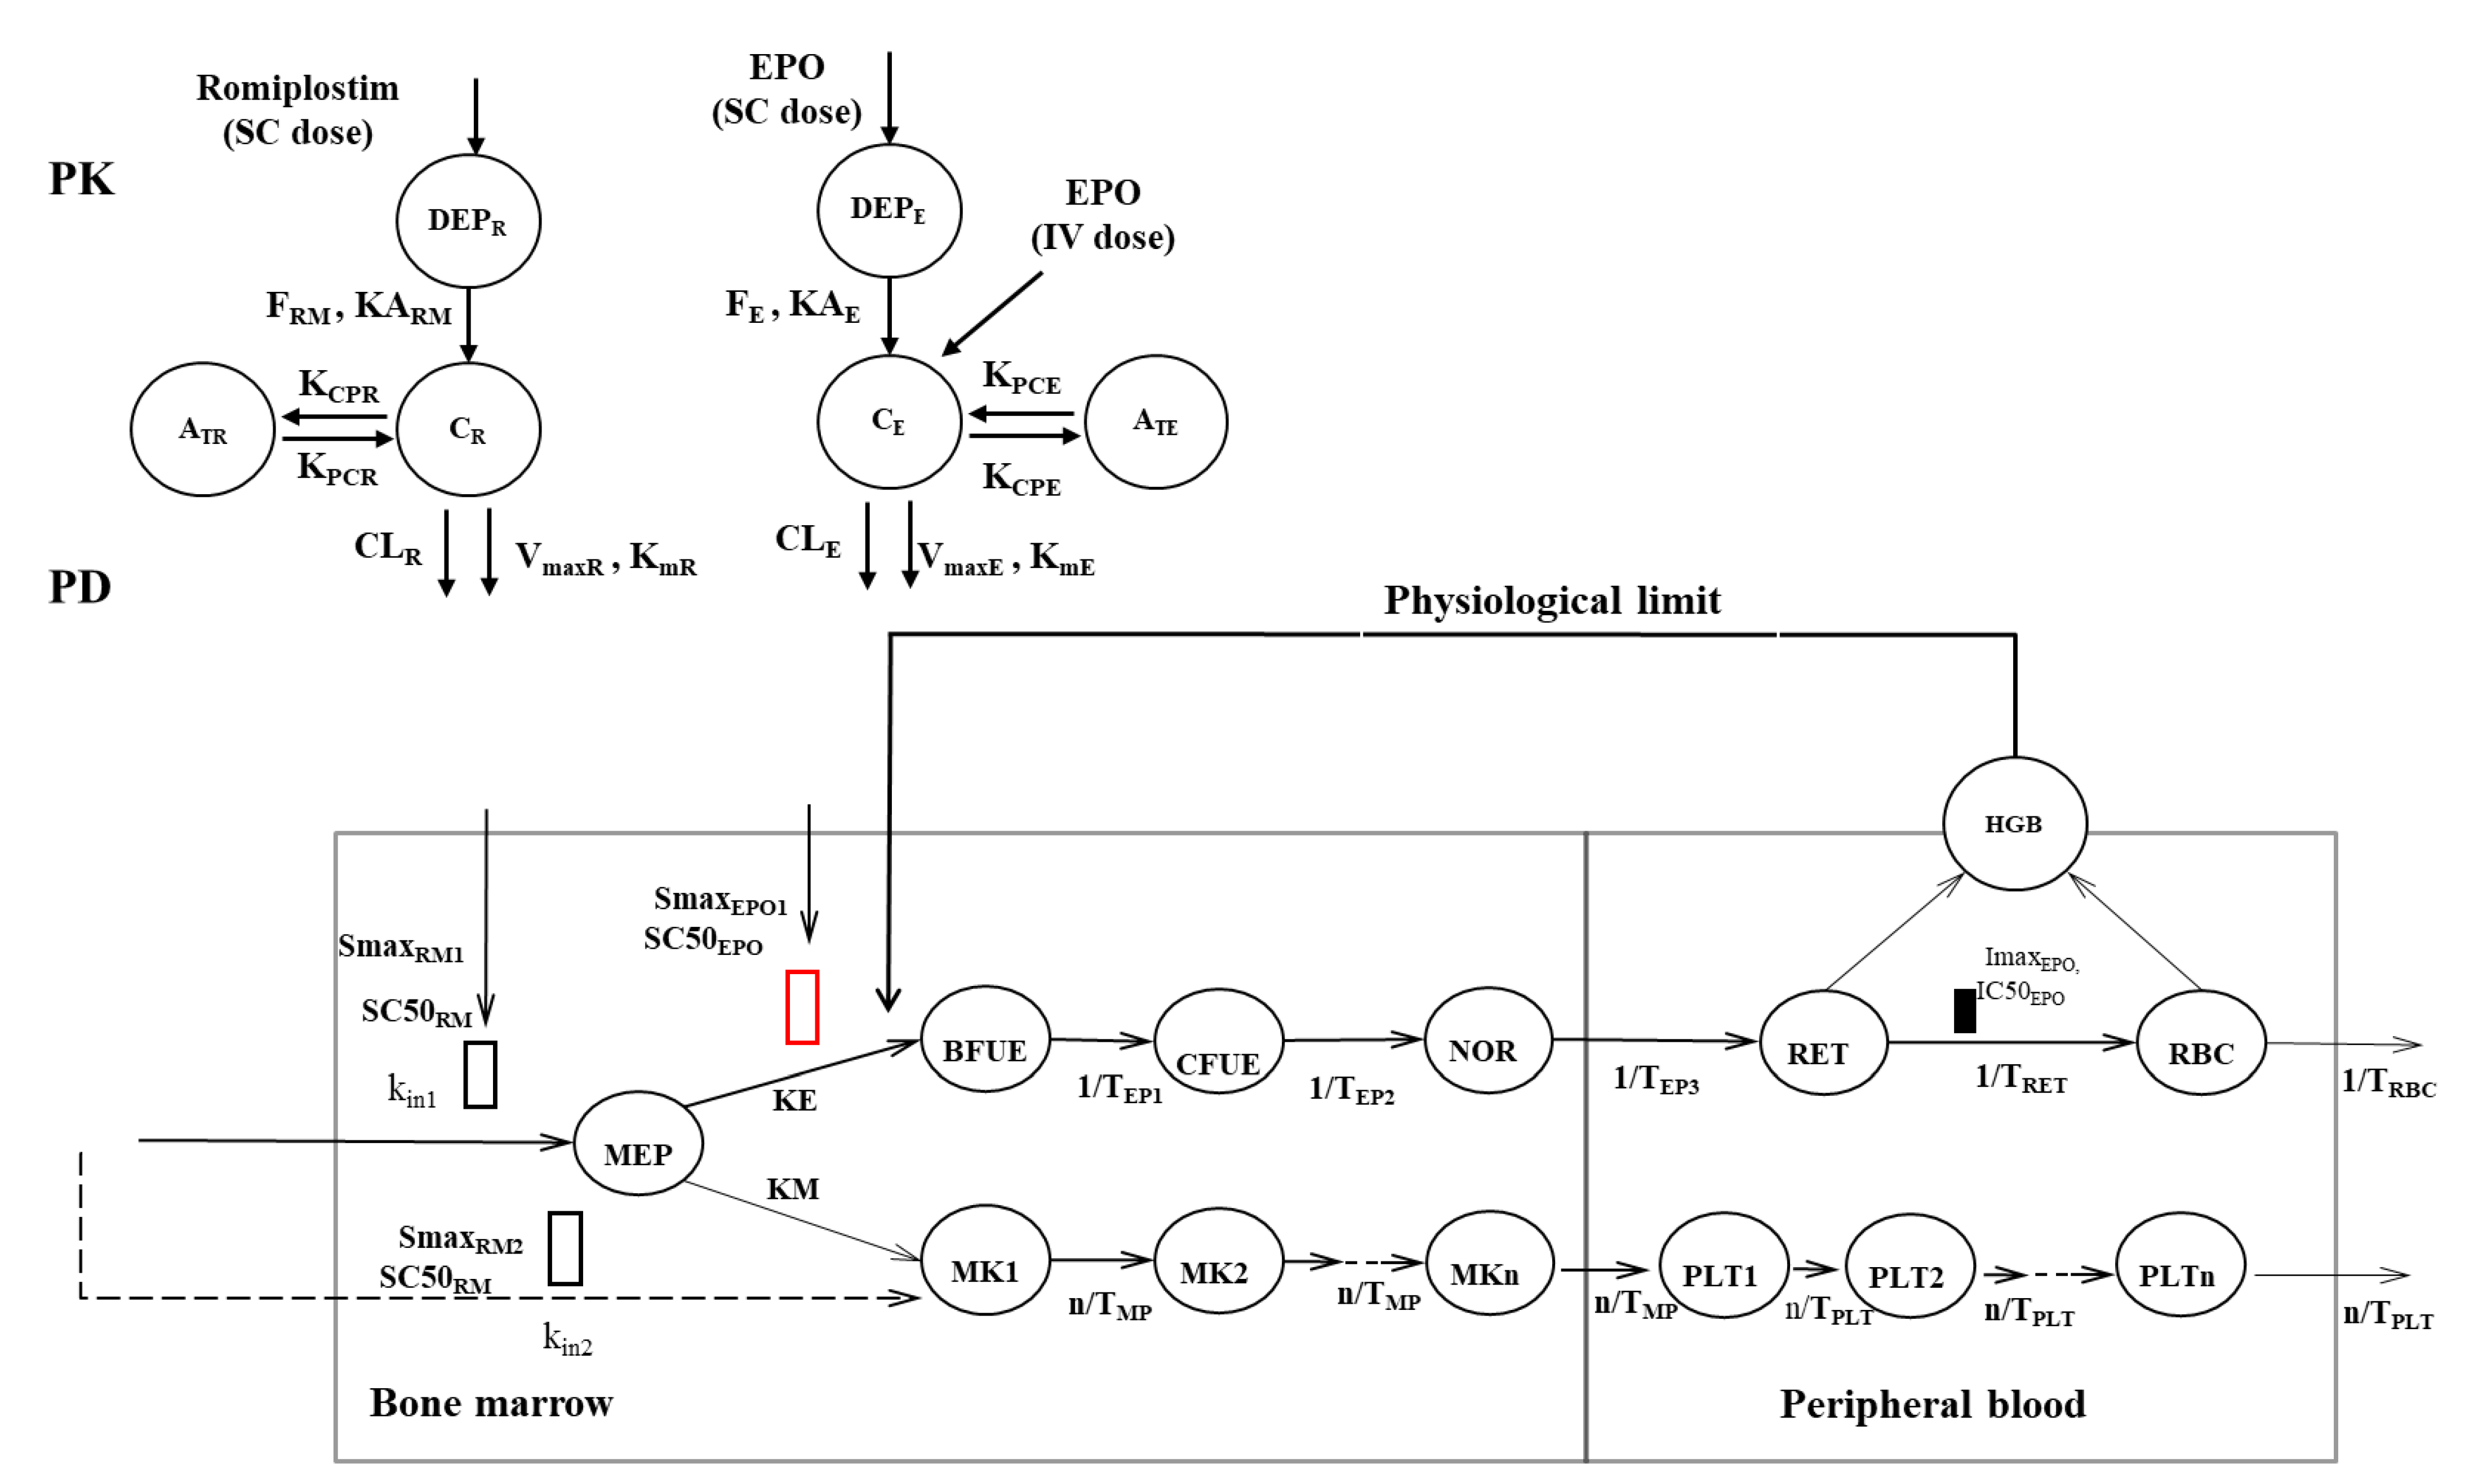
2.1. Michaelis–Menten Approximation of Target-Mediated Drug Disposition PK/PD Model Development

The mechanism-based PK/PD model structure was described in our previous publication [13]. The rHuEPO and romiplostim PK parameters in humans were estimated using the target-mediated drug disposition (TMDD) model [21,22], whereas the PK model described in our previous publication was a two-compartment model for rHuEPO and one-compartment model for romiplostim [13]. To adjust the compartmental PK model to the target-mediated drug disposition model for more precise allometric scaling, Michaelis–Menten (M-M) approximation of the target-mediated drug disposition model was incorporated into our mechanism-based PK/PD model. The general structure of the Michaelis–Menten-target-mediated drug disposition PK/PD model of rHuEPO and romiplostim is shown in Figure 1. The PK model for rHuEPO and romiplostim consists of an Michaelis–Menten approximation of the target-mediated drug disposition model, assuming quasi-equilibrium. The differential equations for rHuEPO PK after intravenous (IV) or subcutaneous (SC) administration are as follows (Equations (1)–(6)):
dA DEPE dt = KA E · A DEPE   where   A DEPE 0 = F E Dose _ SC E
dA CEPO dt = KA E · A DEPE CL EPO · C EPO V MEPO · C EPO K MEPO + C EPO K CPEPO · V CEPO · C EPO + K PCEPO · A PEPO where   A   CEPO 0 = Dose _ IV E
dA PEPO dt = K CPEPO · V CEPO · C EPO K PCEPO · A PEPO   where   A PEPO 0 = 0
C EPO = 1 2 × ( C TOTE R TOTE k MEPO + C TOT R TOTE k MEPO 2 + 4 × k MEPO × C TOTE
R TOTE = V MEPO / V CEPO × k INTE
C TOTE = A CEPO / V CEPO
Similarly, the differential equations for romiplostim PK after SC administration are as follows (Equations (7)–(12)):
dA DEPR dt = KA RM · A DEPR   where   A DEPR 0 = F RM Dose _ SC RM
dA CRM dt = KA RM · A DEPR CL RM · C RM V MRM · C RM K MRM + C RM K CPRM · V CRM · C RM + K PCRM · A PRM where   A CRM 0 = Dose _ IV RM
dA PRM dt = K CPRM · V CRM · C RM K PCRM · A PRM where   A PRM 0 = 0
C RM = 1 2 × ( C TOTR R TOTR k MRM + C TOTR R TOTR k MRM 2 + 4 × k MRM × C TOTR
R TOTR = V MRM / V CRM × k INTR
C TOTR = A CRM V CRM
where ADEPE, ACEPO, and APEPO are the amounts of rHuEPO in the absorption, central, and peripheral compartments, respectively, and ADEPR, ACRM, and APRM are the amounts of romiplostim in the absorption, central, and peripheral compartments, respectively. KAE and KARM are the absorption rates of rHuEPO and romiplostim, respectively; FE and FRM are the bioavailabilities of rHuEPO and romiplostim, respectively; VCEPO and VCRM are the volumes of the central compartments of rHuEPO and romiplostim, respectively; CLEPO and CLRM are the linear clearances of rHuEPO and romiplostim from the central compartment, respectively; and RTOTE and RTOTR represent the total EPO and TPO receptor concentrations, respectively. VMEPO and KMEPO denote the maximum elimination rate and Michaelis constant of rHuEPO, respectively; VMRM and KMRM denote the maximum elimination rate and Michaelis constant of romiplostim, respectively, which were used to describe Michaelis–Menten saturable kinetics; CEPO and CRM are the free serum concentrations of rHuEPO and romiplostim at time t, respectively; and KCPEPO and KPCEPO are the intercompartmental rate constants of rHuEPO. KCPRM and KPCRM are the intercompartmental rate constants of romiplostim; and KINTE and KINTR are the rate constants of the EPO–receptor complex and TPO–receptor complex internalization, respectively.
The previously developed PD model, which mimics the process of erythropoiesis and thrombopoiesis from bone marrow progenitor cells (MEPs) to peripheral blood cells (red blood cells and platelets), was applied directly [13]. The model is based on cell lifespan concepts by using the catenary indirect response model [23]. Details about the PD model equations were described in the original publication (provided in the Supplementary Materials).

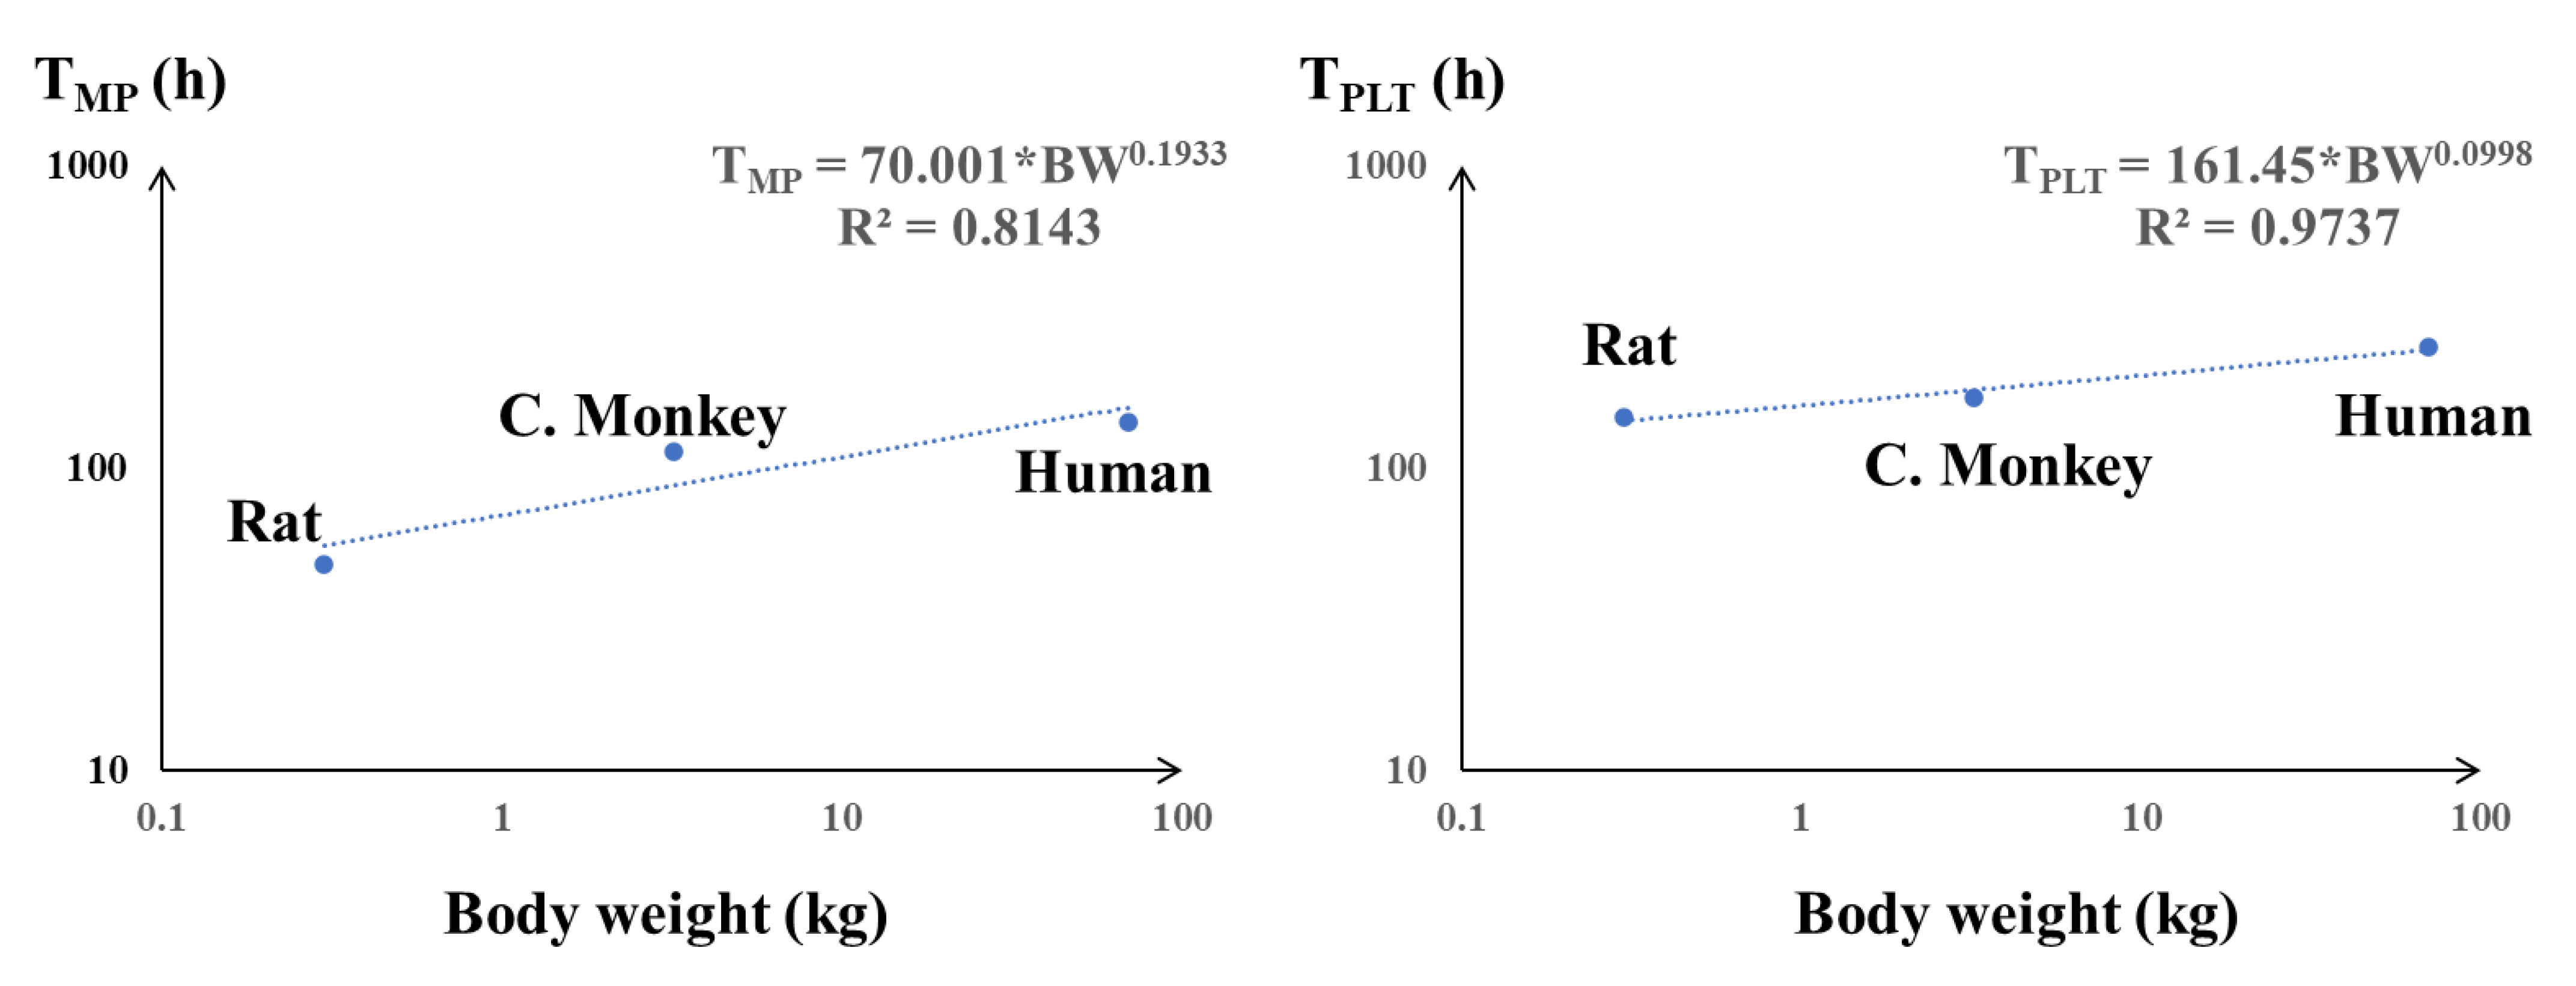
2.2. Allometric Scaling and Validation

To translate the findings for combination therapy in rats to humans and to predict the optimal human dosing regimen, allometric scaling and model-based simulation were performed. Allometric scaling is based on the concept that many physiological processes and organ sizes (θ) tend to obey a power law [15]:
θ = a · W b
where W represents BW, and a and b are drug/process coefficients. Allometric scaling has been widely used to predict PK and PD parameters by performing least-squares linear regression to the power-based simple allometric equation.
As human PK models are available for both romiplostim and rHuEPO, they were used to drive PD in simulations directly. A brief description of the PK parameters of rHuEPO after IV or SC injection and romiplostim after SC injection in humans is presented in Table 1 [21,22,24]. Allometric scaling of rHuEPO from rats to humans has been investigated and was used in this study [25]. The PD data of romiplostim for various species were obtained from the literature [22,26]. The above relationships were established based on the data collected from healthy rats, monkeys, and humans. Then, the PD parameter estimates in rats [14,26] were used to calculate the PD parameters in humans according to the relationships. Because of the influence of disease status, it is risky to directly scale PD parameters from rats with CKD to human patients with CKD. The PD parameters in healthy rats from previous publications were used for scaling to predict the combination dosing regimen in healthy humans. The lifespan of each cell population was scaled using the allometric scaling rule. Physiological parameters such as the baseline platelet and red blood cell values were based on human values [27,28]. System-specific parameters, such as capacity (Smax) and sensitivity (SC50) parameters, were directly adopted from rats and applied to humans because these parameters tend to be similar across species [15]. Only nominal variability was assigned to the baseline terms RBC0 and PLT0 (10% CV%) [15].
The scaled model for healthy subjects was validated externally using the human PD data for romiplostim and rHuEPO in the literature [21,22,24,29,30].

2.3. Model-Based Simulation of rHuEPO IV and Romiplostim SC Administration PD in Humans

To predict the optimal combination therapy dosing regimen in humans, the final model was used to simulate the PD profile of rHuEPO IV and romiplostim SC administration. Different dosing regimens of rHuEPO and romiplostim were considered based on the standard treatment of rHuEPO (50 IU/kg thrice weekly [TIW]) and romiplostim (1 μg/kg). Eight dosing regimens of rHuEPO and romiplostim combination therapy (Table 2) were proposed. The primary safety concern when using romiplostim to correct EPO resistance is the risk of thrombosis. The normal platelet range in healthy individuals is 0.15 to 0.35 × 10¹²/L [28]; therefore, the safety margin of 0.35 × 10¹²/L for platelets was proposed.

2.4. Software

PK/PD model analysis was performed using NONMEM 7.5 (Icon Development Solutions, Ellicott City, MD, USA). The ordinary differential equations were solved using the ADVAN13 subroutine, and the first-order conditional estimation method with interaction was used for all runs. The use of NONMEM was facilitated by Perl-speaks-NONMEM (version 4.9.6, http://psn.sourceforge.net/docs.php (accessed on 20 November 2022)). Graphical visualization and model diagnostics were performed using the R program (version 4.1.1, www.r-project.org (accessed on 20 November 2022)). Mean PD value time profiles for RHuEPO and romiplostim were extracted using WebPlotDigitizer 4.5 (https://apps.automeris.io/wpd/ (accessed on 20 November 2022)).

3. Results

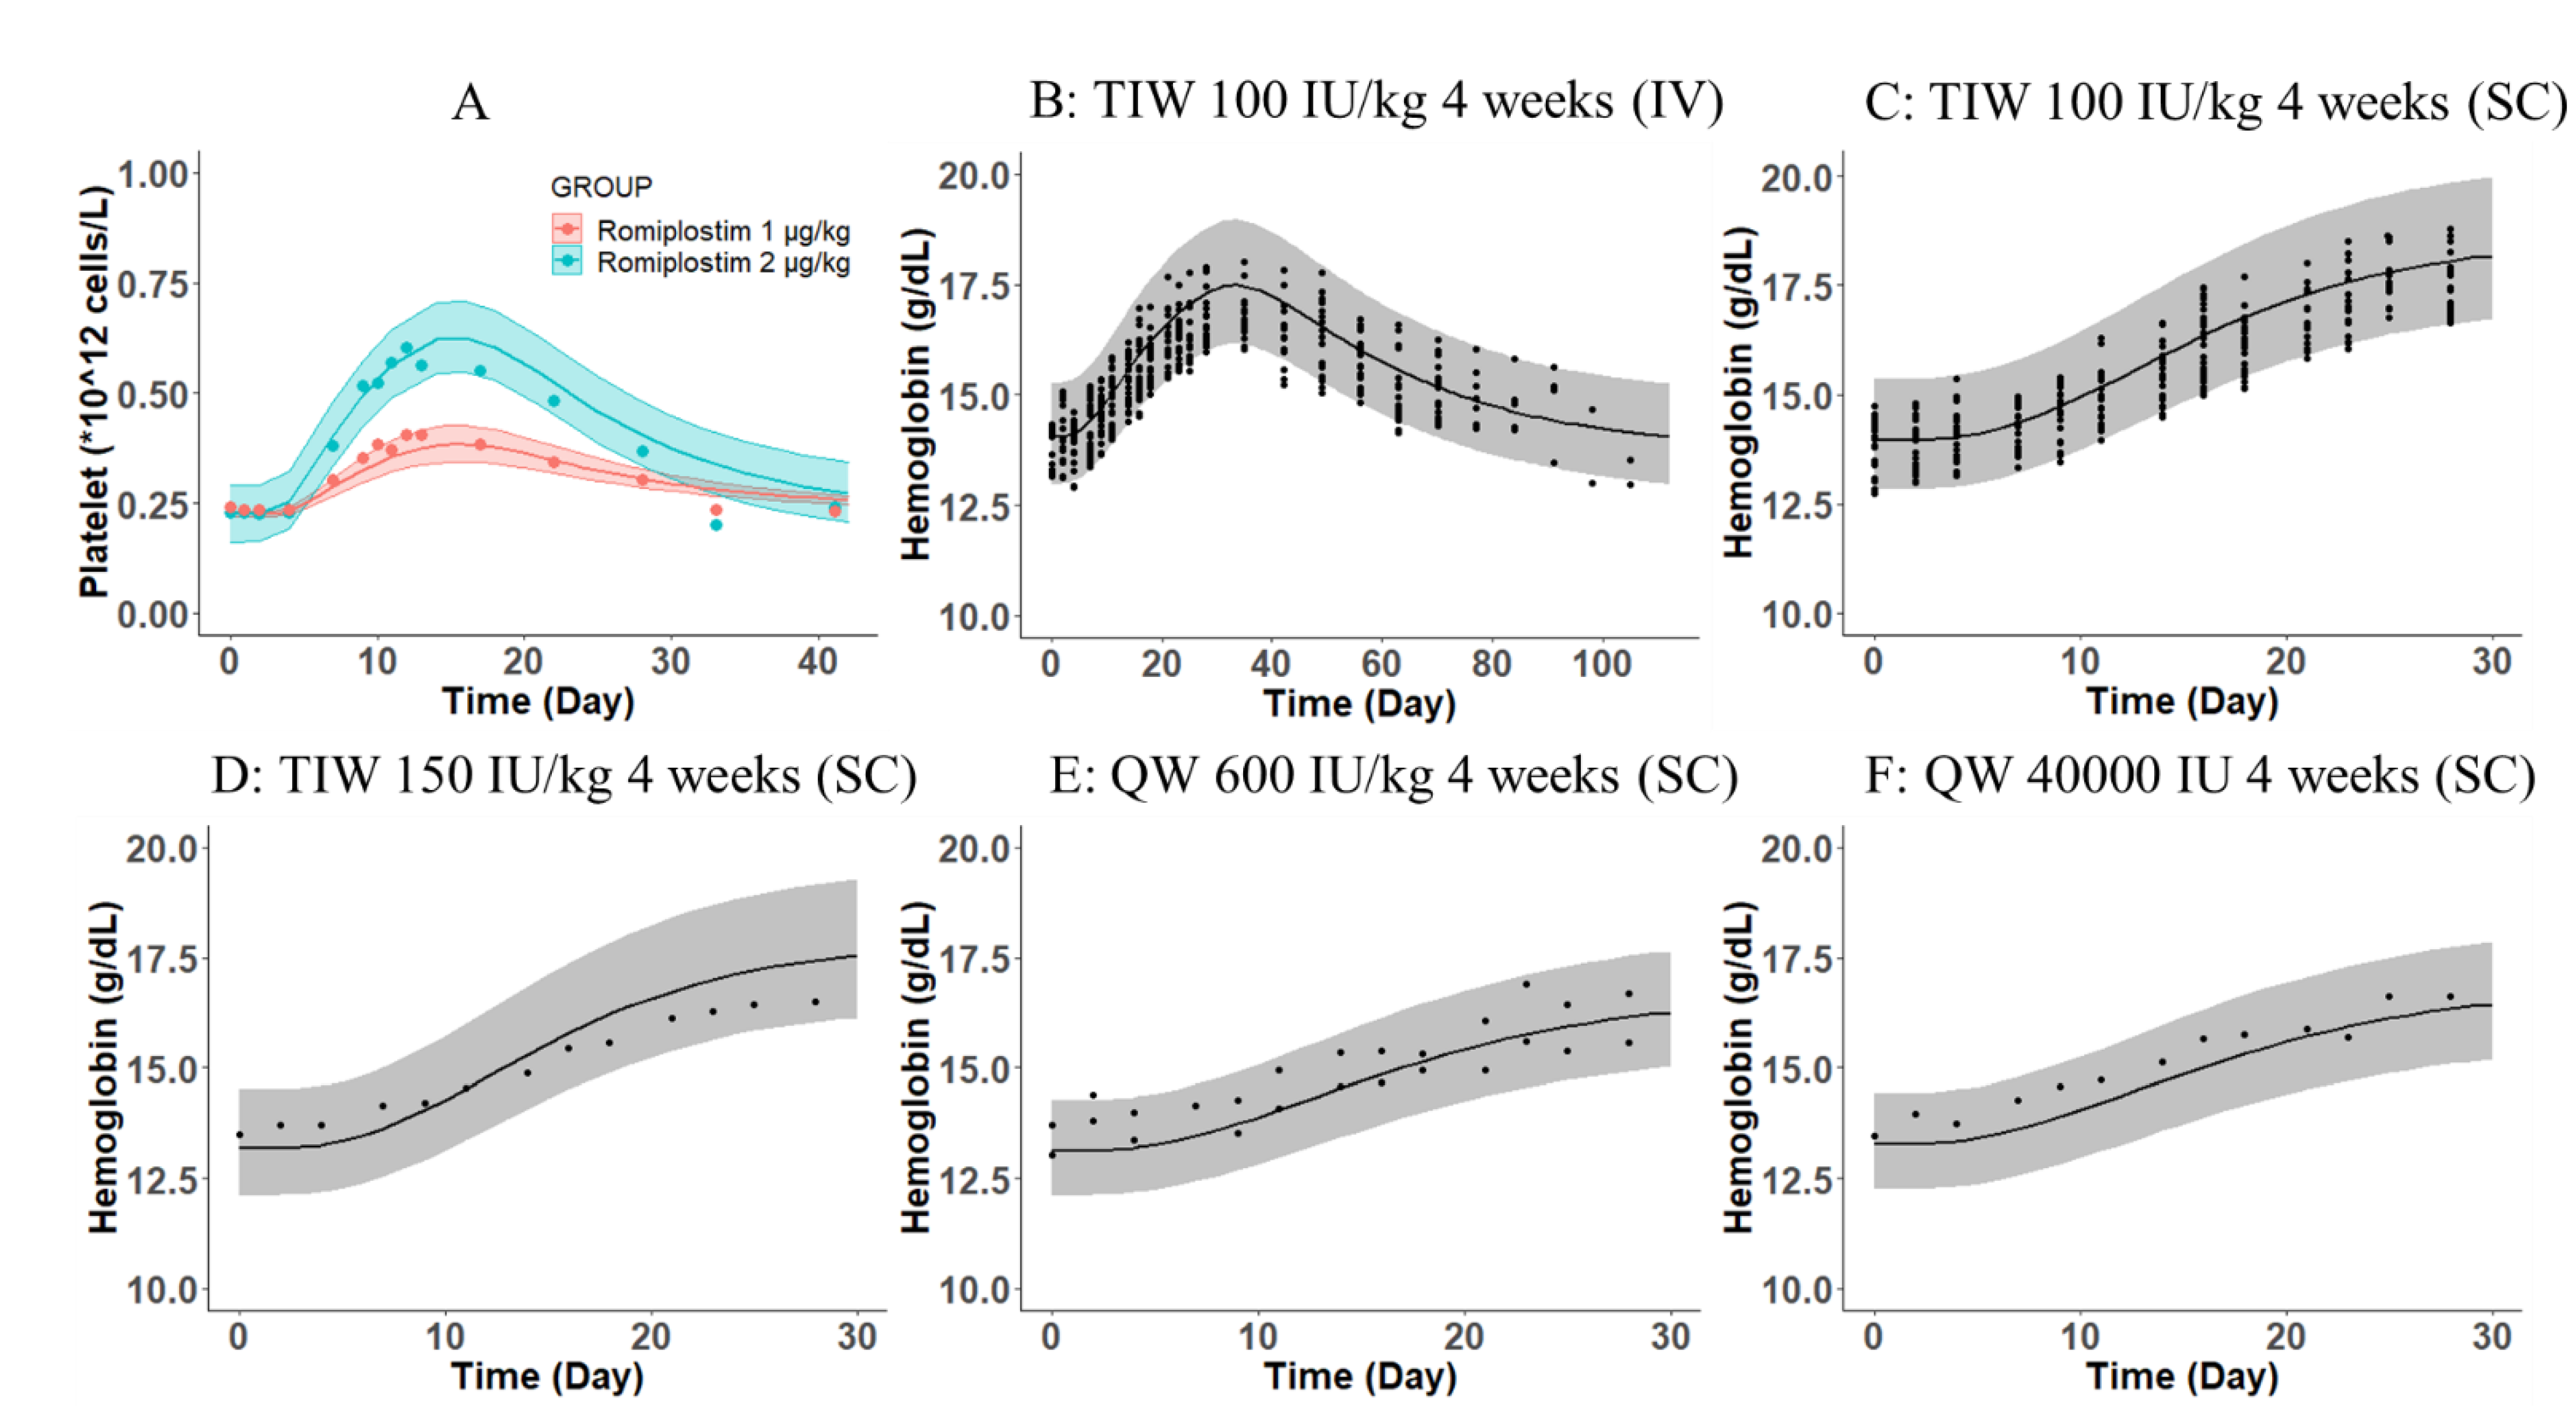
3.1. Michaelis–Menten Approximation of a Target-Mediated Drug Disposition PK/PD Model Reasonably Characterizes the PK and PD Profiles of Romiplostim and rHuEPO as Monotherapy and Combination Therapy

The proposed Michaelis–Menten-target-mediated drug disposition PK model captured the concentration–time profiles of romiplostim and rHuEPO after both monotherapy and combination therapy in rats (Supplementary Figure S1, Table S1). Then, the typical PK parameters obtained from the PK modeling were used to drive the PD model.
The goodness-of-fit diagnostic plots (Supplementary Figure S2) for the final PD model suggested that the model adequately fitted the PD data in rats. The homogeneous distribution of data points around the identity line presented in the diagnostic plots indicated the absence of systematic bias. The parameter estimates of the model are presented in Supplementary Table S2. All fixed and random effect parameters were adequately estimated, with a relative standard error of less than 50%. The estimates of the hematological parameters TRBC (mean residence times for mature RBCs), TRET (mean residence times for reticulocytes), TMP (mean lifespan of megakaryocyte cells), TPLT (mean lifespan of platelets), RBC0 (baseline RBCs concentration), MCH (mean corpuscular hemoglobin), and PLT0 (baseline platelets in blood) were close to the physiological values [26,31].

3.2. Extrapolation and VALIDATION of the PK/PD Model to Humans

To further examine the model performance and translate the results from rats to humans, allometric scaling was used to extrapolate human PD parameters. The interspecies relationships of TMP and TPLT were described by allometric equations, as shown in Figure 2. A good correlation (R2 > 0.81) of body weight with TMP and TPLT was observed. The PD parameters from the scaling are listed in Table 3 and were retrospectively compared with the physiological values in humans. The scaled TMP, TPLT, TRET, and TRBC were 137.1 h, 10.6 days, 44.8 h, and 119.6 days, respectively, which were close to the physiological values [22,24,32,33]. The PD parameters in humans for the scaled model are listed in Table 4.
Both PK parameters of the two drugs in humans were estimated using the target-mediated drug disposition model, which has been proven to adequately characterize the observed PK profiles of rHuEPO and romiplostim in humans [21,22,24]. The PD data of rHuEPO and romiplostim in healthy subjects were digitized from the original articles directly (Figure 3) [22,24,29,30]. All PK parameters of rHuEPO and romiplostim in humans were maintained identically to those derived from the previous reports (Table 1). As shown in Figure 3, the scaled PK/PD model prediction agreed well with both the observed Hgb and platelet data from rHuEPO- and romiplostim-treated healthy volunteers. In general, the translational mechanism-based PK/PD simulation adequately described the human RBC and platelet responses following repeated IV or SC administration of rHuEPO and a single SC injection of romiplostim. These results provide confidence in the predictive power of the scaled PK/PD model in humans.

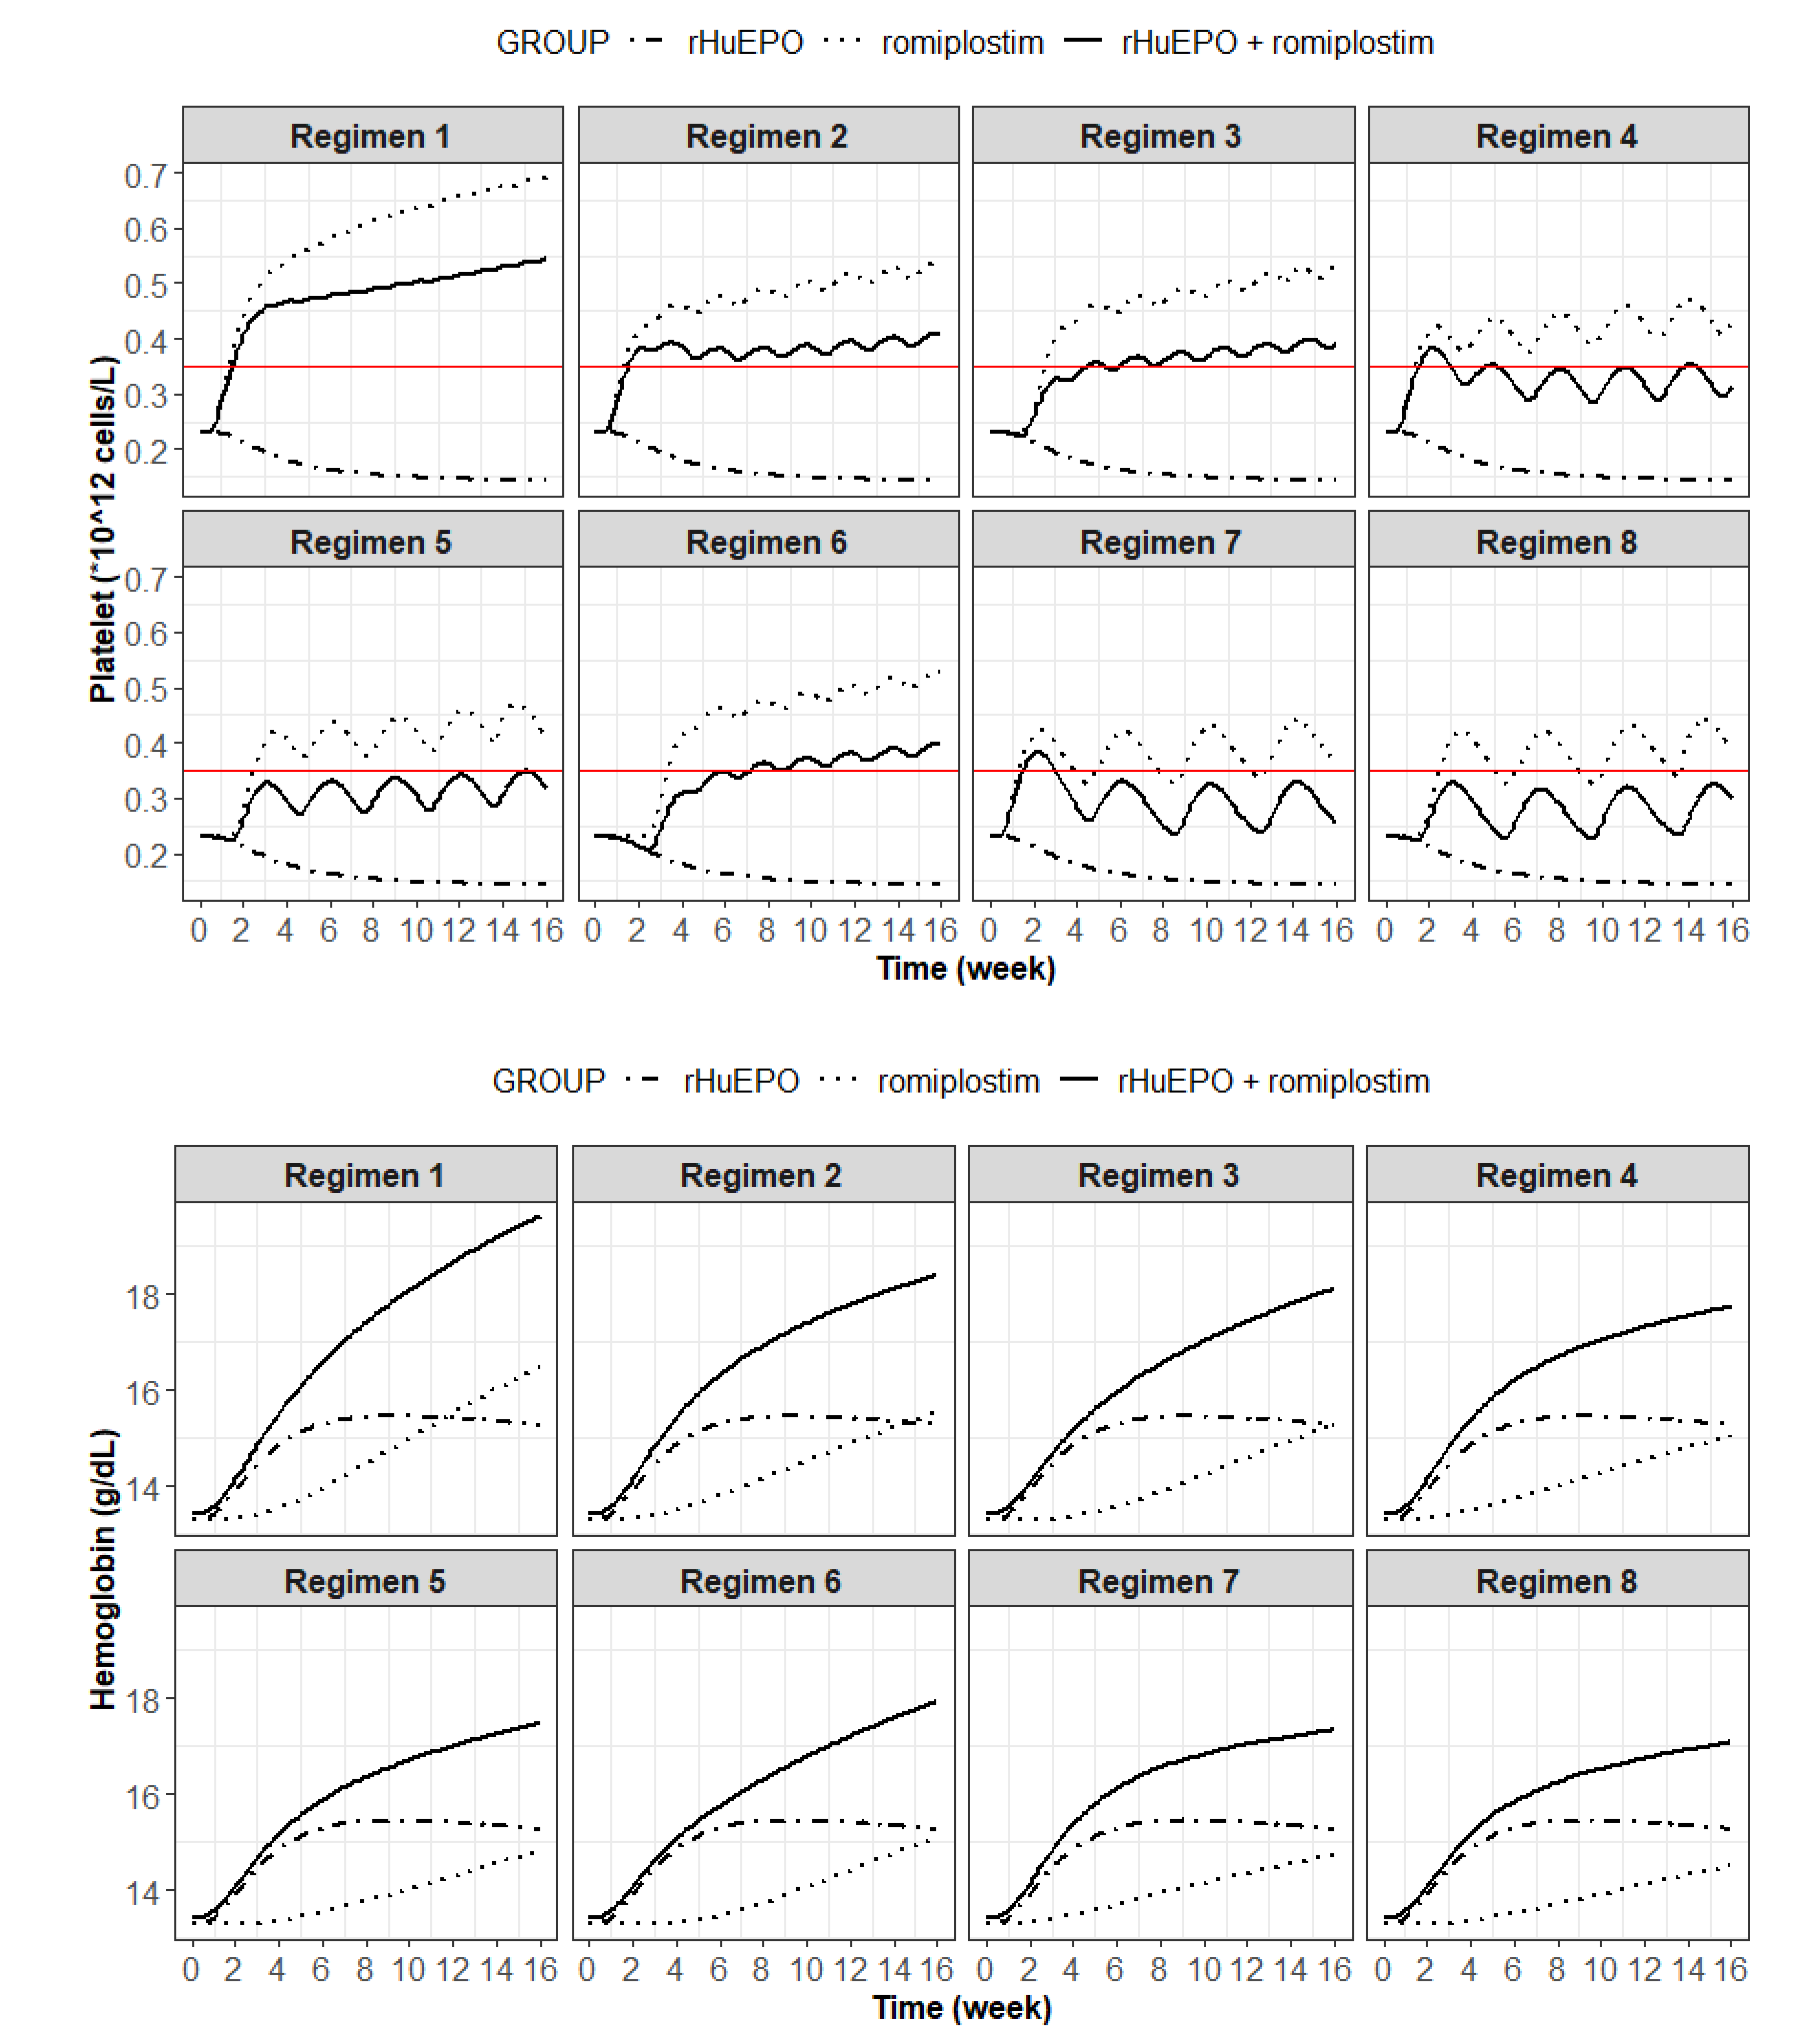
3.3. Prediction of an Optimal Combination Dosing Regimen in Humans

The simulated median Hgb and platelet concentrations under eight dosing regimens of the combination therapy are shown in Figure 4, and the comparison of the simulation results is presented in Table 2. The simulation results showed that the predicted mean Hgb concentration in the rHuEPO monotherapy groups (conventional anemia treatment) reached a peak value of 15.4 g/dL on day 64 and then decreased thereafter although rHuEPO was still being administered. This result suggested EPO hyporesponsiveness, consistent with a previous report [24]. When combined with romiplostim under different dosing regimens, the Hgb concentration in all combination treatment groups was further increased, which indicated that the combination therapy could correct EPO resistance. However, the platelet count exceeded the normal limit of 0.35 × 10¹²/L in some dosing regimens (regimens 1, 2, 3, 4, 6, and 7), which was considered unacceptable due to the risk of thrombocytosis. The platelet count was maintained within the normal range in regimens 5 and 8, leading to a recommendation of regimen 8 (EPO 50 IU/kg thrice weekly + romiplostim 1 μg/kg once every 4 weeks [Q4W] from the second week) (Figure 5) for patients, given the efficacy, compliance, and cost-effectiveness.

4. Discussion

Our previous studies in anemic CKD rats demonstrated that romiplostim in combination with rHuEPO has great potential to correct EPO resistance [13,14]. Moreover, a mechanism-based PK/PD model was developed, which successfully quantified the interaction between rHuEPO and romiplostim. However, there is a critical gap in translating experimental data into clinical practice. Interspecies allometric scaling is a useful tool for drug development and has been frequently used to predict human PK and PD parameters [15,16,18,34,35]. To predict the optimal combination dosing regimen in humans to support future clinical trials, allometric scaling based on animal data was performed in this study.
Both rHuEPO and romiplostim are marketed drugs with clinically proven efficacy and safety. Their PK parameters in humans are available and were employed to drive the PD effects directly (Table 1). However, these parameters were estimated using the target-mediated drug disposition model, which is different from our previously developed PK model for rHuEPO and romiplostim in rats. To scale the PD parameters more accurately, the compartmental PK model was adjusted to the Michaelis–Menten target-mediated drug disposition model, and the PD parameters were re-estimated. The proposed Michaelis–Menten-target-mediated drug disposition PK/PD model (Figure 1) captured both the PK and PD profiles of romiplostim and rHuEPO after monotherapy and combination therapy, and the re-estimated PD parameters were close to the previous estimation (Table S2) [13].
Next, allometric scaling was performed and validated based on the PD parameters above and the allometric equation between rats and humans (Figure 2). Although the observed human megakaryocyte lifespan TMP, platelet lifespan TPLT, reticulocyte lifespan TRET, and red blood cell lifespan TRBC values are available in the literature. It would be arbitrary to apply several kinds of human cell residence time to the model for translation directly. Instead, allometric scaling is to show that the fundamental assumption upon which these mechanism-based PK-PD models were built is preserved across different species. It is important to verify whether model parameters are meaningful across species [15]. Our model structure is similar to the previously reported structures that are based on human data [22,29]. So, it is necessary to prove that these parameters estimated from the same mechanism-based model structure are indeed scalable. Only by proving that this theory is correct can we use the same model structure established from animal data to predict human dosing regimen. The scaling of rHuEPO from rats to humans has been performed by others, which was applied in the present study [25]. The PD parameters of romiplostim, including the megakaryocyte lifespan TMP and platelet lifespan TPLT were scaled. The pharmacologic parameters, including the capacity (Smax) and sensitivity (SC50) of rHuEPO and romiplostim, did not follow allometric principles; these tend to be similar across species because of the receptor density and/or structural homology between species [15,25]. The scaled PD parameters were close to the physiological values in humans (Table 3), which proved that the established PK/PD model was valuable for cross-species extrapolation. The scaled models were externally validated using rHuEPO and romiplostim PD data from healthy subjects, and the results demonstrated the accuracy of the scaled PK/PD model in humans (Figure 3). According to the general allometric scaling concept, the exponent b in the allometric equation tends to be approximately 0.75 for clearance processes, 1.0 for organ sizes or physiological volumes, and 0.25 for physiological times or the duration of physiological events [15,36]. Therefore, the exponent of cell lifespan tends to be 0.25 according to this theory. However, this type of relationship works best for drugs eliminated by direct physical processes, such as renal excretion [37]. The experience with allometric scaling of macromolecule drugs is more limited compared with small molecules. Its application to drugs exhibiting nonlinear pharmacokinetics, such as target-mediated drug disposition (TMDD) systems may be different [38]. In our study, the scaling exponents are 0.1933 for TMP and 0.0988 for TPLT, which is close to but less than 0.25. This is consistent with the scaling results for erythropoietin on erythropoiesis, the exponents are 0.148 for TRBC and 0.081 for TRET, respectively. The exponents were less than 0.25, but their slopes were very similar to each other [25]. Although the underlying mechanism for this difference is unclear, it is generally considered that peptide and protein drugs also exhibit allometric relationships, owing to the relative species conservation of mechanisms that control the biodistribution and elimination of such compounds [15].
Model-based simulations were conducted to optimize the combination dosing regimen and thus guide future clinical trials. The results shown in Figure 4 indicate that intensive rHuEPO treatment alone could result in EPO resistance, consistent with previous studies [24]. The combination of rHuEPO with romiplostim led to a synergistic increase in the Hgb value. However, intensive administration of romiplostim resulted in a platelet count exceeding the normal range (0.35 × 10¹²/L), which increased the risk of thrombosis. The results of simulation with regimens 5 and 8 showed that the administration of romiplostim 1 μg/kg once every three weeks or 1 μg/kg once every 4 weeks from the second week was effective in correcting EPO resistance and maintaining the platelet count within a normal range simultaneously. Based on a balance between efficacy, compliance, and cost-effectiveness for patients, regimen 8 (rHuEPO 50 IU/kg thrice weekly + romiplostim 1 μg/kg once every 4 weeks from the second week) (Figure 5) is recommended as the starting dose. Moreover, as the current dosing regimen of romiplostim in immune thrombocytopenia patients is 1–10 μg/kg once weekly, this recommendation provides a huge safety margin for dose escalation during combination treatment to boost efficacy [39].
However, it should be noted that there are some deviances in the graphics conditional weighted residual (CWRES) vs. time in the initial time (Supplementary Figure S2). This may be due to the impact of the early release of reticulocytes into circulation with the stimulation of EPO [40]. Our model only described the major mechanisms controlling the production of reticulocytes and the pharmacological effects of rHuEPO on these processes. The inclusion of other processes would require additional data/parameters, which would increase the number of model parameters and subsequently impact their identifiability and precisions. So, only the major erythropoietic processes were considered in the present PK-PD model to avoid model overparameterization. Despite the limitation, the effect of EPO on the release of RETs is independent of its effect on erythroid precursor cells. These RETs tend to be destroyed and removed by the spleen through neocytolysis due to immaturity in cell membrane structure, which was considered to have less impact on the final hemoglobin production [41,42]. While our study mainly focused on the prediction of Hgb and platelet response, major mechanisms for the production of Hgb and platelet were included in this model. The predictions for Hgb and platelet were validated using the clinical PD data. We believe the model can be helpful for the dose selection of combination therapy.
There are no PK comparisons of romiplostim/rHuEPO between the disease population and healthy volunteers available in the literature at present to our knowledge. For PD parameters, the lifespan of red blood cells in the disease population (TRBC = 60–112 days) would be shorter than healthy volunteers (TRBC = 120 days) [43]. The shorter lifespan would not influence the results obtained here because the mechanisms of drugs’ action are independent of the cell lifespan. Currently, studies evaluating the allometric scaling of integrated PK/PD characteristics of protein drugs are relatively limited compared with small molecules. Our study may be useful for cases in which several macro-molecule drugs act on the same pharmacological process, as certain system-specific properties in the model can be shared between drugs [37].
Interestingly, there are two case reports on the combined usage of romiplostim and darbepoetin, a second-generation ESA with a longer half-life. In one case report, a patient with myelodysplastic syndrome was treated concomitantly with darbepoetin (500 μg once every three weeks for 3 months, followed by 500 μg once every two weeks for another 11 months, 300 μg once every three weeks for another 6 months, and 300 μg once every 4 weeks for another 4 months before stopping) and romiplostim (10 μg/kg once weekly for 9 months) [44]. The results of that case were consistent with our preclinical results, and romiplostim was suggested to stimulate the erythroid response in addition to the effects of darbepoetin and a reduced darbepoetin dosage. Meanwhile, the platelet count did not increase during the combined use of darbepoetin and romiplostim [44]. Because TPO-RAs have shown efficacy in this patient population [45], the observation by Prica and Buckstein supports the inhibitory role of darbepoetin on platelets in combination therapy. The other case report showed that the combination of romiplostim and darbepoetin was successfully used as supportive therapy for chemotherapy-associated anemia and thrombocytopenia during induction chemotherapy in a patient with acute lymphoblastic leukemia who wished to avoid blood transfusions due to their beliefs as a Jehovah’s Witness [46].
It should be noted that the actual dosing regimen needs to be adjusted according to the clinical situation. According to the drug label of epoetin, the recommended starting dose for adult patients with CKD is 50–100 U/kg thrice weekly IV or SC, and the IV route is recommended for patients on hemodialysis [47]. The model validation results (Figure 3) supported the similar efficacy of the SC dosing regimen, which could also be considered as a combination therapy in a future clinical trial. Moreover, the dose of rHuEPO should be adjusted (reduced by 25%) if the Hgb concentration rises rapidly (e.g., >1 g/dL over 2 weeks) to reduce rapid responses. When combined with romiplostim, increases in Hgb should be monitored, and the dose of rHuEPO should be adjusted if Hgb increases too rapidly (>1 g/dL over 2 weeks). Given the dose titration algorithm, the doses of TPO-RAs and ESAs might shift in the same direction during titration to inhibit platelet production, according to the mechanisms of action of the combination therapy.
This study has one limitation. Given the limited dataset included in the analysis, the lack of access to individual data, and the intersubject variability in platelets and RBCs, whether the relationship between response and combination therapy holds for other dosing regimens under different scenarios remains to be further examined. Nevertheless, the mechanistic nature of this target-mediated drug disposition-PK/PD model renders it a valuable tool for developing optimal dosing regimens in the clinic.
In summary, the use of interspecies allometric scaling, values of clinical drug-specific and physiological system-specific PK and PD parameters from the literature, and a PD simulation allowed for extrapolation of experimental data to humans with a reasonable degree of success. The established PK/PD model was able to be utilized to predict the PD responses of romiplostim and rHuEPO in both monotherapy and combination therapy in healthy subjects. These data enable a recommendation for an optimal a combination dosing regimen to treat EPO resistance and help to guide subsequent studies as a starting dose in a dosing-finding study for patients with erythropoietin-resistant anemia. Furthermore, different formulations and generations of ESAs, including the short-acting epoetin and long-acting darbepoetin, and TPO-RAs, such as eltrombopag and avatrombopag, are available. The established PK/PD model could help to facilitate the clinical development of different strategies involving combinations of other ESAs and TPO-Ras and can be used to select starting doses in the treatment of CKD anemia. Further evaluation is warranted.

Supplementary Materials

The following supporting information can be downloaded at: https://www.mdpi.com/article/10.3390/pharmaceutics15020344/s1, Figure S1: General goodness-of-fit of the final model for rHuEPO (A) and romiplostim (B). The top panels of (A) and (B) present the observed data vs. the population predictions (left) and individual predictions (right), respectively. The bottom panels of (A) and (B) present the conditional weighted residual (CWRES) vs. the time (left) and population predictions (right), respectively. The blue lines are the loess smooth lines. The gray diagonal (top panels) and horizontal (bottom panels) lines are the identity and zero lines, respectively. Figure S2. General goodness-of-fit of the final PD model, including platelets (PLT, top panels), reticulocytes (RETs, upper middle panels), RBC counts (lower middle panels), and Hgb concentration (bottom panels). Following the left-to-right order, the panels present the observed data vs. population predictions, observed data vs. individual predictions, conditional weighted residual (CWRES) vs. time, and CWRES vs. population predictions, respectively. The blue lines are the loess smooth lines. The gray diagonal and horizontal lines are the identity and zero lines, respectively. Table S1. Model estimates of the fixed- and random-effect PK parameters together with their relative standard errors. IIV = interindividual variability. Table S2. Model estimates of the fixed- and random-effect PD parameters together with their relative standard errors (RSEs).

Author Contributions

Conceptualization, X.F., W.K., D.L., R.S.M.W. and X.Y.; methodology, X.F., W.K., D.L., R.S.M.W. and X.Y.; validation, X.F. and X.Y.; formal analysis, X.F. and X.Y.; investigation, X.F. and X.Y.; data curation, X.F. and X.Y.; writing—original draft preparation, X.F. and X.Y.; writing—review and editing, X.F., W.K., D.L., R.S.M.W. and X.Y.; supervision, X.Y.; project administration, X.Y.; funding acquisition, X.Y. All authors have read and agreed to the published version of the manuscript.

Funding

This research was funded by Hong Kong Research Grants Council, Early Career Scheme, grant number 24103120.

Institutional Review Board Statement

Not applicable.

Informed Consent Statement

Not applicable.

Data Availability Statement

The data that support the findings of this study are available from the corresponding author upon reasonable request.

Acknowledgments

The authors would like to thank ZUO Zhong and TO Kin-wah for their helpful suggestions.

Conflicts of Interest

The authors declare no conflict of interest.

References

  1. Babitt, J.L.; Lin, H.Y. Mechanisms of anemia in CKD. J. Am. Soc. Nephrol. 2012, 23, 1631–1634. [Google Scholar] [CrossRef] [PubMed] [Green Version]
  2. Elliott, S. Erythropoiesis-stimulating agents. Cancer Treat. Res. 2011, 157, 55–74. [Google Scholar] [CrossRef] [PubMed]
  3. Gutti, U.; Pasupuleti, S.R.; Sahu, I.; Kotipalli, A.; Undi, R.B.; Kandi, R.; Venakata Saladi, R.G.; Gutti, R.K. Erythropoietin and thrombopoietin mimetics: Natural alternatives to erythrocyte and platelet disorders. Crit. Rev. Oncol. Hematol. 2016, 108, 175–186. [Google Scholar] [CrossRef] [PubMed]
  4. Fukuma, S.; Yamaguchi, T.; Hashimoto, S.; Nakai, S.; Iseki, K.; Tsubakihara, Y.; Fukuhara, S. Erythropoiesis-stimulating agent responsiveness and mortality in hemodialysis patients: Results from a cohort study from the dialysis registry in Japan. Am. J. Kidney Dis. 2012, 59, 108–116. [Google Scholar] [CrossRef]
  5. Zhang, Y.; Thamer, M.; Kaufman, J.S.; Cotter, D.J.; Hernán, M.A. High doses of epoetin do not lower mortality and cardiovascular risk among elderly hemodialysis patients with diabetes. Kidney Int. 2011, 80, 663–669. [Google Scholar] [CrossRef] [Green Version]
  6. Santos, P.R.; Melo, A.D.; Lima, M.M.; Negreiros, I.M.; Miranda, J.S.; Pontes, L.S.; Rabelo, G.M.; Viana, A.C.; Alexandrino, M.T.; Barros, F.A.; et al. Mortality risk in hemodialysis patients according to anemia control and erythropoietin dosing. Hemodial. Int. 2011, 15, 493–500. [Google Scholar] [CrossRef]
  7. Costa, E.; Rocha, S.; Rocha-Pereira, P.; Nascimento, H.; Castro, E.; Miranda, V.; Faria Mdo, S.; Loureiro, A.; Quintanilha, A.; Belo, L.; et al. Neutrophil activation and resistance to recombinant human erythropoietin therapy in hemodialysis patients. Am. J. Nephrol. 2008, 28, 935–940. [Google Scholar] [CrossRef] [Green Version]
  8. Icardi, A.; Paoletti, E.; De Nicola, L.; Mazzaferro, S.; Russo, R.; Cozzolino, M. Renal anaemia and EPO hyporesponsiveness associated with vitamin D deficiency: The potential role of inflammation. Nephrol Dial. Transplant. 2013, 28, 1672–1679. [Google Scholar] [CrossRef] [Green Version]
  9. Kilpatrick, R.D.; Critchlow, C.W.; Fishbane, S.; Besarab, A.; Stehman-Breen, C.; Krishnan, M.; Bradbury, B.D. Greater epoetin alfa responsiveness is associated with improved survival in hemodialysis patients. Clin. J. Am. Soc. Nephrol. 2008, 3, 1077–1083. [Google Scholar] [CrossRef] [Green Version]
  10. Kainz, A.; Mayer, B.; Kramar, R.; Oberbauer, R. Association of ESA hypo-responsiveness and haemoglobin variability with mortality in haemodialysis patients. Nephrol. Dial. Transplant. 2010, 25, 3701–3706. [Google Scholar] [CrossRef]
  11. Suttorp, M.M.; Hoekstra, T.; Rotmans, J.I.; Ott, I.; Mittelman, M.; Krediet, R.T.; Dekker, F.W. Erythropoiesis-stimulating agent resistance and mortality in hemodialysis and peritoneal dialysis patients. BMC Nephrol. 2013, 14, 200. [Google Scholar] [CrossRef] [PubMed] [Green Version]
  12. Yan, X.; Ait-Oudhia, S.; Krzyzanski, W. Erythropoietin-induced erythroid precursor pool depletion causes erythropoietin hyporesponsiveness. Pharm. Res. 2013, 30, 1026–1036. [Google Scholar] [CrossRef]
  13. Fan, X.; Krzyzanski, W.; Wong, R.S.M.; Yan, X. Fate determination role of erythropoietin and romiplostim in the lineage commitment of hematopoietic progenitors. J. Pharmacol. Exp. Ther. 2022, 382, 31–43. [Google Scholar] [CrossRef] [PubMed]
  14. Zou, H.; Xu, P.; Wong, R.S.M.; Yan, X. A Novel Combination Therapy of Erythropoietin and Thrombopoietin to Treat Erythropoietin-Resistance anemia. Pharm. Res. 2022, 39, 1249–1265. [Google Scholar] [CrossRef]
  15. Mager, D.E.; Woo, S.; Jusko, W.J. Scaling pharmacodynamics from in vitro and preclinical animal studies to humans. Drug Metab. Pharmacokinet 2009, 24, 16–24. [Google Scholar] [CrossRef] [Green Version]
  16. Van Wijk, R.C.; Hu, W.; Dijkema, S.M.; van den Berg, D.J.; Liu, J.; Bahi, R.; Verbeek, F.J.; Simonsson, U.S.H.; Spaink, H.P.; van der Graaf, P.H.; et al. Anti-tuberculosis effect of isoniazid scales accurately from zebrafish to humans. Br. J. Pharmacol. 2020, 177, 5518–5533. [Google Scholar] [CrossRef] [PubMed]
  17. Jolling, K.; Perez Ruixo, J.J.; Hemeryck, A.; Vermeulen, A.; Greway, T. Mixed-effects modelling of the interspecies pharmacokinetic scaling of pegylated human erythropoietin. Eur. J. Pharm. Sci. 2005, 24, 465–475. [Google Scholar] [CrossRef] [PubMed]
  18. Knibbe, C.A.; Zuideveld, K.P.; Aarts, L.P.; Kuks, P.F.; Danhof, M. Allometric relationships between the pharmacokinetics of propofol in rats, children and adults. Br. J. Clin. Pharmacol. 2005, 59, 705–711. [Google Scholar] [CrossRef] [Green Version]
  19. Boxenbaum, H. Interspecies scaling, allometry, physiological time, and the ground plan of pharmacokinetics. J. Pharmacokinet Biopharm. 1982, 10, 201–227. [Google Scholar] [CrossRef]
  20. Dedrick, R.L. Animal scale-up. J. Pharmacokinet Biopharm. 1973, 1, 435–461. [Google Scholar] [CrossRef]
  21. Yan, X.; Ruixo, J.J.P.; Krzyzanski, W. Dose Correction for a Michaelis-Menten Approximation of a Target-Mediated Drug Disposition Model with a Multiple Intravenous Dosing Regimens. AAPS J. 2020, 22, 30. [Google Scholar] [CrossRef] [PubMed]
  22. Wang, Y.M.; Krzyzanski, W.; Doshi, S.; Xiao, J.J.; Pérez-Ruixo, J.J.; Chow, A.T. Pharmacodynamics-mediated drug disposition (PDMDD) and precursor pool lifespan model for single dose of romiplostim in healthy subjects. AAPS J. 2010, 12, 729–740. [Google Scholar] [CrossRef] [PubMed] [Green Version]
  23. Krzyzanski, W.; Ramakrishnan, R.; Jusko, W.J. Basic pharmacodynamic models for agents that alter production of natural cells. J. Pharmacokinet Biopharm. 1999, 27, 467–489. [Google Scholar] [CrossRef]
  24. Yan, X.; Lowe, P.J.; Fink, M.; Berghout, A.; Balser, S.; Krzyzanski, W. Population pharmacokinetic and pharmacodynamic model-based comparability assessment of a recombinant human Epoetin Alfa and the Biosimilar HX575. J. Clin. Pharmacol. 2012, 52, 1624–1644. [Google Scholar] [CrossRef] [PubMed] [Green Version]
  25. Woo, S.; Jusko, W.J. Interspecies comparisons of pharmacokinetics and pharmacodynamics of recombinant human erythropoietin. Drug Metab. Dispos. 2007, 35, 1672–1678. [Google Scholar] [CrossRef] [PubMed]
  26. Krzyzanski, W.; Sutjandra, L.; Perez-Ruixo, J.J.; Sloey, B.; Chow, A.T.; Wang, Y.M. Pharmacokinetic and pharmacodynamic modeling of romiplostim in animals. Pharm. Res. 2013, 30, 655–669. [Google Scholar] [CrossRef]
  27. Corrons, J.L.V.; Casafont, L.B.; Frasnedo, E.F. Concise review: How do red blood cells born, live, and die? Ann. Hematol. 2021, 100, 2425–2433. [Google Scholar] [CrossRef]
  28. Gremmel, T.; Frelinger, A.L., 3rd; Michelson, A.D. Platelet Physiology. Semin. Thromb. Hemost. 2016, 42, 191–204. [Google Scholar] [CrossRef] [Green Version]
  29. Krzyzanski, W.; Jusko, W.J.; Wacholtz, M.C.; Minton, N.; Cheung, W.K. Pharmacokinetic and pharmacodynamic modeling of recombinant human erythropoietin after multiple subcutaneous doses in healthy subjects. Eur. J. Pharm. Sci. 2005, 26, 295–306. [Google Scholar] [CrossRef]
  30. Ramakrishnan, R.; Cheung, W.K.; Wacholtz, M.C.; Minton, N.; Jusko, W.J. Pharmacokinetic and pharmacodynamic modeling of recombinant human erythropoietin after single and multiple doses in healthy volunteers. J. Clin. Pharmacol. 2004, 44, 991–1002. [Google Scholar] [CrossRef]
  31. Ait-Oudhia, S.; Scherrmann, J.M.; Krzyzanski, W. Simultaneous pharmacokinetics/pharmacodynamics modeling of recombinant human erythropoietin upon multiple.e intravenous dosing in rats. J. Pharmacol. Exp. Ther. 2010, 334, 897–910. [Google Scholar] [CrossRef] [PubMed] [Green Version]
  32. Pérez-Ruixo, J.J.; Krzyzanski, W.; Hing, J. Pharmacodynamic analysis of recombinant human erythropoietin effect on reticulocyte production rate and age distribution in healthy subjects. Clin. Pharmacokinet 2008, 47, 399–415. [Google Scholar] [CrossRef] [PubMed] [Green Version]
  33. Harker, L.A.; Roskos, L.K.; Marzec, U.M.; Carter, R.A.; Cherry, J.K.; Sundell, B.; Cheung, E.N.; Terry, D.; Sheridan, W. Effects of megakaryocyte growth and development factor on platelet production, platelet life span, and platelet function in healthy human volunteers. Blood 2000, 95, 2514–2522. [Google Scholar] [CrossRef] [PubMed]
  34. Chiou, W.L.; Robbie, G.; Chung, S.M.; Wu, T.C.; Ma, C. Correlation of plasma clearance of 54 extensively metabolized drugs between humans and rats: Mean allometric coefficient of 0.66. Pharm. Res. 1998, 15, 1474–1479. [Google Scholar] [CrossRef]
  35. Stevens, J.; Ploeger, B.A.; Hammarlund-Udenaes, M.; Osswald, G.; van der Graaf, P.H.; Danhof, M.; de Lange, E.C. Mechanism-based PK-PD model for the prolactin biological system response following an acute dopamine inhibition challenge: Quantitative extrapolation to humans. J. Pharm. Pharm. 2012, 39, 463–477. [Google Scholar] [CrossRef]
  36. West, G.B.; Brown, J.H.; Enquist, B.J. A general model for the origin of allometric scaling laws in biology. Science 1997, 276, 122–126. [Google Scholar] [CrossRef]
  37. Kagan, L.; Abraham, A.K.; Harrold, J.M.; Mager, D.E. Interspecies scaling of receptor-mediated pharmacokinetics and pharmacodynamics of type I interferons. Pharm. Res. 2010, 27, 920–932. [Google Scholar] [CrossRef]
  38. Huh, Y.; Smith, D.E.; Feng, M.R. Interspecies scaling and prediction of human clearance: Comparison of small- and macro-molecule drugs. Xenobiotica 2011, 41, 972–987. [Google Scholar] [CrossRef]
  39. Bussel, J.B.; Soff, G.; Balduzzi, A.; Cooper, N.; Lawrence, T.; Semple, J.W. A Review of Romiplostim Mechanism of Action and Clinical Applicability. Drug Des. Devel. Ther. 2021, 15, 2243–2268. [Google Scholar] [CrossRef]
  40. Major, A.; Bauer, C.; Breymann, C.; Huch, A.; Huch, R. rh-Erythropoietin stimulates immature reticulocyte release in man. Br. J. Haematol. 1994, 87, 605–608. [Google Scholar] [CrossRef]
  41. Risso, A.; Ciana, A.; Achilli, C.; Antonutto, G.; Minetti, G. Neocytolysis: None, one or many? A reappraisal and future perspectives. Front. Physiol. 2014, 5, 54. [Google Scholar] [CrossRef] [Green Version]
  42. Wiczling, P.; Krzyzanski, W.; Zychlińska, N.; Lewandowski, K.; Kaliszan, R. The quantification of reticulocyte maturation and neocytolysis in normal and erythropoietin stimulated rats. Biopharm. Drug Dispos. 2014, 35, 330–340. [Google Scholar] [CrossRef]
  43. Belurkar, S.; Shastry, I. The spectrum of red blood cell parameters in chronic kidney disease: A study of 300 cases. J. Appl. Hematol. 2019, 10, 61. [Google Scholar] [CrossRef]
  44. Prica, A.; Buckstein, R. Myelodysplastic syndrome.e.e.e successfully treated with adalimumab. J. Clin. Oncol. 2015, 33, e4–e6. [Google Scholar] [CrossRef]
  45. Capecchi, M.; Serpenti, F.; Giannotta, J.; Pettine, L.; Reda, G.; Martinelli, I.; Artoni, A.; Barcellini, W.; Fattizzo, B. Off-Label Use of Thrombopoietin Receptor Agonists: Case Series and Review of the Literature. Front. Oncol. 2021, 11, 680411. [Google Scholar] [CrossRef]
  46. Arora, N.; Gupta, A.; Li, H.C.; Sadeghi, N. Use of platelet and erythroid growth factors during induction chemotherapy for acute lymphoblastic leukaemia in a Jehovah’s Witness. BMJ Case Rep. 2018, 11, e226497. [Google Scholar] [CrossRef]
  47. KDOQI Clinical Practice Guideline and Clinical Practice Recommendations for anemia in chronic kidney disease: 2007 update of hemoglobin target. Am. J. Kidney Dis. 2007, 50, 471–530. [CrossRef]
Figure 1. Schematic diagrams of the proposed PK/PD model of the effects of romiplostim and rHuEPO on red blood cells and platelet production. The open rectangle indicates the stimulatory effects of romiplostim (black) and rHuEPO (red). The solid rectangle indicates the inhibitory effect of rHuEPO. DEPE and DEPR are the absorption compartments for rHuEPO and romiplostim, respectively. ATE and ATR are the peripheral compartments for rHuEPO and romiplostim, respectively. CE and CR are the central compartments for rHuEPO and romiplostim, respectively. KAE and KARM are the absorption rates of rHuEPO and romiplostim, respectively; FE and FRM are the bioavailabilities of rHuEPO and romiplostim, respectively; CLEPO and CLRM are the linear clearances of rHuEPO and romiplostim from the central compartment, respectively. VmaxE and KmE denote the maximum elimination rate and Michaelis constant of rHuEPO, respectively; VmaxR and KmR denote the maximum elimination rate and Michaelis constant of romiplostim, respectively, which were used to describe Michaelis–Menten saturable kinetics; and KCPE and KPCE are the intercompartmental rate constants of rHuEPO. KCPR and KPCR are the intercompartmental rate constants of romiplostim. SC = subcutaneous, IV = intravenous, TEP represents the average time required for precursors to develop into the next cell population. TRET and TRBC represent the mean residence time for reticulocytes (RETs) and mature red blood cells (RBCs), respectively. SmaxEPO1, SmaxRM1, and SmaxRM2 are the maximum stimulatory effect of rHuEPO and romiplostim, respectively. SC50 and IC50 = drug concentrations that induce half-maximum effect; Imax = maximum inhibitory effect. The series of n = 10 aging compartments (MKi, i = 1, …, n) denotes the MK precursor cells, with the first-order transition rates n/TMP; PLTi (i = 1, …, n) represents the platelets with the transition rates n/TPLT. BFUE = burst forming unit-erythroid cells, CFUE = colony-forming unit-erythroid cells, NOR = normoblasts. Kin1 and Kin2 are zero-order rate constants for producing MEP and MK1, respectively. MEPs proliferate to erythroid and MK lineages according to the first-order rate constant KE and KM, respectively.
Pharmaceutics 15 00344 g001
Figure 2. Allometric relationship of the PD parameters TMP (left panel) and TPLT (right panel) from rats to humans. A good correlation between body weight and the mean lifespans of megakaryocytes and platelets was observed (R2 > 0.8). The values of the parameters were obtained from the literature [22,26].
Pharmaceutics 15 00344 g002
Figure 3. PK/PD model predicted (A) platelets following a single dose of romiplostim 1 or 2 μg/kg SC and hemoglobin following IV dose of rHuEPO 100 IU/kg thrice weekly (TIW) (B), SC dose of rHuEPO 100 IU/kg TIW (C), SC dose of rHuEPO 150 IU/kg TIW (D), SC dose of rHuEPO 600 IU/kg once weekly (QW) (E), and SC dose of rHuEPO 60,000 IU QW (F) for 4 weeks in healthy subjects. Symbols represent observed platelet and hemoglobin profiles following romiplostim or rHuEPO treatments digitized from previous reports [22,24,29,30]. The lines represent PK/PD model-predicted platelet profiles (A) or hemoglobin profiles (BF) in blood. The shaded area is limited by the 20th and 80th percentiles of the 200 simulated model predictions.
Pharmaceutics 15 00344 g003
Figure 4. PK/PD model-predicted platelet (upper) and hemoglobin (bottom) profiles following the different dosing regimens of rHuEPO and romiplostim combination therapy in healthy subjects. The dotted, solid, and two-dash lines are the PD profiles of the rHuEPO monotherapy, rHuEPO + romiplostim combination therapy, and romiplostim monotherapy, respectively. The horizontal red line is the threshold for platelet (0.35 × 10¹² cell/L).
Pharmaceutics 15 00344 g004
Figure 5. PK/PD model-predicted platelet (left) and hemoglobin (right) following the recommended dosing regimen 8 (rHuEPO 50 IU/kg thrice weekly + romiplostim 1 μg/kg once every four weeks from the second week) of rHuEPO and romiplostim combination therapy in healthy subjects. The green solid line is the PD profile of the combination therapy, whereas the red dotted line and the blue two-dash line are the corresponding rHuEPO and romiplostim monotherapy PD profiles, respectively. The arrows represent the dosing events of rHuEPO (red) and romiplostim (black).
Pharmaceutics 15 00344 g005
Table 1. PK parameters of rHuEPO and romiplostim in humans obtained from the literature [21,22,24].
Parameter (Unit)DescriptionValueReferences
CLE (L/h)Clearance of rHuEPO0.379[21,24]
KAE (1/h)Absorption rate of rHuEPO0.0269
FEBioavailability of rHuEPO0.513
V2E (L)Volume of distribution of the central compartment of rHuEPO3.25
V3E (L)Volume of distribution of the peripheral compartment of rHuEPO1.64
QE (L/h)Tissue distribution clearance of rHuEPO0.0993
RTOT (IU/L)Baseline total receptor154.7
KME (IU/L)Michaelis constant of rHuEPO48.1
KINTE (1/h)Internalization rate constant of rHuEPO0.171
KDEGE (1/h)Degradation rate constant0.392
CLR (L/h)Clearance of romiplostim0.183[22]
V2R (L)Volume of distribution of the central compartment of romiplostim4.781
KCPR (1/h)Intercompartment rate constant of romiplostim0.0806
KPCR (1/h)Intercompartment rate constant of romiplostim0.0148
KARM (1/h)Absorption rate of romiplostim0.0254
FRMBioavailability of romiplostim0.499
KMR (ng/mL)Michaelis constant of romiplostim0.131
ξR (fg/platelet)Total c-Mpl receptor concentration0.0215
KINTR (1/h)Internalization rate constant of romiplostim0.173
Table 2. Model-based prediction summary in the combination therapy group. The dosing regimen for rHuEPO is 50 IU/kg thrice weekly IV for 16 weeks (102 days) and that of romiplostim is 1 μg/kg SC according to the package insert. The criterion for the prediction results is a platelet range within 0.15–0.35 × 10¹²/L compared with healthy individuals. QW = once weekly, Q2W = once every two weeks, Q3W = once every three weeks, Q4W = once every four weeks.
Regimen NumberDosing RegimenResultsComments
1Romiplostim QW 1 μg/kg for 16 weeksPlatelet count exceeds 0.35 × 10¹²/L on day 11Unacceptable
2Romiplostim 1 μg/kg Q2W from the first week (weeks 1, 3, 5, 7, 9, 11, 13, 15)Platelet count exceeds 0.35 × 10¹²/L on day 11Unacceptable
3Romiplostim 1μg/kg Q2W from the second week (weeks 2, 4, 6, 8, 10, 12, 14, 16)Platelet count exceeds 0.35 × 10¹²/L on day 31Unacceptable
4Romiplostim 1 μg/kg Q3W from the first week (weeks 1, 4, 7, 10, 13, 16)Platelet count exceeds 0.35 × 10¹²/L on day 11Unacceptable
5Romiplostim 1 μg/kg Q3W from the second week (weeks 2, 5, 8, 11, 14)Platelet count will not exceed 0.35 × 10¹²/LAcceptable
6Romiplostim 1 μg/kg Q2W from the third week (weeks 3, 5, 7, 9, 11, 13, 15)Platelet count exceeds 0.35 × 10¹²/L on day 50Unacceptable
7Romiplostim 1 μg/kg Q4W from the first week (weeks 1, 5, 9, 13)Platelet count exceeds 0.35 × 10¹²/L on day 11Unacceptable
8Romiplostim 1 μg/kg Q4W from the second week (weeks 2, 6, 10, 14)Platelet count will not exceed 0.35 × 10¹²/LAcceptable
(Recommended)
Table 3. Estimated PD parameters in healthy rats, scaled PD parameters in healthy subjects using the allometric equation, and observed PD parameters in healthy subjects from the literature [14,22,24,26,27,28,29,32,33].
ParameterUnitEstimated Value
(Rat)
Scaled Value
(Humans)
The Observed Value in Humans
TMPh47.8 [26]137.1142 [22]
TPLTday6.17 [26]10.68–12 [22,33]
PLT0×1012 cells/L0.869 [26]Fixed to human value0.23 [22,28]
TRETh20 [14]44.857.3 [24,32]
TRBCday60.8 [14]119.6120 [29]
RBC0×1012 cells/L7.38 [14]Fixed to human value4.4 [24,27]
Table 4. PD parameters in humans for the scaled model.
ParameterParameter ExplanationUnitValue
TMPMean lifespan of megakaryocyte cellsh137.1 (scaled)
TPLTMean lifespan of plateletsh254.4 (scaled)
PLT0Baseline platelets in blood×1012 cells/L0.23 (fixed to human value)
TRBCMean residence time for mature RBCsday119.6 (scaled)
TRETMean residence time for RETsh44.8 (scaled)
RBC0Baseline RBCs concentration×1012 cells/L4.4 (fixed to human value)
KEFirst-order rate constant of MEPs differentiate into BFU-E×10−4/h6.84 (not scaled)
KMFirst-order rate constant of MEPs differentiate into MK1×10−4/h1.18 (not scaled)
SmaxRM1Maximal stimulus of romiplostim on MEPsDimensionless1.67 (not scaled)
SmaxRM2Maximal stimulus of romiplostim on MK-committed pathwayDimensionless27.8 (not scaled)
SmaxEPO1Maximal stimulus of rHuEPO on MEPsDimensionless11.3 (not scaled)
SC50RMThe concentrations of romiplostim that induce a half-maximum effectng/mL11.9 (not scaled)
SC50EPOThe concentrations of rHuEPO that induce a half-maximum effectmIU/mL46.9 (not scaled)
ImaxEPOMaximal inhibition of rHuEPO on RETs aging ratesDimensionless0.422 (not scaled)
IC50EPOThe concentration of rHuEPO that induces half-maximum inhibitionmIU/mL5.59 (not scaled)
MCHMean corpuscular hemoglobinpg/cell30.2 (fixed to human value)
Disclaimer/Publisher’s Note: The statements, opinions and data contained in all publications are solely those of the individual author(s) and contributor(s) and not of MDPI and/or the editor(s). MDPI and/or the editor(s) disclaim responsibility for any injury to people or property resulting from any ideas, methods, instructions or products referred to in the content.

