
Resveratrol Inhibited ADAM10 Mediated CXCL16-Cleavage and T-Cells Recruitment to Pancreatic β-Cells in Type 1 Diabetes Mellitus in Mice

 ,
,  and
and
Abstract
:
1. Introduction
2. Materials and Methods
2.1. Work Design
2.2. Tissue Samples and Serum Collection
2.3. Pancreatic Islet Isolation
2.4. Estimation of Blood Glucose, Insulin, WBC Count, and Body Weight Change
2.5. Serum NO Estimation
2.6. Immunofluorescence Analysis
2.7. Immunohistochemistry of Pancreatic Tissue Sections
2.8. Western Blot Analyses
2.9. Kits, Chemicals, and Antibodies
2.10. Statistical Analysis
3. Results
3.1. Effect of RES on Fasting Blood Glucose, Serum Insulin and Body Weight
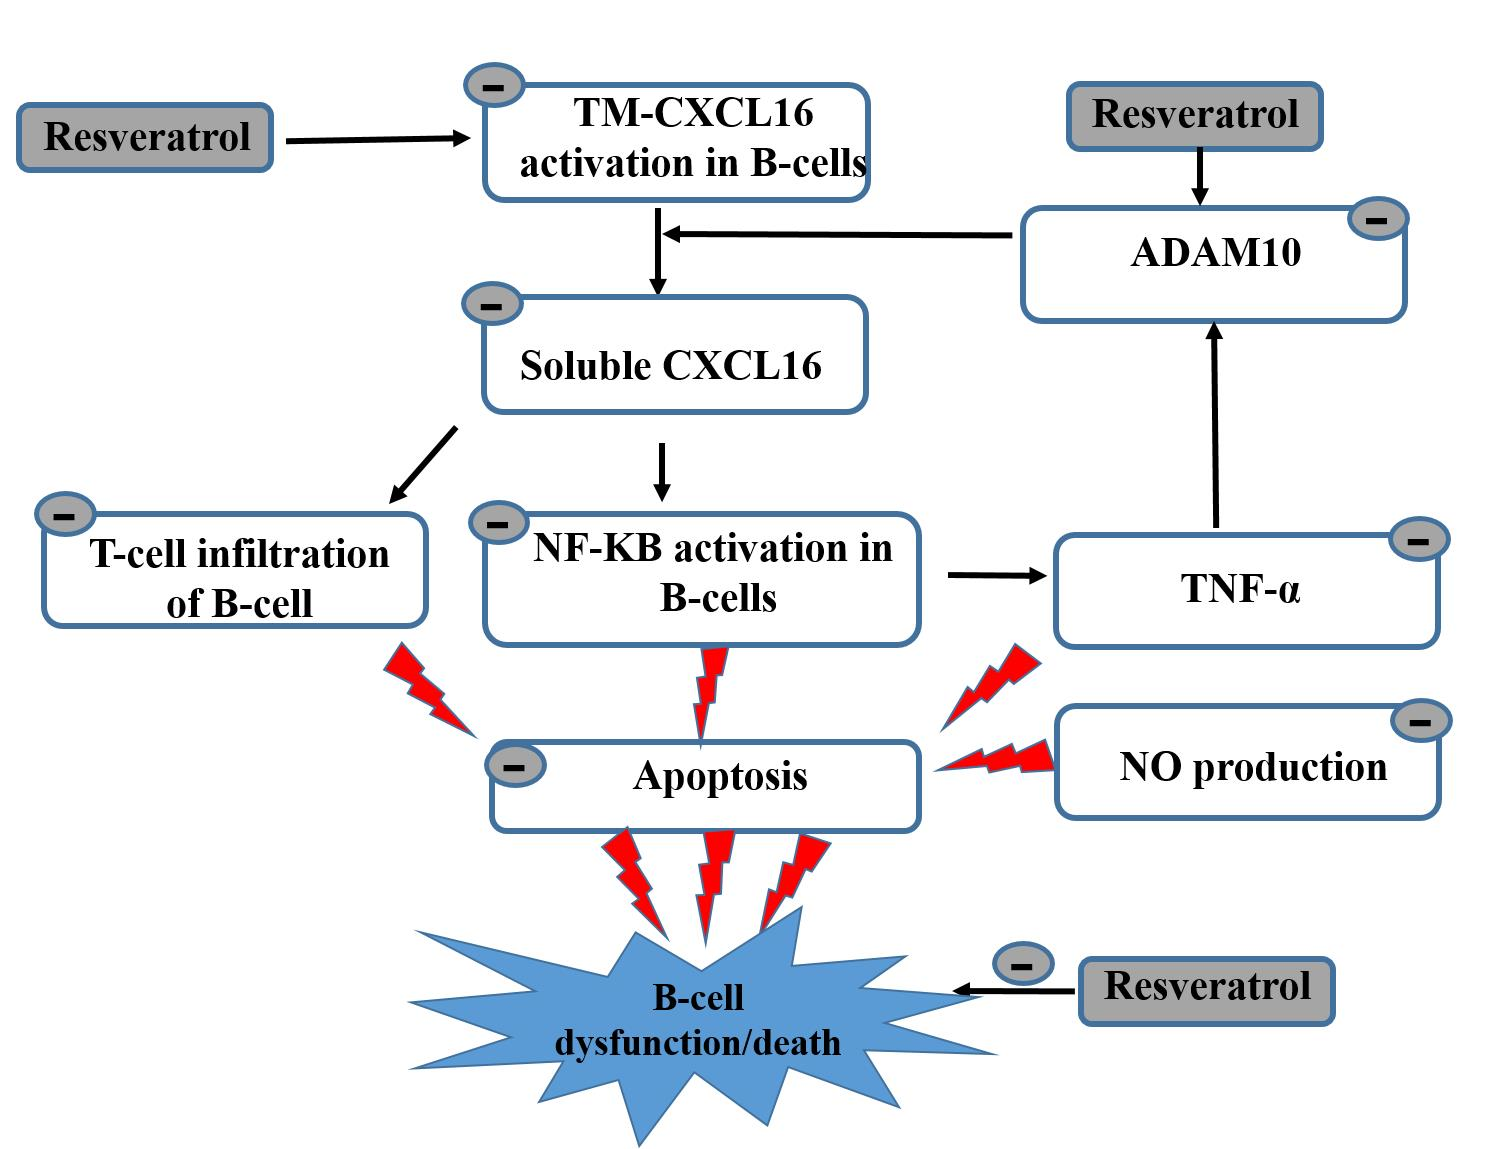
3.2. Effect of RES with or without STZ on WBCs, NO or TNF-α
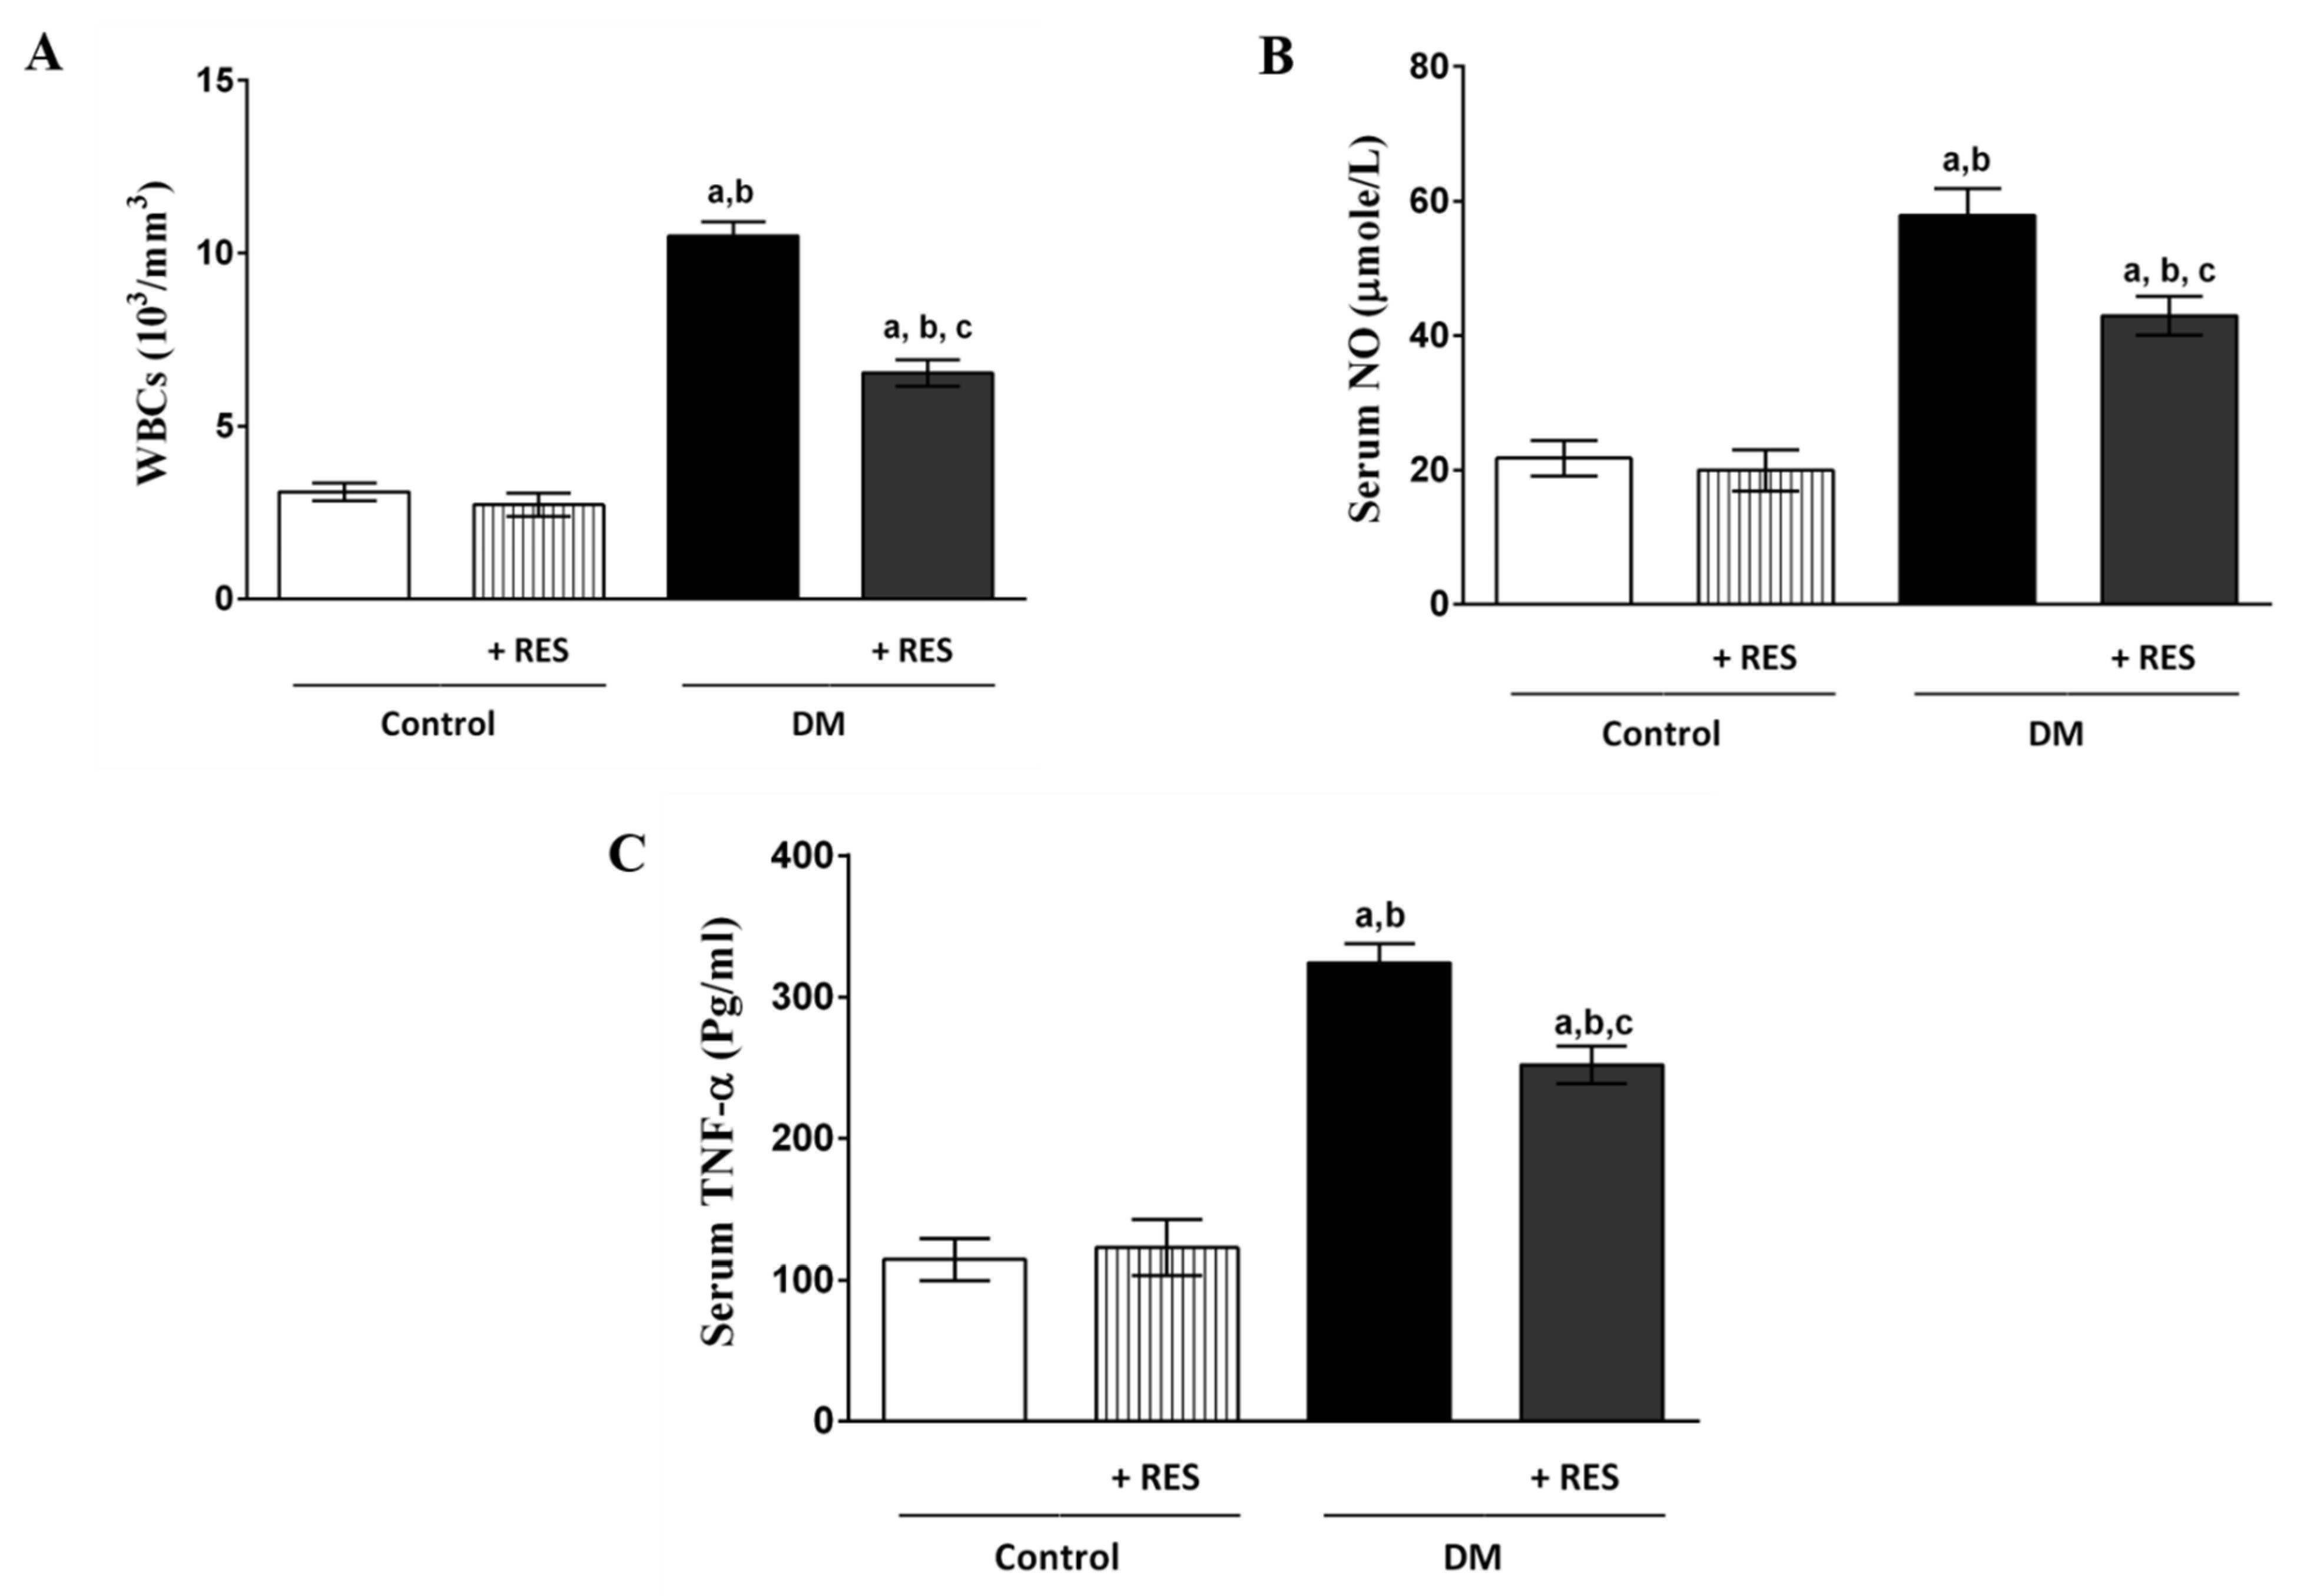
3.3. Effect of RES on STZ-Induced CXCL16 Pancreatic Expression
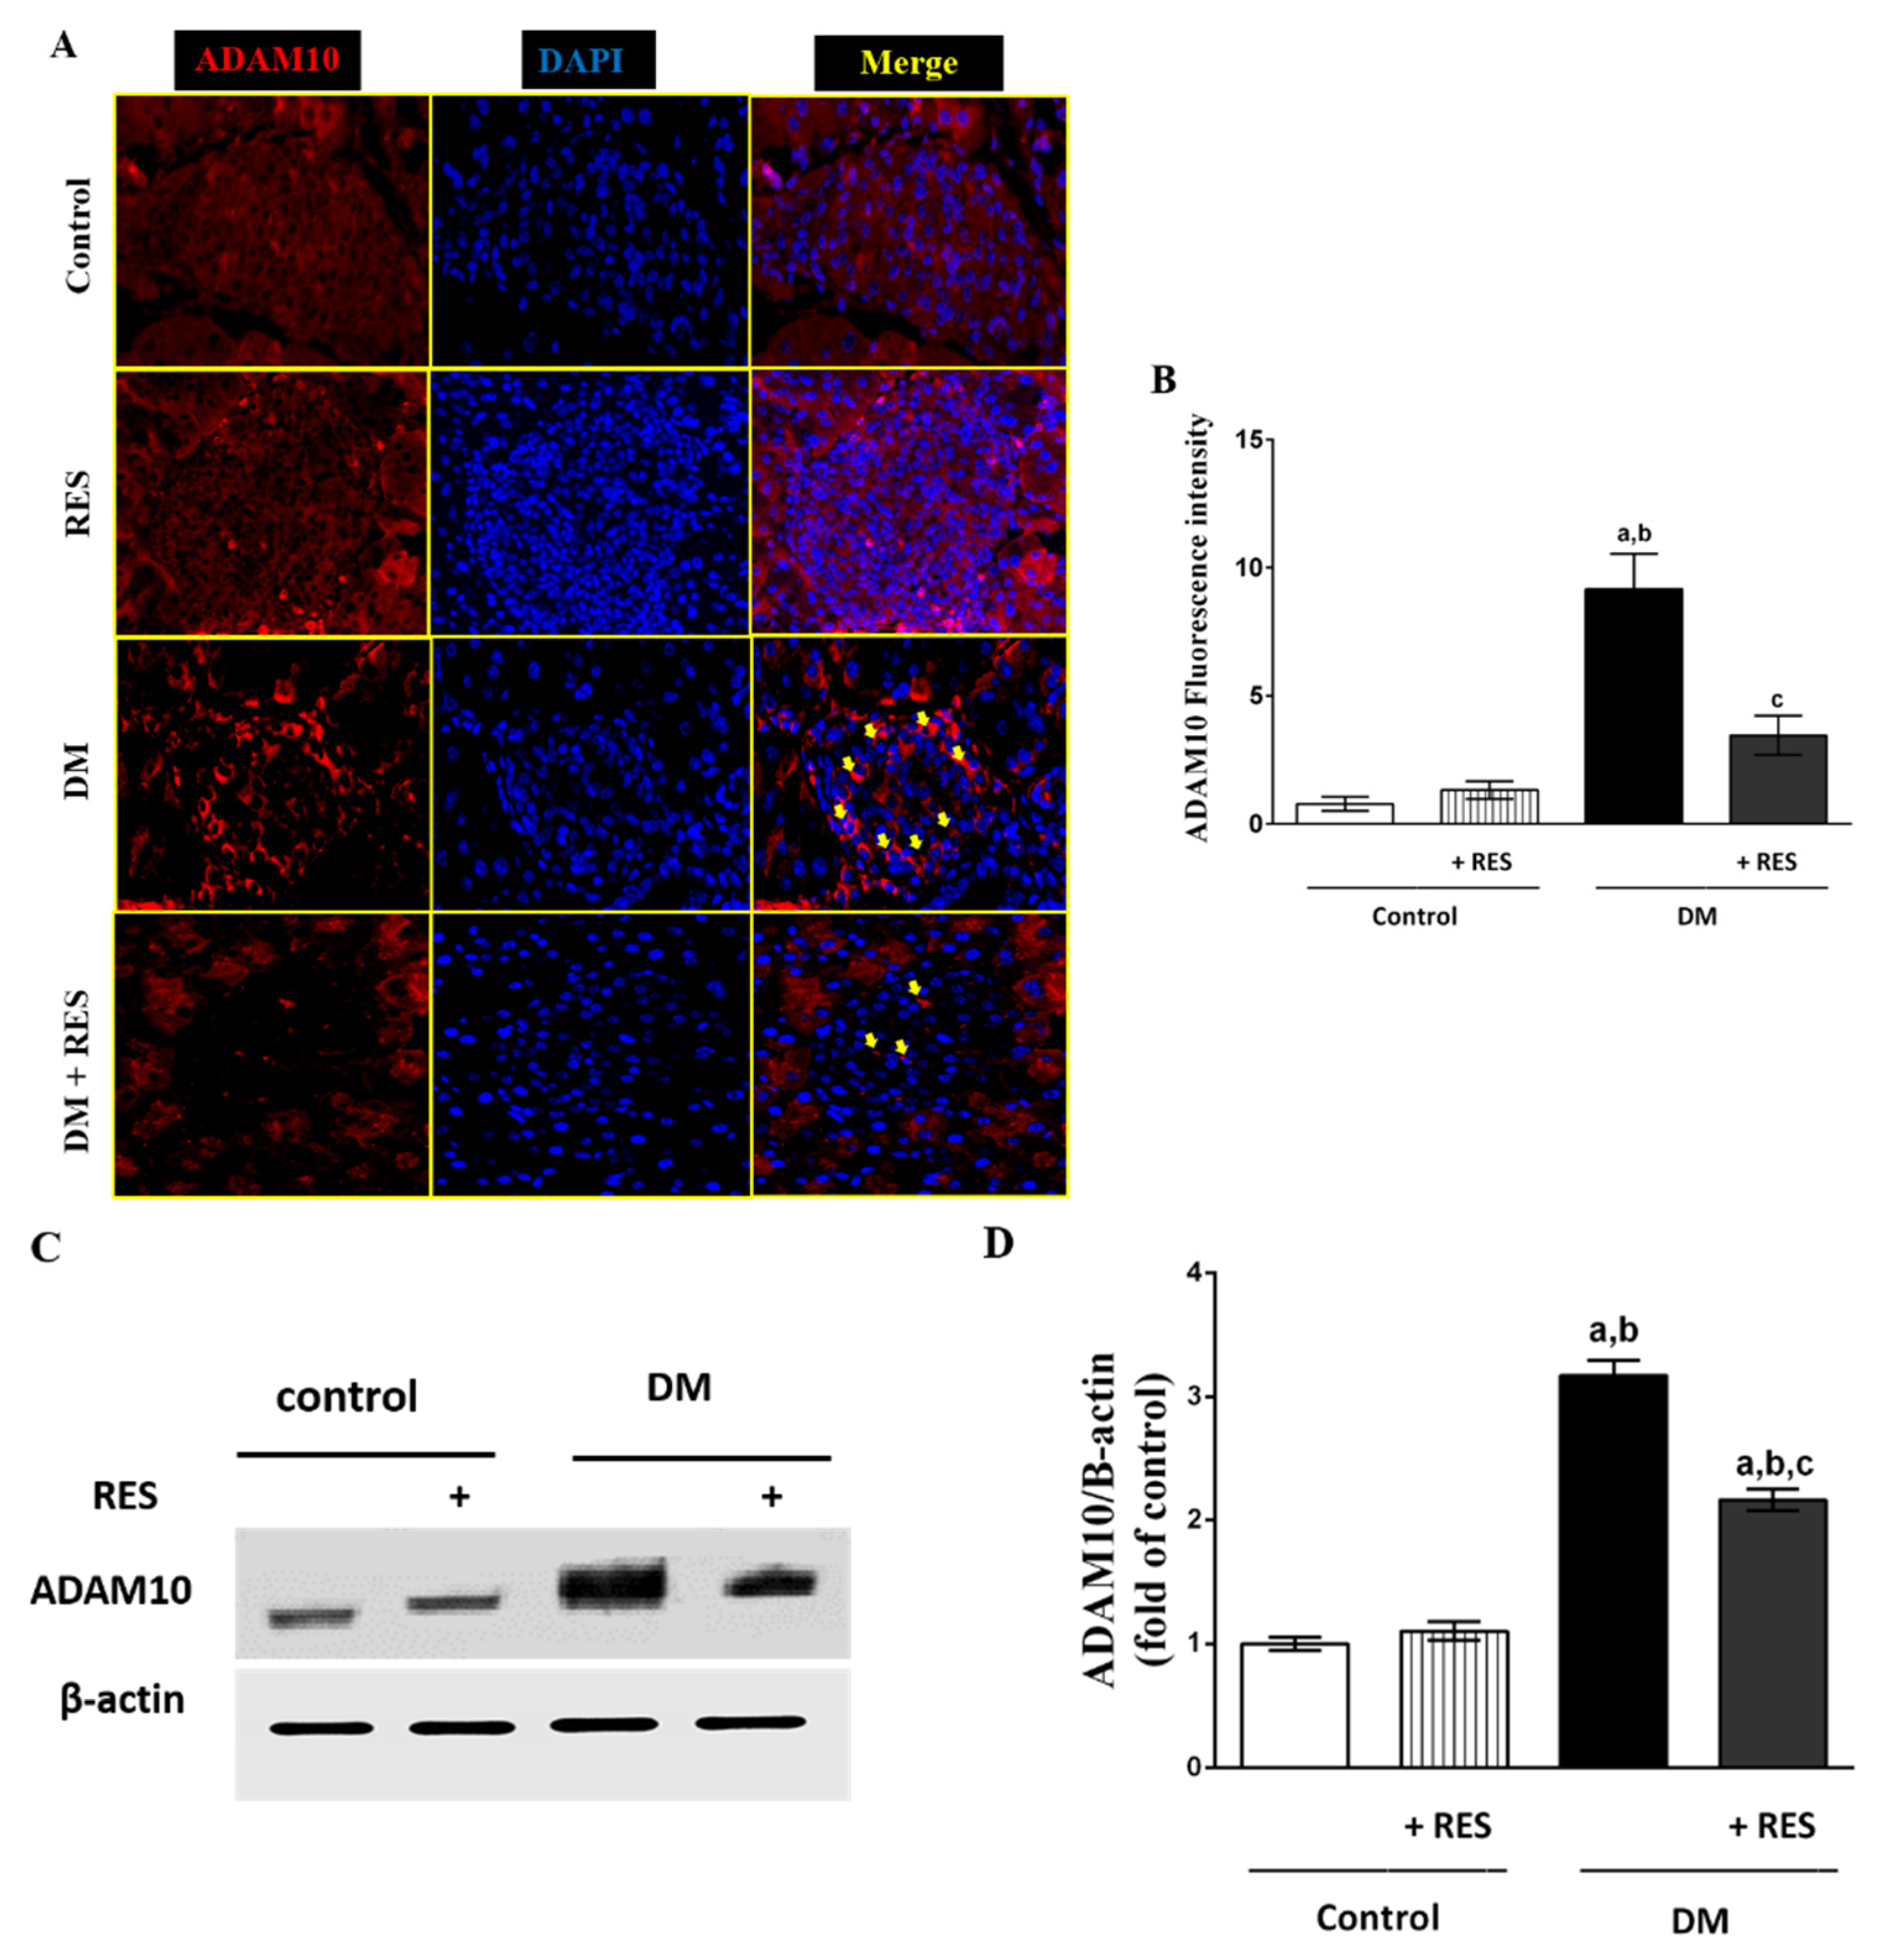
3.4. Effect of RES on STZ-Induced Pancreatic ADAM10 Expression
3.5. Expression of NF-κB Protein in the Islets of Pancreas in RES-Injected Mice with or without STZ
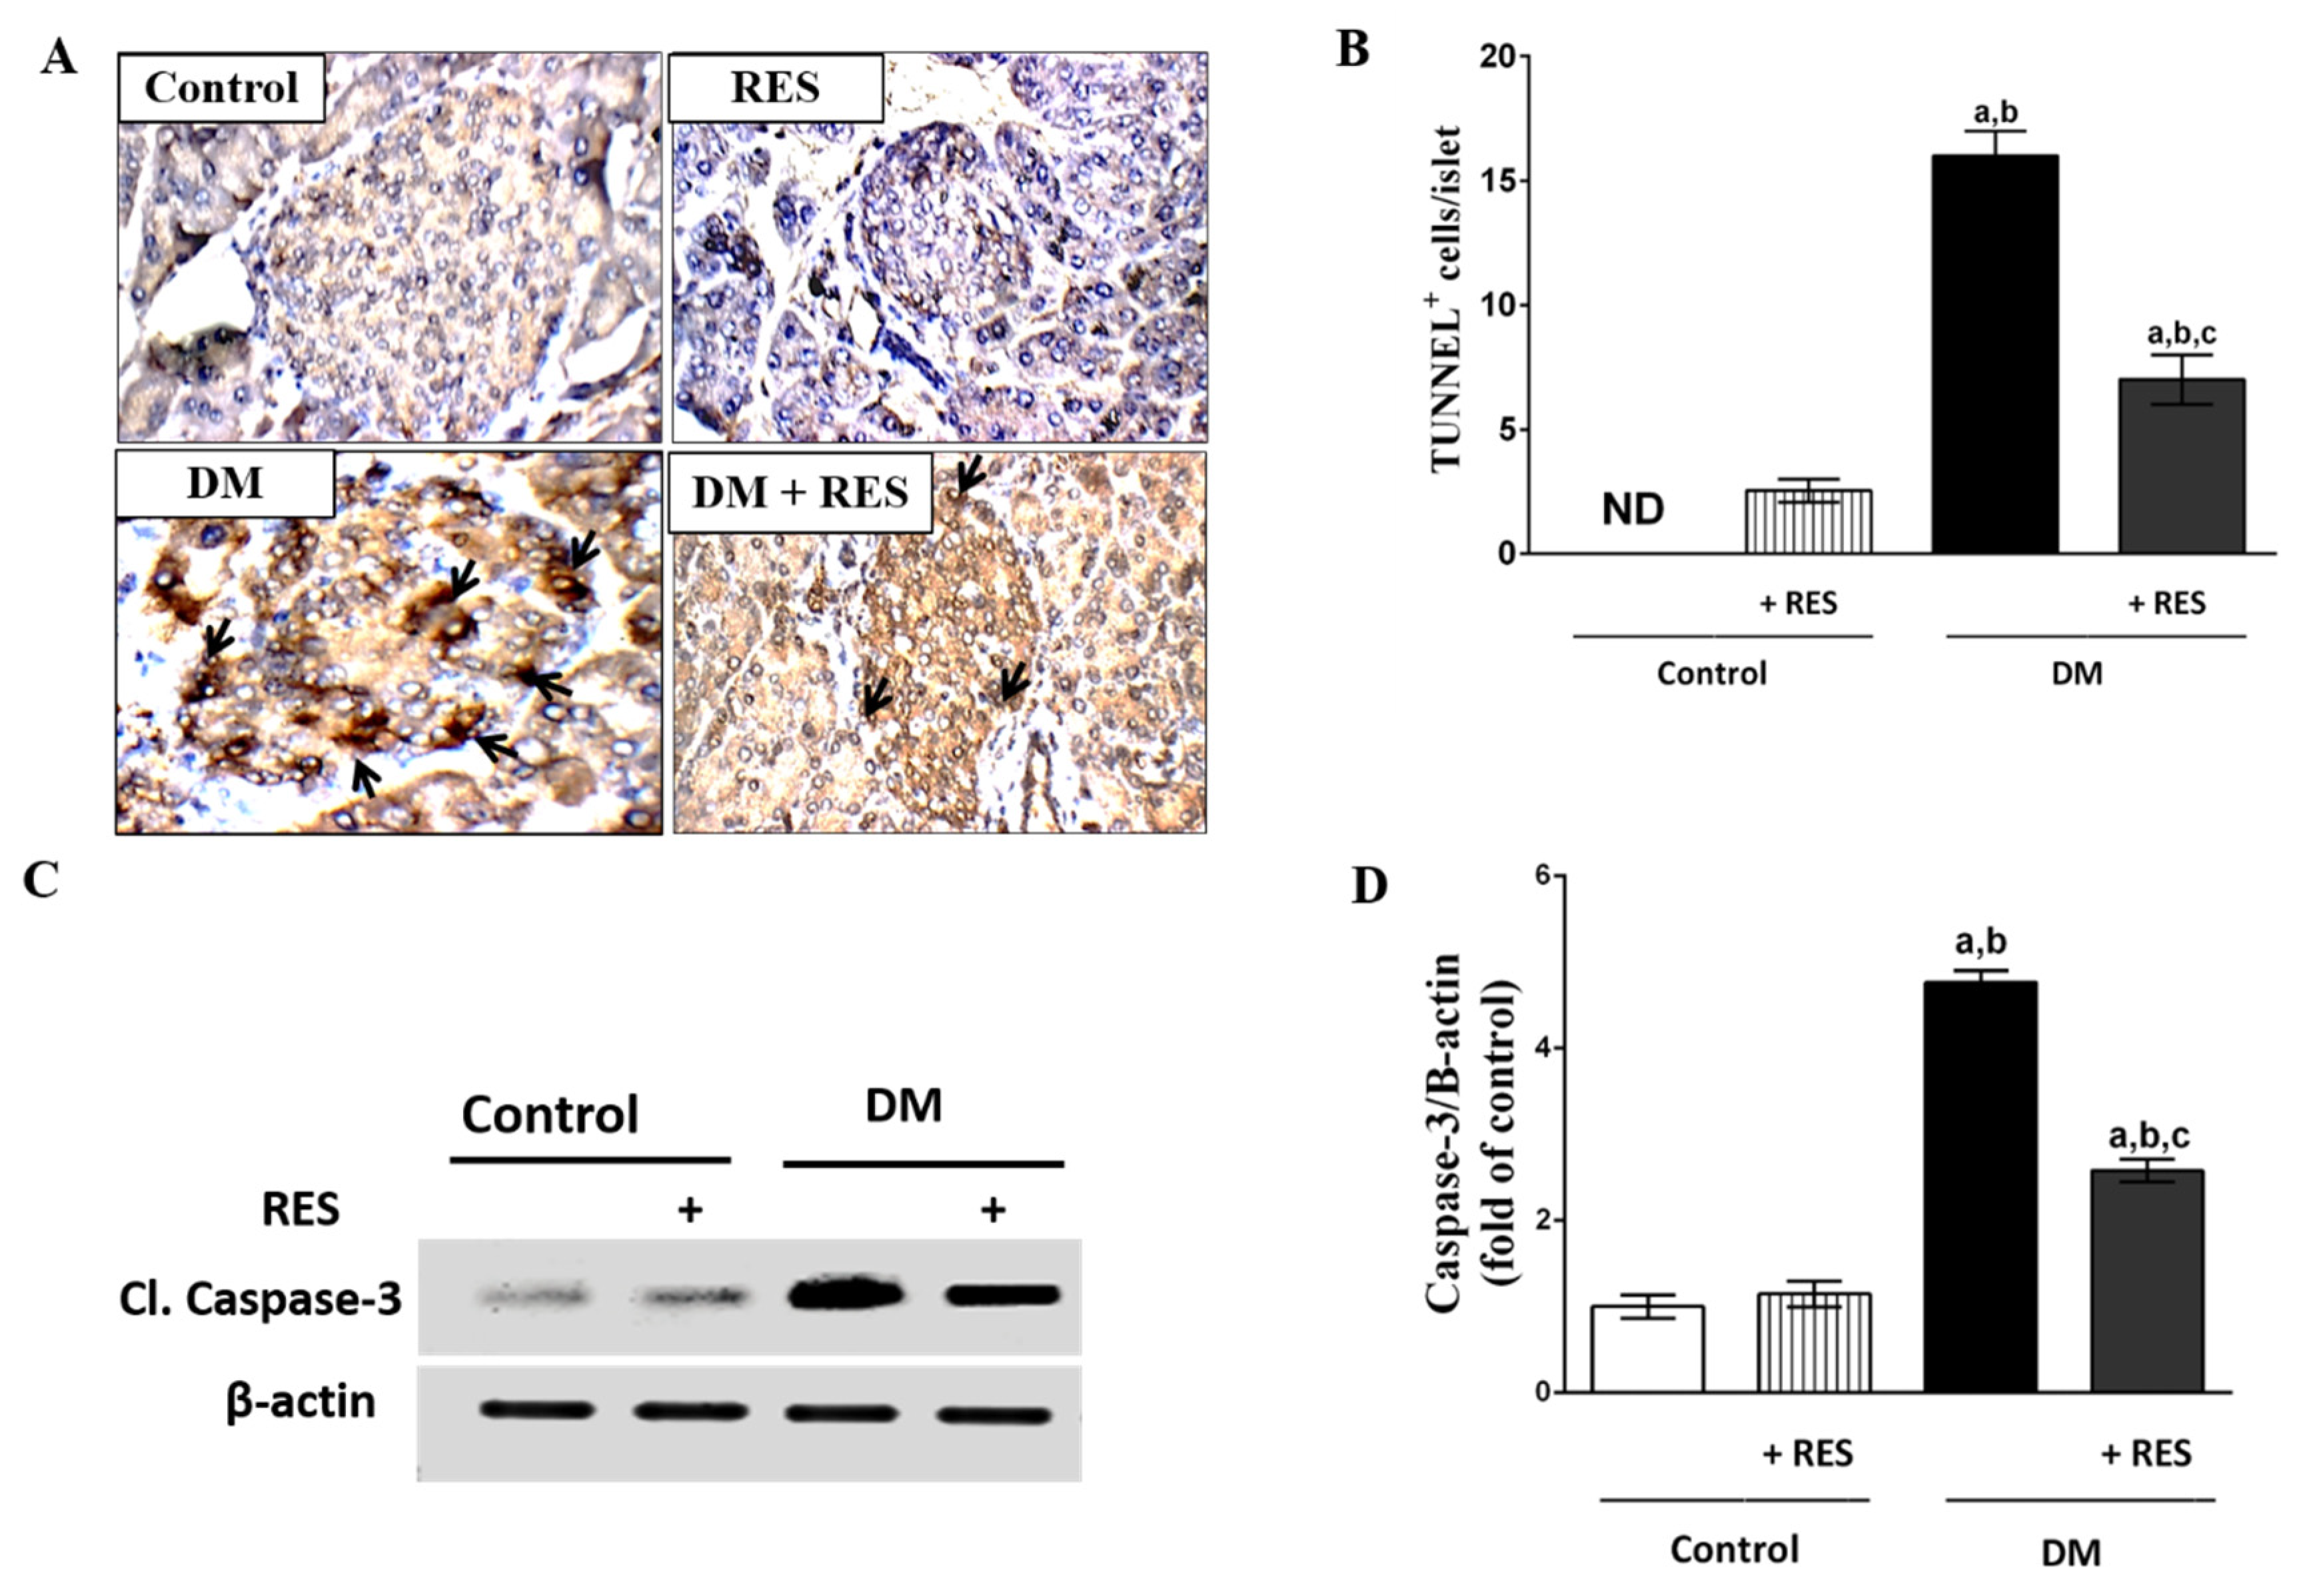
3.6. Effect of RES on STZ-Induced Apoptosis
3.7. Effect of RES with or without STZ on Splenic and Pancreatic T-Cell Protein Expression
3.8. RES and/or STZ Effect on Histopathological Features
4. Discussion
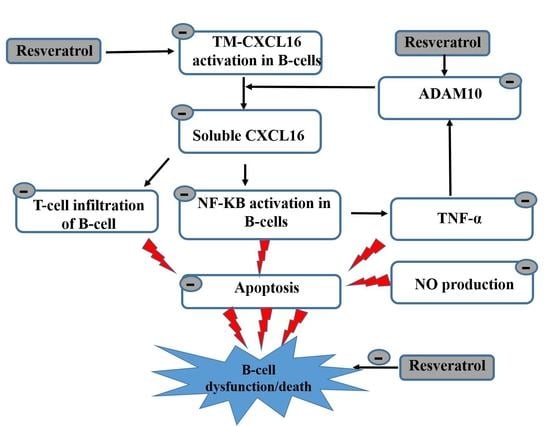
5. Conclusions
Author Contributions
Funding
Institutional Review Board Statement
Informed Consent Statement
Data Availability Statement
Conflicts of Interest
Abbreviations
| ADAM10 | A Disintegrin and Metallopeptidase 10 |
| ANOVA | Analysis of variance |
| CKD | chronic kidney diseases |
| CXCL16 | CXC chemokine ligand 16 |
| DAPI | 4′,6′-diamidino-2-phenylindole |
| DMSO | Dimethylsulfoxide |
| ELISA | Enzyme-linked immunosorbent assay |
| HBSS | Hank’s balanced salt solution |
| NF-ΚB | Nuclear factor-kappa B |
| PBS | Phosphate-buffered saline |
| RES | Resveratrol |
| STZ | Streptozotocin |
| TNF-alpha | Tumor necrosis factor-alpha |
| T1D | Type 1 diabetes |
| WBC | White blood cell |
References
- Fagerberg, L.; Hallström, B.M.; Oksvold, P.; Kampf, C.; Djureinovic, D.; Odeberg, J.; Habuka, M.; Tahmasebpoor, S.; Danielsson, A.; Edlund, K. Analysis of the human tissue-specific expression by genome-wide integration of transcriptomics and antibody-based proteomics. Mol. Cell. Proteom. 2014, 13, 397–406. [Google Scholar] [CrossRef] [Green Version]
- Weber, S.; Saftig, P. Ectodomain shedding and ADAMs in development. Development 2012, 139, 3693–3709. [Google Scholar] [CrossRef] [Green Version]
- Pruessmeyer, J.; Ludwig, A. The good, the bad and the ugly substrates for ADAM10 and ADAM17 in brain pathology, inflammation and cancer. Semin. Cell Dev. Biol. 2009, 20, 164–174. [Google Scholar] [CrossRef]
- Dreymueller, D.; Pruessmeyer, J.; Groth, E.; Ludwig, A. The role of ADAM-mediated shedding in vascular biology. Eur. J. Cell Biol. 2012, 91, 472–485. [Google Scholar] [CrossRef]
- Fang, Y.; Henderson, F.C.; Yi, Q.; Lei, Q.; Li, Y.; Chen, N. Chemokine CXCL16 expression suppresses migration and invasiveness and induces apoptosis in breast cancer cells. Mediat. Inflamm. 2014, 2014. [Google Scholar] [CrossRef]
- Liang, H.; Liao, M.; Zhao, W.; Zheng, X.; Xu, F.; Wang, H.; Huang, J. CXCL16/ROCK1 signaling pathway exacerbates acute kidney injury induced by ischemia-reperfusion. Biomed. Pharmacother. 2018, 98, 347–356. [Google Scholar] [CrossRef]
- Kato, T.; Hagiyama, M.; Ito, A. Renal ADAM10 and 17: Their physiological and medical meanings. Front. Cell Dev. Biol. 2018, 6, 153. [Google Scholar] [CrossRef]
- Schramme, A.; Abdel-Bakky, M.S.; Gutwein, P.; Obermüller, N.; Baer, P.C.; Hauser, I.A.; Ludwig, A.; Gauer, S.; Schäfer, L.; Sobkowiak, E. Characterization of CXCL16 and ADAM10 in the normal and transplanted kidney. Kidney Int. 2008, 74, 328–338. [Google Scholar] [CrossRef] [Green Version]
- Mir, H.; Kaur, G.; Kapur, N.; Bae, S.; Lillard, J.W.; Singh, S. Higher CXCL16 exodomain is associated with aggressive ovarian cancer and promotes the disease by CXCR6 activation and MMP modulation. Sci. Rep. 2019, 9, 2527. [Google Scholar] [CrossRef]
- Gong, Q.; Wu, F.; Pan, X.; Yu, J.; Li, Y.; Lu, T.; Li, X.; Lin, Z. Soluble CXC chemokine ligand 16 levels are increased in gout patients. Clin. Biochem. 2012, 45, 1368–1373. [Google Scholar] [CrossRef]
- Lin, Z.; Gong, Q.; Zhou, Z.; Zhang, W.; Liao, S.; Liu, Y.; Yan, X.; Pan, X.; Lin, S.; Li, X. Increased plasma CXCL16 levels in patients with chronic kidney diseases. Eur. J. Clin. Investig. 2011, 41, 836–845. [Google Scholar] [CrossRef] [PubMed]
- Chandrasekar, B.; Bysani, S.; Mummidi, S. CXCL16 signals via Gi, phosphatidylinositol 3-kinase, Akt, IκB kinase, and nuclear factor-κB and induces cell-cell adhesion and aortic smooth muscle cell proliferation. J. Biol. Chem. 2004, 279, 3188–3196. [Google Scholar] [CrossRef] [Green Version]
- Abel, S.; Hundhausen, C.; Mentlein, R.; Schulte, A.; Berkhout, T.A.; Broadway, N.; Hartmann, D.; Sedlacek, R.; Dietrich, S.; Muetze, B. The transmembrane CXC-chemokine ligand 16 is induced by IFN-γ and TNF-α and shed by the activity of the disintegrin-like metalloproteinase ADAM10. J. Immunol. 2004, 172, 6362–6372. [Google Scholar] [CrossRef] [PubMed] [Green Version]
- Tawfik, M.S.; Abdel-Messeih, P.L.; Nosseir, N.M.; Mansour, H.H. Circulating CXCL16 in type 2 diabetes mellitus Egyptian patients. J. Radiat. Res. Appl. Sci. 2021, 14, 9–15. [Google Scholar] [CrossRef]
- Zhou, F.; Wang, J.; Wang, K.; Zhu, X.; Pang, R.; Li, X.; Zhu, G.; Pan, X. Serum CXCL16 as a novel biomarker of coronary artery disease in type 2 diabetes mellitus: A pilot study. Ann. Clin. Lab. Sci. 2016, 46, 184–189. [Google Scholar]
- Lekva, T.; Michelsen, A.E.; Aukrust, P.; Roland, M.C.P.; Henriksen, T.; Bollerslev, J.; Ueland, T. CXC chemokine ligand 16 is increased in gestational diabetes mellitus and preeclampsia and associated with lipoproteins in gestational diabetes mellitus at 5 years follow-up. Diabetes Vasc. Dis. Res. 2017, 14, 525–533. [Google Scholar] [CrossRef] [Green Version]
- Devi, L.; Alldred, M.J.; Ginsberg, S.D.; Ohno, M. Mechanisms underlying insulin deficiency-induced acceleration of β-amyloidosis in a mouse model of Alzheimer’s disease. PLoS ONE 2012, 7, e32792. [Google Scholar] [CrossRef] [Green Version]
- Yang, K.; Lu, L.; Liu, Y.; Zhang, Q.; Pu, L.J.; Wang, L.J.; Zhu, Z.B.; Wang, Y.N.; Meng, H.; Zhang, X.J. Increase of ADAM10 level in coronary artery in-stent restenosis segments in diabetic minipigs: High ADAM10 expression promoting growth and migration in human vascular smooth muscle cells via Notch 1 and 3. PLoS ONE 2013, 8, e83853. [Google Scholar] [CrossRef]
- Allagnat, F.; Fukaya, M.; Nogueira, T.C.; Delaroche, D.; Welsh, N.; Marselli, L.; Marchetti, P.; Haefliger, J.A.; Eizirik, D.L.; Cardozo, A.K. C/EBP homologous protein contributes to cytokine-induced pro-inflammatory responses and apoptosis in β-cells. Cell Death Differ. 2012, 19, 1836–1846. [Google Scholar] [CrossRef]
- Garcia, G.E.; Truong, L.D.; Li, P.; Zhang, P.; Johnson, R.J.; Wilson, C.B.; Feng, L. Inhibition of CXCL16 attenuates inflammatory and progressive phases of anti-glomerular basement membrane antibody-associated glomerulonephritis. Am. J. Pathol. 2007, 170, 1485–1496. [Google Scholar] [CrossRef] [Green Version]
- Darwish, M.A.; Abo-Youssef, A.M.; Messiha, B.A.S.; Abo-Saif, A.A.; Abdel-Bakky, M.S. Resveratrol inhibits macrophage infiltration of pancreatic islets in streptozotocin-induced type 1 diabetic mice via attenuation of the CXCL16/NF-κΒ p65 signaling pathway. Life Sci. 2021, 272, 119250. [Google Scholar] [CrossRef] [PubMed]
- Ciddi, V.; Dodda, D. Therapeutic potential of resveratrol in diabetic complications: In vitro and in vivo studies. Pharmacol. Rep. 2014, 66, 799–803. [Google Scholar] [CrossRef] [PubMed]
- Hussein, M.M.A.; Mahfouz, M.K. Effect of resveratrol and rosuvastatin on experimental diabetic nephropathy in rats. Biomed. Pharmacother. 2016, 82, 685–692. [Google Scholar] [CrossRef] [PubMed]
- Huo, X.; Zhang, T.; Meng, Q.; Li, C.; You, B. Resveratrol effects on a diabetic rat model with coronary heart disease. Med. Sci. Monit. Int. Med. J. Exp. Clin. Res. 2019, 25, 540. [Google Scholar] [CrossRef] [PubMed]
- Oyenihi, O.R.; Oyenihi, A.B.; Adeyanju, A.A.; Oguntibeju, O.O. Antidiabetic effects of resveratrol: The way forward in its clinical utility. J. Diabetes Res. 2016, 2016, 9737483. [Google Scholar] [CrossRef]
- Kim, Y.H.; Kim, Y.S.; Kang, S.S.; Cho, G.J.; Choi, W.S. Resveratrol inhibits neuronal apoptosis and elevated Ca2+/ calmodulin-dependent protein kinase II activity in diabetic mouse retina. Diabetes 2010, 59, 1825–1835. [Google Scholar] [CrossRef] [Green Version]
- Blanchet, J.; Longpré, F.; Bureau, G.; Morissette, M.; DiPaolo, T.; Bronchti, G.; Martinoli, M.-G. Resveratrol, a red wine polyphenol, protects dopaminergic neurons in MPTP-treated mice. Prog. Neuro-Psychopharmacol. Biol. Psychiatry 2008, 32, 1243–1250. [Google Scholar] [CrossRef]
- Rydgren, T.; Vaarala, O.; Sandler, S. Simvastatin protects against multiple low-dose streptozotocin-induced type 1 diabetes in CD-1 mice and recurrence of disease in nonobese diabetic mice. J. Pharmacol. Exp. Ther. 2007, 323, 180–185. [Google Scholar] [CrossRef] [Green Version]
- Bender, C.; Christen, S.; Scholich, K.; Bayer, M.; Pfeilschifter, J.M.; Hintermann, E.; Christen, U. Islet-expressed CXCL10 promotes autoimmune destruction of islet isografts in mice with type 1 diabetes. Diabetes 2017, 66, 113–126. [Google Scholar] [CrossRef] [Green Version]
- Miranda, K.M.; Espey, M.G.; Wink, D.A. A rapid, simple spectrophotometric method for simultaneous detection of nitrate and nitrite. Nitric Oxide 2001, 5, 62–71. [Google Scholar] [CrossRef]
- Abdel-bakky, M.S.; Hammad, M.A.; Walker, L.A.; Ashfaq, M.K. Silencing of tissue factor by antisense deoxyoligonucleotide prevents monocrotaline / LPS renal injury in mice. Arch. Toxicol. 2011, 1245–1256. [Google Scholar] [CrossRef] [PubMed]
- Martin, A.P.; Alexander-Brett, J.M.; Canasto-Chibuque, C.; Garin, A.; Bromberg, J.S.; Fremont, D.H.; Lira, S.A. The Chemokine Binding Protein M3 Prevents Diabetes Induced by Multiple Low Doses of Streptozotocin. J. Immunol. 2007, 178, 4623–4631. [Google Scholar] [CrossRef] [PubMed]
- Wild, S.; Roglic, G.; Green, A.; Sicree, R.; King, H. Global prevalence of diabetes: Estimates for the year 2000 and projections for 2030. Diabetes Care 2004, 27, 1047–1053. [Google Scholar] [CrossRef] [PubMed] [Green Version]
- Gerber, P.A.; Rutter, G.A. The role of oxidative stress and hypoxia in pancreatic beta-cell dysfunction in diabetes mellitus. Antioxid. Redox Signal. 2017, 26, 501–518. [Google Scholar] [CrossRef] [PubMed] [Green Version]
- Baynes, J.W. Role of oxidative stress in development of complications in diabetes. Diabetes 1991, 40, 405–412. [Google Scholar] [CrossRef] [PubMed]
- Eizirik, D.L.; Colli, M.L.; Ortis, F. The role of inflammation in insulitis and β-cell loss in type 1 diabetes. Nat. Rev. Endocrinol. 2009, 5, 219. [Google Scholar] [CrossRef]
- Ye, M.; Qiu, T.; Peng, W.; Chen, W.; Ye, Y.; Lin, Y. Purification, characterization and hypoglycemic activity of extracellular polysaccharides from Lachnum calyculiforme. Carbohydr. Polym. 2011, 86, 285–290. [Google Scholar] [CrossRef]
- Furman, B.L. Streptozotocin-induced diabetic models in mice and rats. Curr. Protoc. Pharmacol. 2015, 70, 5–47. [Google Scholar] [CrossRef]
- Kolb, H. Mouse models of insulin dependent diabetes: Low-dose streptozocin-induced diabetes and nonobese diabetic (NOD) mice. Diabetes. Metab. Rev. 1987, 3, 751–778. [Google Scholar] [CrossRef]
- Tang, T.; Duan, X.; Ke, Y.; Zhang, L.; Shen, Y.; Hu, B.; Liu, A.; Chen, H.; Li, C.; Wu, W. Antidiabetic activities of polysaccharides from Anoectochilus roxburghii and Anoectochilus formosanus in STZ-induced diabetic mice. Int. J. Biol. Macromol. 2018, 112, 882–888. [Google Scholar] [CrossRef]
- Suzuki, M.; Mihara, M. Adiponectin induces CCL20 expression synergistically with IL-6 and TNF-α in THP-1 macrophages. Cytokine 2012, 58, 344–350. [Google Scholar] [CrossRef] [PubMed]
- De Luca, C.; Olefsky, J.M. Inflammation and insulin resistance. FEBS Lett. 2008, 582, 97–105. [Google Scholar] [CrossRef] [PubMed] [Green Version]
- Ruge, T.; Lockton, J.A.; Renstrom, F.; Lystig, T.; Sukonina, V.; Svensson, M.K.; Eriksson, J.W. Acute hyperinsulinemia raises plasma interleukin-6 in both nondiabetic and type 2 diabetes mellitus subjects, and this effect is inversely associated with body mass index. Metabolism 2009, 58, 860–866. [Google Scholar] [CrossRef] [PubMed]
- Gulcubuk, A.; Haktanir, D.; Cakiris, A.; Ustek, D.; Guzel, O.; Erturk, M.; Yildirim, F.; Akyazi, I.; Cicekci, H.; Durak, M.H. The effects of resveratrol on tissue injury, oxidative damage, and pro-inflammatory cytokines in an experimental model of acute pancreatitis. J. Physiol. Biochem. 2014, 70, 397–406. [Google Scholar] [CrossRef] [PubMed]
- Yao, L.; Wan, J.; Li, H.; Ding, J.; Wang, Y.; Wang, X.; Li, M. Resveratrol relieves gestational diabetes mellitus in mice through activating AMPK. Reprod. Biol. Endocrinol. 2015, 13, 118. [Google Scholar] [CrossRef] [PubMed] [Green Version]
- Kwon, N.S.; Lee, S.H.; Choi, C.S.; Kho, T.; Lee, H.S. Nitric oxide generation from streptozotocin 1. FASEB J. 1994, 8, 529–533. [Google Scholar] [CrossRef]
- Haluzik, M.; Nedvidkova, J. The role of nitric oxide in the development of streptozotocin-induced diabetes mellitus: Experimental and clinical implications. Physiol. Res. 2000, 49, S37–S42. [Google Scholar]
- Lin, J.-W.; Yang, L.-H.; Ren, Z.-C.; Mu, D.-G.; Li, Y.-Q.; Yan, J.-P.; Wang, L.-X.; Chen, C. Resveratrol downregulates TNF-α-induced monocyte chemoattractant protein-1 in primary rat pulmonary artery endothelial cells by P38 mitogen-activated protein kinase signaling. Drug Des. Devel. Ther. 2019, 13, 1843. [Google Scholar] [CrossRef] [Green Version]
- Wang, M.; Weng, X.; Chen, H.; Chen, Z.; Liu, X. Resveratrol inhibits TNF-α-induced inflammation to protect against renal ischemia/reperfusion injury in diabetic rats. Acta Cir. Bras. 2020, 35, e202000506. [Google Scholar] [CrossRef]
- Aktaş, H.S.; Ozel, Y.; Ahmad, S.; Pençe, H.H.; Ayaz-Adakul, B.; Kudas, I.; Tetik, S.; Şekerler, T.; Canbey-Göret, C.; Kabasakal, L. Protective effects of resveratrol on hepatic ischemia reperfusion injury in streptozotocin-induced diabetic rats. Mol. Cell. Biochem. 2019, 460, 217–224. [Google Scholar] [CrossRef]
- Gutwein, P.; Abdel-bakky, M.S.; Doberstein, K.; Schramme, A.; Beckmann, J.; Schaefer, L.; Amann, K.; Doller, A.; Kämpfer-kolb, N.; Sayed, E.; et al. CXCL16 and oxLDL are induced in the onset of diabetic nephropathy. Mol. Med. 2009, 13, 3809–3825. [Google Scholar] [CrossRef] [Green Version]
- Schramme, A.; Abdel-bakky, M.S.; Kämpfer-kolb, N.; Pfeilschifter, J.; Gutwein, P. The role of CXCL16 and its processing metalloproteinases ADAM10 and ADAM17 in the proliferation and migration of human mesangial cells. Biochem. Biophys. Res. Commun. 2008, 370, 311–316. [Google Scholar] [CrossRef] [PubMed]
- Darwish, M.A.; Abdel-Bakky, M.S.; Messiha, B.A.S.; Abo-Saif, A.A.; Abo-Youssef, A.M. Resveratrol mitigates pancreatic TF activation and autophagy-mediated beta cell death via inhibition of CXCL16/ox-LDL pathway: A novel protective mechanism against type 1 diabetes mellitus in mice. Eur. J. Pharmacol. 2021, 901, 174059. [Google Scholar] [CrossRef]
- Zhao, L.; Wu, F.; Jin, L.; Lu, T.; Yang, L.; Pan, X.; Shao, C.; Li, X.; Lin, Z. Serum CXCL16 as a novel marker of renal injury in type 2 diabetes mellitus. PLoS ONE 2014, 9, e87786. [Google Scholar] [CrossRef]
- Abdel-Bakky, M.S.; Alqasoumi, A.; Altowayan, W.M.; Amin, E.; Darwish, M.A. Simvastatin mitigates streptozotocin-induced type 1 diabetes in mice through downregulation of ADAM10 and ADAM17. Life Sci. 2022, 289, 120224. [Google Scholar] [CrossRef] [PubMed]
- Salem, H.H.; Trojanowski, B.; Fiedler, K.; Maier, H.J.; Schirmbeck, R.; Wagner, M.; Boehm, B.O.; Wirth, T.; Baumann, B. Long-term IKK2/NF-κB signaling in pancreatic β-cells induces immune-mediated diabetes. Diabetes 2014, 63, 960–975. [Google Scholar] [CrossRef] [PubMed] [Green Version]
- El-Asrar, A.M.A.; Nawaz, M.I.; Ahmad, A.; De Zutter, A.; Siddiquei, M.M.; Blanter, M.; Allegaert, E.; Gikandi, P.W.; De Hertogh, G.; Van Damme, J. Evaluation of Proteoforms of the Transmembrane Chemokines CXCL16 and CX3CL1, Their Receptors, and Their Processing Metalloproteinases ADAM10 and ADAM17 in Proliferative Diabetic Retinopathy. Front. Immunol. 2020, 11. [Google Scholar] [CrossRef]
- Kapur, N.; Mir, H.; Sonpavde, G.P.; Jain, S.; Bae, S.; Lillard, J.W., Jr.; Singh, S. Prostate cancer cells hyper-activate CXCR6 signaling by cleaving CXCL16 to overcome effect of docetaxel. Cancer Lett. 2019, 454, 1–13. [Google Scholar] [CrossRef]
- Yamauchi, R.; Tanaka, M.; Kume, N.; Minami, M.; Kawamoto, T.; Togi, K.; Shimaoka, T.; Takahashi, S.; Yamaguchi, J.; Nishina, T. Upregulation of SR-PSOX/CXCL16 and recruitment of CD8+ T cells in cardiac valves during inflammatory valvular heart disease. Arterioscler. Thromb. Vasc. Biol. 2004, 24, 282–287. [Google Scholar] [CrossRef] [Green Version]
- Günther, C.; Carballido-Perrig, N.; Kaesler, S.; Carballido, J.M.; Biedermann, T. CXCL16 and CXCR6 are upregulated in psoriasis and mediate cutaneous recruitment of human CD8+ T cells. J. Investig. Dermatol. 2012, 132, 626–634. [Google Scholar] [CrossRef] [Green Version]
- Van Der Voort, R.; Van Lieshout, A.W.T.; Toonen, L.W.J.; Slöetjes, A.W.; Van Den Berg, W.B.; Figdor, C.G.; Radstake, T.R.D.J.; Adema, G.J. Elevated CXCL16 expression by synovial macrophages recruits memory T cells into rheumatoid joints. Arthritis Rheum. 2005, 52, 1381–1391. [Google Scholar] [CrossRef] [PubMed]
- Kee, J.-Y.; Ito, A.; Hojo, S.; Hashimoto, I.; Igarashi, Y.; Tsukada, K.; Irimura, T.; Shibahara, N.; Nakayama, T.; Yoshie, O. Chemokine CXCL16 suppresses liver metastasis of colorectal cancer via augmentation of tumor-infiltrating natural killer T cells in a murine model. Oncol. Rep. 2013, 29, 975–982. [Google Scholar] [CrossRef] [PubMed] [Green Version]
- Zhu, H.; Zhang, Q.; Chen, G. CXCR6 deficiency ameliorates ischemia-reperfusion injury by reducing the recruitment and cytokine production of hepatic NKT cells in a mouse model of non-alcoholic fatty liver disease. Int. Immunopharmacol. 2019, 72, 224–234. [Google Scholar] [CrossRef] [PubMed]
- Kee, J.-Y.; Ito, A.; Hojo, S.; Hashimoto, I.; Igarashi, Y.; Tsuneyama, K.; Tsukada, K.; Irimura, T.; Shibahara, N.; Takasaki, I. CXCL16 suppresses liver metastasis of colorectal cancer by promoting TNF-α-induced apoptosis by tumor-associated macrophages. BMC Cancer 2014, 14, 949. [Google Scholar] [CrossRef] [PubMed] [Green Version]
- Liang, H.; Zhang, Z.; He, L.; Wang, Y. CXCL16 regulates cisplatin-induced acute kidney injury. Oncotarget 2016, 7, 31652. [Google Scholar] [CrossRef] [Green Version]


Publisher’s Note: MDPI stays neutral with regard to jurisdictional claims in published maps and institutional affiliations. |
© 2022 by the authors. Licensee MDPI, Basel, Switzerland. This article is an open access article distributed under the terms and conditions of the Creative Commons Attribution (CC BY) license (https://creativecommons.org/licenses/by/4.0/).
Share and Cite
Abdel-Bakky, M.S.; Alqasoumi, A.; Altowayan, W.M.; Amin, E.; Darwish, M.A. Resveratrol Inhibited ADAM10 Mediated CXCL16-Cleavage and T-Cells Recruitment to Pancreatic β-Cells in Type 1 Diabetes Mellitus in Mice. Pharmaceutics 2022, 14, 594. https://doi.org/10.3390/pharmaceutics14030594
Abdel-Bakky MS, Alqasoumi A, Altowayan WM, Amin E, Darwish MA. Resveratrol Inhibited ADAM10 Mediated CXCL16-Cleavage and T-Cells Recruitment to Pancreatic β-Cells in Type 1 Diabetes Mellitus in Mice. Pharmaceutics. 2022; 14(3):594. https://doi.org/10.3390/pharmaceutics14030594
Chicago/Turabian StyleAbdel-Bakky, Mohamed S., Abdulmajeed Alqasoumi, Waleed M. Altowayan, Elham Amin, and Mostafa A. Darwish. 2022. "Resveratrol Inhibited ADAM10 Mediated CXCL16-Cleavage and T-Cells Recruitment to Pancreatic β-Cells in Type 1 Diabetes Mellitus in Mice" Pharmaceutics 14, no. 3: 594. https://doi.org/10.3390/pharmaceutics14030594