
Exploring a Bioequivalence Failure for Silodosin Products Due to Disintegrant Excipients
 ,
,  , , , and
Abstract
: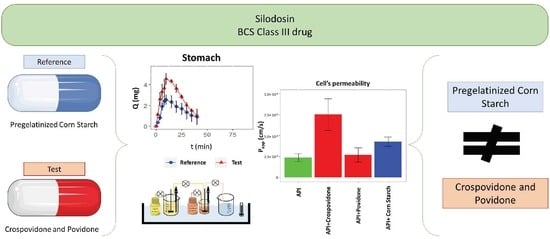
1. Introduction
2. Materials and Methods
2.1. Drugs and Products
2.2. In Vivo Study
2.3. Solubility Assays: Saturation Shake-Flask Procedure
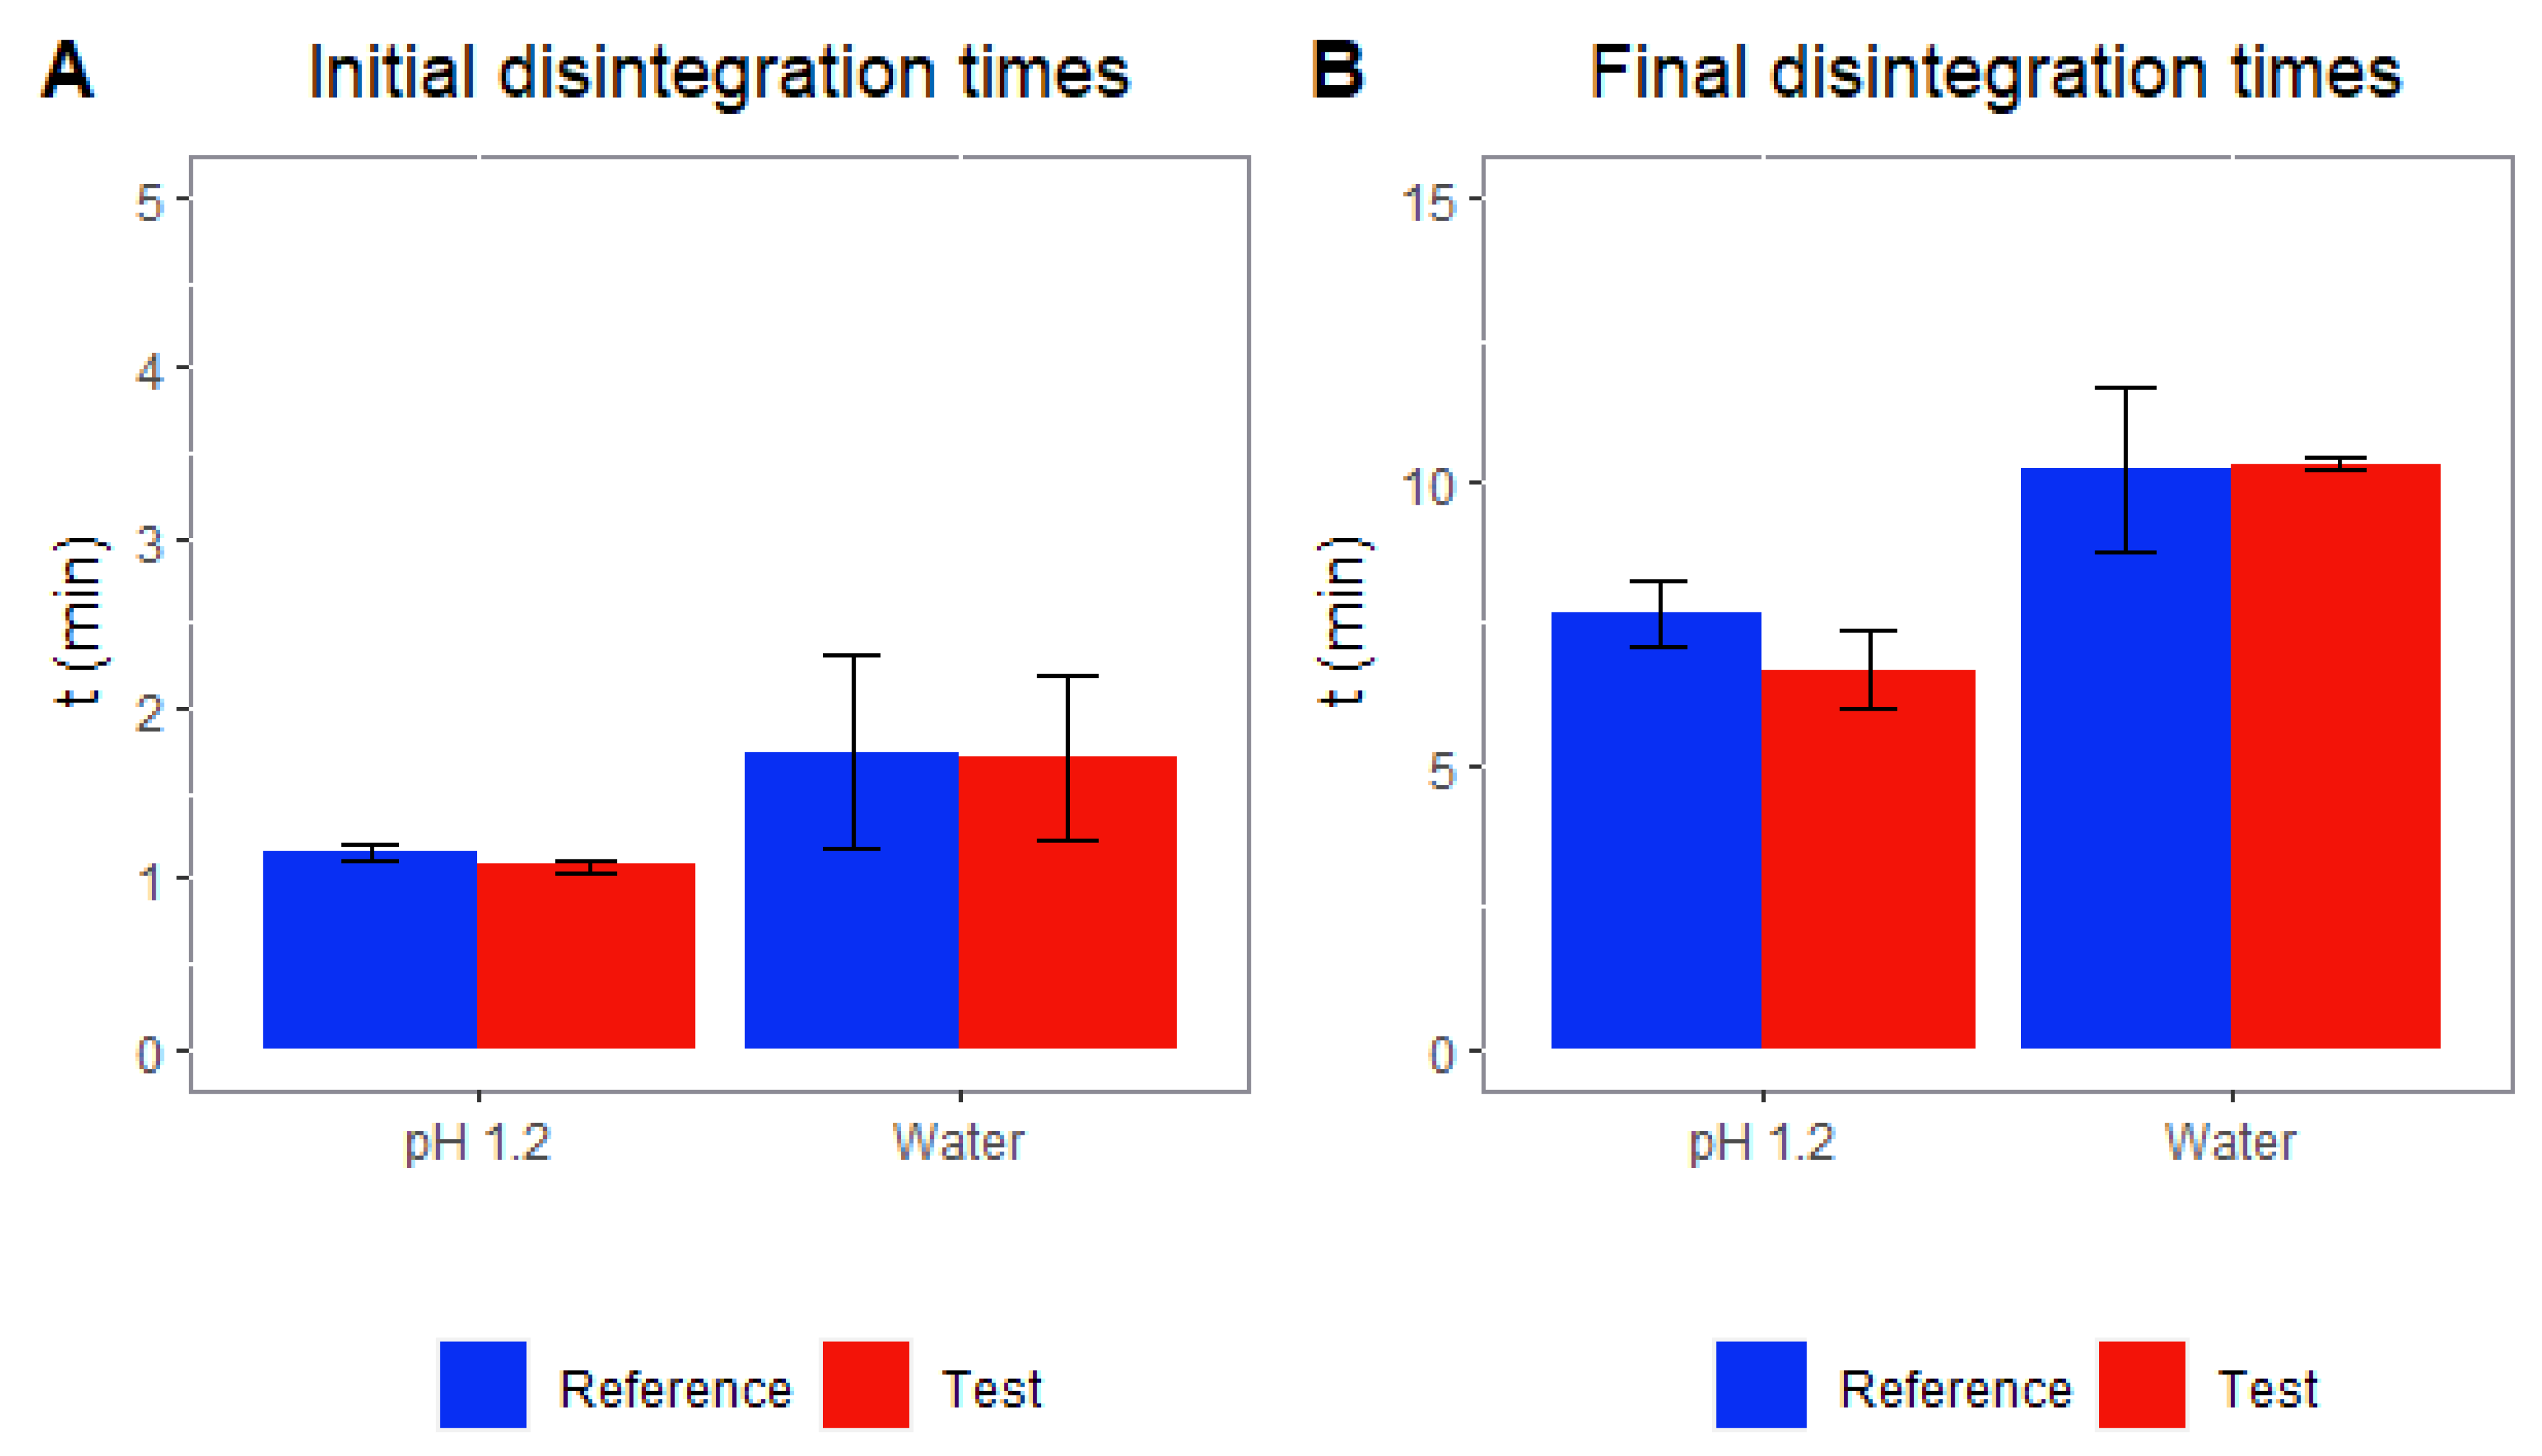
2.4. Disintegration Assays
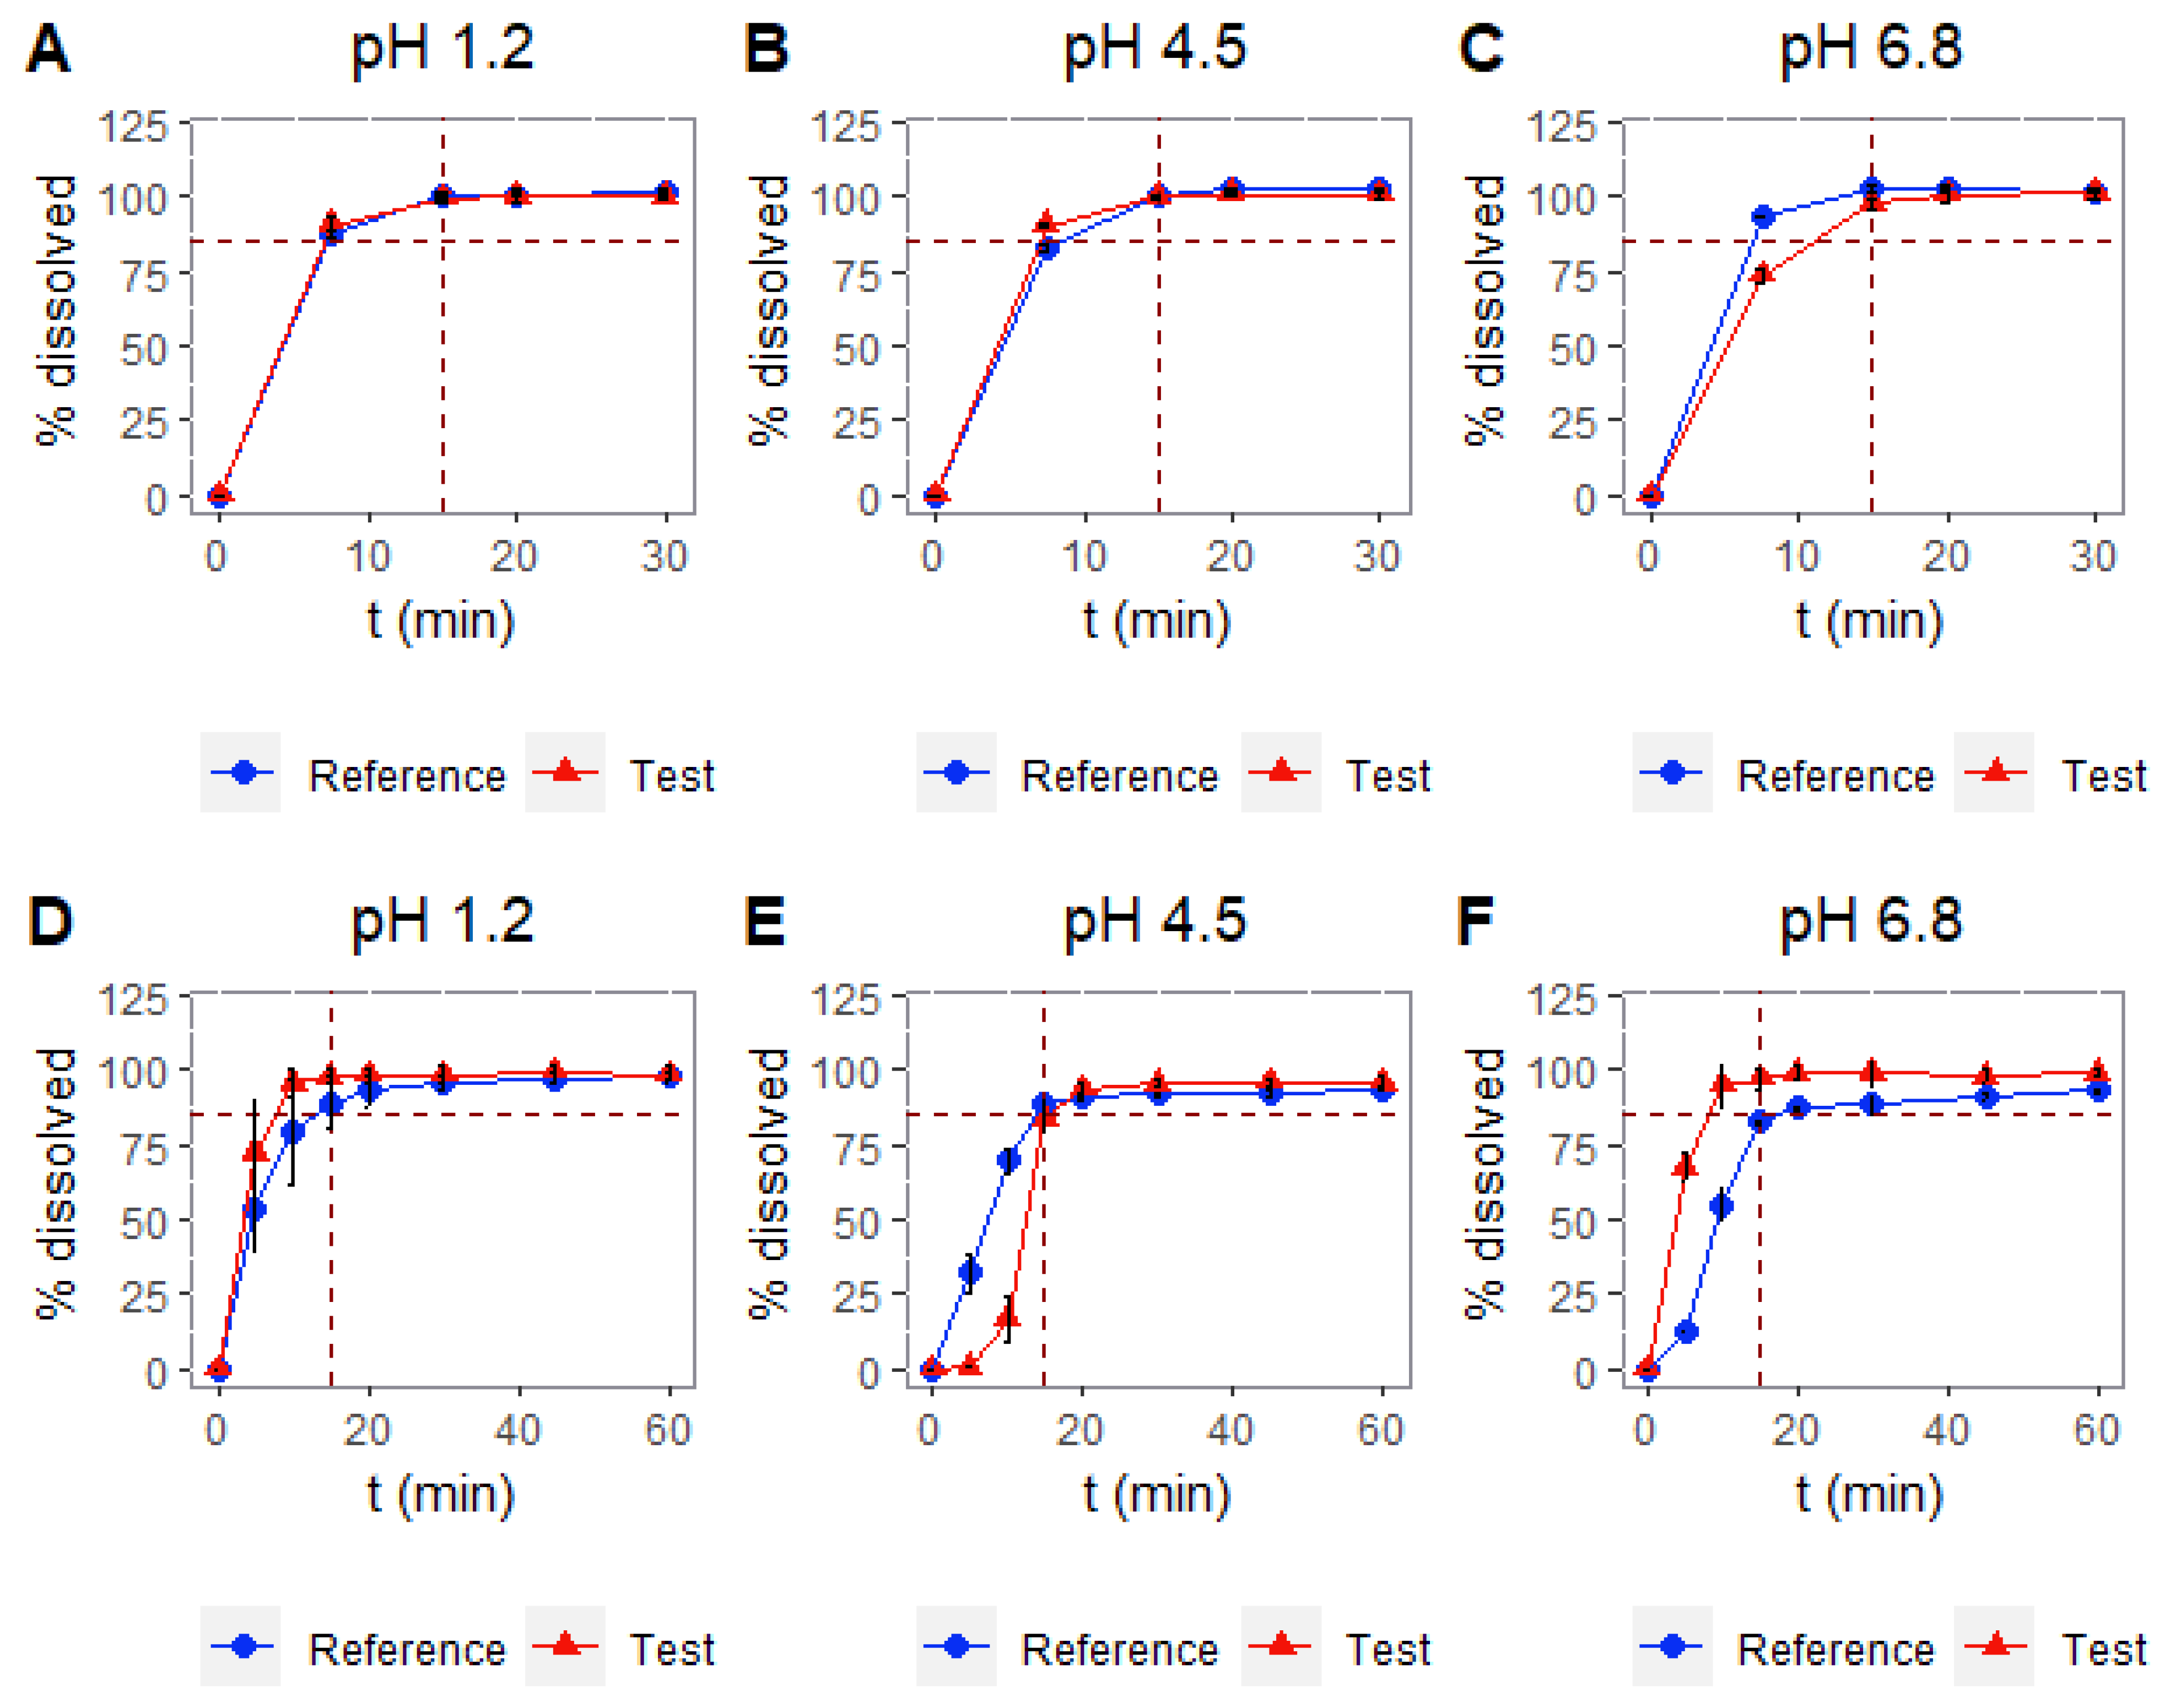
2.5. Dissolution Assays: USP I and USP II
- Paddle apparatus with sinkers to prevent capsules from floating: 50 rpm.
- Basket apparatus: 100 rpm. The assays with baskets at 100 rpm were performed by the pharmaceutical company and the sampling times were 7.5, 15, 20, and 30 min.
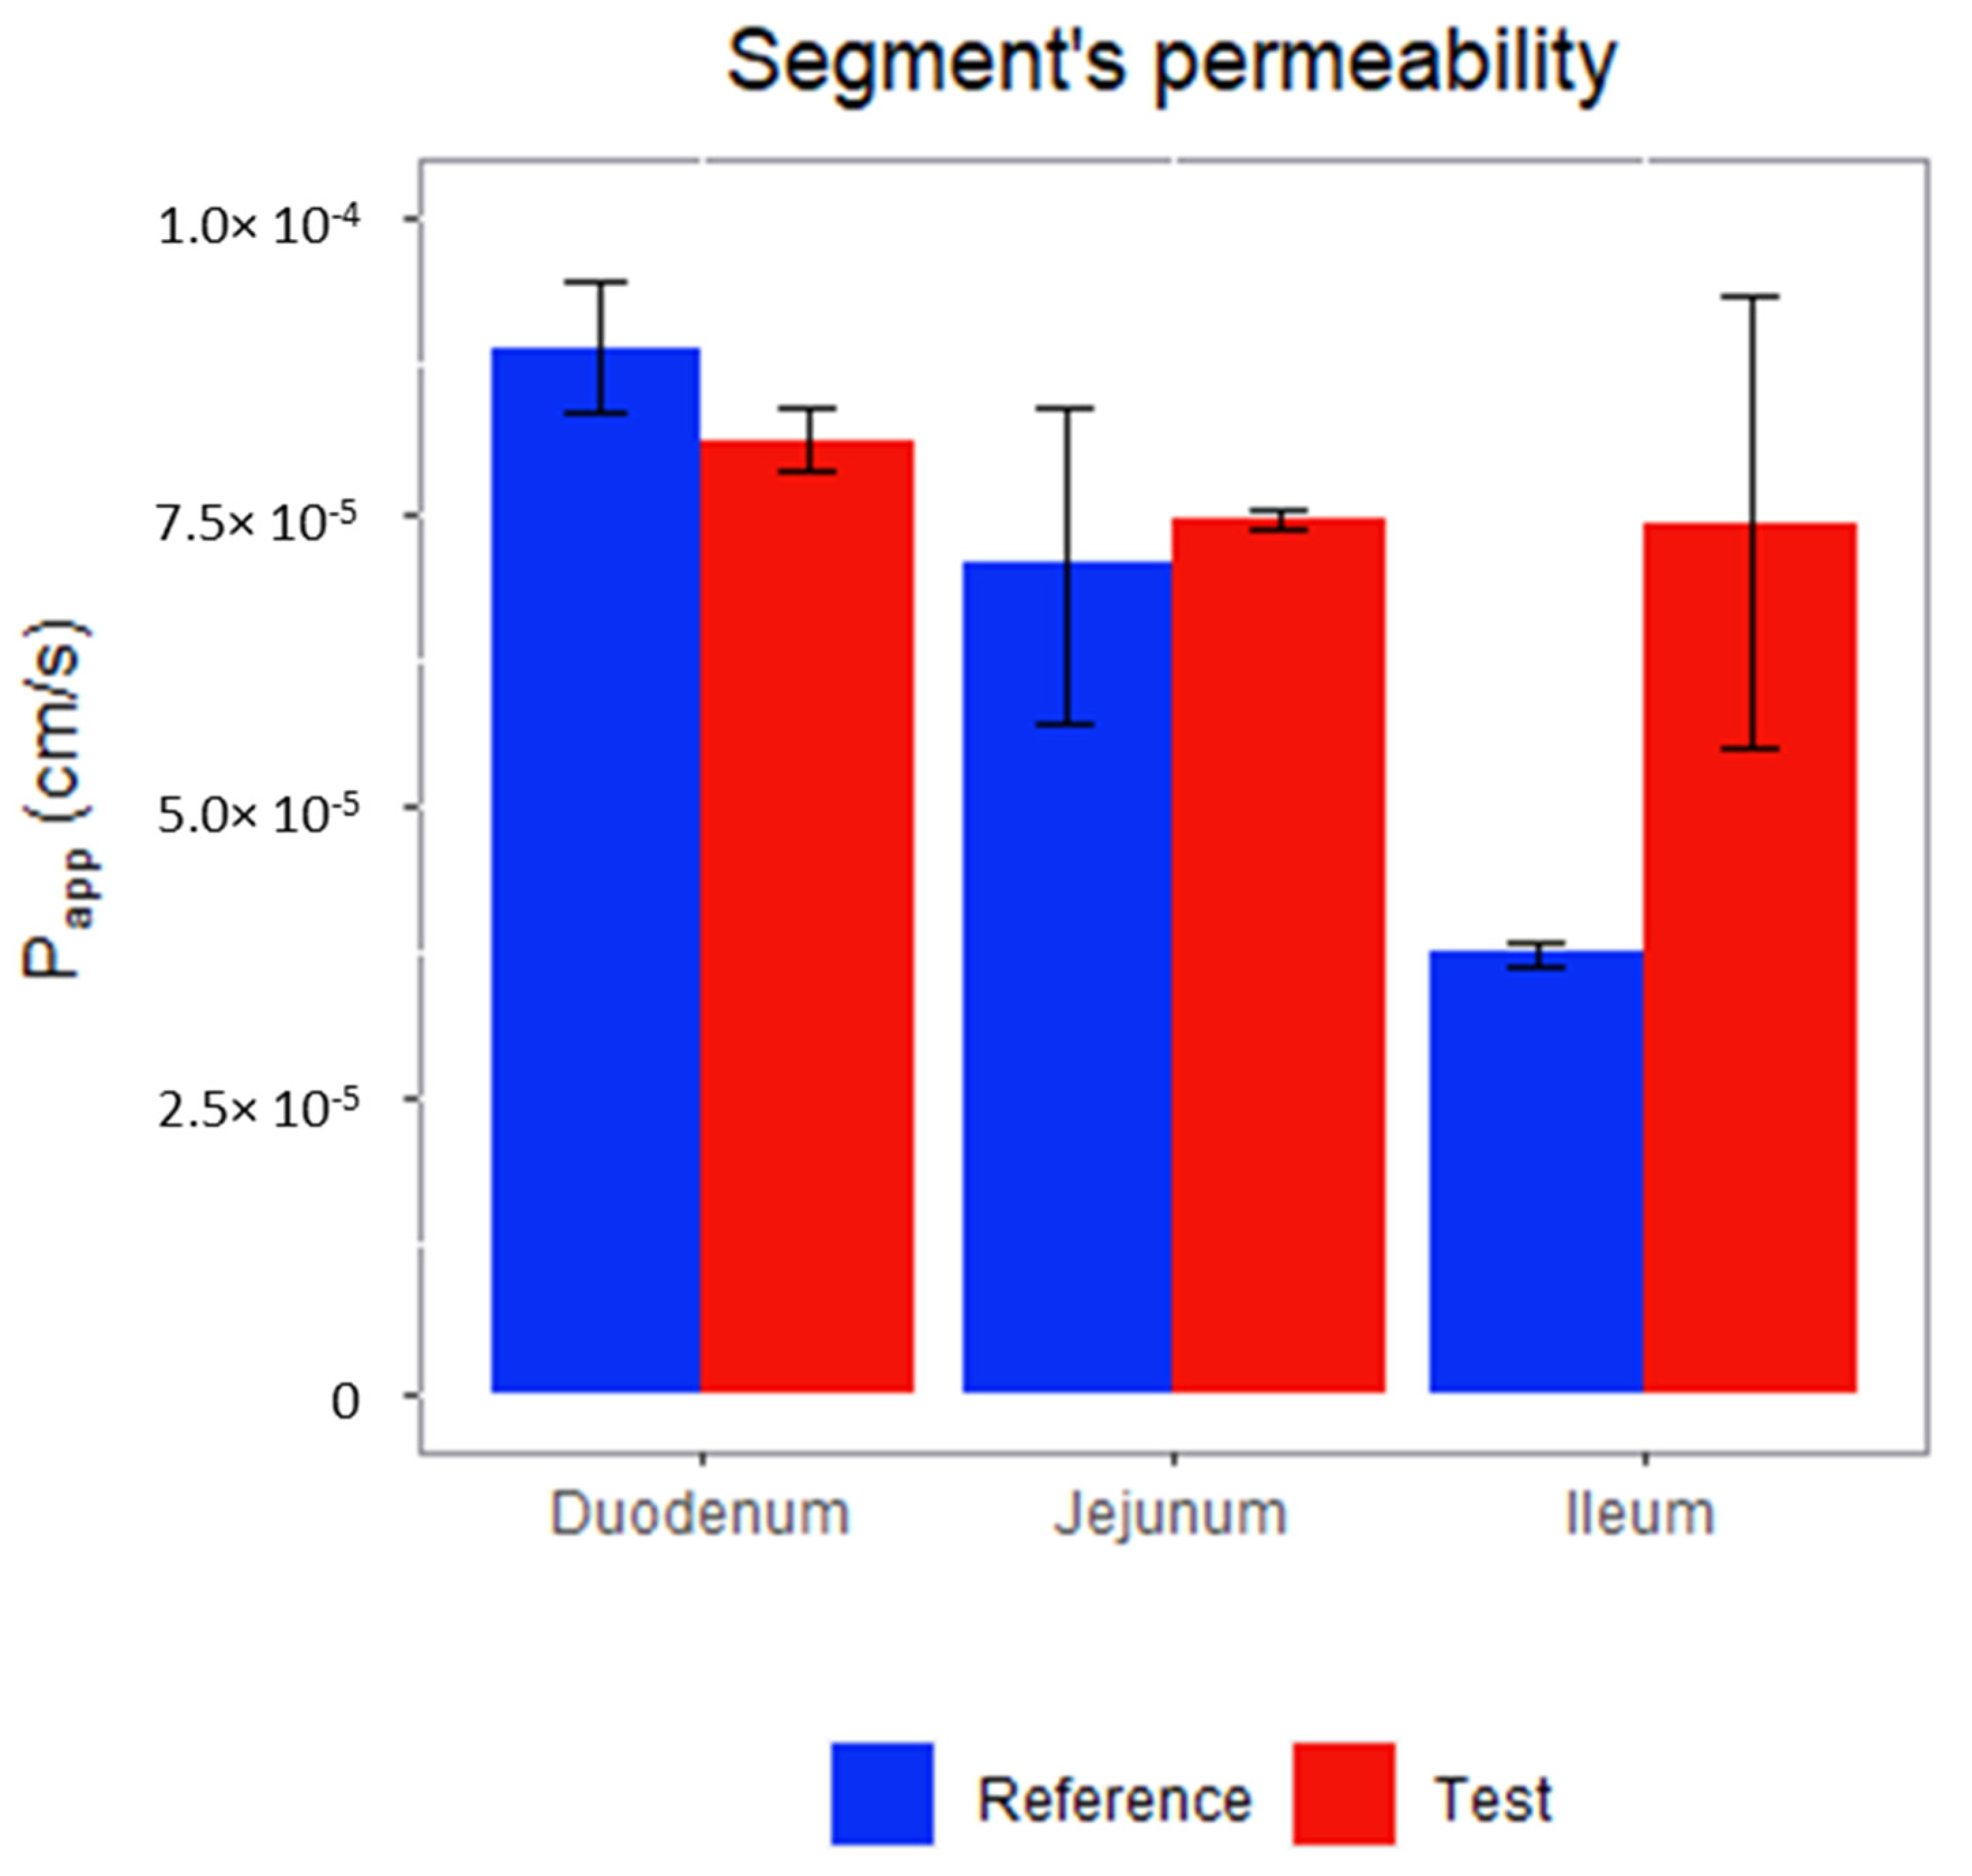
2.6. Permeability Assay: Doluisio Experiment
2.7. In Vitro Permeability Tests
- (a)
- TEER values at the beginning and at the end of the permeability experiments should be adequate (100 units of difference with blank insert and no more than a 10% difference between initial values and values at the end of the experiment).
- (b)
- In checking the mass balance after determining the amount of compound in the insert membranes and inside the cells, the percentage of compound retained in the cell compartment should typically be less than 5%.
2.8. Dissolution Experiments: Gastrointestinal Simulator (GIS)
2.9. HPLC Analysis
3. Results
3.1. Solubility Experiments: Saturation Shake-Flask Procedure
3.2. Disintegration Tests
3.3. Dissolution Tests: USP I and USP II apparatuses
3.4. Permeability Assay: Doluisio’s Experimental Technique
3.5. In Vitro Permeability Tests
3.6. Dissolution Experiments: Gastrointestinal Simulator (GIS)
4. Discussion
5. Conclusions
Author Contributions
Funding
Acknowledgments
Conflicts of Interest
References
- FDA Generic Drugs: Overview & Basics. Available online: https://www.fda.gov/drugs/generic-drugs/overview-basics (accessed on 12 January 2021).
- European Medicines Agency Generic Medicine. Available online: https://www.ema.europa.eu/en/glossary/generic-medicine (accessed on 12 January 2021).
- Laosa, O.; Guerra, P.; López-Durán, J.L.; Mosquera, B.; Frías, J. Bioequivalence Studies: Need for the Reability of Generic Drugs. Rev. Peru. Med. Exp. Salud. Publica. 2009, 26, 553–562. [Google Scholar]
- EMA Guideline on the Investigation of Bioequivalence; European Medicines Agency: Amsterdam, The Netherlands, 2010.
- Obach Vidal, R.; Colom Codina, H.; Domenech Berrozpe, J. Ensayos de Bioequivalencia: Metodología. In Tratado General de Biofarmacia y Farmacocinética—Volumen I: LADME; Domenech Berrozpe, J., Martinez Lanao, J., Peraire Guitart, C., Eds.; Sintesis: Madrid, Spain, 2015; pp. 629–660. ISBN 978-84-995895-2-7. [Google Scholar]
- Obach Vidal, R.; Colom Codina, H.; Domenech Berrozpe, J. Ensayos de Bioequivalencia: Realización Del Estudio. In Tratado General de Biofarmacia y Farmacocinética—Volumen I: LADME; Domenech Berrozpe, J., Martinez Lanao, J., Peraire Guitart, C., Eds.; Sintesis: Madrid, Spain, 2015; pp. 661–686. ISBN 978-84-995895-2-7. [Google Scholar]
- Baena, Y.; Ponce D´Leon, L.F. The Biopharmaceutic Drug Classification, the Theoretical Basis and Its Importance in the Biowaiver Studies. Rev. Colomb. Cienc. Químico Farm. 2008, 37, 18–32. [Google Scholar]
- Amidon, G.L.; Lennernäs, H.; Shah, V.P.; Crison, J.R. A Theoretical Basis for a Biopharmaceutic Drug Classification: The Correlation of in Vitro Drug Product Dissolution and in Vivo Bioavailability. Pharm. Res. 1995, 12, 413–420. [Google Scholar] [CrossRef] [PubMed] [Green Version]
- Benet, L.Z. The Role of BCS (Biopharmaceutics Classification System) and BDDCS (Biopharmaceutics Drug Disposition Classification System) in Drug Development. J. Pharm. Sci. 2013, 102, 34–42. [Google Scholar] [CrossRef] [PubMed] [Green Version]
- Bransford, P.; Cook, J.; Gupta, M.; Haertter, S.; He, H.; Ju, R.; Kanodia, J.; Lennernäs, H.; Lindley, D.; Polli, J.E.; et al. ICH M9 Guideline in Development on Biopharmaceutics Classification System-Based Biowaivers: An Industrial Perspective from the IQ Consortium. Mol. Pharm 2020, 17, 361–372. [Google Scholar] [CrossRef] [PubMed]
- Chemicalize Chemicalize—Instant Cheminformatics Solutions. Available online: https://chemicalize.com/welcome (accessed on 3 May 2020).
- National Library of Medicine Silodosin—PubChem. Available online: https://pubchem.ncbi.nlm.nih.gov/compound/5312125#section=Melting-Point (accessed on 15 January 2021).
- Department of Health, Therapeutic Goods Administration. Therapeutic Goods Administration Australian Public Assessment Report for Silodosin About the Therapeutic Goods Administration (TGA); Department of Health, Therapeutic Goods Administration: Canberra, Australia, 2017.
- Wang, Z.; Xiang, Q.; Cui, Y.; Zhao, X.; Zhou, Y. The Influence of UGT2B7, UGT1A8, MDR1, ALDH, ADH, CYP3A4 and CYP3A5 Genetic Polymorphisms on the Pharmacokinetics of Silodosin in Healthy Chinese Volunteers. Drug Metab. Pharm. 2013, 28, 239–243. [Google Scholar] [CrossRef] [PubMed]
- Matsubara, Y.; Kanazawa, T.; Kojima, Y.; Abe, Y.; Kobayashi, K.; Kanbe, H.; Harada, H.; Momose, Y.; Terakado, S.; Adachi, Y.; et al. Pharmacokinetics and Disposition of Silodosin (KMD-3213). Yakugaku Zasshi 2006, 126, 237–245. [Google Scholar] [CrossRef] [PubMed] [Green Version]
- Doluisio, J.T.; Billups, N.F.; Dittert, L.W.; Sugita, E.T.; Swintosky, J.V. Drug Absorption I: An in Situ Rat Gut Technique Yielding Realistic Absorption Rates. J. Pharm. Sci. 1969, 58, 1196–1200. [Google Scholar] [CrossRef] [PubMed]
- Caldeira, T.G.; Ruiz-Picazo, A.; Lozoya-Agullo, I.; Saúde-Guimarães, D.A.; González-Álvarez, M.; de Souza, J.; González-Álvarez, I.; Bermejo, M. Determination of Intestinal Permeability Using in Situ Perfusion Model in Rats: Challenges and Advantages to BCS Classification Applied to Digoxin. Int. J. Pharm. 2018, 551, 148–157. [Google Scholar] [CrossRef] [PubMed]
- Figueroa-Campos, A.; Sánchez-Dengra, B.; Merino, V.; Dahan, A.; González-Álvarez, I.; García-Arieta, A.; González-Álvarez, M.; Bermejo, M. Candesartan Cilexetil In Vitro-In Vivo Correlation: Predictive Dissolution as a Development Tool. Pharmaceutics 2020, 12, 633. [Google Scholar] [CrossRef] [PubMed]
- Tang, F.; Horie, K.; Borchardt, R.T. Are MDCK Cells Transfected with the Human MRP2 Gene a Good Model of the Human Intestinal Mucosa? Pharm. Res. 2002, 19, 773–779. [Google Scholar] [CrossRef] [PubMed]
- Sánchez-Dengra, B.; González-Álvarez, I.; González-Álvarez, M.; Bermejo, M. New In Vitro Methodology for Kinetics Distribution Prediction in the Brain. An Additional Step towards an Animal-Free Approach. Animals 2021, 11, 3521. [Google Scholar] [CrossRef] [PubMed]
- Sánchez-Dengra, B.; González-Álvarez, I.; Sousa, F.; Bermejo, M.; González-Álvarez, M.; Sarmento, B. In Vitro Model for Predicting the Access and Distribution of Drugs in the Brain Using HCMEC/D3 Cells. Eur. J. Pharm. Biopharm. 2021, 163, 120–126. [Google Scholar] [CrossRef] [PubMed]
- Hens, B.; Brouwers, J.; Anneveld, B.; Corsetti, M.; Symillides, M.; Vertzoni, M.; Reppas, C.; Turner, D.B.; Augustijns, P. Gastrointestinal Transfer: In Vivo Evaluation and Implementation in in Vitro and in Silico Predictive Tools. Eur. J. Pharm. Sci. 2014, 63, 233–242. [Google Scholar] [CrossRef] [PubMed]
- Cui, Y.; Desevaux, C.; Truebenbach, I.; Sieger, P.; Klinder, K.; Long, A.; Sauer, A. A Bidirectional Permeability Assay for beyond Rule of 5 Compounds. Pharmaceutics 2021, 13, 1146. [Google Scholar] [CrossRef] [PubMed]
- Incecayir, T.; Tsume, Y.; Amidon, G.L. Comparison of the Permeability of Metoprolol and Labetalol in Rat, Mouse, and Caco-2 Cells: Use as a Reference Standard for BCS Classification. Mol. Pharm. 2013, 10. [Google Scholar] [CrossRef] [PubMed]
- Villafuerte Robles, L. The Excipients and Their Functionality in Pharmaceutical Solid Products. Rev. Mex. Cienc. Farm. 2011, 42, 18–36. [Google Scholar]
- Awasthi, R.; Manchanda, S.; Das, P.; Velu, V.; Malipeddi, H.; Pabreja, K.; Pinto, T.D.J.A.; Gupta, G.; Dua, K. Poly(Vinylpyrrolidone). In Engineering of Biomaterials for Drug Delivery Systems: Beyond Polyethylene Glycol; Elsevier Inc.: Amsterdam, The Netherlands, 2018; pp. 255–272. ISBN 9780081017517. [Google Scholar]
- Brady, J.; Dürig, T.; Lee, P.I.; Li, J.-X. Polymer Properties and Characterization. In Developing Solid Oral Dosage Forms; Academic Press: Cambridge, MA, USA, 2017; pp. 181–223. ISBN 9780128024478. [Google Scholar]
- Hiremath, P.; Nuguru, K.; Agrahari, V. Material Attributes and Their Impact on Wet Granulation Process Performance. In Handbook of Pharmaceutical Wet Granulation: Theory and Practice in a Quality by Design Paradigm; Elsevier: Amsterdam, The Netherlands, 2019; pp. 263–315. ISBN 9780128104606. [Google Scholar]
- Ruiz-Picazo, A.; Lozoya-Agullo, I.; González-Álvarez, I.; Bermejo, M.; González-Álvarez, M. Effect of Excipients on Oral Absorption Process According to the Different Gastrointestinal Segments. Expert Opin. Drug Deliv. 2020. [Google Scholar] [CrossRef] [PubMed]
- Dou, L.; Mai, Y.; Madla, C.M.; Orlu, M.; Basit, A.W. P-Glycoprotein Expression in the Gastrointestinal Tract of Male and Female Rats Is Influenced Differently by Food. Eur. J. Pharm. Sci. 2018, 123, 569–575. [Google Scholar] [CrossRef] [PubMed]


| Excipients | Reference | Test |
|---|---|---|
| Yellow Iron Oxide | ✓ | |
| Pregelatinized Corn Starch | ✓ | |
| Crospovidone | ✓ | |
| Povidone | ✓ |
| Ratio | CI (%) | |
|---|---|---|
| Cmax | 1.12 | 100.15–126.08 |
| AUC | 1.05 | 95.23–115.09 |
| Fasted-State Test Conditions | GISStomach | GISDuodenum | GISJejunum |
|---|---|---|---|
| Dissolution Media | Simulated Gastric Fluid (SGF), pH 2.0, 0.01 M HCl + 34.2 mM NaCL | Phosphate Buffer 50 mM pH 6.5 | / |
| Initial Volumes | 50 mL SGF + 250 mL of water | 50 mL | / |
| Secretions | 1 mL/min of SGF | 1 mL/min of Phosphate Buffer 100 mM pH 6.5 | / |
| USP | RPM | pH | Similarity |
|---|---|---|---|
| Baskets | 100 rpm | 1.2 | Similar |
| 4.5 | Similar | ||
| 6.8 | Similar | ||
| Paddles | 50 rpm | 1.2 | Similar |
| 4.5 | No similar (f2 = 25.5) | ||
| 6.8 | No similar (f2 = 22.8) |
Publisher’s Note: MDPI stays neutral with regard to jurisdictional claims in published maps and institutional affiliations. |
© 2022 by the authors. Licensee MDPI, Basel, Switzerland. This article is an open access article distributed under the terms and conditions of the Creative Commons Attribution (CC BY) license (https://creativecommons.org/licenses/by/4.0/).
Share and Cite
González-Álvarez, I.; Sánchez-Dengra, B.; Rodriguez-Galvez, R.; Ruiz-Picazo, A.; González-Álvarez, M.; García-Arieta, A.; Bermejo, M. Exploring a Bioequivalence Failure for Silodosin Products Due to Disintegrant Excipients. Pharmaceutics 2022, 14, 2565. https://doi.org/10.3390/pharmaceutics14122565
González-Álvarez I, Sánchez-Dengra B, Rodriguez-Galvez R, Ruiz-Picazo A, González-Álvarez M, García-Arieta A, Bermejo M. Exploring a Bioequivalence Failure for Silodosin Products Due to Disintegrant Excipients. Pharmaceutics. 2022; 14(12):2565. https://doi.org/10.3390/pharmaceutics14122565
Chicago/Turabian StyleGonzález-Álvarez, Isabel, Bárbara Sánchez-Dengra, Raquel Rodriguez-Galvez, Alejandro Ruiz-Picazo, Marta González-Álvarez, Alfredo García-Arieta, and Marival Bermejo. 2022. "Exploring a Bioequivalence Failure for Silodosin Products Due to Disintegrant Excipients" Pharmaceutics 14, no. 12: 2565. https://doi.org/10.3390/pharmaceutics14122565