Article

Physicochemical Characterization of a Co-Amorphous Atorvastatin-Irbesartan System with a Potential Application in Fixed-Dose Combination Therapy

1
Chair and Department of Pharmaceutical Technology, Poznan University of Medical Sciences, 60-780 Poznan, Poland
2
School of Pharmacy and Pharmaceutical Sciences, Trinity College Dublin, College Green, 2 Dublin, Ireland
3
Department of Biophysics, Poznan University of Medical Sciences, 60-780 Poznan, Poland
4
Department of Chemistry, Rzeszow University of Technology, 35-959 Rzeszow, Poland
5
Chair and Department of Organic Chemistry, Poznan University of Medical Sciences, 60-780 Poznan, Poland
*
Author to whom correspondence should be addressed.
Pharmaceutics 2021, 13(1), 118; https://doi.org/10.3390/pharmaceutics13010118
Submission received: 26 December 2020 / Revised: 13 January 2021 / Accepted: 14 January 2021 / Published: 18 January 2021

Abstract

:
The aim of this study was to characterize a 1:1 molar ratio of a pharmacologically relevant co-amorphous atorvastatin-irbesartan (ATR-IRB) system obtained by quench cooling of the crystalline ATR/IRB physical mixture for potential use in the fixed-dose combination therapy. The system was characterized by employing standard differential scanning calorimetry (DSC), Fourier transform-infrared spectroscopy (FT-IR), and intrinsic dissolution rate studies. Quantum mechanical calculations were performed to obtain information regarding intermolecular interactions in the studied co-amorphous ATR-IRB system. The co-amorphous formulation showed a significant improvement in the intrinsic dissolution rate (IDR) of IRB over pure crystalline as well as its amorphous counterpart. An unusual behavior was observed for ATR, as the IDR of ATR in the co-amorphous formulation was slightly lower than that of amorphous ATR alone. Short-term physical aging studies of up to 8 h proved that the ATR-IRB co-amorphous system remained in the amorphous form. Furthermore, no physical aging occurred in the co-amorphous system. FT-IR, density functional theory calculations, and analysis of Tg value of co-amorphous system using the Couchman–Karasz equation revealed the presence of molecular interactions between APIs, which may contribute to the increased physical stability.

Graphical Abstract

1. Introduction

The principal cause of death in developed countries is attributed to cardiovascular diseases (CVDs). CVDs are the disorders of heart and blood vessels, including heart failure, coronary heart disease, hypertension, cerebrovascular disease, or congenital heart disease [1].
High blood pressure, as well as low-density lipoprotein cholesterol, increased levels of serum homocysteine, and platelet aggregation resulting from smoking, lack of exercise, and poor eating habits are considered as key risk factors for CVDs. These factors frequently co-exist and increase the risk of diseases described above. One of the recently implemented strategies to treat CVDs is to address multiple risk factors simultaneously, for example, by introducing a fixed-dose combination (FDC), i.e., a combination of drugs in one dosage form [1]. Such a combination may contain a statin and a blood pressure lowering agent.
Atorvastatin (ATR) belongs to inhibitors of 3-hydroxy-3-methyl-glutaryl-coenzyme A (HMG-CoA) reductase. The mechanism of action is the catalysis of the conversion of HMG-CoA to mevalonate in cholesterol biosynthesis. ATR is administered orally for the treatment of hypercholesterolemia. Irbesartan (IRB) is a specific competitive antagonist of the angiotensin II receptor (AT1 subtype) of the nonpeptide type and, like ATR, is given orally for the treatment of hypertension or heart failure. ATR and IRB in a fixed-dose combination formulation have already been proven to deliver significant benefits for the patients [2]. ATR and IRB belong to class II of drugs according to the Biopharmaceutics Classification System (BCS), i.e., have low solubility and high permeability [3,4,5]; thus, the solubility and the dissolution rate of IRB and ATR are considered as key features limiting their oral bioavailability. ATR is currently used in formulations in a crystalline or an amorphous form [6], whereas IRB is formulated as a crystalline form. Two polymorphic forms, i.e., form A and form B of IRB have been distinguished, with form A being the better soluble form in comparison to form B, and the former is formulated as solid dosage forms [7]. It has also been established that IRB shows high variability in terms of oral bioavailability [8].
Various methods to improve solubility and also dissolution rates have been proposed and evaluated [5,9]. One of them is the use of an amorphous form of a drug instead of the crystalline phase [10]. In the amorphous state, the dissolution process can be faster due to vastly diminished intermolecular interactions [11]. On the other hand, amorphous materials may recrystallize upon storage, and this is because the internal energy of amorphous solids is higher compared to their crystalline counterparts. It is well known that the interactions between the molecules are stronger within the crystal lattice [12]. One of the methods to overcome this stability issue is to use polymers to form polymeric amorphous solid dispersions (PASD) [13]. However, the use of polymers in PASD has many disadvantages [13]. Their application is limited due to long-term stability issues and processing into dosage forms [13]. Polymers used in PASDs are often hygroscopic. Thus, water sorbed during storage or processing may act as a plasticizer, reducing the glass transition temperature, leading to phase separation and recrystallization [14]. In addition, limited miscibility of the drugs with polymer necessitates a high amount of polymeric material to be combined with the API, increasing final dosage form, especially for high dose drugs [15].
There is an interesting alternative to PASD without the aforementioned drawbacks. The improvement in the dissolution rate and stability of amorphous APIs can be achieved by combining amorphous drugs into one single-phase system called a co-amorphous system (CAM) [16,17]. This approach has become regarded as promising, especially in relation to the forming of drug-drug CAM, which can be administered as a combination therapy (FDC). The reported co-amorphous systems have been found to increase both the dissolution rates and stability of the component APIs [16,17,18,19]. In some cases, those phenomena have been attributed to molecular interactions between the two drugs present in the system [12,13,14]. The identification of possible intermolecular interactions between APIs and their impact on stability and dissolution is critical during the formulation of amorphous binary systems [1,16,17]. The following phenomena have been suggested as potentially responsible for the enhanced stability: anti-plasticization effect (elevation of glass transition temperature) and reduced molecular mobility as well as intermolecular interactions between the APIs in the system [20,21,22,23,24,25,26,27].
The aim of this study was to characterize the 1:1 molar ratio of a co-amorphous API-API system obtained by quick cooling of the physical mixture melt for the potential use in an FDC. Atorvastatin and irbesartan were chosen as model compounds to formulate the co-amorphous system. There have been several attempts to improve the solubility of ATR and IRB by both solid dispersion [3,5,28,29,30,31] and co-amorphous formulation [27,32,33,34,35]. ATR and IRB were chosen as model compounds for several reasons. Both are poorly soluble BCS class II drugs [3,4,5,6]. Amorphous IRB has a relatively low glass transition temperature (Tg) and undergoes a physical aging process at 25 °C (becomes more structurally ordered with time) [36], which may potentially change its physicochemical properties [37,38,39]. ATR has a high Tg [6], which may be used to elevate the low Tg of IRB (anti-plasticization effect) in the co-amorphous combination. Both ATR and IRB are strong glass-forming agents [6,36] with meting points close to each other, i.e., 160–185 °C and are thermally stable at this temperature, thus, it is possible to formulate them into co-amorphous phases using the fast cooling of the melt method. The simultaneous administration of both APIs as an FDC has already been demonstrated as being beneficial for the patients [2].
The co-amorphous system was characterized using a panel of techniques including thermogravimetric analysis (TGA), standard differential scanning calorimetry (DSC), Fourier transform-infrared spectroscopy (FT-IR), and intrinsic dissolution rate studies. Quantum mechanical calculations were also performed to evaluate the possible intermolecular interactions in the co-amorphous ATR-IRB complexes, to ascertain the most favorable formations and support the outcomes of the dissolution studies.

2. Materials and Methods
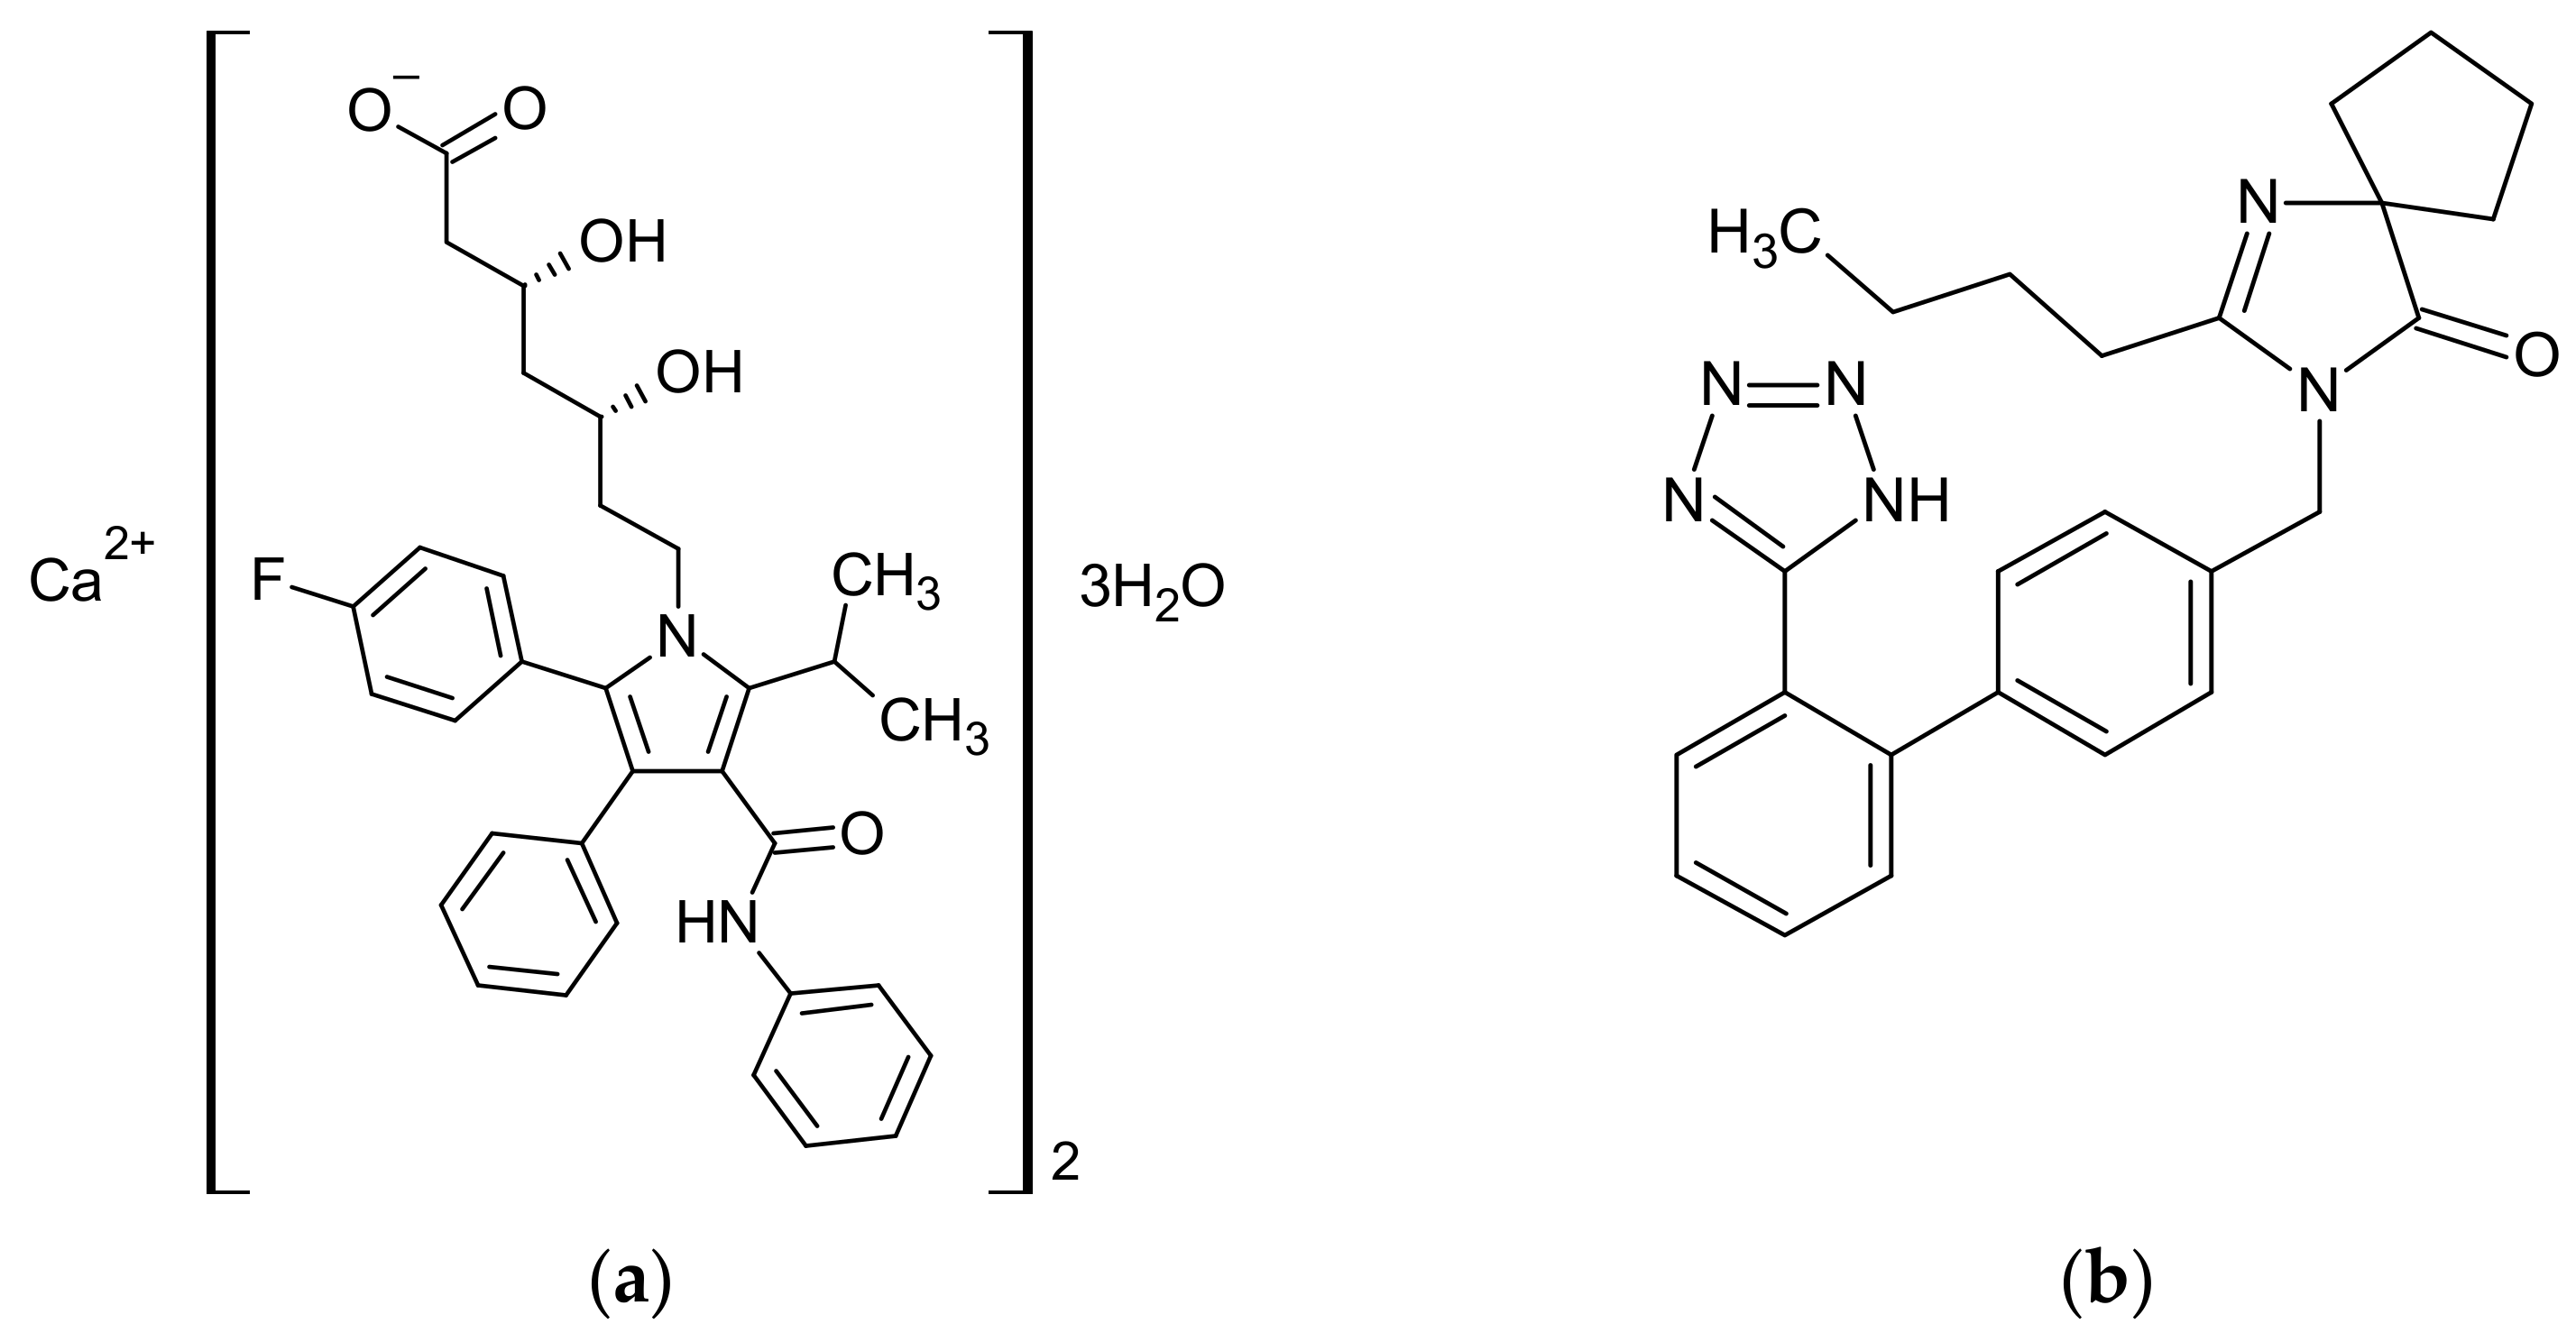
2.1. Materials

Atorvastatin (ATR; crystalline; in the form of trihydrate, pharmaceutical-grade; Figure 1a) was obtained from Biopharm, Poznań, Poland and used “as is”. Its amorphous form (form AM) was prepared immediately prior to characterization in situ in the DSC pan or on a hot plate (Magnetic stirrer RCT basic, IKA-Werke GmbH & Co. KG, Staufen, Germany) by heating the sample on aluminum foil to 185 °C, holding for 5 min followed by cooling at approximately 5 °C min−1 to room temperature.
Irbesartan (IRB, crystalline; pharmaceutical-grade; Figure 1b) was obtained from Polpharma, Stargard Gdański, Poland and used “as is”. Its amorphous form (form AM) was prepared immediately prior to characterization in situ in the DSC pan, or on a hot plate (Magnetic stirrer RCT basic, IKA-Werke GmbH & Co. KG, Staufen, Germany) by heating the sample on aluminum foil to 185 °C, holding for 5 min followed by cooling at approximately 5 °C min−1 to room temperature.

2.2. Preparation of Amorphous Binary Systems

Physical mixtures of 1:1 mol/mol IRB/ATR (73:27 w/w) and 50:50, 80:20, and 20:80 (w/w) were prepared by mixing APIs in a glass mortar with a piece of plastic film for 20 min. Co-amorphous samples were prepared by heating the binary physical mixtures immediately prior to characterization in situ in the DSC pan to 185 °C and cooling to 20 °C at a 10 °C min–1 rate, or on a hot plate (Magnetic stirrer RCT basic, IKA-Werke GmbH & Co. KG, Staufen, Germany) by heating sample on the aluminum foil to 185 °C, holding for 5 min followed by cooling at approximately 5 °C min−1 to room temperature.

2.3. Thermogravimetric Analysis

TGA curves were obtained using a Mettler-Toledo TGA/DSC1 instrument or a Perkin Elmer Pyris 1 TGA under a nitrogen gas flow 60 mL min−1. Powdered samples weighing 2–20 mg were placed in an opened ceramic pan and heated at a rate of 10 °C min−1 from 25 to 600 °C.

2.4. Differential Scanning Calorimetry

DSC curves were obtained using a DSC Q1000 TA Instrument Inc., v9.9 Build 303 (New Castle, DE, USA) or a DSC 821 Mettler-Toledo (Greifensee, Switzerland) under a nitrogen gas flow of 50 and 60 mL min−1, respectively. Sample (1–10 mg) were crimped in a hermetic aluminum pan and heated at 10 °C min−1 from 20 to 190 °C. Next, the samples were cooled down at 10 °C min−1 to 20 °C and reheated to 190 °C in a second run.
The enthalpy relaxation change after isothermal physical aging was determined as a function of aging time. The amorphous samples were first heated to 190 °C to eliminate the effect of prior thermal history and then cooled at 10 °C min−1 below the glass transition temperature to the aging temperature (Ta = 45 °C). The samples were kept at Ta for 1 and 8 h, and then cooled at 10 °C min−1 to 20 °C. A subsequent heating scan at 10 °C min−1 to 190 °C provides the data for the aged samples.
The temperature and enthalpy were calibrated with indium (m. p. = 156.65 °C, Δfush = 28.45 J g−1) [40], and at least two measurements were completed for each sample. Melting was quoted as an onset temperature. Glass transition temperature was quoted as the midpoint of heat capacity between the liquid and glassy states [40]. All values were determined using TA Universal Analysis 2000 v4.5A (New Castle, DE, USA) or Mettler-Toledo STARe SW v10.0 (Greifensee, Switzerland) software. Errors are quoted as one standard deviation.

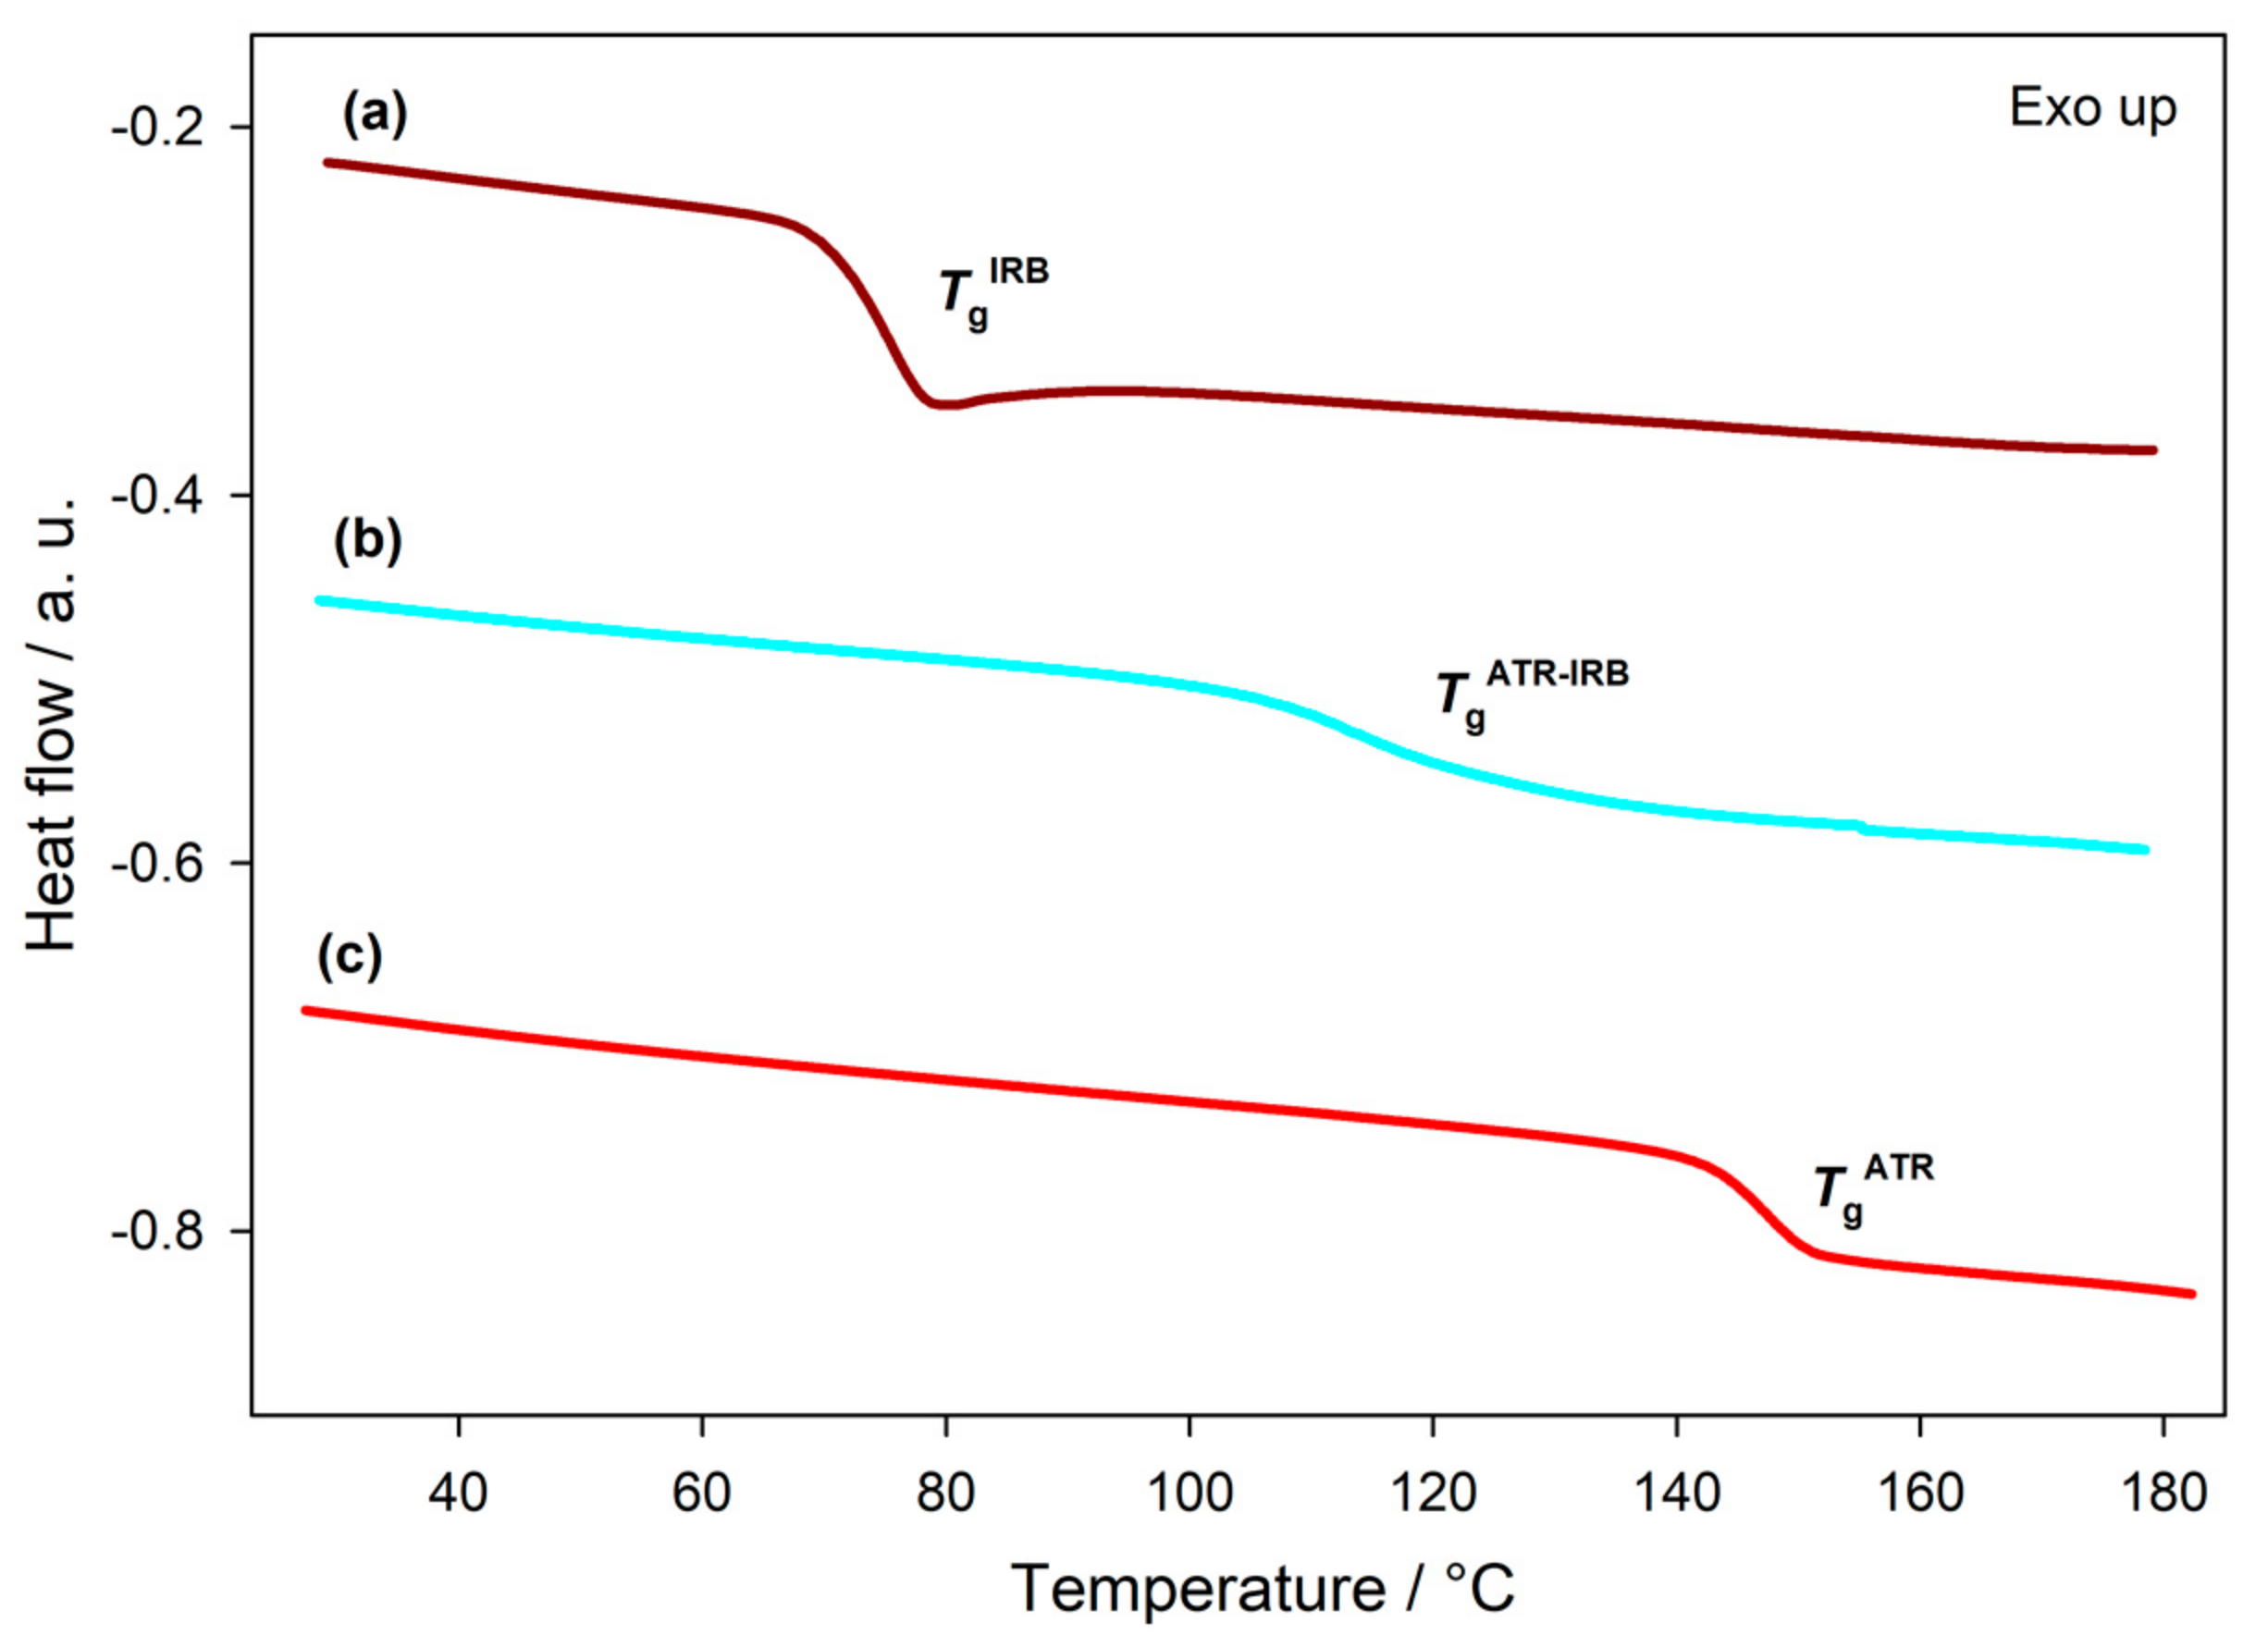
2.5. Determination of the Theoretical Tg Value Using Couchman-Karasz Equation

The experimental value of glass transition for the co-amorphous system was compared with the predicted Tg calculated from the Couchman–Karasz equation [41]:
T g 12 = w 1 T g 1 + K w 2 T g 2 w 1 +   K w 2
where Tg12 is the Tg of the co-amorphous mixture, Tg1 and Tg2 are the Tg of the individual components, w1 and w2 are the weight fractions, and K is a constant and is given by the equation:
K = Δ c p 2 Δ c p 1
where Δcp is the change in the heat capacity at Tg.

2.6. Fourier Transform-Infrared Spectroscopy Measurements

Fourier transform infrared spectroscopy was carried out using an Alpha Bruker FT-IR spectrometer (Billerica, MA, USA) in KBr pellets. Spectra were recorded at room temperature from 4000 to 500 cm−1 collecting 64 scans with a resolution of 2 cm−1.

2.7. Computational Section

The initial structures of IRB and ATR to generate the ATR-IRB complexes were taken from the Cambridge Structural Database (CCDC), structure NOZWII for IRB [42], and structure IZOQIZ for ATR [43]. For quantum-mechanics calculations, the density functional theory (DFT) formalism was applied [44]. The density functional calculations were carried out and optimized for four complex geometries at the DFT level of theory using the Gaussian G16 A.01 software (Gaussian Inc., Wallingford, CT, USA) [45] and very tight criteria as well as the most commonly used global hybrid generalized gradient approximation B3LYP functional (B3LYP/6-31G(d,p) approach with additional keywords “empiricaldispersion = gd3bj iop (3/174 = 1000000, 3/175 = 1988900, 3/177 = 398100, 3/178 = 4421100)” in the input file) [46] and a pure functional, B97, with the Grimme’s D3BJ dispersion (B97D3/6-31G(d,p) approach with additional keywords “empiricaldispersion=gd3bj” in the input file [47] in the gaseous phase were used. The ideal gas, rigid rotor, and harmonic oscillator approximations were applied to calculate the vibrational frequencies and thermodynamic properties. No imaginary frequencies within the vibrational spectra were obtained and therefore confirmed the energy minimum for all compounds (ATR calcium and IRB as tetrazole tautomer 1H and 2H) and ATR-IRB complexes (Cartesian coordinates of all considered compounds are given in the Supplementary Materials). The interaction energy of all optimized complexes was calculated by applying the counterpoise corrected (CP) method [48] based on the basis set superposition error (BSSE) [49] at B3LYP/6-311++G(d,p) or B97D3/6-311++G(d,p) levels of theory. The complexes with the lowest resulted interaction energy were analyzed by applying molecular electrostatic potential (MEP) computations together with Quantum Theory Atoms-In-Molecules (QTAIM) approach at B3LYP/6-311++G(d,p) or B97D3/6-311++G(d,p) levels of theory. The AIMAll v14.11.23 Professional package [50] for topological analysis was used for QTAIM calculations [51]. For this purpose, the “Proaim” basin integration approach was employed using “superfine” interatomic surface mesh and “very high” outer angular quadrature. The atomic (integrated) Laplacian values allowed for monitoring the accuracy of basin integrations. Furthermore, the Poincarè-Hopf rule was satisfied for all carried out calculations. The ρ, ∇2ρ parameters at the bond critical points (BCPs) concerning dipole polarizability tensors were calculated based on the optimized structures (taking into consideration the already calculated interaction energy). With the use of the generated wavefunction (*.wfn) files Reduced Density Gradient (RDG) [52] as well as Interaction Region Indicator (IRI = [ρ(r)]a/(|∇ρ|) + b); where a and b correspond to “uservar” and “uservar2” in settings.ini file (Multiwfn 3.7 software; Beijing Kein Research Center for Natural Sciences, Beijing, China) [53,54], respectively; if “uservar” is 0, a is set to the recommended value 1.1, while if “uservar2” is 0, then b is set to the recommended value 0.0005) parameters (Multiwfn 3.7 software from the Beijing Kein Research Center for Natural Sciences, default settings) were calculated. The computations of the RDG and IRI factors were carried out for ATR-IRB complexes with the corresponding lowest and highest values of the interaction energy (based on the optimized geometries using B3LYP and B97D3 functionals). For free energy of solvation calculations of complexes V and VII, the Truhlar’s Solvation Model Based on Density (SMD) [55] as well as the M062X/6-31G(d,p) approach were used.

2.8. Intrinsic Dissolution Testing

The intrinsic dissolution rate (IDR) of the crystalline, amorphous, and co-amorphous (1:1 molar ratio) ATR and IRB samples was measured by the rotating disc method [56] using the Wood’s apparatus in an Erweka DT60 dissolution testing station (ERWEKA GmbH, Langen, Hessen, Germany). A 150 mg of sample was compressed at 1300 psi and held for 40 s in a die to form an 8 mm diameter disc. Dissolution studies were performed in 500 mL of 2% w/v sodium dodecyl sulphate (SDS) in ultra-pure water maintained at a temperature of 37 ± 0.5 °C and using the disk rotation speed of 100 rpm. Dissolution studies were carried out for 120 min and the concentration of API was determined online every 5 min by a UV-Vis spectrophotometer Nicolet Evolution 300 (Thermo Electron Corporation, Waltham, MA, USA) at 228 (IRB signal), 244 (ATR signal), and 344 nm (background correction) based on the dual-wavelength analysis method [57,58]. All measurements were performed in triplicate. IDR, the rate of mass transfer from solid to liquid state when conditions such as surface area, pH, ionic strength, and stirring speed are kept constant, was determined using the following equation [59]:
IDR = C t V S   = k C s  
where C is the drug concentration at time t, V is the volume of the test solution, S is the surface area of the disc, k is intrinsic dissolution rate constant, and Cs is the saturation solubility of the drug. The IDR was calculated from the slope of each curve for a time period of 0–120 min.

3. Results and Discussion

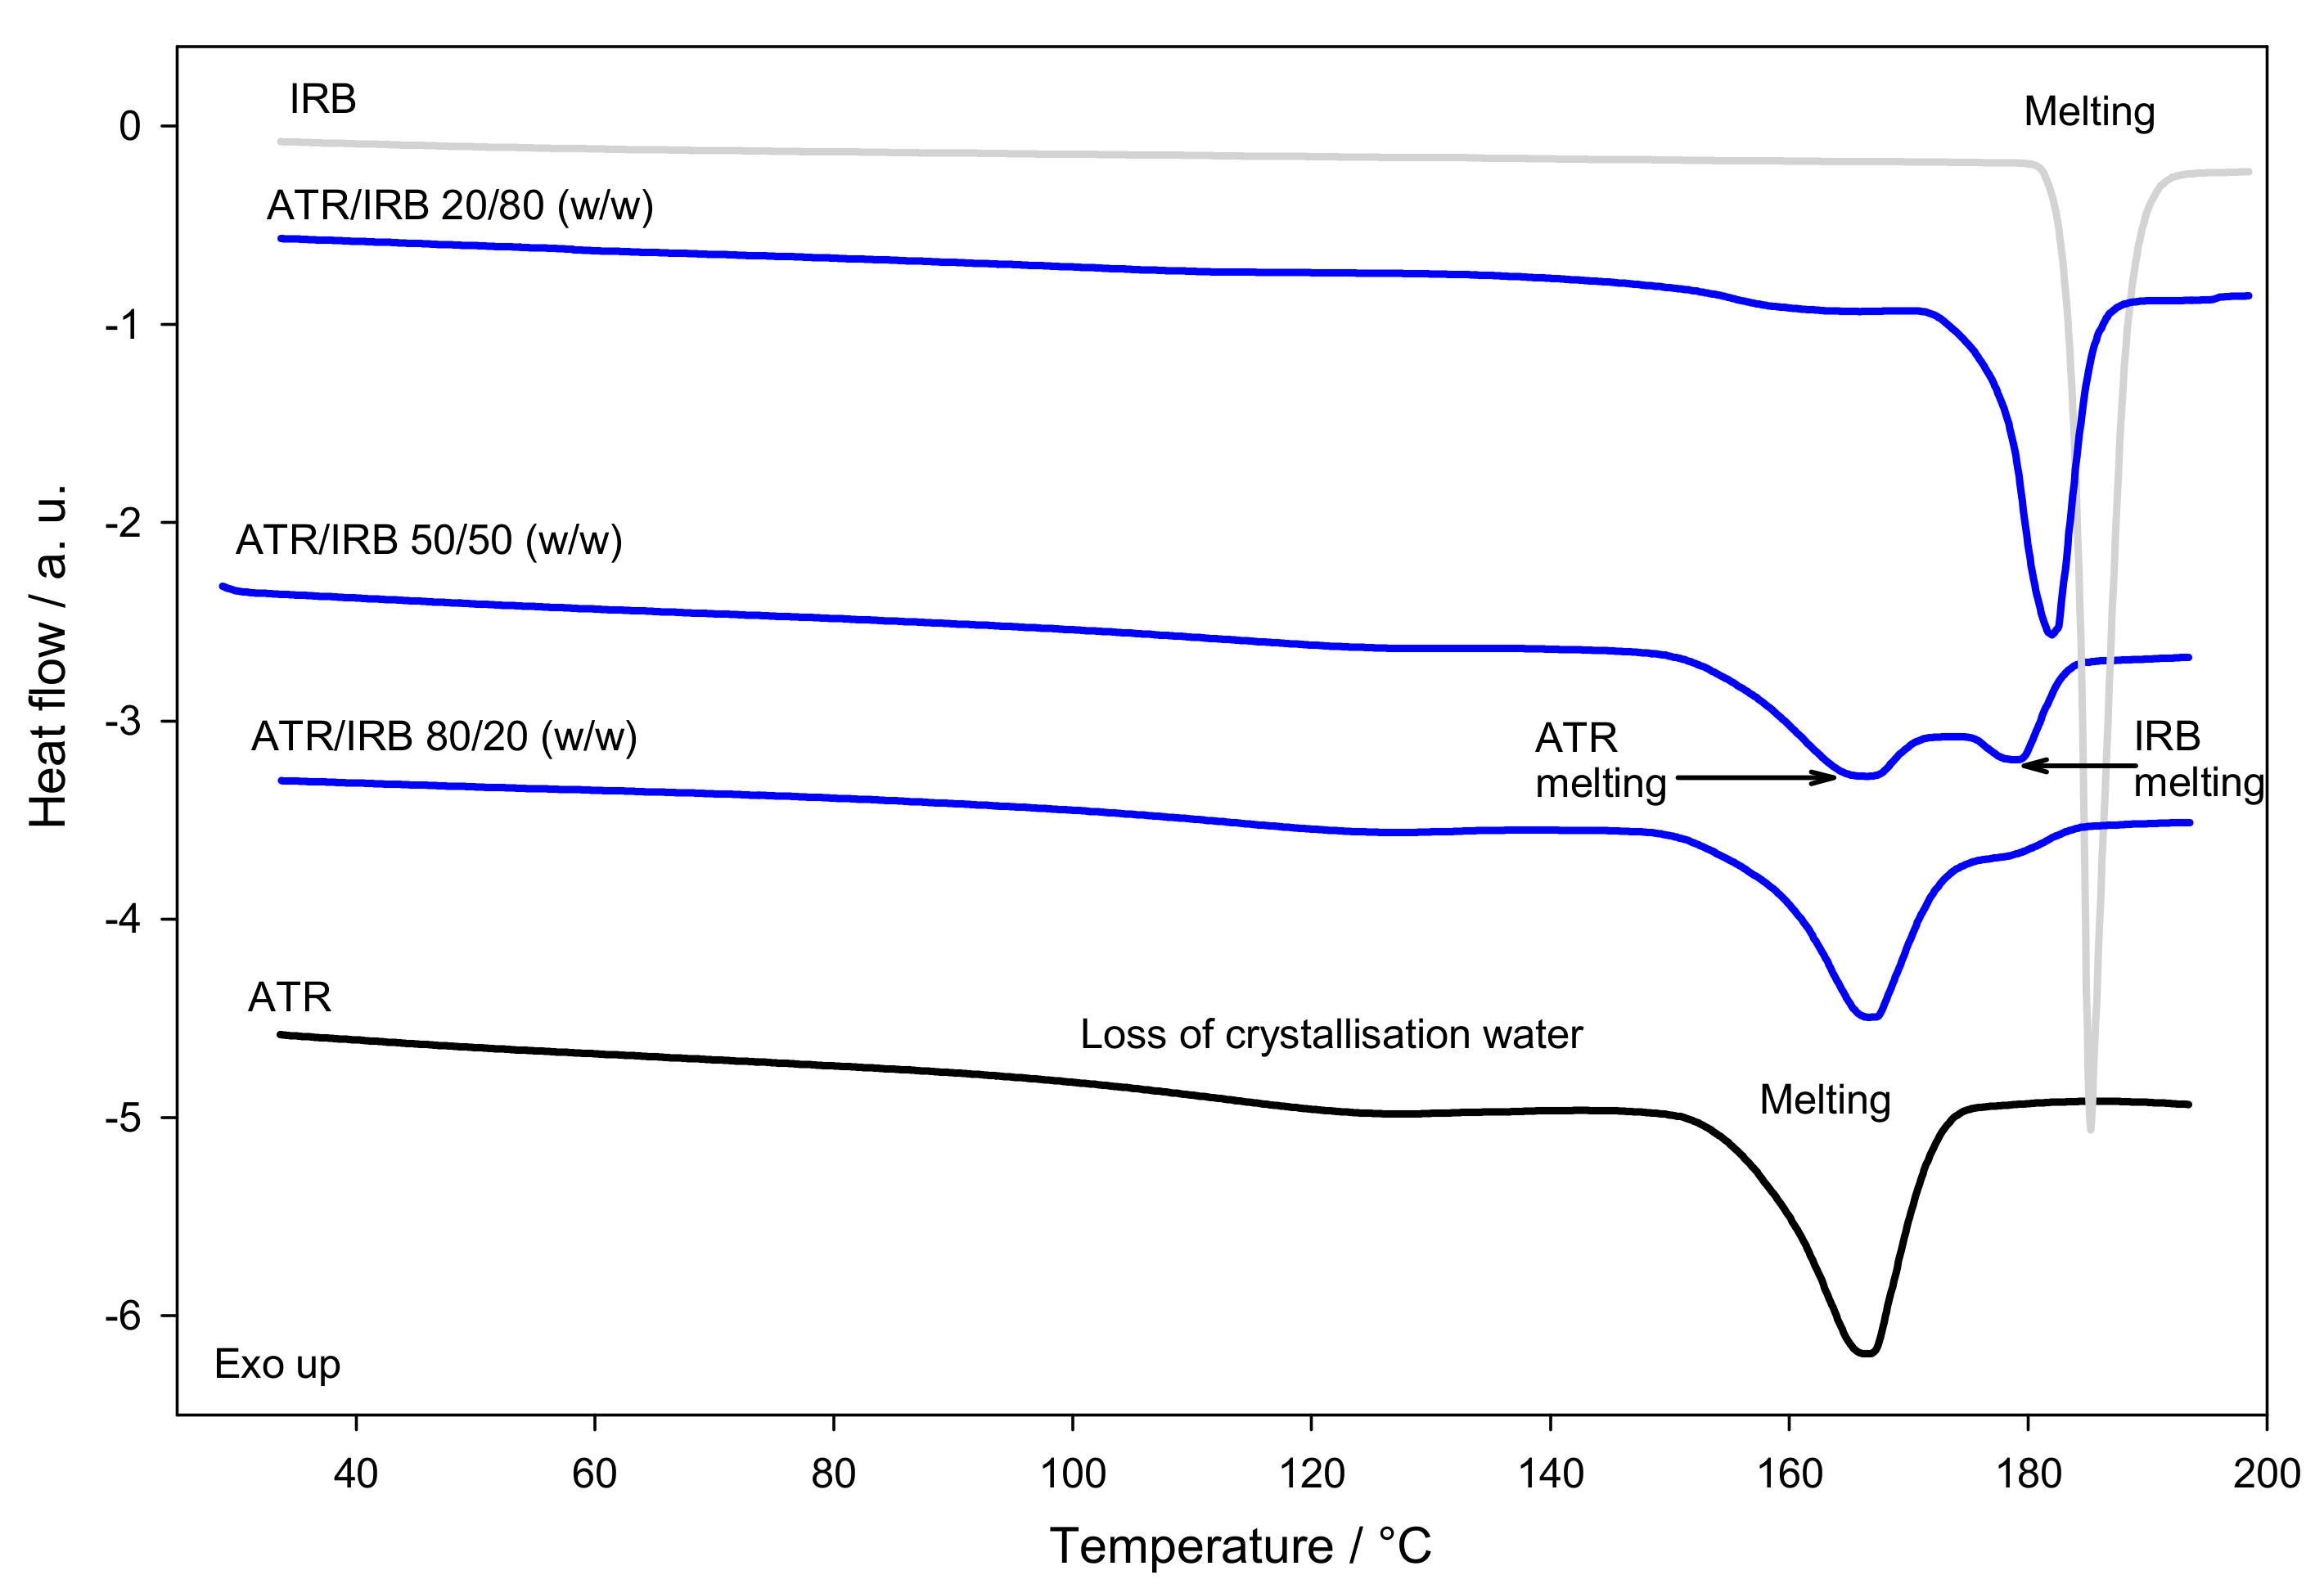
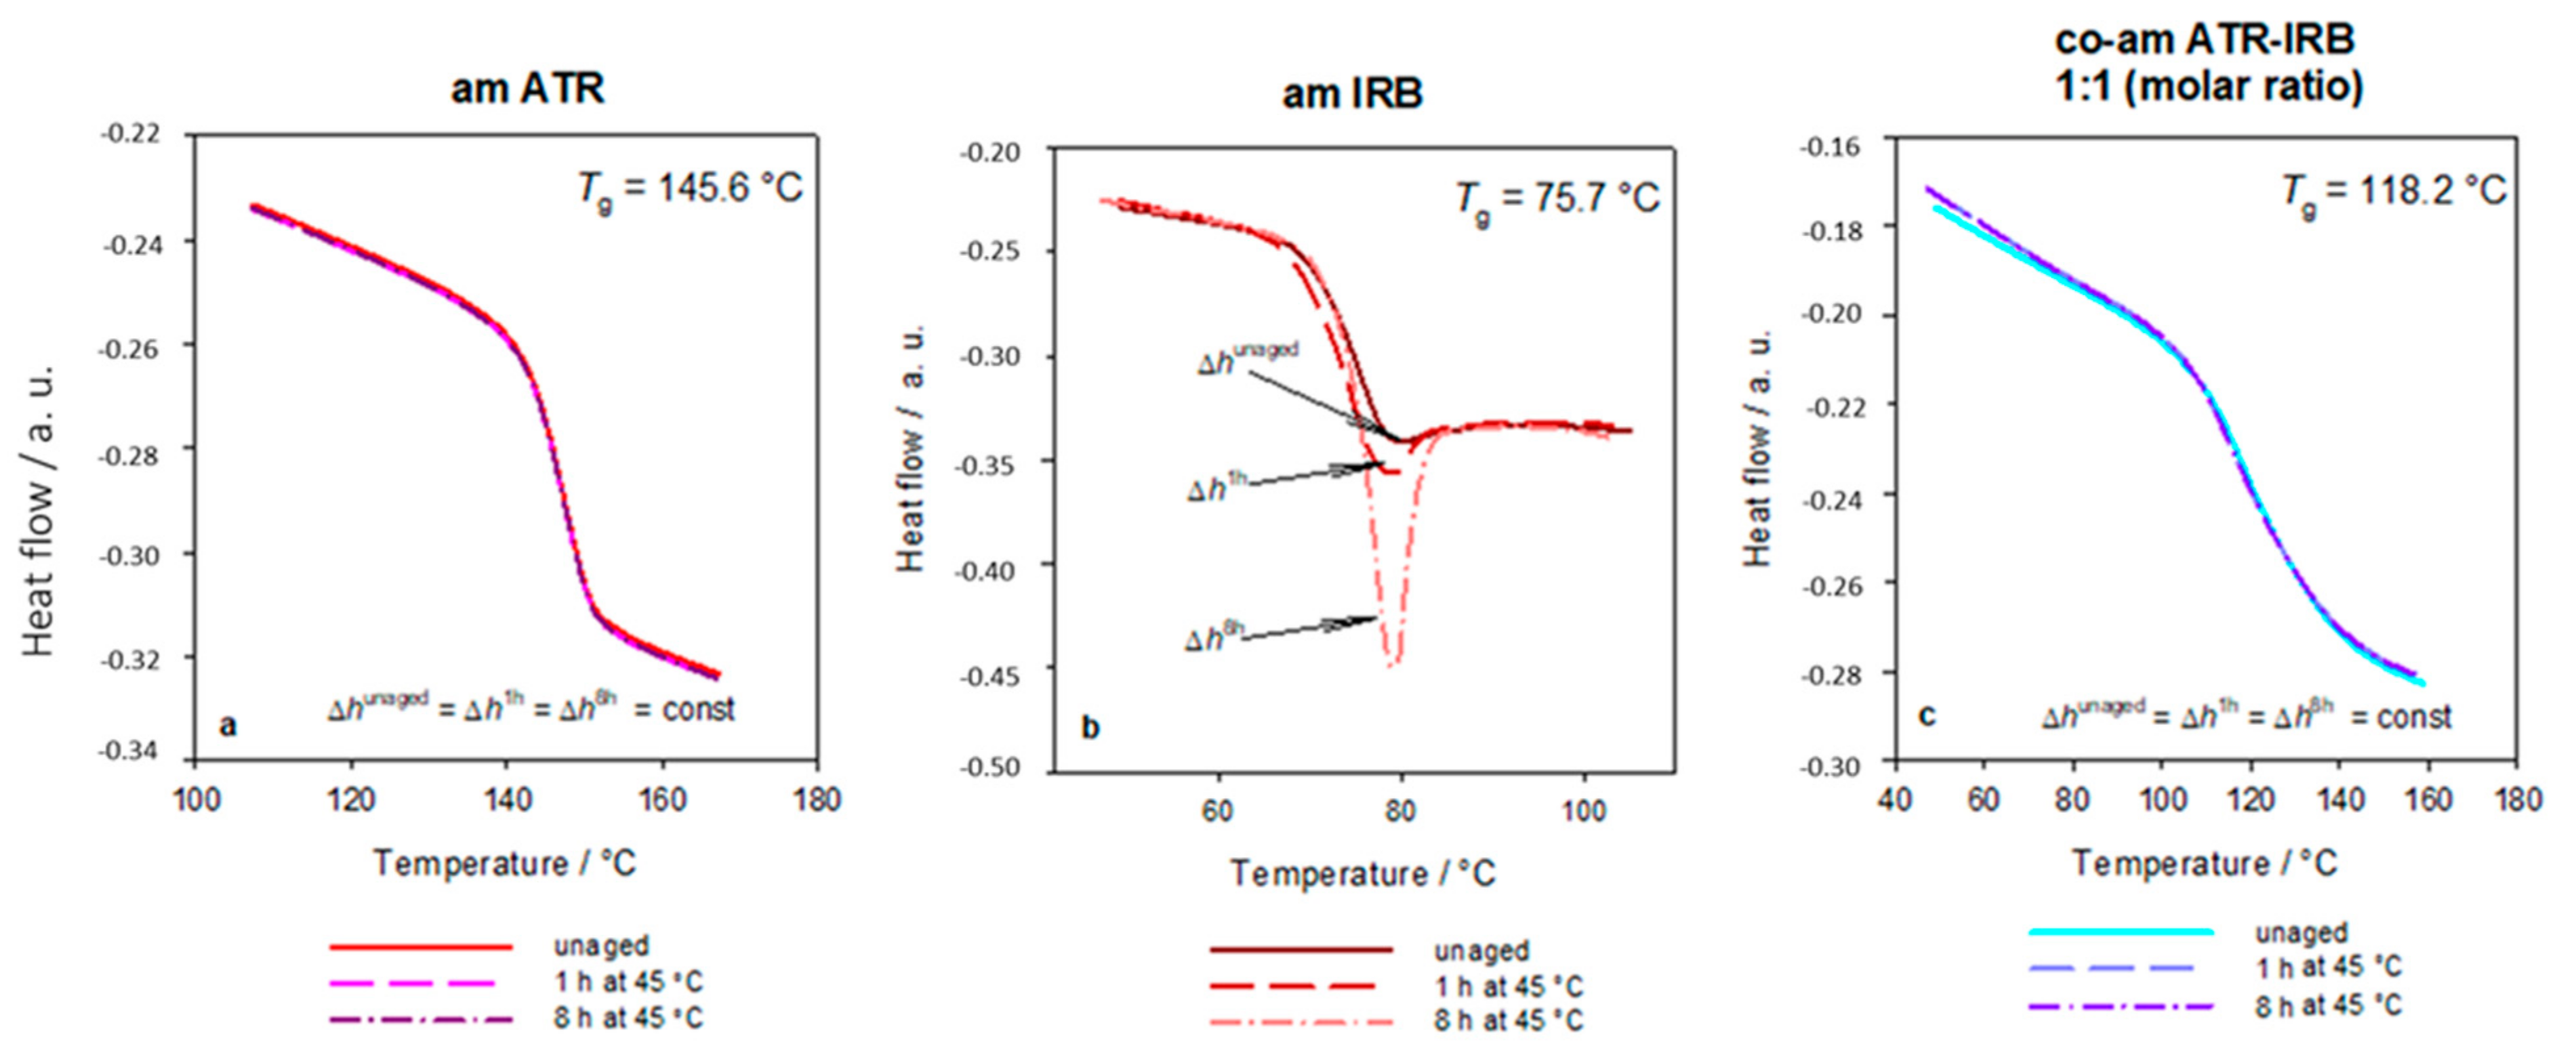
3.1. Thermal Analysis

The identification of possible interactions between APIs in the fixed-dose combination is of paramount importance at an early stage of the formulation development process [1]. Thermal analysis is frequently used to study the drug-drug and drug-excipient compatibility [60,61,62].
TGA curves (Figure S1, Supplementary Materials) of the individual drugs and the 50:50 (w/w) ATR-IRB physical mixture indicate that no degradation due to the interaction between the drugs takes place and that the ingredients change individually in the mixture, thereby suggesting no chemical incompatibility.
Figure 2 shows the standard DSC traces of crystalline ATR, IRB, and the physical mixtures in different concentrations of the investigated materials from 25 to 190 °C at a 10 °C min−1 heating rate. The standard DSC curve of ATR shows two endothermic events, one very broad peak with a maximum at around 113.4 °C corresponding to the loss of crystallization water as ATR is a trihydrate (see TGA, Figure S1, Supplementary Materials). The second event with onset at 150.2 ± 0.9 °C (ΔhATR = 81 ± 3 J g−1) is ascribed to melting. The results were similar to the previously reported, i.e., melting with an onset in the range 141–148 °C and enthalpy of fusion ranged from 81.4–87.1 J g−1 [6].
The standard DSC curve of IRB shows one sharp endothermic peak with an onset at 183.8 ± 0.2 °C and an enthalpy of fusion ΔhIRB = 94.1 ± 0.5 J g−1 due to melting. The results suggest that the investigated IRB is a polymorphic form A [63,64].
To further investigate the compatibility of the drugs, 80/20, 50/50, and 20/80 (w/w) physical mixtures (PMs) of ATR/IRB were investigated. DSC provides information about possible interactions between APIs. These can be assessed depending on the peak appearance, its shift on the temperature scale, disappearance of phase transition peaks and/or differences in the enthalpy values in thermal curves of the components in physical mixtures. The DSC trace of the 80/20 ATR/IRB mixture showed that the melting peak of ATR broadened and shifted to a higher temperature (158.0 ± 0.7 °C) and slightly overlapped with the IRB melting peak. The DSC curve of the ATR/IRB 20/80 physical mixture showed a small endotherm arising from melting of ATR with an onset at 151 ± 1°C and the second endotherm arising from melting of IRB, shifted into the lower temperature (177.9 ± 0.6 °C). In the thermogram of the 50/50 physical mixture ATR/IRB two endothermic events arising from ATR and IRB melting were observed. The clear appearance of both melting peaks and no other events suggest that no chemical interaction takes place in the mixture. However, in all investigated PMs, changes in the melting onset temperature and endotherm peaks of both APIs do occur (Table 1). This may be due to the mixing of components, which results in a decrease in the purity of each component in the mixture, showing as a broadening of the peak. It is expected that the enthalpy and temperature of fusion will change. The effect may also be due to physical interactions present between the components [65,66,67]. For further investigation of the material’s compatibility, FT-IR was applied.
Figure 3 shows the second heating DSC curves for individual APIs and the quench cooled melt of the ATR-IRB 1:1 mol/mol mixture. The glass transition was detected in all systems, whereas the melting endotherm was not observed, indicating the amorphous nature of all systems. For the individual amorphous APIs, Tg values of 145.6 ± 0.9 and 75.7 ± 0.2 °C with the change of heat capacity at Tg, Δcp of 0.39 ± 0.04 and 0.50 ± 0.01 J g−1 K−1 were observed for ATR and IRB, respectively, similar to the values stated in the previous reports [6,64]. On the analysis of the quench cooled melt melted ATR-IRB 1:1 mol/mol mixture, a single Tg at 118 ± 2 °C with the change of heat capacity of 0.34 ± 0.01 J g−1 K−1 was detected, showing that the system is entirely miscible at the molecular level [68].
The glass transition temperature is an important physical parameter of amorphous drugs, as it indicates a boundary between phases of low and high molecular mobility. Therefore, the glass transition temperature may infer the storage conditions of amorphous APIs [11]. The molecules of amorphous API may re-order below the Tg; this process of ordering strongly depends on the storage temperature [10,69]. In the case of the co-amorphous ATR-IRB system, the Tg has increased in comparison to pure IRB (anti-plasticization effect), thus, an increased physical stability is expected [26]. Furthermore, a negative deviation from the Tg predicted using the CK equation is observed (Table 2). This behavior is an indication of non-ideal mixing behavior and a possibility of intermolecular interactions occurring between the APIs [70]. The process of intermolecular reorganizing leading to interactions probably occurs during the heating of the crystalline drugs in the PM as deviations in Tm and Δh of melting in comparison to pure APIs were noted (Table 1).
The disordered structure of an amorphous material stored below its Tg becomes more structurally ordered over time [71], and both total enthalpy and volume are reduced toward the equilibrium state. This phenomenon is called physical aging [72]. The parameter characterizing the process of physical aging is the enthalpy of relaxation, also known as recovery enthalpy [72]. It is known that aged amorphous pharmaceuticals can have different physicochemical properties [37,38,39], and this may depend on the local order of the amorphous structure [73]. Furthermore, it is established that molecular mobility still exists below Tg and is reflected in Johar–Goldstein (JG) or beta relaxations [74]. This molecular mobility may trigger the process of recrystallization. To investigate the possibility of beta relaxation kinetically activating the process of recrystallization at sub-Tg temperatures and a physical aging process, short-term stability studies were performed.
Figure 4 shows the effect of physical aging of pure amorphous APIs and co-amorphous ATR-IRB system. The aging process was assessed by DSC, and the thermograms showed that the enthalpy relaxation overlapped with the change of heat capacity in the glass transition region [75,76]; the difference between an unaged and aged sample is visibly presented in Figure 4b. In general, following the Tg − 50 rule, i.e., the storage at a temperature below 50 °C of Tg may arrest JG relaxations and prevents the recrystallization of an amorphous drug [10,77], but a physical aging process may still occur at that temperature. As IRB can undergo a physical aging process at 25 °C [36], the samples were aged at a higher temperature, i.e., 45 °C, to stimulate a possible aging process in ATR and co-amorphous ATR-IRB. Amorphous ATR, due to its high Tg, did not undergo physical aging. The enthalpy relaxation (Δh) of amorphous IRB has changed from 0.8 J g−1 after 1 h to 3.3 J g−1 after 8 h of aging. It can be noted that IRB exhibits aging during the cooling-reheating process, i.e., enthalpy relaxation can be observed for sample reheated immediately after the cooling. This was confirmed by Temperature-Modulated DSC [40] (Figure S2, Supplementary Materials). In the case of the co-amorphous ATR-IRB, physical aging is not observed after 8 h, most likely indicating slower molecular motions in the co-amorphous system, which might signify increased physical stability despite the presence of IRB in the system [10,69]. Neither a recrystallization exotherm nor a melting endotherm was observed for all aged samples confirming the amorphous nature of all materials after the aging process.

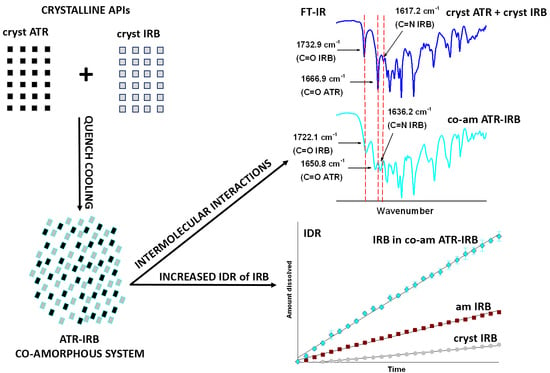
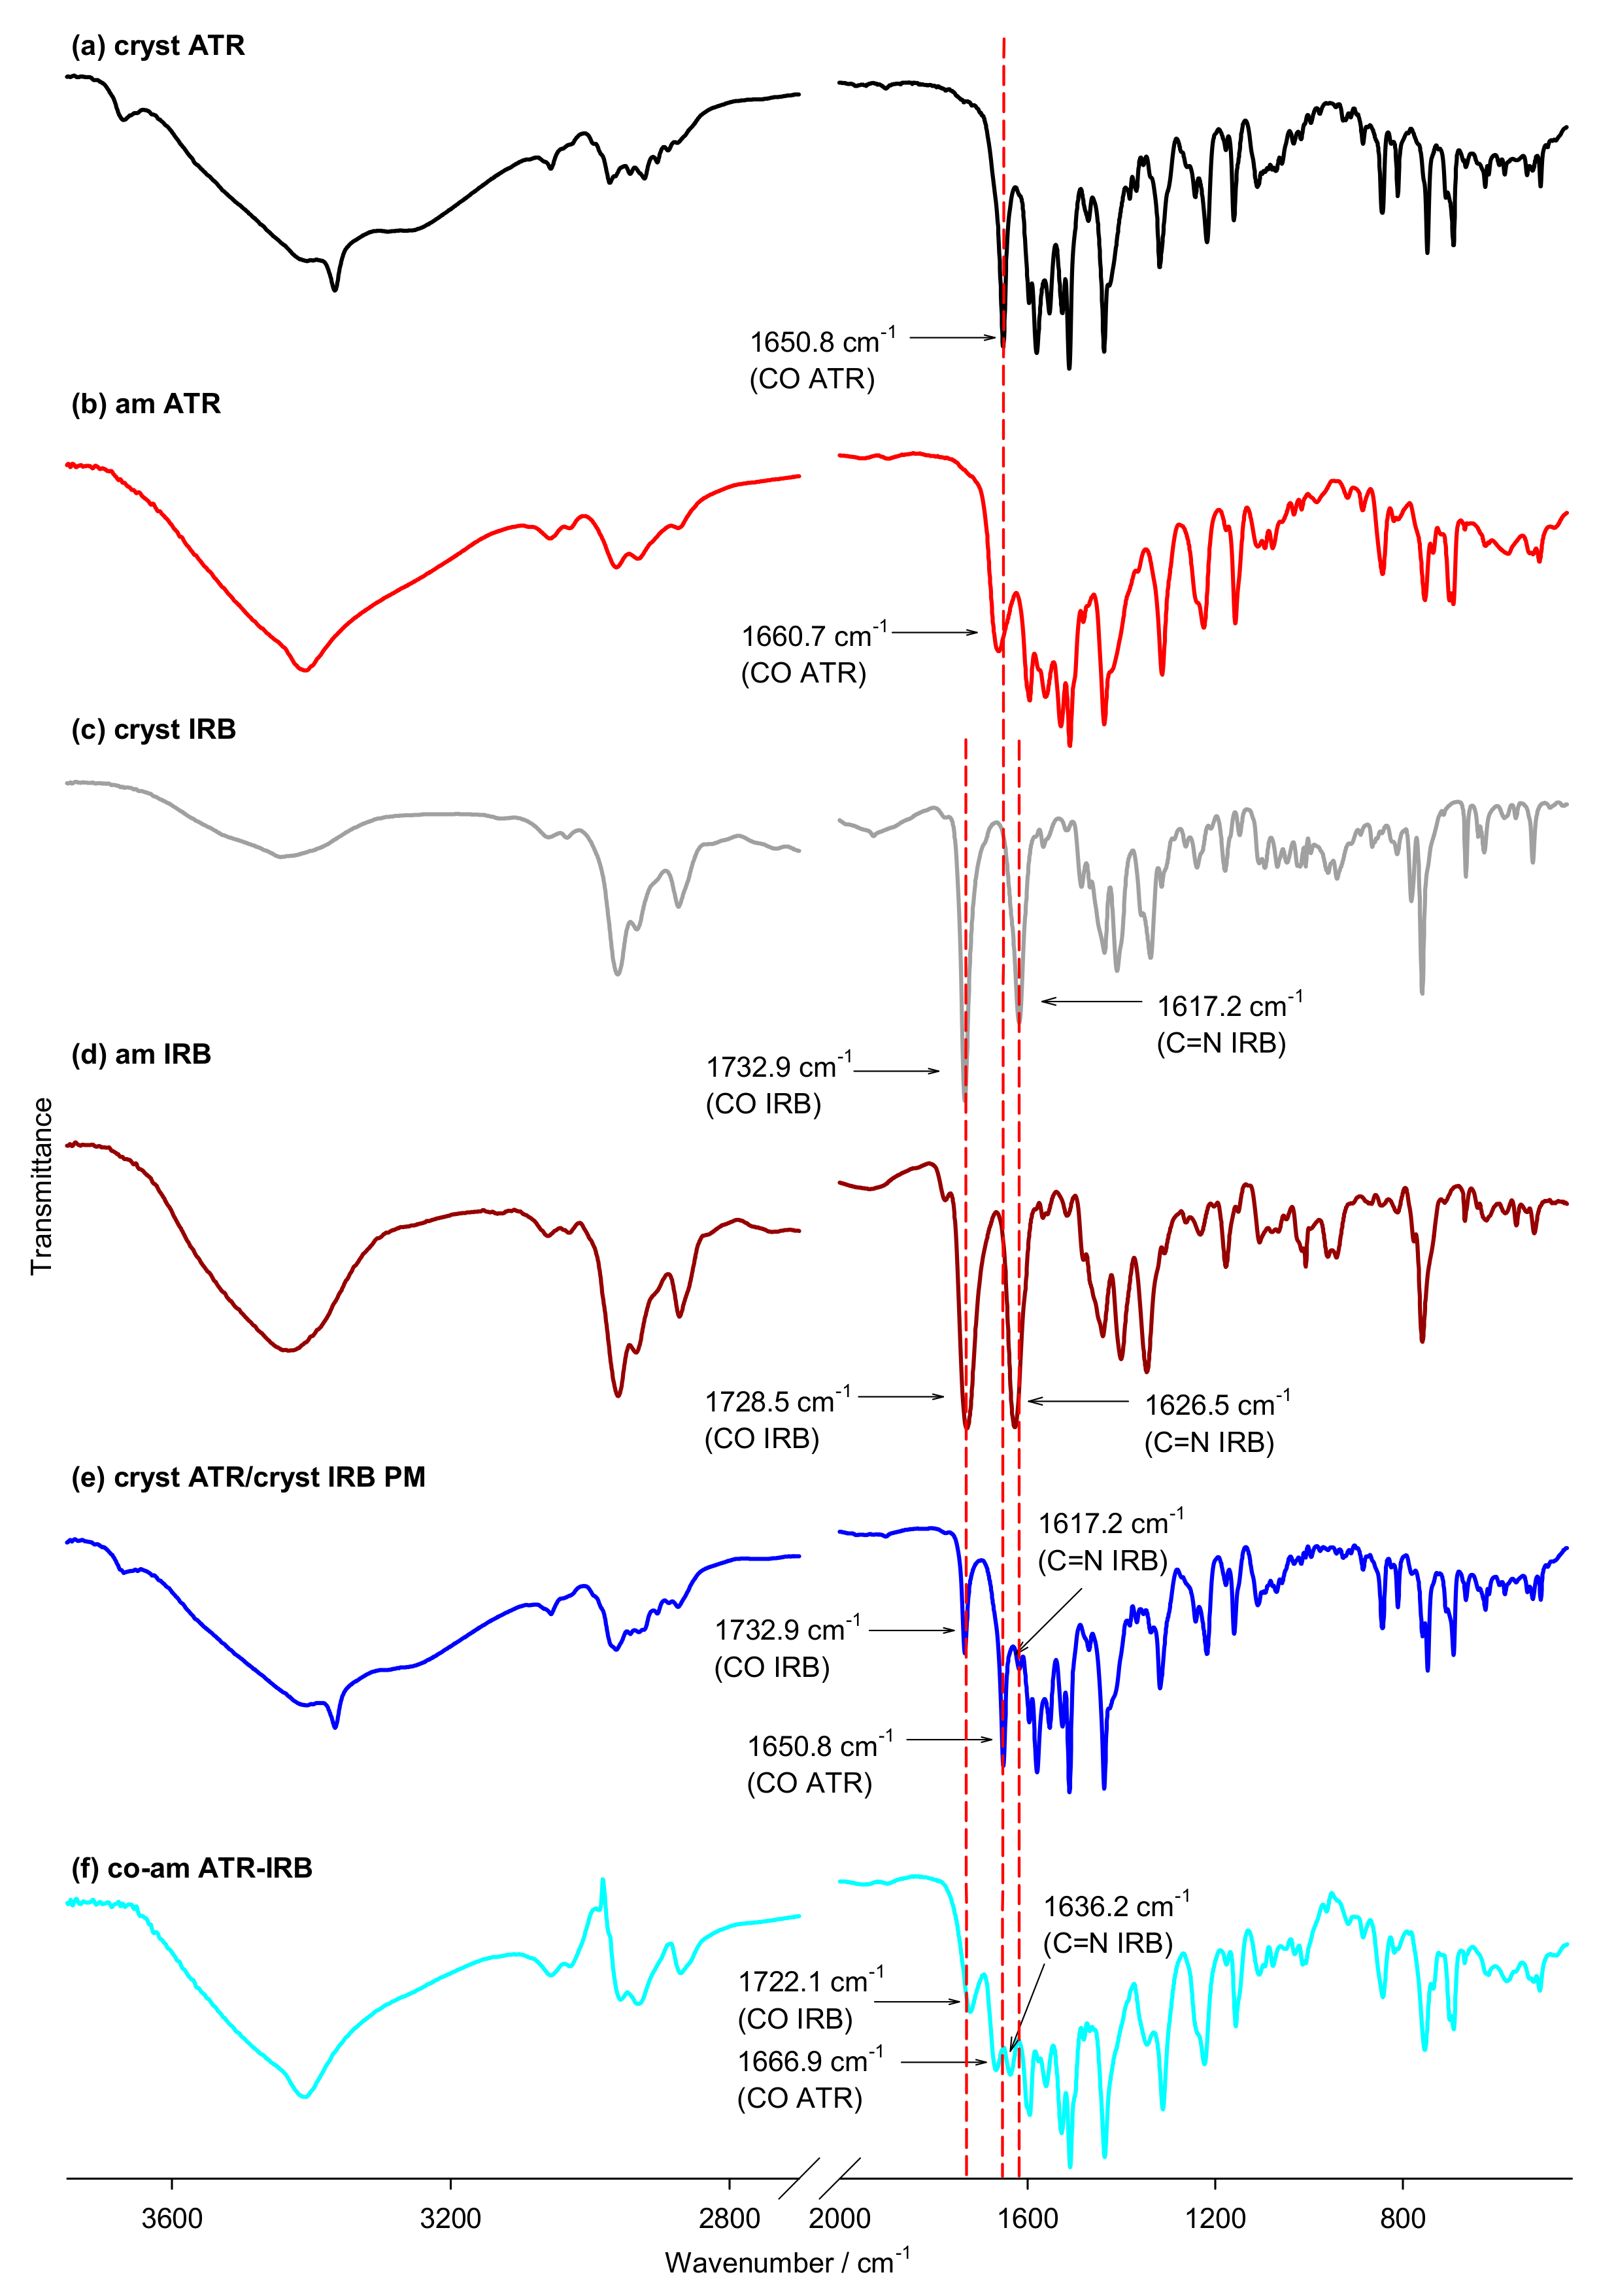
3.2. FT-IR Spectroscopy

FT-IR spectroscopy was used to evaluate interactions between the ATR-IRB system at the molecular level (Figure 5). The measurements revealed clear differences between the crystalline and amorphous ATR and IRB samples. The spectra of amorphous ATR and IBR, in comparison to the crystalline materials, showed peak broadening and band displacements. The carbonyl groups in ATR participated in H-bond formation in the crystalline material [78]. Furthermore, Brus et al. found that the amide carbonyl molecular site is associated with the conformational changes occurring predominantly in the amorphous state [79]. Therefore, the carbonyl group of ATR was selected for a detailed analysis. There is a large difference between the carbonyl stretching vibration of crystalline ATR (1650.8 cm1) and the amorphous form of ATR (1660.7 cm1); similar results were previously published by Kim et al. [3]. Furthermore, there is a shift of the ATR carbonyl group in the co-amorphous system (1666.9 cm1). This shift is likely to be arising from the interaction of the carbonyl group of ATR and an interacting moiety of IRB via hydrogen bonding.
Also, a clear difference between crystalline and amorphous IRB was detected. Two signals were investigated, one arising from the carbonyl group, which might participate in H-bonds, and the other was the C=N bond in the diazaspiro ring, which is known to be involved in an H-bond in the polymorph form B [42,80]. Crystalline IRB shows absorption bands at 1732.9 and 1617.2 cm−1, assigned to the carbonyl moiety of the carboxyl group and the C=N bond in the diazaspiro ring vibrations, respectively. These values are similar to those reported by Araya-Sibaya et al. (1730 and 1615 cm−1, respectively) [63] and Franca et al. [81] (1731.82 and 1616.11 cm−1, respectively), confirming the polymorph A structure of the investigated crystalline IRB. These bands change in the amorphous form, i.e., move to 1728.5 cm−1 for the –C=O vibration, which is slightly different than that reported previously by Cruz-Angeles et al. (1723 cm−1) [34] and Chawla and Bansal (1726 cm−1) [36], however, the position of the C=N group, at 1626.5 cm−1, is similar to that reported by the latter authors (1626 cm−1) [36]. In the co-amorphous system band of the carbonyl group of IRB shifts to 1722.1 cm−1, and the vibration of the C=N bond moves to 1636.2 cm−1. Again, this suggests an interaction between ATR and IRB that is most likely a hydrogen bond and present after co-amorphization. The IR spectrum of the equivalent physical mixture of the crystalline materials did not show any significant band shifts with respect to the IR spectra of the components. This spectrum is a superposition of spectra of the original crystalline materials. These results suggest that no interaction takes place in the physical mixture of crystalline materials and confirms the physical and chemical compatibility of both APIs. The DSC results indicate that there may be an interaction between crystalline APIs, however, it has to be noted that the FT-IR measurements were performed at room temperature and any interaction indicated by DSC may have been caused by the high temperature applied during the DSC experiment. The clear molecular interaction between APIs in the co-amorphous system, as suggested by DSC, was confirmed by FT-IR (single glass transition and deviation from Couchman–Karasz equation predicted Tg).

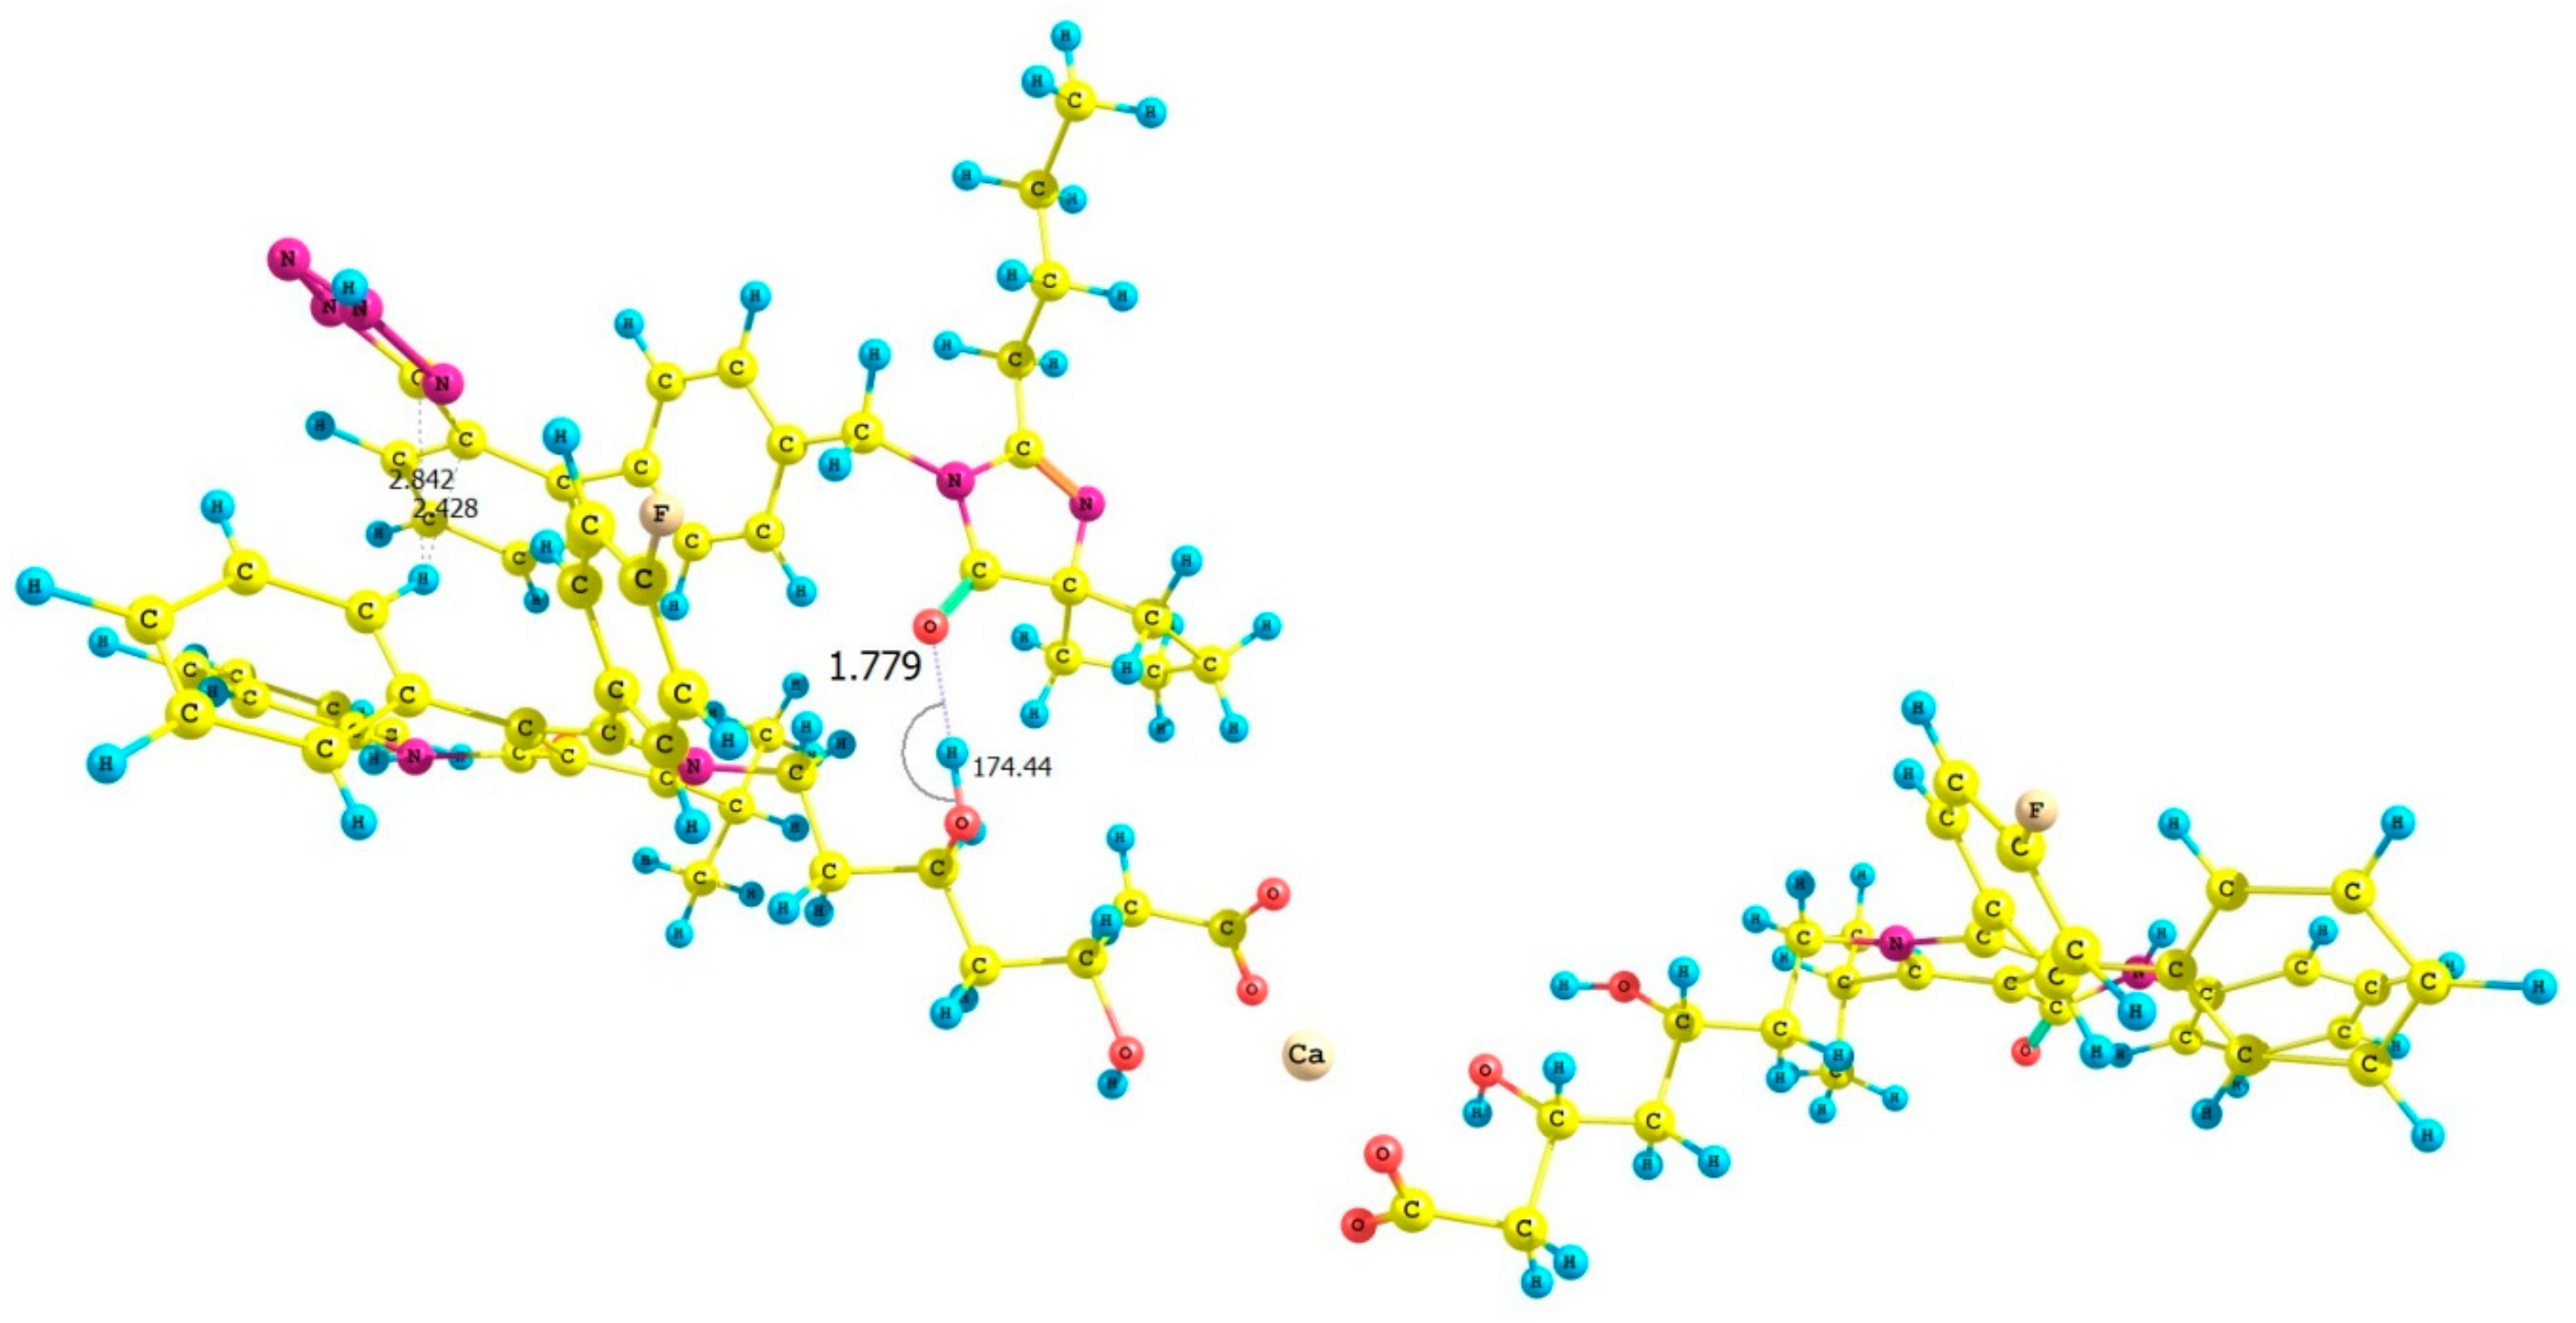
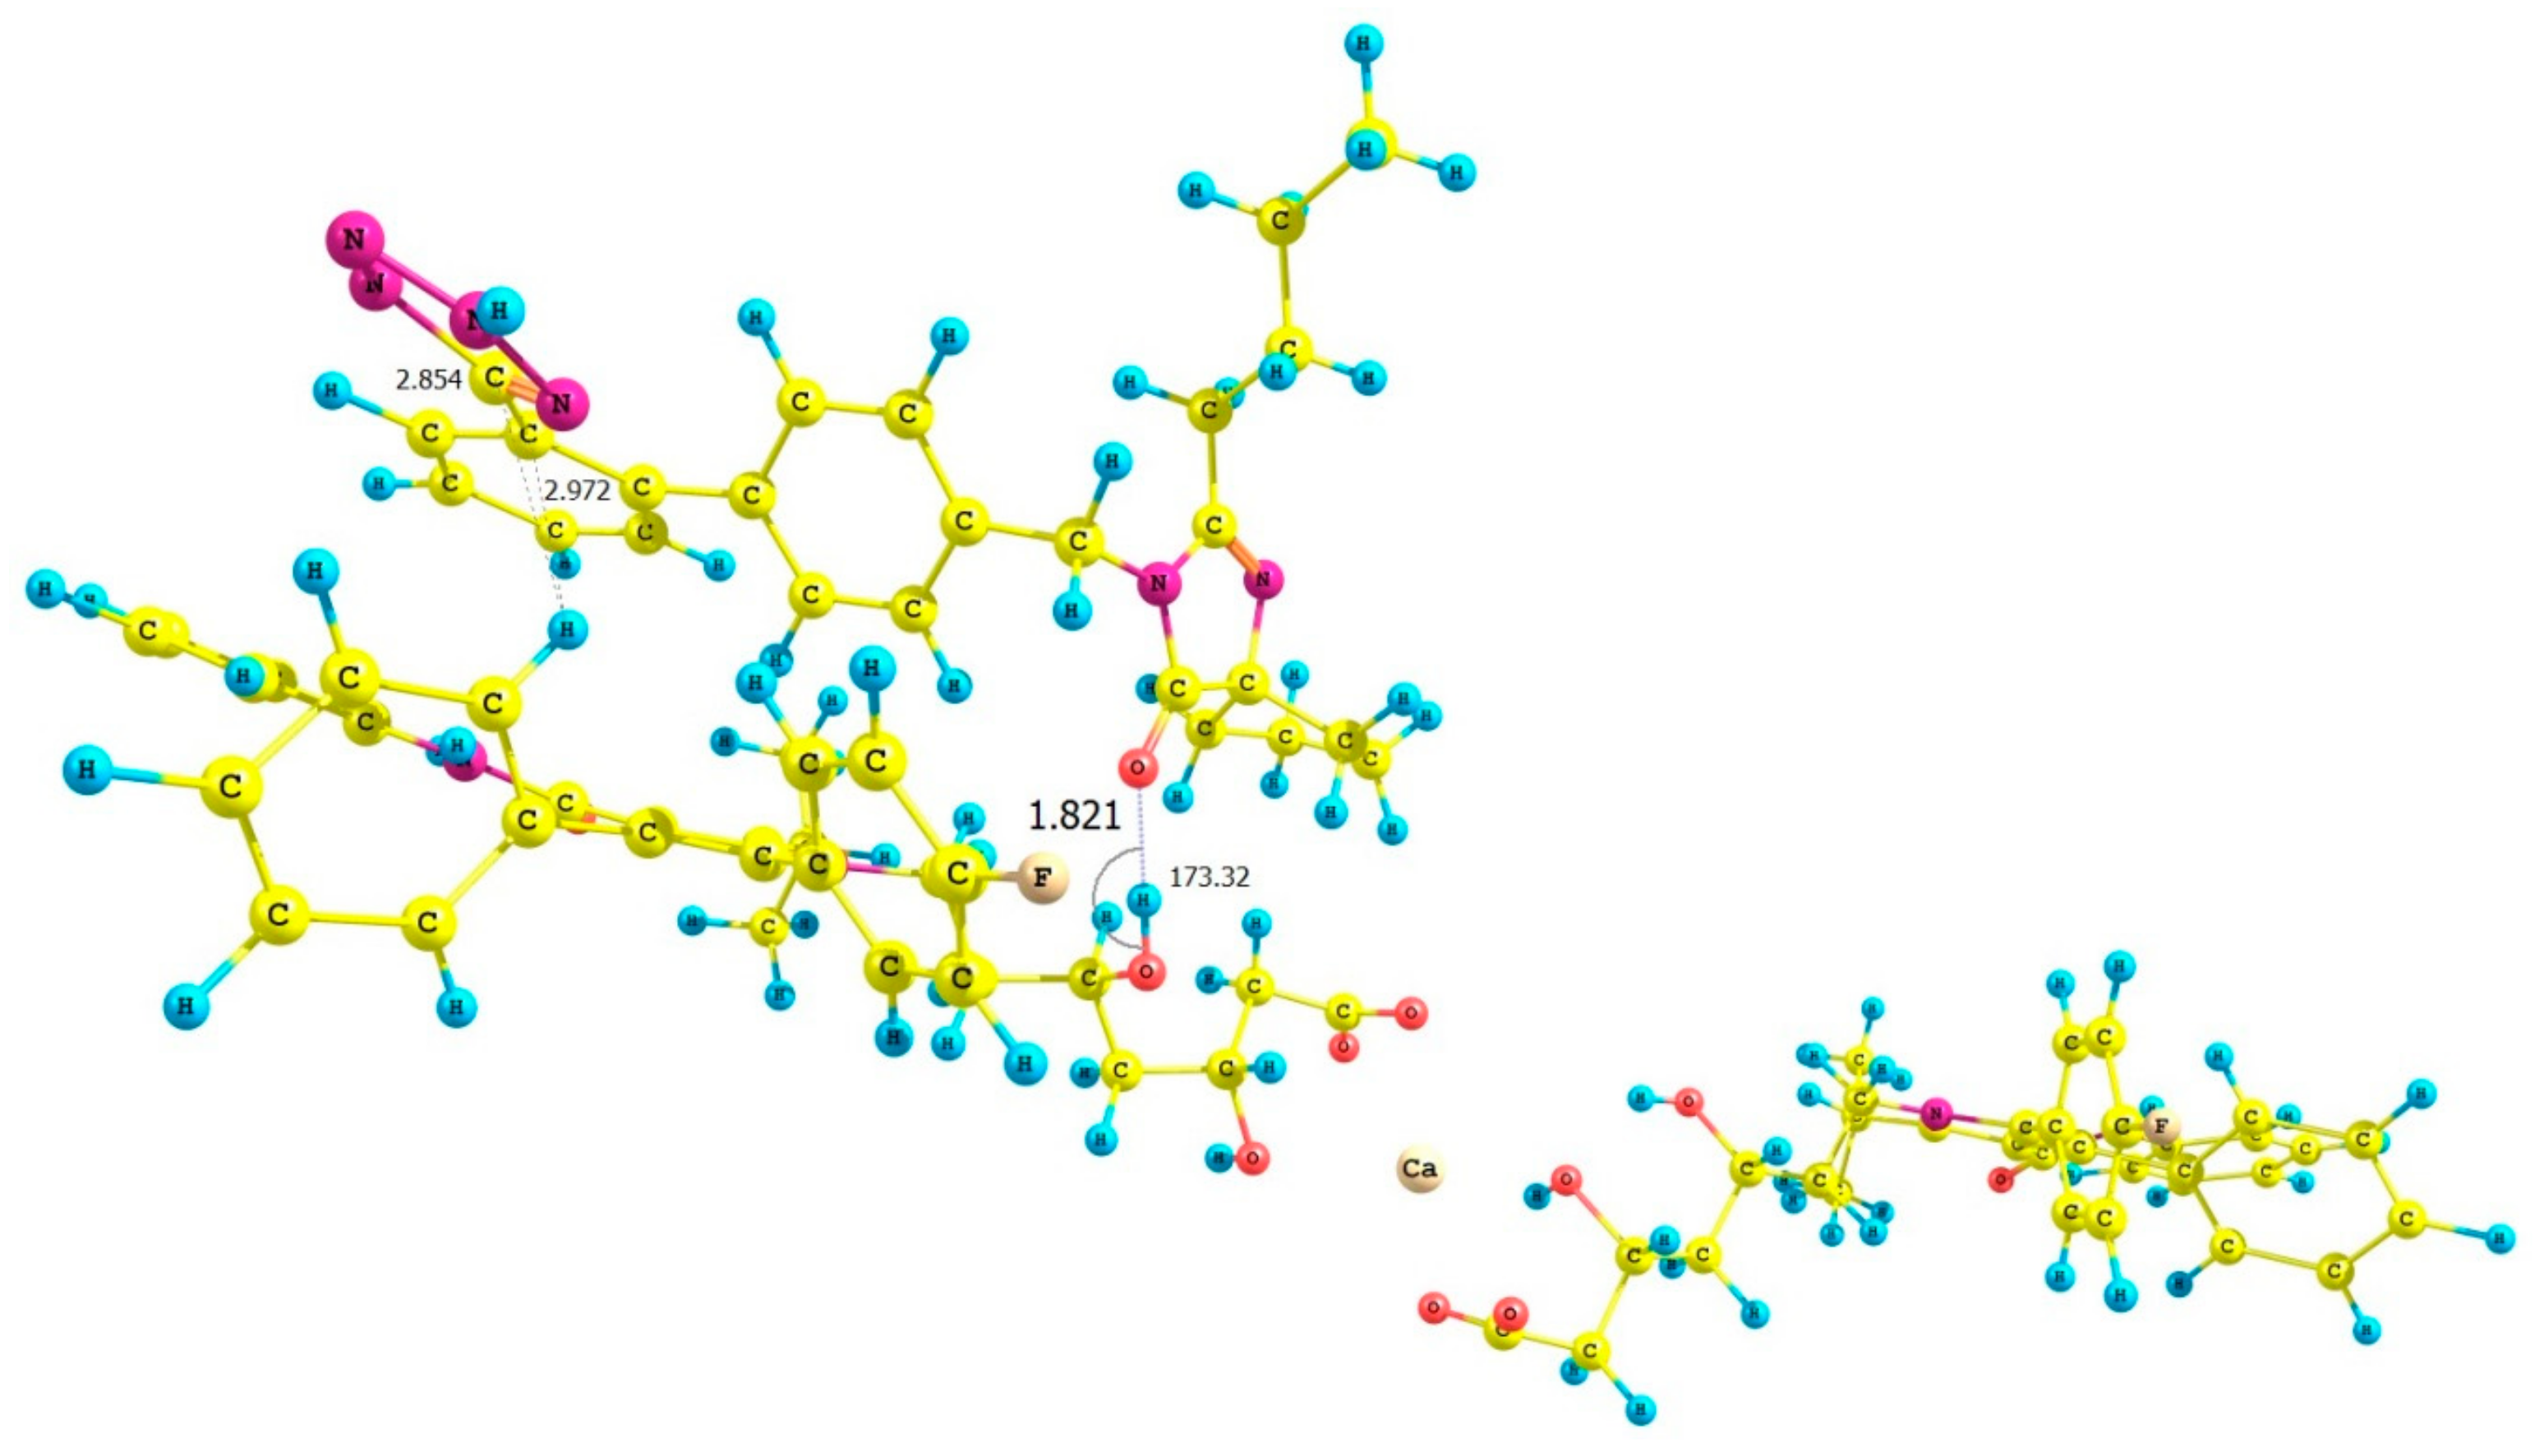
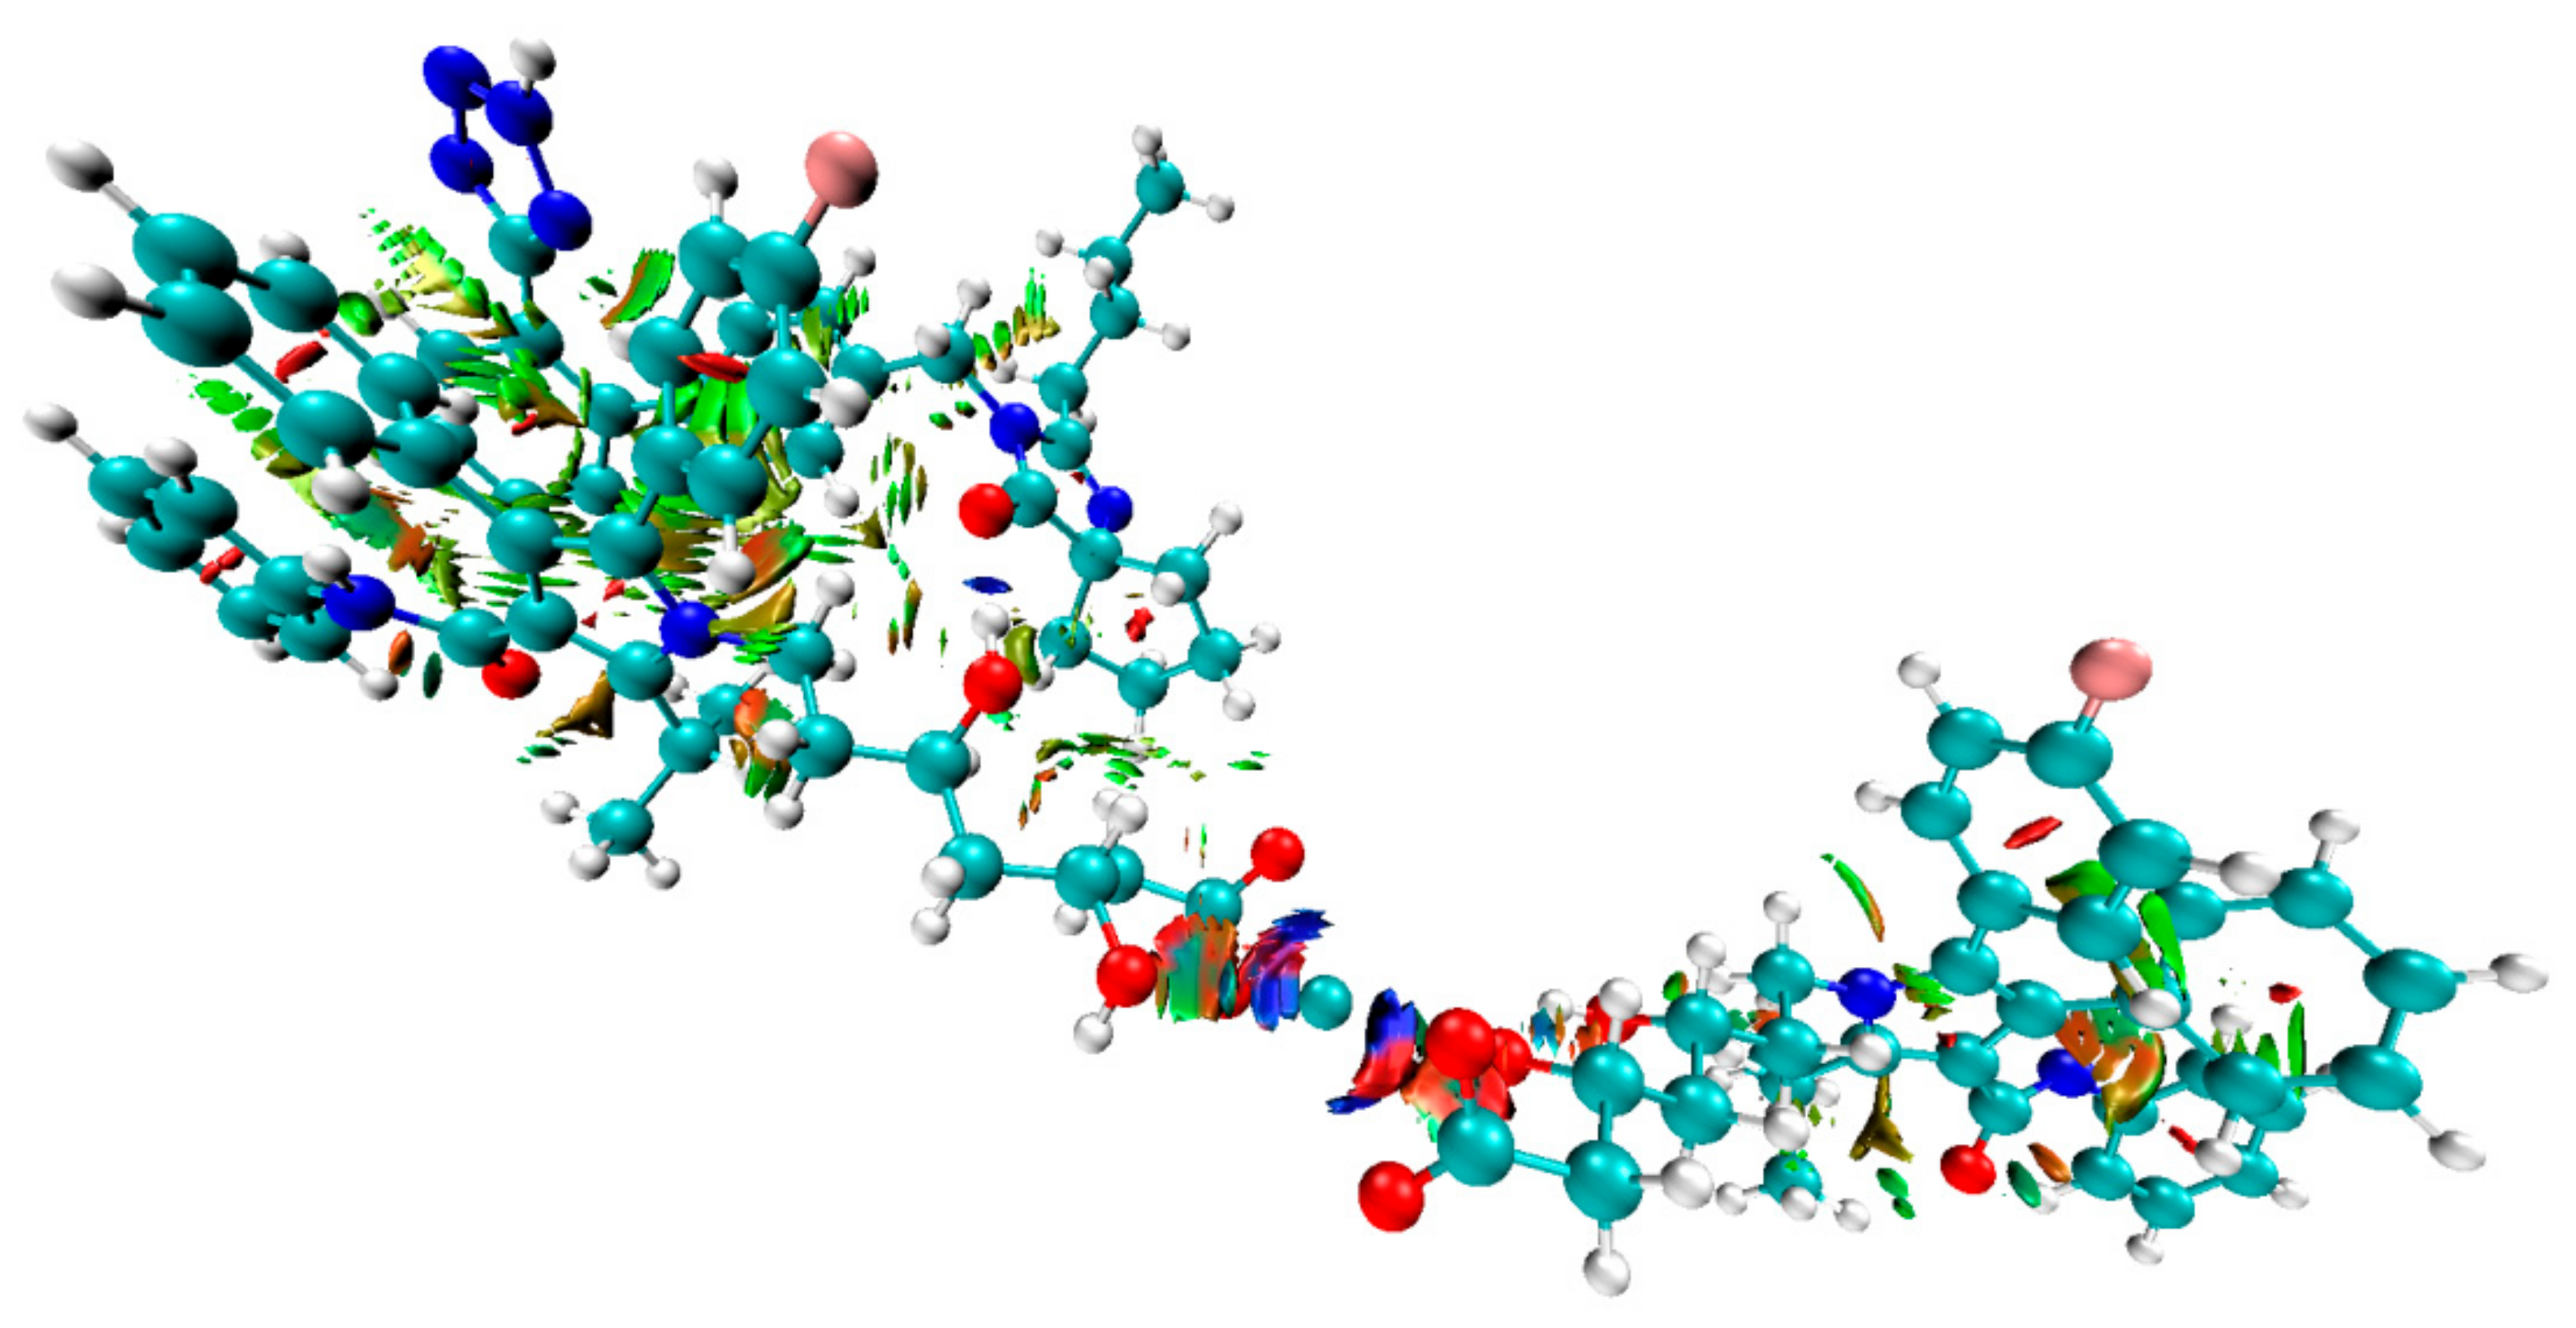
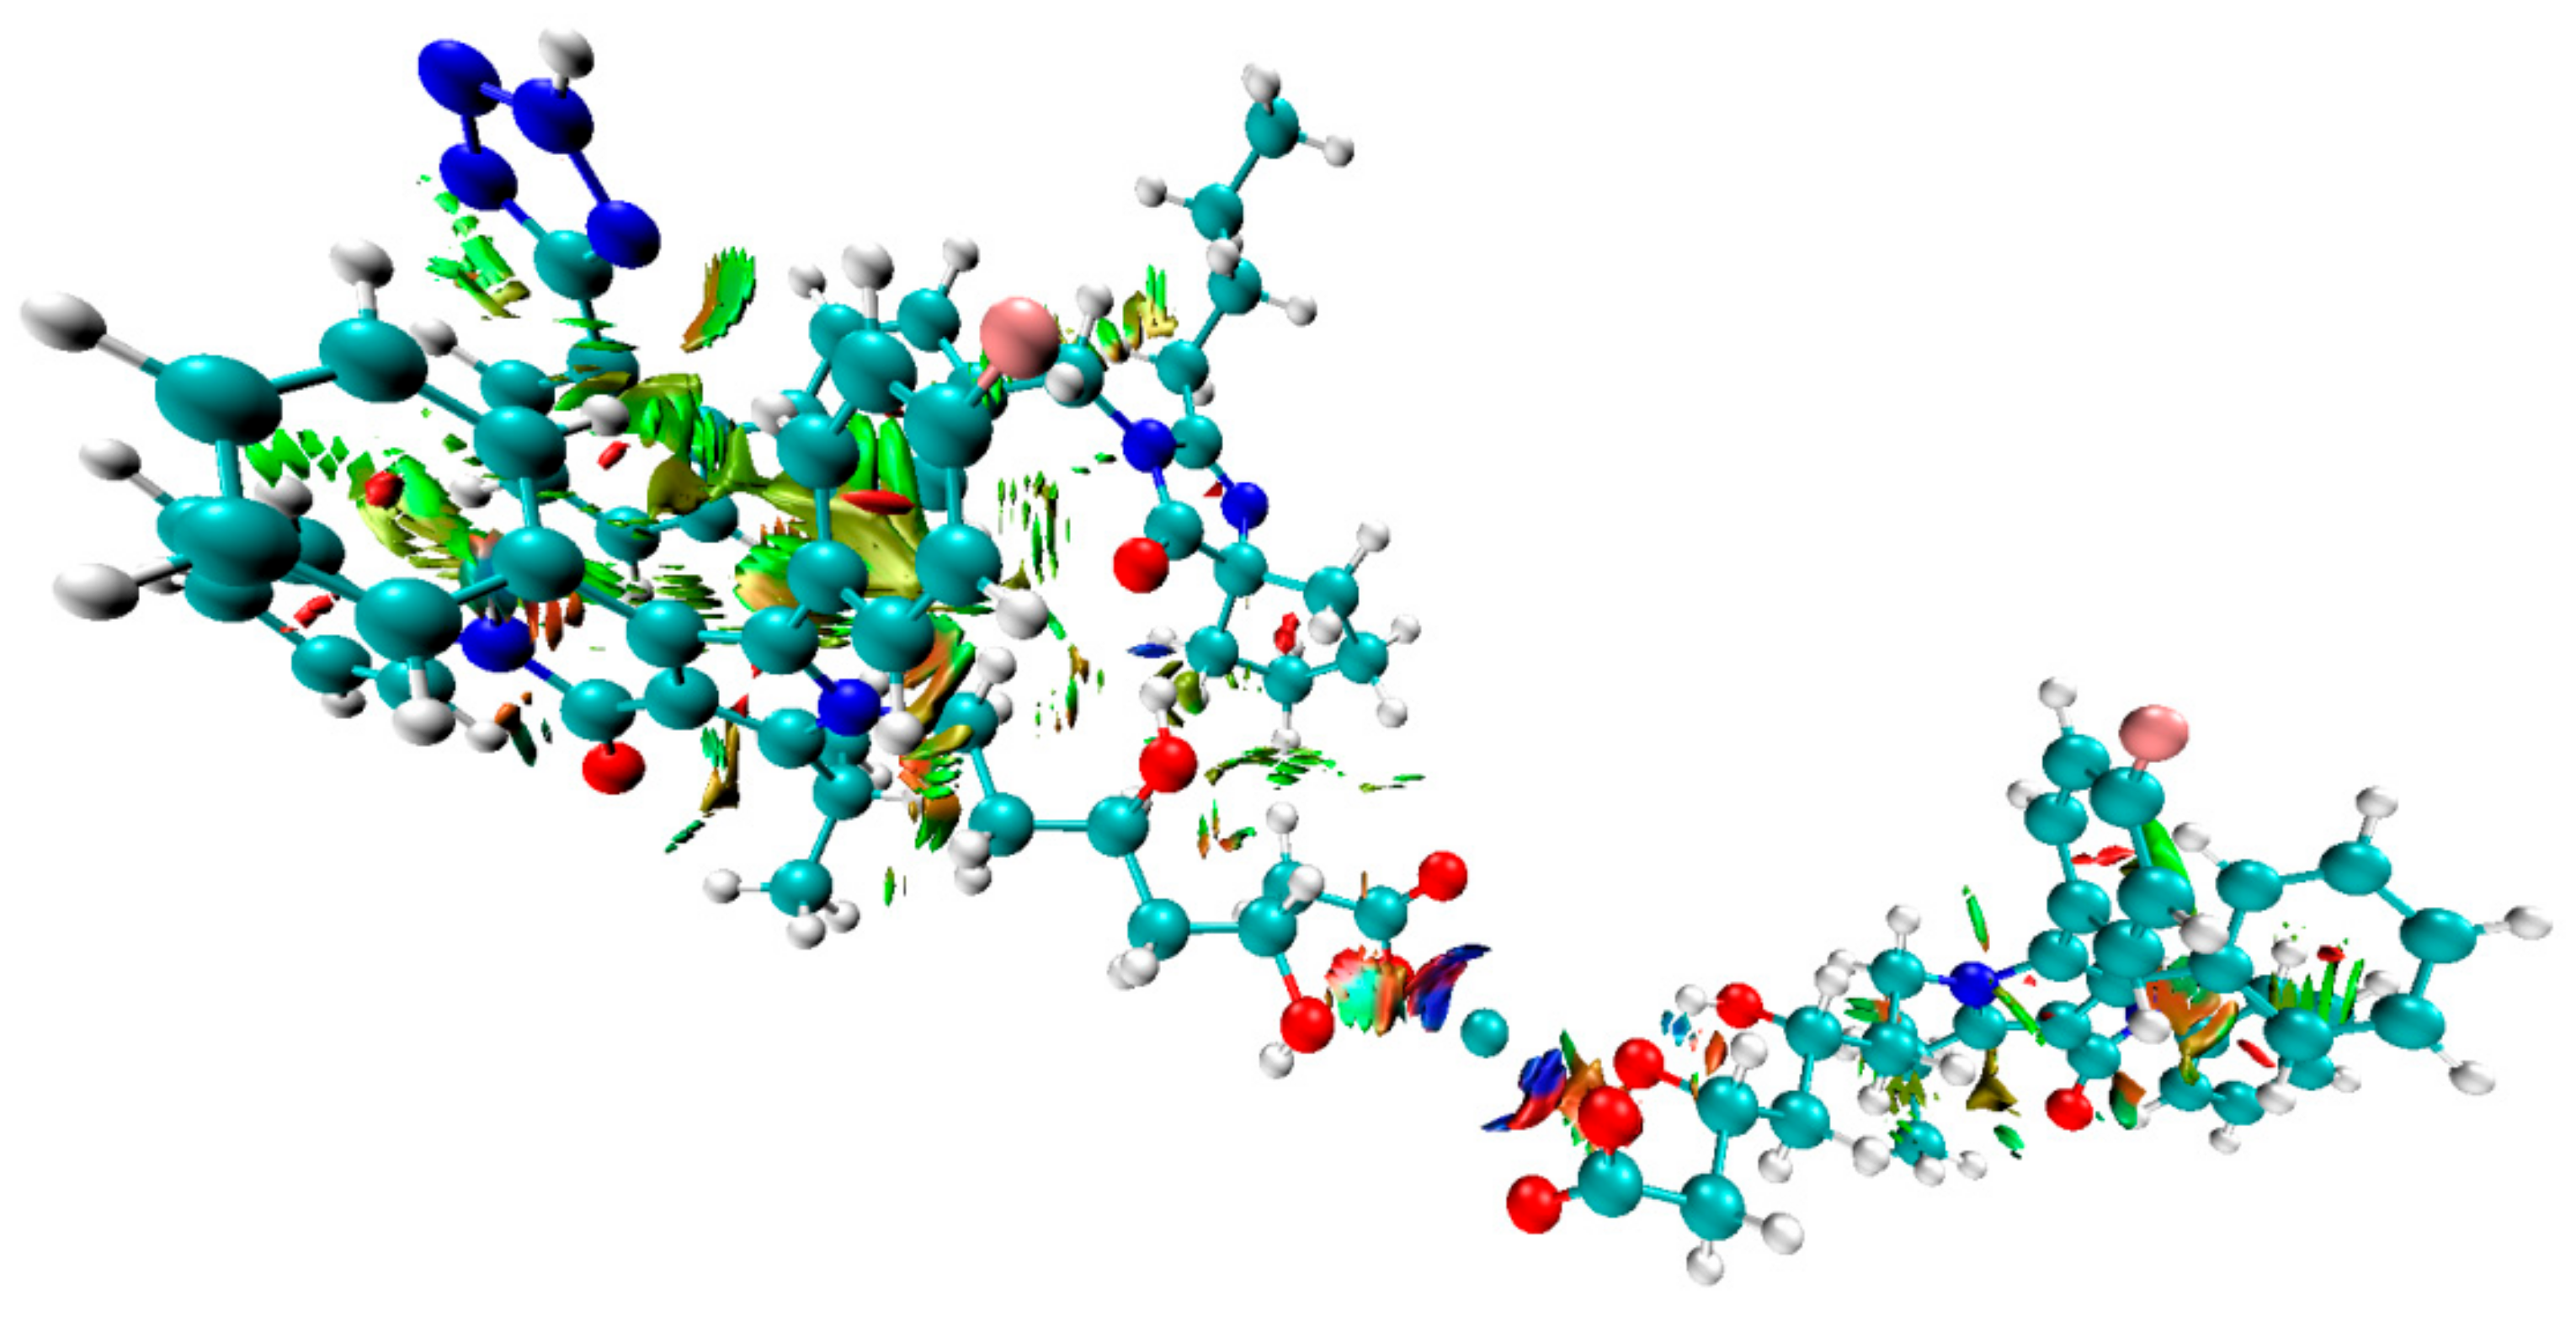
3.3. Computational Investigations

The objective of computational investigations was to improve our understanding of possible interactions present between ATR and IRB. To the best of our knowledge, such investigations are the first attempt to describe, quantifiably, intermolecular interactions between ATR and IRB in their possible complexes from the standpoint of quantum chemistry. Four possible geometries of the ATR-IRB complex were proposed. Their initial geometries were prepared considering the mutual position of the carbonyl group of IRB (its 2H tetrazole tautomer) and the fluorine, carbonyl, and hydroxyl functionalities within the structure of ATR (complexed with calcium ions). The calculations showed that the absolute value of the total energy difference between the isolated 1H and 2H tautomer of IRB (estimated at the B3LYP/6-311++G(d,p) or B97D3/6-311++G(d,p) level of theory) were 0.001864 and 0.003134 Hartree, respectively (1.17 and 1.79 kcal mol−1, respectively) and implied that the 1H tautomer of IRB is energetically slightly more favored. However, the interaction energy in the dimers made of 1H and 2H tautomers of IRB calculated at the B3LYP/6-311++G(d,p) level of theory was −18.05 (for the dimer of 1H tautomers), and −43.78 kcal mol−1 (for the dimer of 2H tautomers), or when B97D3/6-311++G(d,p) level of theory was used the energy was −44.26 kcal mol−1 (for the dimer of 2H tautomers); Figures S3–S6 in the Supplementary Materials. Optimization of the 1H tautomer of IRB using the B97D3 functional led to cleavage of the tetrazole ring in the dimer. Our calculations provided evidence that the 2H tautomer of IRB can form, energetically, more stable complexes. Thus, subsequent calculations considered only the 2H tautomer of IRB.
Next, the complexes at the B3LYP/6-31G(d,p) and B97D3/6-31G(d,p) level of theory were optimized incorporating the Grimme’s D3BJ dispersion model (Cartesian coordinates are given in the Supplementary Materials, Figures S7–S12). The data concerning interaction energies (gaseous phase, counterpoise corrected method, including the basis-set superposition BSSE error) for complexes IVIII are shown in Table 3. The lowest interaction energies, with the most negative values, were determined for complex III (optimized by B3LYP/6-31G(d,p)), Figure 6, and VII (optimized by B97D3/6-31G(d,p)), Figure 7, and were: −34.44 (complex III) and −33.20 (complex VII) kcal mol−1, respectively. These interactions between the hydroxyl group of ATR (as a hydrogen bond (HB) donor) and the carbonyl moiety of IRB (as a HB acceptor) were due to similar geometries of complexes III and VII, in which strong hydrogen contact O−H⋯O=C was detected (Figure 6 and Figure 7). The distance between the proton of the hydroxyl group and the carbonyl functionality (d) was 1.779 or 1.821 Å for complex III and VII, respectively, with the corresponding angle (θ) of 174.44 or 173.32°, respectively. Furthermore, it was noticed that in these cases, the proximity of the phenyl ring of ATR and the tetrazole system of IRB (ca. 2.4–2.8 Å) had an influence on the interaction strength resulting in possible van der Waals (vdW) type contacts. It is noteworthy that the discussed O−H⋯O=C type of contacts seemed to be crucial for intermolecular interactions in ATR-IRB complexes compared to other interactions. The contact between the fluorine atom of ATR and the carbonyl group of IRB was significantly weaker (d > 3.0 Å, complexes I or V, Figures S7 and S10, respectively, Supplementary Materials). Moreover, the N−H⋯O=C contact (d > 1.927 or 2.340 Å, complexes IV or VIII, Figures S9 and S12, respectively, Supplementary Materials) or when the tetrazolic system of IRB was located in a far distance from ATR’s phenyl ring (complexes II or VI, Figures S8 and S11, respectively, Supplementary Material) emerged to be weaker too.
QTAIM computations supported the significant role of hydrogen type of contact O−H⋯O=C in the structure of complexes III and VII (Figure 6 and Figure 7). The application of QTAIM allowed to determine the type and properties of a bond (ionic or covalent), including hydrogen bonding. Only complexes III and VII were investigated. The positive or negative values of the Laplacian (∇2ρ) at the BCP can determine whether the covalent (∇2ρ < 0) or electrostatic (∇2ρ > 0; ionic or weak hydrogen bonds) or van der Waals type of interactions is present within the closed-shell systems. The values for the electron density topological parameters ρ and ∇2ρ were 0.0359 and 0.1246 as well as 0.033 and 0.1120 a. u. for complexes III and VII, respectively. It was observed that the ρ values were small, the ∇2ρ values were positive but relatively small, and the value of the density of electronic kinetic energy was equal to the absolute value of the density of electronic potential energy in the BCP. Thus, they indicate that a strong, O−H⋯O=C type of hydrogen bond with an electrostatic character was present in the complexes. The energy of HBs was estimated according to the refs. [82,83] and was −10.29 and −9.01 kcal mol−1 for complexes III and VII, respectively. On the other hand, in the case of complexes with the less negative value of interaction energy (complexes I and V, Table 3.), the values of ρ and ∇2ρ were 0.0055 and 0.0235 as well as 0.0078 and 0.031 a. u., respectively, proving a significantly weaker nature of the F⋯O=C contact between ATR and IRB (the estimated energy of these contacts was −0.92 and −1.35 kcal mol−1 for complexes I and V, respectively). In the case of all analyzed complexes, the absolute value of bond ellipticity (ε) indicated the cylindrical, directional nature of contacts. The non-covalent interaction index (NCI) characterizes weak intermolecular (non-covalent) interactions. The NCI parameter is related to the Reduced Density Gradient (RDG). A graphical representation of the contour surface of the RDG considering Grimme’s D3BJ dispersion model as well as its scatter diagram for the analyzed complexes I and III as well as V and VII (Table 3.) are given in Figure 8, Figure 9 and Figures S13–S19 (Supplementary Materials). Results showed that the strong hydrogen bond contact present between the hydroxyl group of ATR and the carbonyl moiety of IRB in the complexes had the most negative value of interaction energy (blue color in Figure 8 and Figure 9, complexes III and VII). Moreover, it was noticed that the intermolecular vdW interaction between the aromatic rings was favorable in these complexes (III and VII) compared to complexes I and V, in which the F⋯O=C contact dominated. In the RDG isosurface map (Figure 8 and Figure 9, Figures S14 and S15 of Supplementary Materials), the green and red regions are related to the presence of van der Waals and steric effects, respectively. However, the blue circular intermolecular hydrogen bonding area evidenced that a hydrogen bonding interaction was indeed present in this region. Since there were spikes in the very negative region of sign(λ2)ρ in complexes III and VII (Figures S17 and S19 in the Supplementary Materials), it was concluded that they suggested attractive intermolecular interactions in comparison with complexes I and V (Figures S16 and S18, Supplementary Materials). These findings were supported by the strong nature of the O−H⋯O=C contact in complexes III and VII based on the Interaction Region Indicator (IRI) analysis (Figures S20–S23, Supplementary Material).
Level of Theory—B3LYP/6-311++G(d,p)//B3LYP/6-31Gd,p)
The molecular electrostatic potential (MEP) was determined by the B3LYP/6-311++G(d,p) and B97D3/6-311++G(d,p) approaches for ATR-IRB complexes III (Figure 6) and VII (Figure 7) with the geometry previously optimized at B3LYP/6-31G(d,p) or B97D3/6-31G(d,p) level of theory in the gaseous phase, respectively (Figures S24 and S25, Supplementary Materials). To the best of our knowledge, computational studies of MEP of the isolated molecules of ATR and IRB have been limited to calculations based on B3LYP/6-31*G level of theory for ATR [84] and IRB [85]. In our studies, comprising the BSSE methodology to the conformational exploration, the results were refined using a basis set augmented with higher-level polarization functions. The results revealed a significant change in charge distribution occurring mostly in the tetrazole ring and the carbonyl group of IRB and the hydroxyl functionalities of ATR in all analyzed complexes. They show strong electrostatic contacts supported by the most negative value of interaction energy. The calcium ion complexing two molecules of ATR was omitted.
In the next step, the theoretical IR spectra of the selected ATR-IRB complexes were calculated. This approach was limited to complexes III (Figure 6) and VII (Figure 7), with the most negative value of interaction energy (Table 4). The computations of vibrational frequencies were carried out using the same level of theory as those used for the Self-Consistent Force Field (SCF) optimization procedure and Grimme’s D3 empirical (GD3) dispersion model. The calculated C=O vibrations of complexes III and VII were visible at higher wavenumbers than those for ATRa (B3LYP functional) and ATRb (B97D3 functional), respectively. Similar behavior was observed for the experimental spectra, i.e., ATR in the co-amorphous system vs. amorphous ATR (Table 4). In the case of C=N vibrations of IRB, the vibration in complexes III was visible at the lower wavenumber than for IRBa (B3LYP functional), and for complex VII is was at a higher wavenumber than for IRBb (B97D3 functional). In relation to the experimental spectra, the C=N vibration of IRB in the co-amorphous system are observed at a higher wavenumber than for amorphous IRB (Table 4). On the other hand, the computed wavenumber related to the carbonyl moiety of IRB (III and VII) decreased in comparison with the C=O vibration calculated for the isolated molecule of IRB (IRBa and IRBb). A similar trend was observed for the experimental spectra, i.e., IBR in the co-amorphous system and amorphous IRB (Table 4). It is noteworthy that the use of the B97D3 functional calculations to compute the theoretical IR spectral values resulted in a good agreement with the experimental data.

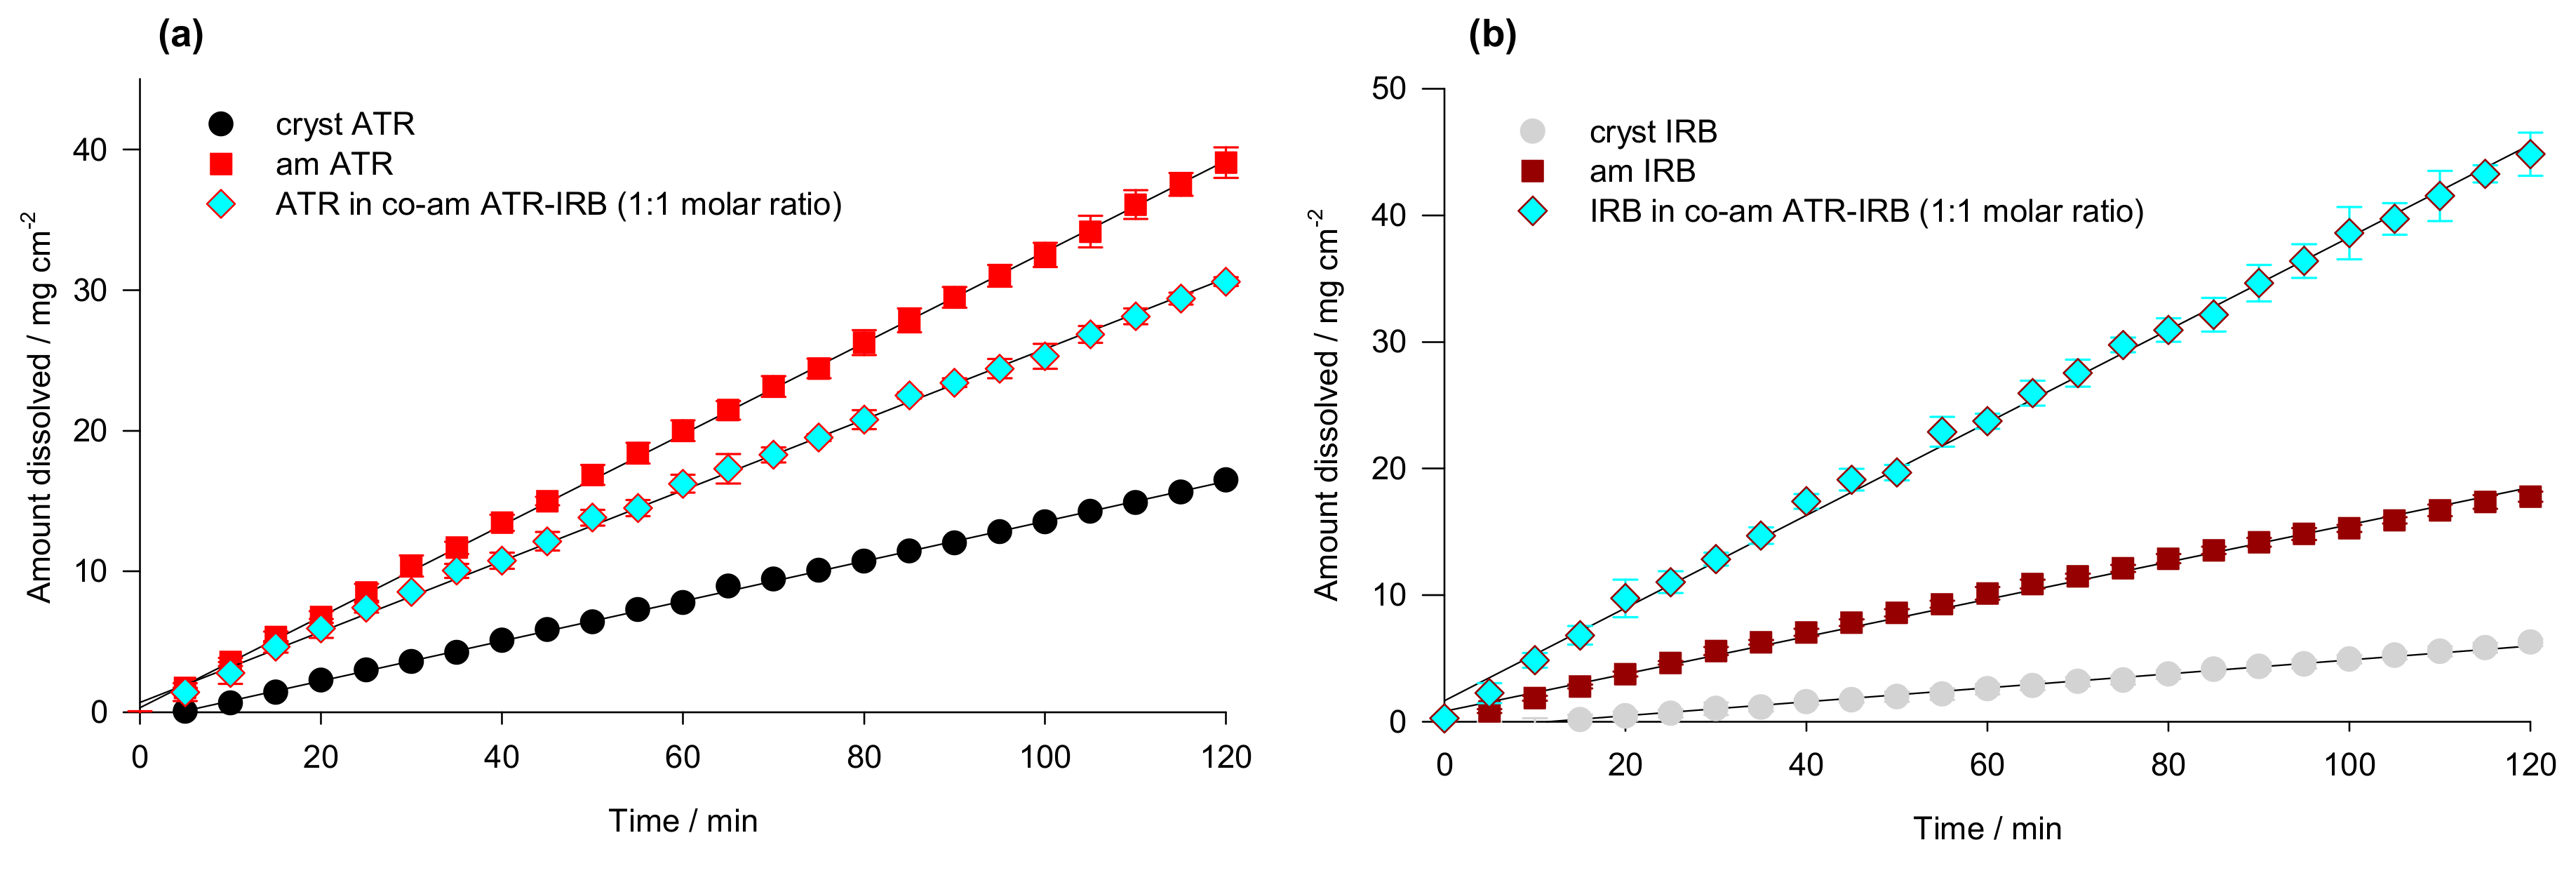
3.4. Intrinsic Dissolution Testing

The intrinsic dissolution tests were performed to evaluate the impact of co-amorphization on the dissolution behavior on both drugs in 2% w/v SDS (Figure 10). As expected, for both amorphous APIs, dissolution profiles exhibit a higher dissolution rate than for their crystalline counterparts. On the other hand, the dissolution behavior of both drugs from the co-amorphous system is quite different. The dissolution profile of IRB (Figure 10a) shows about a 2.5-fold, significantly greater (ANOVA, post-hoc HSD test at α = 0.05, p = 0.0002), intrinsic dissolution rate of API in the co-amorphous system (IDR = 0.365 ± 0.009 mg min−1 cm−2) in comparison to the pure amorphous drug (IDR = 0.147 ± 0.003 mg min−1 cm−2). In contrast, ATR in the mixture shows rather an unusual behavior, i.e., the IDR from the co-amorphous system (0.251 ± 0.0004 mg min−1 cm−2) is lower than the one for amorphous ATR (IDR = 0.324 ± 0.007 mg min−1 cm−2) (Figure 10b). The co-amorphous materials are generally associated with increased solubility and dissolution rates [16,17]. It is, therefore, surprising to find that ATR from the co-amorphous ATR-IRB material has a lower dissolution rate than pure amorphous ATR. It is worth noticing that the IDRs of amorphous IRB and ATR are 2.67 and 2.28 times faster (statistically significant) than their crystalline counterparts, respectively.
To explain the results of dissolution studies, DFT studies were employed once again. It can be concluded that strong hydrogen bonds were present between the molecules in complexes III and VII. The cavity between the ATR and IRB subunits of these complexes was smaller in comparison to complexes I and V. Therefore, due to the stronger HBs and steric hindrance within the structure of complexes III and VII, the penetration of water molecules into the complex may be regarded negligible, and their dissolution in water seems to be less favorable when compared to complexes I and V. This was supported by the additional free energy of solvation calculations for complexes V and VII using the Truhlar’s SMD solvation model and the M062X functional. The estimated energy was −110.70 and −104.54 kcal mol−1 for complex V and VII, respectively, consistent with the lower values of the dissolution rates due to, most likely, lower solubility of complex VII.

4. Conclusions

The co-amorphous system ATR-IRB was successfully obtained by melting with subsequent cooling of a crystalline physical mixture of APIs. The co-amorphous formulation showed a significant improvement regarding the IDR of IRB over the pure crystalline as well as an amorphous counterpart. An unusual behavior was observed for ATR, as the IDR of ATR from the co-amorphous formulation was slightly lower than the IDR of amorphous ATR on its own. Short-term physical aging studies proved that the ATR-IRB co-amorphous system remains in the amorphous form. Furthermore, no physical aging occurred in the co-amorphous system. FT-IR and analysis of the Tg value of co-amorphous system using the Couchman-Karasz equation and DFT calculations revealed molecular interactions between the APIs, which may have contributed to the increased physical stability (no physical aging). The computational studies confirmed strong intermolecular interactions between ATR and IRB in the co-amorphous system as found by DSC and FT-IR experiments. The QTAIM and interaction energy computations, as well as calculations considering non-covalent interactions (RDG, IRI) and free energy of solvation supported the supposition of the stronger nature of hydrogen contacts in complexes III and VII. The behavior of the analyzed ATR-IRB complexes in water was supported by the additional free energy of solvation calculations considering V and VII complexes suggesting that stronger intermolecular interactions in the latter prevent water molecule ingress into the complex, thus lowering its solubility and translating into lower dissolution rates. Summarizing, co-amorphization enhances both the stability and dissolution rate of irbesartan, whereas it does not have an impact on the short-term stability of atorvastatin but has a negative impact on its dissolution rate.

Supplementary Materials

The following are available online at https://www.mdpi.com/1999-4923/13/1/118/s1, Figure S1: TGA curves for atorvastatin (ATR), irbesartan (IRB) and the 50/50 (w/w) physical mixture of atorvastatin/irbesartan (ATR/IRB PM). Figure S2: Temperature-modulated DSC curves of amorphous irbesartan (IRB) obtained after cooling the melt at a cooling rate of 10 °C min−1. Figures S3 and S4: Structures of the optimized IRB 1H and 2H tautomer dimers (B3LYP functional). Figures S5 and S6: Structures of the optimized IRB 1H and 2H tautomer dimers (B97D3 functional). Figures S7–S12: Structures of the optimized ATR-IRB complexes I, II, IVVI, and VIII, Figure S13: Graphical representation of types of interactions regarding the reduced density gradient (RDG) analysis. Figure S14: Colored contour surface of the reduced density gradient (RDG) highlighting weak and strong interaction in the ATR-IRB complex I (B3LYP/6-311++G(d,p)//B3LYP/6-31Gd,p) level of theory; blue, hydrogen bonds; green, vdW interactions). Figure S15: Colored contour surface of the reduced density gradient (RDG) highlighting weak and strong interaction in the ATR-IRB complex V (B97D3/6-311++G(d,p)//B97D3/6-31Gd,p) level of theory; blue, hydrogen bonds; green, vdW interactions). Figures S16 and S17: Scatter diagrams of the reduced density gradient (RDG) highlighting weak and strong interaction in the ATR-IRB complexes I and III (B3LYP/6-311++G(d,p)//B3LYP/6-31Gd,p) level of theory; blue, hydrogen bonds; green, vdW interactions). Figures S18 and S19: Scatter diagrams of the reduced density gradient (RDG) highlighting weak and strong interaction in the ATR-IRB complexes V and VII (B97D3/6-311++G(d,p)//B97D3/6-31Gd,p) level of theory; blue, hydrogen bonds; green, vdW interactions). Figures S20 and S21: Colored contour surface of the interaction region indicator (IRI) highlighting weak and strong interaction in the ATR-IRB complexes I and III (B3LYP/6-311++G(d,p)//B3LYP/6-31Gd,p) level of theory; green, vdW interactions). Figures S22 and S23: Colored contour surface of the interaction region indicator (IRI) highlighting weak and strong interaction in the ATR-IRB complexes V and VII (B97D3/6-311++G(d,p)//B97D3/6-31Gd,p) level of theory; green, vdW interactions). Figure S24: Electrostatic potential (ESP) map of ATR-IRB complex III calculated in the gaseous phase (B3LYP/6-311++G(d,p)//B3LYP/6-31Gd,p) level of theory; isovalue = 0.002 a.u.). Figure S25: Electrostatic potential (ESP) map of ATR-IRB complex VII calculated in the gaseous phase (B97D3/6-311++G(d,p)//B97D3/6-31Gd,p); isovalue = 0.002 a.u.); List of Cartesian coordinates of the optimized IRB, IRB dimers, ATR calcium and ATR-IRB complexes.

Author Contributions

Conceptualization, M.S., M.P., and L.T.; methodology, M.S., B.M., M.P., L.T., and J.K.; software, J.K.; validation, M.S., B.J., A.S., B.M., M.P., L.T., and J.K.; formal analysis, M.S., B.M., M.P., L.T., and J.K.; investigation, M.S., A.S., B.M., and J.K.; resources, M.S., B.M., M.P., L.T., and J.K.; data curation, M.S., B.M., and J.K.; writing—original draft preparation, M.S., B.J., A.S., B.M., M.P., L.T., and J.K.; writing—review and editing, M.S., B.J., A.S., B.M., M.P., L.T., and J.K.; visualization, M.S. and J.K.; supervision, M.S., M.P., and L.T.; project administration, M.S., A.S., B.M., L.T., and J.K.; funding acquisition, M.S., B.M., L.T., and J.K. All authors have read and agreed to the published version of the manuscript.

Funding

The research leading to these results was supported by the Synthesis and Solid State Pharmaceutical Centre (SSPC), financed by a research grant from Science Foundation Ireland (SFI) and co-funded under the European Regional Development Fund (Grant Number 12/RC/2275). Part of the research was funded by the European Union’s Horizon 2020 research and innovation programme under the Marie Skłodowska-Curie grant agreement No 778051 and the Ministry of Science and Higher Education of Poland fund for supporting internationally co-financed projects in 2018–2022 (agreement No 3899/H2020/2018/2). The calculations were carried out using resources provided by the Wrocław Center for Networking and Supercomputing (WCSS Grant No. 327/2014).

Institutional Review Board Statement

Not applicable.

Informed Consent Statement

Not applicable.

Data Availability Statement

The data presented in this study are available in the Supplementary Material.

Acknowledgments

The authors acknowledge Biofarm Sp. z o.o. (Poznań, Poland) and Polpharma SA Company (Starogard Gdański, Poland) for supplying atorvastatin calcium and irbesartan used in this study, respectively.

Conflicts of Interest

The authors declare no conflict of interest. The funders had no role in the design of the study; in the collection, analyses, or interpretation of data; in the writing of the manuscript, or in the decision to publish the results.

References

  1. Kumar, V.; Prasad, B.; Singh, S. Pharmaceutical issues in the development of a polypill for the treatment of cardiovascular diseases. Drug Discov. Today Ther. Strateg. 2008, 5, 63–71. [Google Scholar] [CrossRef]
  2. Ihm, S.H.; Shin, J.; Park, C.G.; Kim, C.H. Efficacy of a fixed dose combination of irbesartan and atorvastatin (Rovelito®) in Korean adults with hypertension and hypercholesterolemia. Drug Des. Devel. Ther. 2019, 13, 633–645. [Google Scholar] [CrossRef] [Green Version]
  3. Kim, M.S.; Jin, S.J.; Kim, J.S.; Park, H.J.; Song, H.S.; Neubert, R.H.H.; Hwang, S.J. Preparation, characterization and in vivo evaluation of amorphous atorvastatin calcium nanoparticles using supercritical antisolvent (SAS) process. Eur. J. Pharm. Biopharm. 2008, 69, 454–465. [Google Scholar] [CrossRef]
  4. Hirlekar, R.; Kadam, V. Preformulation study of the inclusion complex irbesartan-β-cyclodextrin. AAPS PharmSciTech 2009, 10, 276–281. [Google Scholar] [CrossRef] [Green Version]
  5. Ashwini Kumar, G.; Choudhary, R.K.; Chaitanya, C. Enhancement of solubility and dissolution rate of irbesartan by solid dispersion technique. Asian J. Pharm. Clin. Res. 2011, 4, 36–40. [Google Scholar]
  6. Shete, G.; Puri, V.; Kumar, L.; Bansal, A.K. Solid state characterization of commercial crystalline and amorphous atorvastatin calcium samples. AAPS PharmSciTech 2010, 11, 598–609. [Google Scholar] [CrossRef] [PubMed] [Green Version]
  7. Pan, D.; Crull, G.; Yin, S.; Grosso, J. Low level drug product API form analysis—Avalide tablet NIR quantitative method development and robustness challenges. J. Pharm. Biomed. Anal. 2014, 89, 268–275. [Google Scholar] [CrossRef]
  8. Hedaya, M.A.; Helmy, S.A. Modeling of the pharmacokinetic/pharmacodynamic interaction between irbesartan and hydrochlorothiazide in normotensive subjects. Biopharm. Drug Dispos. 2015, 36, 216–231. [Google Scholar] [CrossRef] [PubMed]
  9. Kalepu, S.; Nekkanti, V. Insoluble drug delivery strategies: Review of recent advances and business prospects. Acta Pharm. Sin. B 2015, 5, 442–453. [Google Scholar] [CrossRef] [PubMed] [Green Version]
  10. Yu, L. Amorphous pharmaceutical solids: Preparation, characterization and stabilization. Adv. Drug Deliv. Rev. 2001, 48, 27–42. [Google Scholar] [CrossRef]
  11. Hancock, B.C.; Zografi, G. Characteristics and significance of the amorphous state in pharmaceutical systems. J. Pharm. Sci. 1997, 86, 1. [Google Scholar] [CrossRef] [PubMed]
  12. Laitinen, R.; Löbmann, K.; Strachan, C.J.; Grohganz, H.; Rades, T. Emerging trends in the stabilization of amorphous drugs. Int. J. Pharm. 2013, 453, 65–79. [Google Scholar] [CrossRef] [PubMed]
  13. Bikiaris, D.N. Solid dispersions, Part I: Recent evolutions and future opportunities in manufacturing methods for dissolution rate enhancement of poorly water-soluble drugs. Expert Opin. Drug Deliv. 2011, 8, 1501–1519. [Google Scholar] [CrossRef] [PubMed]
  14. Qian, F.; Huang, J.; Hussain, M.A. Drug-polymer solubility and miscibility: Stability consideration and practical challenges in amorphous solid dispersion development. J. Pharm. Sci. 2010, 99, 2941–2947. [Google Scholar] [CrossRef] [PubMed]
  15. Serajuddln, A.T.M. Solid dispersion of poorly water-soluble drugs: Early promises, subsequent problems, and recent breakthroughs. J. Pharm. Sci. 1999, 88, 1058–1066. [Google Scholar] [CrossRef]
  16. Chavan, R.B.; Thipparaboina, R.; Kumar, D.; Shastri, N.R. Co amorphous systems: A product development perspective. Int. J. Pharm. 2016, 515, 403–415. [Google Scholar] [CrossRef]
  17. Dengale, S.J.; Grohganz, H.; Rades, T.; Löbmann, K. Recent advances in co-amorphous drug formulations. Adv. Drug Deliv. Rev. 2016, 100, 116–125. [Google Scholar] [CrossRef]
  18. Karagianni, A.; Kachrimanis, K.; Nikolakakis, I. Co-amorphous solid dispersions for solubility and absorption improvement of drugs: Composition, preparation, characterization and formulations for oral delivery. Pharmaceutics 2018, 10, 98. [Google Scholar] [CrossRef] [Green Version]
  19. Han, J.; Wei, Y.; Lu, Y.; Wang, R.; Zhang, J.; Gao, Y.; Qian, S. Co-amorphous systems for the delivery of poorly water-soluble drugs: Recent advances and an update. Expert Opin. Drug Deliv. 2020, 17, 1411–1435. [Google Scholar] [CrossRef]
  20. Shi, Q.; Moinuddin, S.M.; Cai, T. Advances in coamorphous drug delivery systems. Acta Pharm. Sin. B 2019, 9, 19–35. [Google Scholar] [CrossRef]
  21. Qian, S.; Heng, W.; Wei, Y.; Zhang, J.; Gao, Y. Coamorphous lurasidone hydrochloride-saccharin with charge-assisted hydrogen bonding interaction shows improved physical stability and enhanced dissolution with ph-independent solubility behavior. Cryst. Growth Des. 2015, 15, 2920–2928. [Google Scholar] [CrossRef]
  22. Löbmann, K.; Laitinen, R.; Grohganz, H.; Strachan, C.; Rades, T.; Gordon, K.C. A theoretical and spectroscopic study of co-amorphous naproxen and indomethacin. Int. J. Pharm. 2013, 453, 80–87. [Google Scholar] [CrossRef] [PubMed]
  23. Suresh, K.; Chaitanya Mannava, M.K.C.; Nangia, A. A novel curcumin-artemisinin coamorphous solid: Physical properties and pharmacokinetic profile. RSC Adv. 2014, 4, 58357–58361. [Google Scholar] [CrossRef]
  24. Ueda, H.; Kadota, K.; Imono, M.; Ito, T.; Kunita, A.; Tozuka, Y. Co-amorphous formation induced by combination of tranilast and diphenhydramine hydrochloride. J. Pharm. Sci. 2017, 106, 123–128. [Google Scholar] [CrossRef] [PubMed] [Green Version]
  25. Löbmann, K.; Strachan, C.; Grohganz, H.; Rades, T.; Korhonen, O.; Laitinen, R. Co-amorphous simvastatin and glipizide combinations show improved physical stability without evidence of intermolecular interactions. Eur. J. Pharm. Biopharm. 2012, 81, 159–169. [Google Scholar] [CrossRef]
  26. Löbmann, K.; Grohganz, H.; Laitinen, R.; Strachan, C.; Rades, T. Amino acids as co-amorphous stabilizers for poorly water soluble drugs—Part 1: Preparation, stability and dissolution enhancement. Eur. J. Pharm. Biopharm. 2013, 85, 873–881. [Google Scholar] [CrossRef]
  27. Shayanfar, A.; Jouyban, A. Drug-drug coamorphous systems: Characterization and physicochemical properties of coamorphous atorvastatin with carvedilol and glibenclamide. J. Pharm. Innov. 2013, 8, 218–228. [Google Scholar] [CrossRef]
  28. Choudhary, A.; Rana, A.C.; Aggarwal, G.; Kumar, V.; Zakir, F. Development and characterization of an atorvastatin solid dispersion formulation using skimmed milk for improved oral bioavailability. Acta Pharm. Sin. B 2012, 2, 421–428. [Google Scholar] [CrossRef] [Green Version]
  29. Anwar, M.; Warsi, M.H.; Mallick, N.; Akhter, S.; Gahoi, S.; Jain, G.K.; Talegaonkar, S.; Ahmad, F.J.; Khar, R.K. Enhanced bioavailability of nano-sized chitosan-atorvastatin conjugate after oral administration to rats. Eur. J. Pharm. Sci. 2011, 44, 241–249. [Google Scholar] [CrossRef]
  30. Adeli, E. Irbesartan-loaded electrospun nanofibers-based PVP K90 for the drug dissolution improvement: Fabrication, in vitro performance assessment, and in vivo evaluation. J. Appl. Polym. Sci. 2015, 132. [Google Scholar] [CrossRef]
  31. Meka, A.K.; Pola, S.; Tupally, K.R.; Abbaraju, P.L. Development, evaluation and characterization of surface solid dispersion for solubility and dissolution enhancement of Irbesartan. Int. J. Drug Dev. Res. 2012, 4, 263–273. [Google Scholar] [CrossRef]
  32. Nair, A.; Varma, R.; Gourishetti, K.; Bhat, K.; Dengale, S. Influence of preparation methods on physicochemical and pharmacokinetic properties of co-amorphous formulations: The case of co-amorphous atorvastatin: Naringin. J. Pharm. Innov. 2020, 15, 365–379. [Google Scholar] [CrossRef]
  33. Shayanfar, A.; Ghavimi, H.; Hamishehkar, H.; Jouyban, A. Coamorphous atorvastatin calcium to improve its physicochemical and pharmacokinetic properties. J. Pharm. Pharm. Sci. 2013, 16, 577–587. [Google Scholar] [CrossRef] [PubMed] [Green Version]
  34. Cruz-Angeles, J.; Videa, M.; Martínez, L.M. Highly soluble glimepiride and irbesartan co-amorphous formulation with potential application in combination therapy. AAPS PharmSciTech 2019, 20, 144. [Google Scholar] [CrossRef]
  35. Haneef, J.; Chadha, R. Drug-drug multicomponent solid forms: Cocrystal, coamorphous and eutectic of three poorly soluble antihypertensive drugs using mechanochemical approach. AAPS PharmSciTech 2017, 18, 2279–2290. [Google Scholar] [CrossRef] [PubMed]
  36. Chawla, G.; Bansal, A.K. Molecular mobility and physical stability of amorphous irbesartan. Sci. Pharm. 2009, 77, 695–709. [Google Scholar] [CrossRef] [Green Version]
  37. Graeser, K.A.; Strachan, C.J.; Patterson, J.E.; Gordon, K.C.; Rades, T. Physicochemical properties and stability of two differently prepared amorphous forms of simvastatin. Cryst. Growth Des. 2008, 8, 128–135. [Google Scholar] [CrossRef]
  38. Pikal, M.J.; Lukes, A.L.; Lang, J.E.; Gaines, K. Quantitative crystallinity determinations for β-lactam antibiotics by solution calorimetry: Correlations with stability. J. Pharm. Sci. 1978, 67, 767–773. [Google Scholar] [CrossRef]
  39. Tsukushi, I.; Yamamuro, O.; Suga, H. Heat capacities and glass transitions of ground amorphous solid and liquid-quenched glass of tri-O-methyl-ß-cyclodextrin. J. Non. Cryst. Solids 1994, 175, 187–194. [Google Scholar] [CrossRef]
  40. Wunderlich, B. Thermal Analysis of Polymeric Materials; Springer Science & Business Media: Berlin, Germany, 2005; ISBN 3540236295. [Google Scholar]
  41. Couchman, P.R.; Karasz, F.E. A classical thermodynamic discussion of the effect of composition on glass-transition temperatures. Macromolecules 1978, 11, 117–119. [Google Scholar] [CrossRef]
  42. Böcskei, Z.; Simon, K.; Rao, R.; Caron, A.; Rodger, C.A.; Bauer, M. Irbesartan crystal form B. Acta Crystallogr. Sect. C Cryst. Struct. Commun. 1998, 54, 808–810. [Google Scholar] [CrossRef]
  43. Adhikari, B.R.; Kim, D.; Bae, J.H.; Yeon, J.; Roshan, K.C.; Kang, S.K.; Lee, E.H. New category for active pharmaceutical ingredients, a low molecular weight organogelator: Crystal structure of atorvastatin calcium and its unusual phase transition behavior during dissolution. Cryst. Growth Des. 2016, 16, 7198–7204. [Google Scholar] [CrossRef]
  44. Hohenberg, P.; Kohn, W. Inhomogeneous electron gas. Phys. Rev. 1964, 136, 864–871. [Google Scholar] [CrossRef] [Green Version]
  45. Frisch, M.J.; Trucks, G.W.; Schlegel, H.B.; Scuseria, G.E.; Robb, M.A.; Cheeseman, J.R.; Scalmani, G.; Barone, V.; Petersson, G.A.; Nakatsuji, H. Gaussian 16, Revision C.01 2016; Computer Software; Gaussian Inc.: Wallingford, CT, USA, 2016. [Google Scholar]
  46. Becke, A.D. Density-functional thermochemistry. III. The role of exact exchange. J. Chem. Phys. 1993, 98, 5648–5652. [Google Scholar] [CrossRef] [Green Version]
  47. Chai, J.-D.; Head-Gordon, M. Long-range corrected hybrid density functionals with damped atom-atom dispersion corrections. Phys. Chem. Chem. Phys. 2008, 10, 6615–6620. [Google Scholar] [CrossRef] [Green Version]
  48. Boys, S.F.; Bernardi, F. The calculation of small molecular interactions by the differences of separate total energies. Some procedures with reduced errors. Mol. Phys. 1970, 19, 553–566. [Google Scholar] [CrossRef]
  49. Van Duijneveldt, F.B.; van Duijneveldt-van de Rijdt, J.G.C.M.; van Lenthe, J.H. State of the art in counterpoise theory. Chem. Rev. 1994, 94, 1873–1885. [Google Scholar] [CrossRef]
  50. Keith, T.A. AIMAll (Version 14.11.23), TK Gristmill Software, Overland Park, KS, USA. 2014. Available online: http://aim.tkgristmill.com/references.html (accessed on 26 November 2020).
  51. Bader, R.F.W. A quantum theory of molecular structure and its applications. Chem. Rev. 1991, 91, 893–928. [Google Scholar] [CrossRef]
  52. Johnson, E.R.; Keinan, S.; Mori-Sánchez, P.; Contreras-García, J.; Cohen, A.J.; Yang, W. Revealing noncovalent interactions. J. Am. Chem. Soc. 2010, 132, 6498–6506. [Google Scholar] [CrossRef] [Green Version]
  53. Lu, T.; Chen, F. Multiwfn: A multifunctional wavefunction analyzer. J. Comput. Chem. 2012, 33, 580–592. [Google Scholar] [CrossRef]
  54. Multiwfn. Available online: http://sobereva.com/multiwfn (accessed on 1 October 2020).
  55. Marenich, A.V.; Cramer, C.J.; Truhlar, D.G. Universal solvation model based on solute electron density and on a continuum model of the solvent defined by the bulk dielectric constant and atomic surface tensions. J. Phys. Chem. B 2009, 113, 6378–6396. [Google Scholar] [CrossRef] [PubMed]
  56. United States Pharmacopeial Convention. United States Pharmacopeia and National Formulary (USP 32–NF27); United States Pharmacopeial Convention: Rockville, MD, USA, 2009; Volume 2. [Google Scholar]
  57. Abdelwahab, N.S.; El-Zeiny, B.A.; Tohamy, S.I. Two spectrophotometric methods for simultaneous determination of some antihyperlipidemic drugs. J. Pharm. Anal. 2012, 2, 279–284. [Google Scholar] [CrossRef] [PubMed] [Green Version]
  58. Sharma, H.; Reddy, M.A.K.; Babu, C.N.; Bhatta, H.P.; Wagle, N.; Sapkota, H.P.; Dangi, N.B. Method development and validation of dual wavelength UV spectrophotometric method for simultaneous estimation of paracetamol and caffeine in combined dosage form by internal standard method. Asian J. Chem. 2015, 27, 4666–4668. [Google Scholar] [CrossRef]
  59. Nogami, H.; Nagai, T.; Suzuki, A. Studies on powdered preparations. XVII. Dissolution rate of sulfonamides by rotating disk method.3,4. Chem. Pharm. Bull. 1966, 14, 329–338. [Google Scholar] [CrossRef] [PubMed] [Green Version]
  60. Skotnicki, M.; Aguilar, J.A.; Pyda, M.; Hodgkinson, P. Bisoprolol and bisoprolol-valsartan compatibility studied by differential scanning calorimetry, nuclear magnetic resonance and X-Ray powder diffractometry. Pharm. Res. 2015, 32, 414–429. [Google Scholar] [CrossRef] [Green Version]
  61. Da Silva, E.P.; Pereira, M.A.V.; De Barros Lima, I.P.; Lima, N.G.P.B.; Barbosa, E.G.; Aragão, C.F.S.; Gomes, A.P.B. Compatibility study between atorvastatin and excipients using DSC and FTIR. J. Therm. Anal. Calorim. 2016, 123, 933–939. [Google Scholar] [CrossRef]
  62. Cristea, M.; Baul, B.; Ledeţi, I.; Ledeţi, A.; Vlase, G.; Vlase, T.; Karolewicz, B.; Ştefănescu, O.; Dragomirescu, A.O.; Mureşan, C.; et al. Preformulation studies for atorvastatin calcium: An instrumental approach. J. Therm. Anal. Calorim. 2019, 138, 2799–2806. [Google Scholar] [CrossRef]
  63. Araya-Sibaja, A.M.; Maduro de Campos, C.E.; Fandaruff, C.; Vega-Baudrit, J.R.; Guillén-Girón, T.; Navarro-Hoyos, M.; Cuffini, S.L. Irbesartan desmotropes: Solid-state characterization, thermodynamic study and dissolution properties. J. Pharm. Anal. 2019, 9, 339–346. [Google Scholar] [CrossRef]
  64. Moura Ramos, J.J.; Diogo, H.P. Thermal behavior and molecular mobility in the glassy state of three anti-hypertensive pharmaceutical ingredients. RSC Adv. 2017, 7, 10831–10840. [Google Scholar] [CrossRef] [Green Version]
  65. Bruni, G.; Amici, L.; Berbenni, V.; Marini, A.; Orlandi, A. Drug-excipient compatibility studies: Search of interaction indicators. J. Therm. Anal. Calorim. 2002, 68, 561–573. [Google Scholar] [CrossRef]
  66. Bruni, G.; Berbenni, V.; Milanese, C.; Girella, A.; Marini, A. Drug-excipient compatibility studies in binary and ternary mixtures by physico-chemical techniques. J. Therm. Anal. Calorim. 2010, 102, 193–201. [Google Scholar] [CrossRef]
  67. Bharate, S.S.; Bharate, S.B.; Bajaj, A.N. Interactions and incompatibilities of pharmaceutical excipients with active pharmaceutical ingredients: A comprehensive review. J. Excipients Food Chem. 2010, 1, 3–26. [Google Scholar]
  68. Rumondor, A.C.F.; Ivanisevic, I.; Bates, S.; Alonzo, D.E.; Taylor, L.S. Evaluation of drug-polymer miscibility in amorphous solid dispersion systems. Pharm. Res. 2009, 26, 2523–2534. [Google Scholar] [CrossRef] [PubMed]
  69. Hancock, B.C.; Shamblin, S.L.; Zografi, G. Molecular mobility of amorphous pharmaceutical solids below their glass transition temperatures. Pharm. Res. An. Off. J. Am. Assoc. Pharm. Sci. 1995, 12, 799–806. [Google Scholar] [CrossRef]
  70. Kini, A.; Patel, S.B. Phase behavior, intermolecular interaction, and solid state characterization of amorphous solid dispersion of Febuxostat. Pharm. Dev. Technol. 2017, 22, 45–57. [Google Scholar] [CrossRef]
  71. Hoare, M. Stability and local order in simple amorphous packings. Ann. N. Y. Acad. Sci. 1976, 279, 186–207. [Google Scholar] [CrossRef]
  72. Hutchinson, J.M. Physical aging of polymers. Prog. Polym. Sci. 1995, 20, 703–760. [Google Scholar] [CrossRef]
  73. Shalaev, E.; Zografi, G. The concept of “structure” in amorphous solids from the perspective of the pharmaceutical sciences. In Amorphous Food and Pharmaceutical Systems; Royal Society of Chemistry: London, UK, 2007; pp. 11–30. ISBN 9781847550118. [Google Scholar]
  74. Bhattacharya, S.; Suryanarayanan, R. Local mobility in amorphous pharmaceuticals—Characterization and implications on stability. J. Pharm. Sci. 2009, 98, 2935–2953. [Google Scholar] [CrossRef]
  75. Czerniecka-Kubicka, A.; Zarzyka, I.; Pyda, M. Long-term physical aging tracked by advanced thermal analysis of Poly(N-Isopropylacrylamide): A smart polymer for drug delivery system. Molecules 2020, 25, 3810. [Google Scholar] [CrossRef]
  76. Skotnicki, M.; Drogoń, A.; Calvin, J.J.; Rosen, P.F.; Woodfield, B.F.; Pyda, M. Heat capacity and enthalpy of indapamide. Thermochim. Acta 2019, 674, 36–43. [Google Scholar] [CrossRef]
  77. Shamblin, S.L.; Tang, X.; Chang, L.; Hancock, B.C.; Pikal, M.J. Characterization of the time scales of molecular motion in pharmaceutically important glasses. J. Phys. Chem. B 1999, 103, 4113–4121. [Google Scholar] [CrossRef]
  78. Hodge, R.L.; Kaduk, J.A.; Gindhart, A.M.; Blanton, T.N. Crystal structure of atorvastatin calcium trihydrate Form i (Lipitor®), (C33H34FN2O5)2 Ca(H2O)3. Powder Diffr. 2020, 35, 136–143. [Google Scholar] [CrossRef]
  79. Brus, J.; Urbanova, M.; Sedenkova, I.; Brusova, H. New perspectives of 19F MAS NMR in the characterization of amorphous forms of atorvastatin in dosage formulations. Int. J. Pharm. 2011, 409, 62–74. [Google Scholar] [CrossRef] [PubMed]
  80. Bauer, M.; Harris, R.K.; Rao, R.C.; Apperley, D.C.; Rodger, C.A. NMR study of desmotropy in Irbesartan, a tetrazole-containing pharmaceutical compound. J. Chem. Soc. Perkin Trans. 2 1998, 475–481. [Google Scholar] [CrossRef]
  81. Franca, C.A.; Etcheverry, S.B.; Diez, R.P.; Williams, P.A.M. Irbesartan: FTIR and Raman spectra. Density functional study on vibrational and NMR spectra. J. Raman Spectrosc. 2009, 40, 1296–1300. [Google Scholar] [CrossRef]
  82. Espinosa, E.; Molins, E.; Lecomte, C. Hydrogen bond strengths revealed by topological analyses of experimentally observed electron densities. Chem. Phys. Lett. 1998, 285, 170–173. [Google Scholar] [CrossRef]
  83. Spackman, M.A. Hydrogen bond energetics from topological analysis of experimental electron densities: Recognising the importance of the promolecule. Chem. Phys. Lett. 1999, 301, 425–429. [Google Scholar] [CrossRef]
  84. Fong, C.W. Statins in therapy: Understanding their hydrophilicity, lipophilicity, binding to 3-hydroxy-3-methylglutaryl-CoA reductase, ability to cross the blood brain barrier and metabolic stability based on electrostatic molecular orbital studies. Eur. J. Med. Chem. 2014, 85, 661–674. [Google Scholar] [CrossRef] [Green Version]
  85. Huq, F. Molecular modelling analysis of the metabolism of irbesartan. J. Pharmacol. Toxicol. 2007, 2, 238–247. [Google Scholar] [CrossRef] [Green Version]
Figure 1. Chemical structures of (a) atorvastatin calcium trihydrate (MATR = 1209.4 g mol−1) and (b) irbesartan—1H tetrazole tautomer (MIRB = 428.5 g mol−1).
Pharmaceutics 13 00118 g001
Figure 2. Standard DSC curves of crystalline atorvastatin (ATR), crystalline irbesartan (IRB) and their 80/20, 50/50 and 20/80 (w/w) physical mixtures. All runs obtained at a heating rate of 10 °C min−1.
Pharmaceutics 13 00118 g002
Figure 3. Second heating standard DSC curves of atorvastatin (ATR), irbesartan (IRB) and the 1:1 mol/mol atorvastatin-irbesartan (ATR-IRB) system. The curves show the glass transition phenomenon confirming amorphization of the APIs; a single glass transition for the mix indicates mixing of the material at the molecular level and co-amorphization of the system. All runs were obtained at a heating rate of 10 °C min−1.
Pharmaceutics 13 00118 g003
Figure 4. Standard DSC traces of (a) amorphous atorvastatin (ATR), (b) amorphous irbesartan (IRB), and (c) co-amorphous atorvastatin-irbesartan (ATR-IRB) unaged and aged at 45 °C for 1 and 8 h. The enthalpy relaxation (Δh) was not changed after aging in the case of ATR and co-am ATR-IRB, whereas a significant change is observed after 1 and 8 h of aging for IRB. All runs were obtained at a heating rate of 10 °C min−1.
Pharmaceutics 13 00118 g004
Figure 5. FT-IR spectra of (a) crystalline ATR, (b) amorphous ATR, (c) crystalline IRB, (d) amorphous IRB, (e) the physical mixture (PM) of crystalline ATR and IRB (1:1 mol/mol), and (f) co-amorphous ATR-IRB.
Pharmaceutics 13 00118 g005
Figure 6. Structure of the optimized ATR-IRB complex III (B3LYP/6-311++G(d,p)//B3LYP/6-31G(d,p) level of theory).
Pharmaceutics 13 00118 g006
Figure 7. Structure of the optimized ATR-IRB complex VII (B97D3/6-311++G(d,p)//B97D3/6-31G(d,p) level of theory).
Pharmaceutics 13 00118 g007
Figure 8. Colored contour surface of reduced density gradient (RDG) highlighting weak and strong interactions in the ATR-IRB complex III (B3LYP/6-311++G(d,p)//B3LYP/6-31G(d,p) level of theory; (blue) hydrogen bonds, (green) vdW interactions).
Pharmaceutics 13 00118 g008
Figure 9. Colored contour surface of reduced density gradient (RDG) highlighting weak and strong interactions in the ATR-IRB complex VII (B97D3/6-311++G(d,p)//B97D3/6-31G(d,p) level of theory; (blue) hydrogen bonds, (green) vdW interactions).
Pharmaceutics 13 00118 g009
Figure 10. Intrinsic dissolution profiles (n = 3) of (a) crystalline (cryst ATR), amorphous (am ATR) and co-amorphous atorvastatin (co-am ATR-IRB), and (b) crystalline (cryst IRB), amorphous (am IRB), and co-amorphous irbesartan (co-am ATR-IRB) in 2% w/v aqueous solution of sodium dodecyl sulphate.
Pharmaceutics 13 00118 g010
Table 1. Experimental and theoretical fusion parameters for crystalline atorvastatin (ATR), crystalline irbesartan (IRB), and physical mixtures (PMs) 80/20, 50/50, and 80/20 (w/w) determined by standard DSC.
SampleTfus ± SD/°CTfus T fus API   mix / ° C Δfushexp ± SD/J g−1Δfushtheor/J g−1Δfushexp − Δfushtheor/J g−1
ATRIRBATRIRBATRIRBATR + IRBATR + IRB
ATR150.2 ± 0.9N/AN/AN/A81 ± 3N/AN/AN/AN/A
IRBN/A183.8 ± 0.2 N/AN/AN/A94.1 ± 0.5N/AN/AN/A
ATR/IRB 80/20 PM158.0 ± 0.7NPE *−7.8NPE *NPE *NPE *72 ± 183.7−11.7
ATR/IRB 50/50 PM153.8 ± 0.6173 ± 2−3.610.8NPE *NPE *72 ± 587.6−15.6
ATR/IRB 20/80 PM151 ± 1177.9 ± 0.6−0.85.9NPE *NPE *70 ± 491.5−21.5
* Not possible to estimate.
Table 2. Experimental glass transition temperatures (Tg), change in heat capacities (Δcp) at the Tg determined from standard DSC 2nd heating run and calculated Tgs from Couchman–Karasz equation (TgCK) for investigated samples.
SampleTg ± SD/°CΔcp ± SD/J g−1 °C−1TgCK/°CΔTg(TgTgCK)/°C
ATR145.6 ± 0.90.39 ± 0.04N/AN/A
IRB75.7 ± 0.20.50 ± 0.01N/AN/A
Co-am ATR-IRB118 ± 20.34 ± 0.01122.9−4.9
Table 3. Interaction energy (ΔE) calculated for ATR-IRB complexes at the B3LYP/6 311++G(d,p)//B3LYP/6-31G(d,p) (IIV) and B97D3/6-311++G(d,p)//B97D3/6-31G(d,p) level of theory (VVIII).
ATR-IRB ComplexInteraction Energy (ΔE) Calculated for ATR-IRB Complexes kcal mol−1
Level of Theory—B3LYP/6-311++G(d,p)//B3LYP/6-31Gd,p)
I−1.46
II−25.17
III−34.44
IV−17.00
Level of Theory—B97D3/6-311++G(d,p)//B97D3/6-31Gd,p)
V−3.24
VI−22.11
VII−33.20
VIII−10.65
Table 4. Experimental and theoretical frequencies (IR spectrum) of the selected groups estimated for pure ATR (ATRa or ATRb), pure IRB (IRBa or IRBb) and ATR-IRB complexes III and VII at the B3LYP/6-31G(d,p) (ATRa, IRBa, and III) or B97D3/6-31G(d,p) level of theory (ATRb, IRBb, and VII). Superscript “a” and “b” indicate calculations using B3LYP or B97D3 functional, respectively.
GroupWavenumber/cm−1
ExperimentalCalculated
cryst ATRam ATRam IRBcryst IRBco-am ATR-IRBATRaATRbIRBaIRBbIIIVII
C=OATR1650.81660.7N/AN/A1666.91633.31641.7N/AN/A1727.6 *1649.3 *
C=OIRBN/AN/A1732.91728.51722.1N/AN/A1886.31821.41765.91719.8
C=Nar(IRB)N/AN/A1617.21626.51636.2N/AN/A1745.51650.11711.31651.7
* Average value from two ATR within the complex.
Publisher’s Note: MDPI stays neutral with regard to jurisdictional claims in published maps and institutional affiliations.

