Amorphisation of Free Acid Ibuprofen and Other Profens in Mixtures with Nanocellulose: Dry Powder Formulation Strategy for Enhanced Solubility


Abstract
:1. Introduction
2. Materials and Methods
2.1. Materials
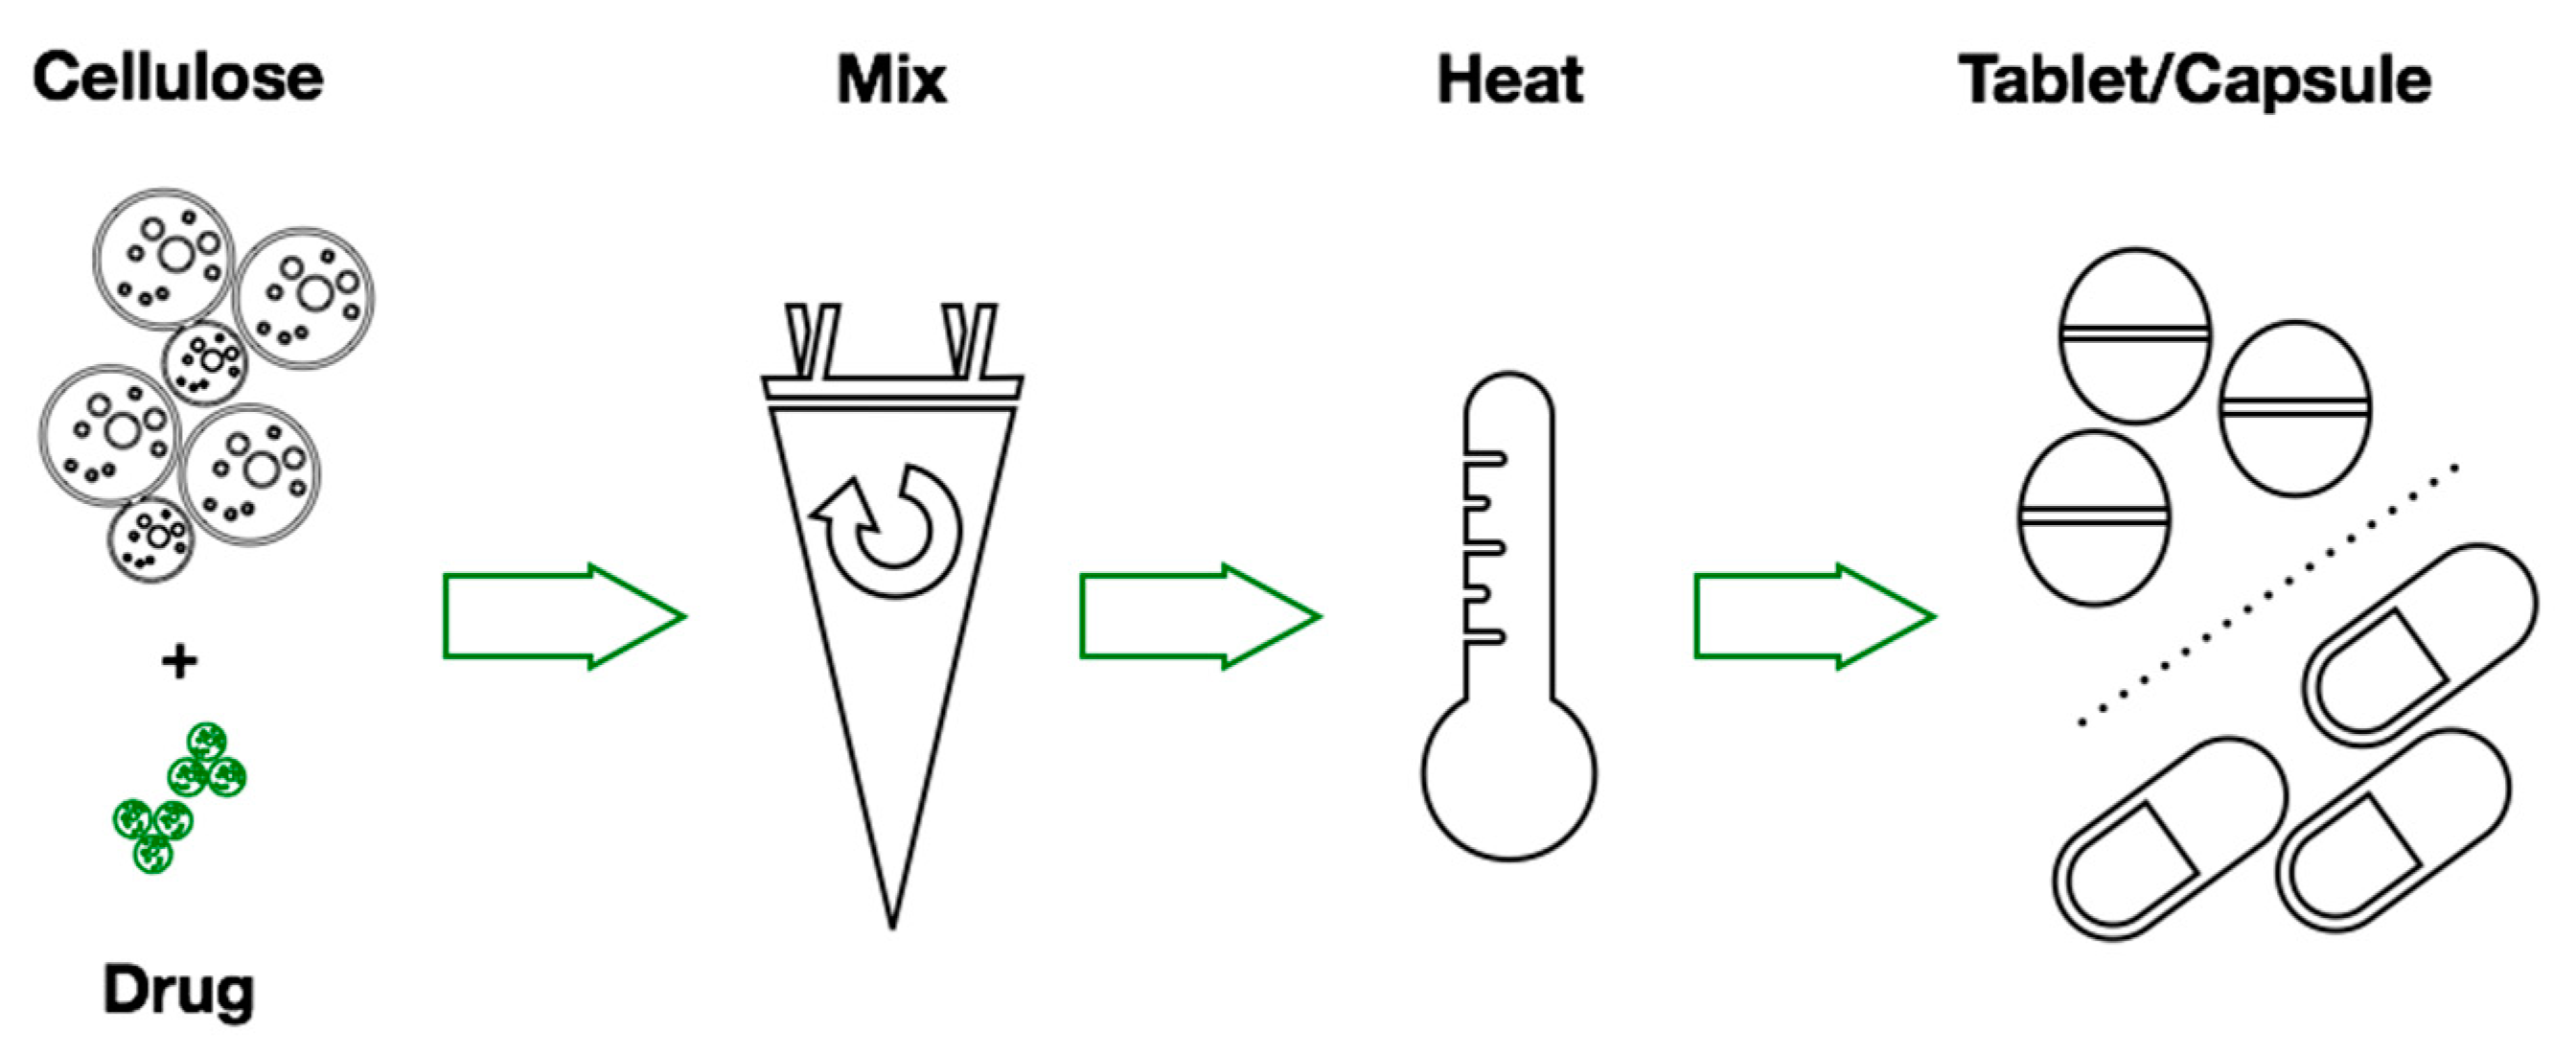
2.2. Mixture Preparation
2.2.1. Physical Mixtures Preparation
2.2.2. Heated Mixtures Preparation
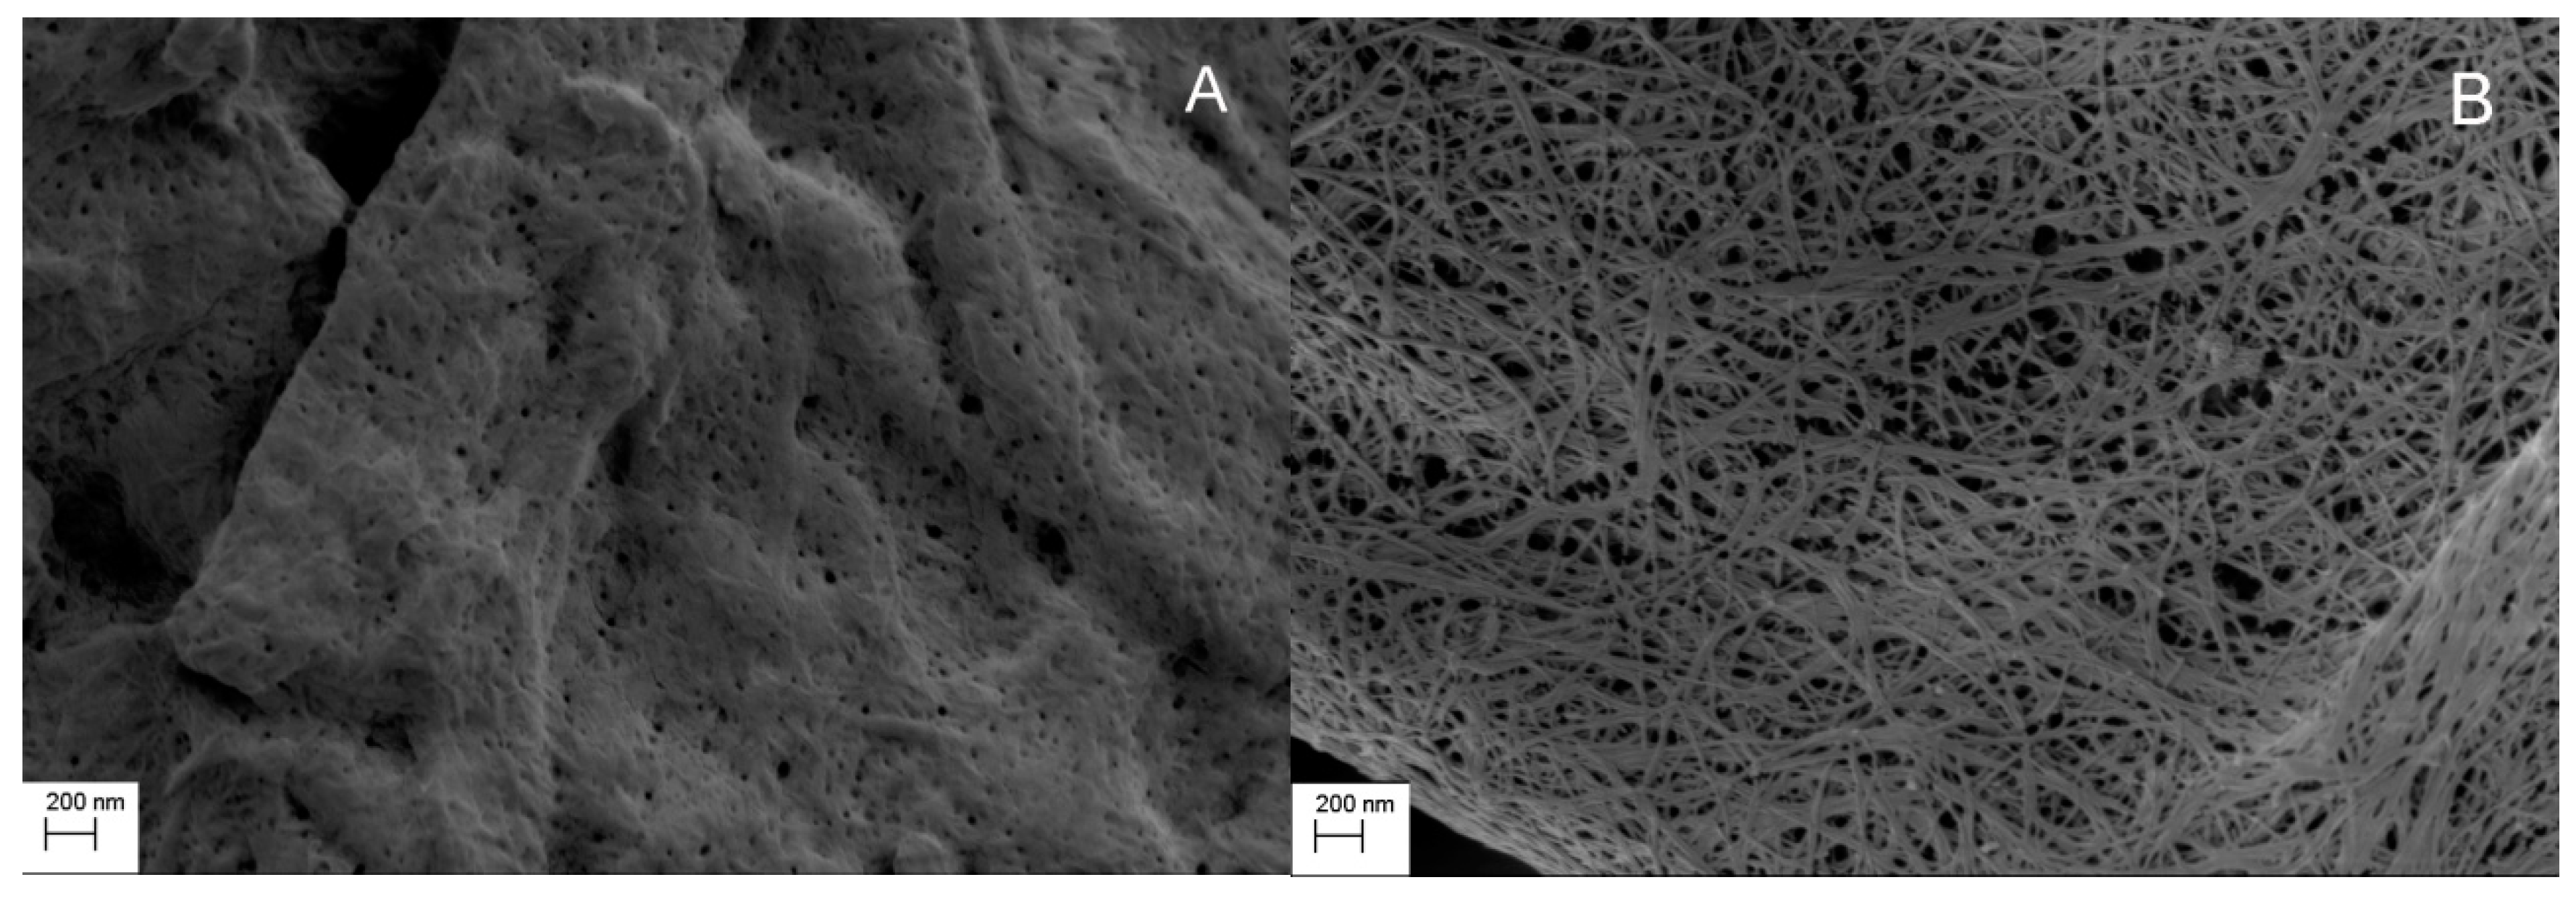
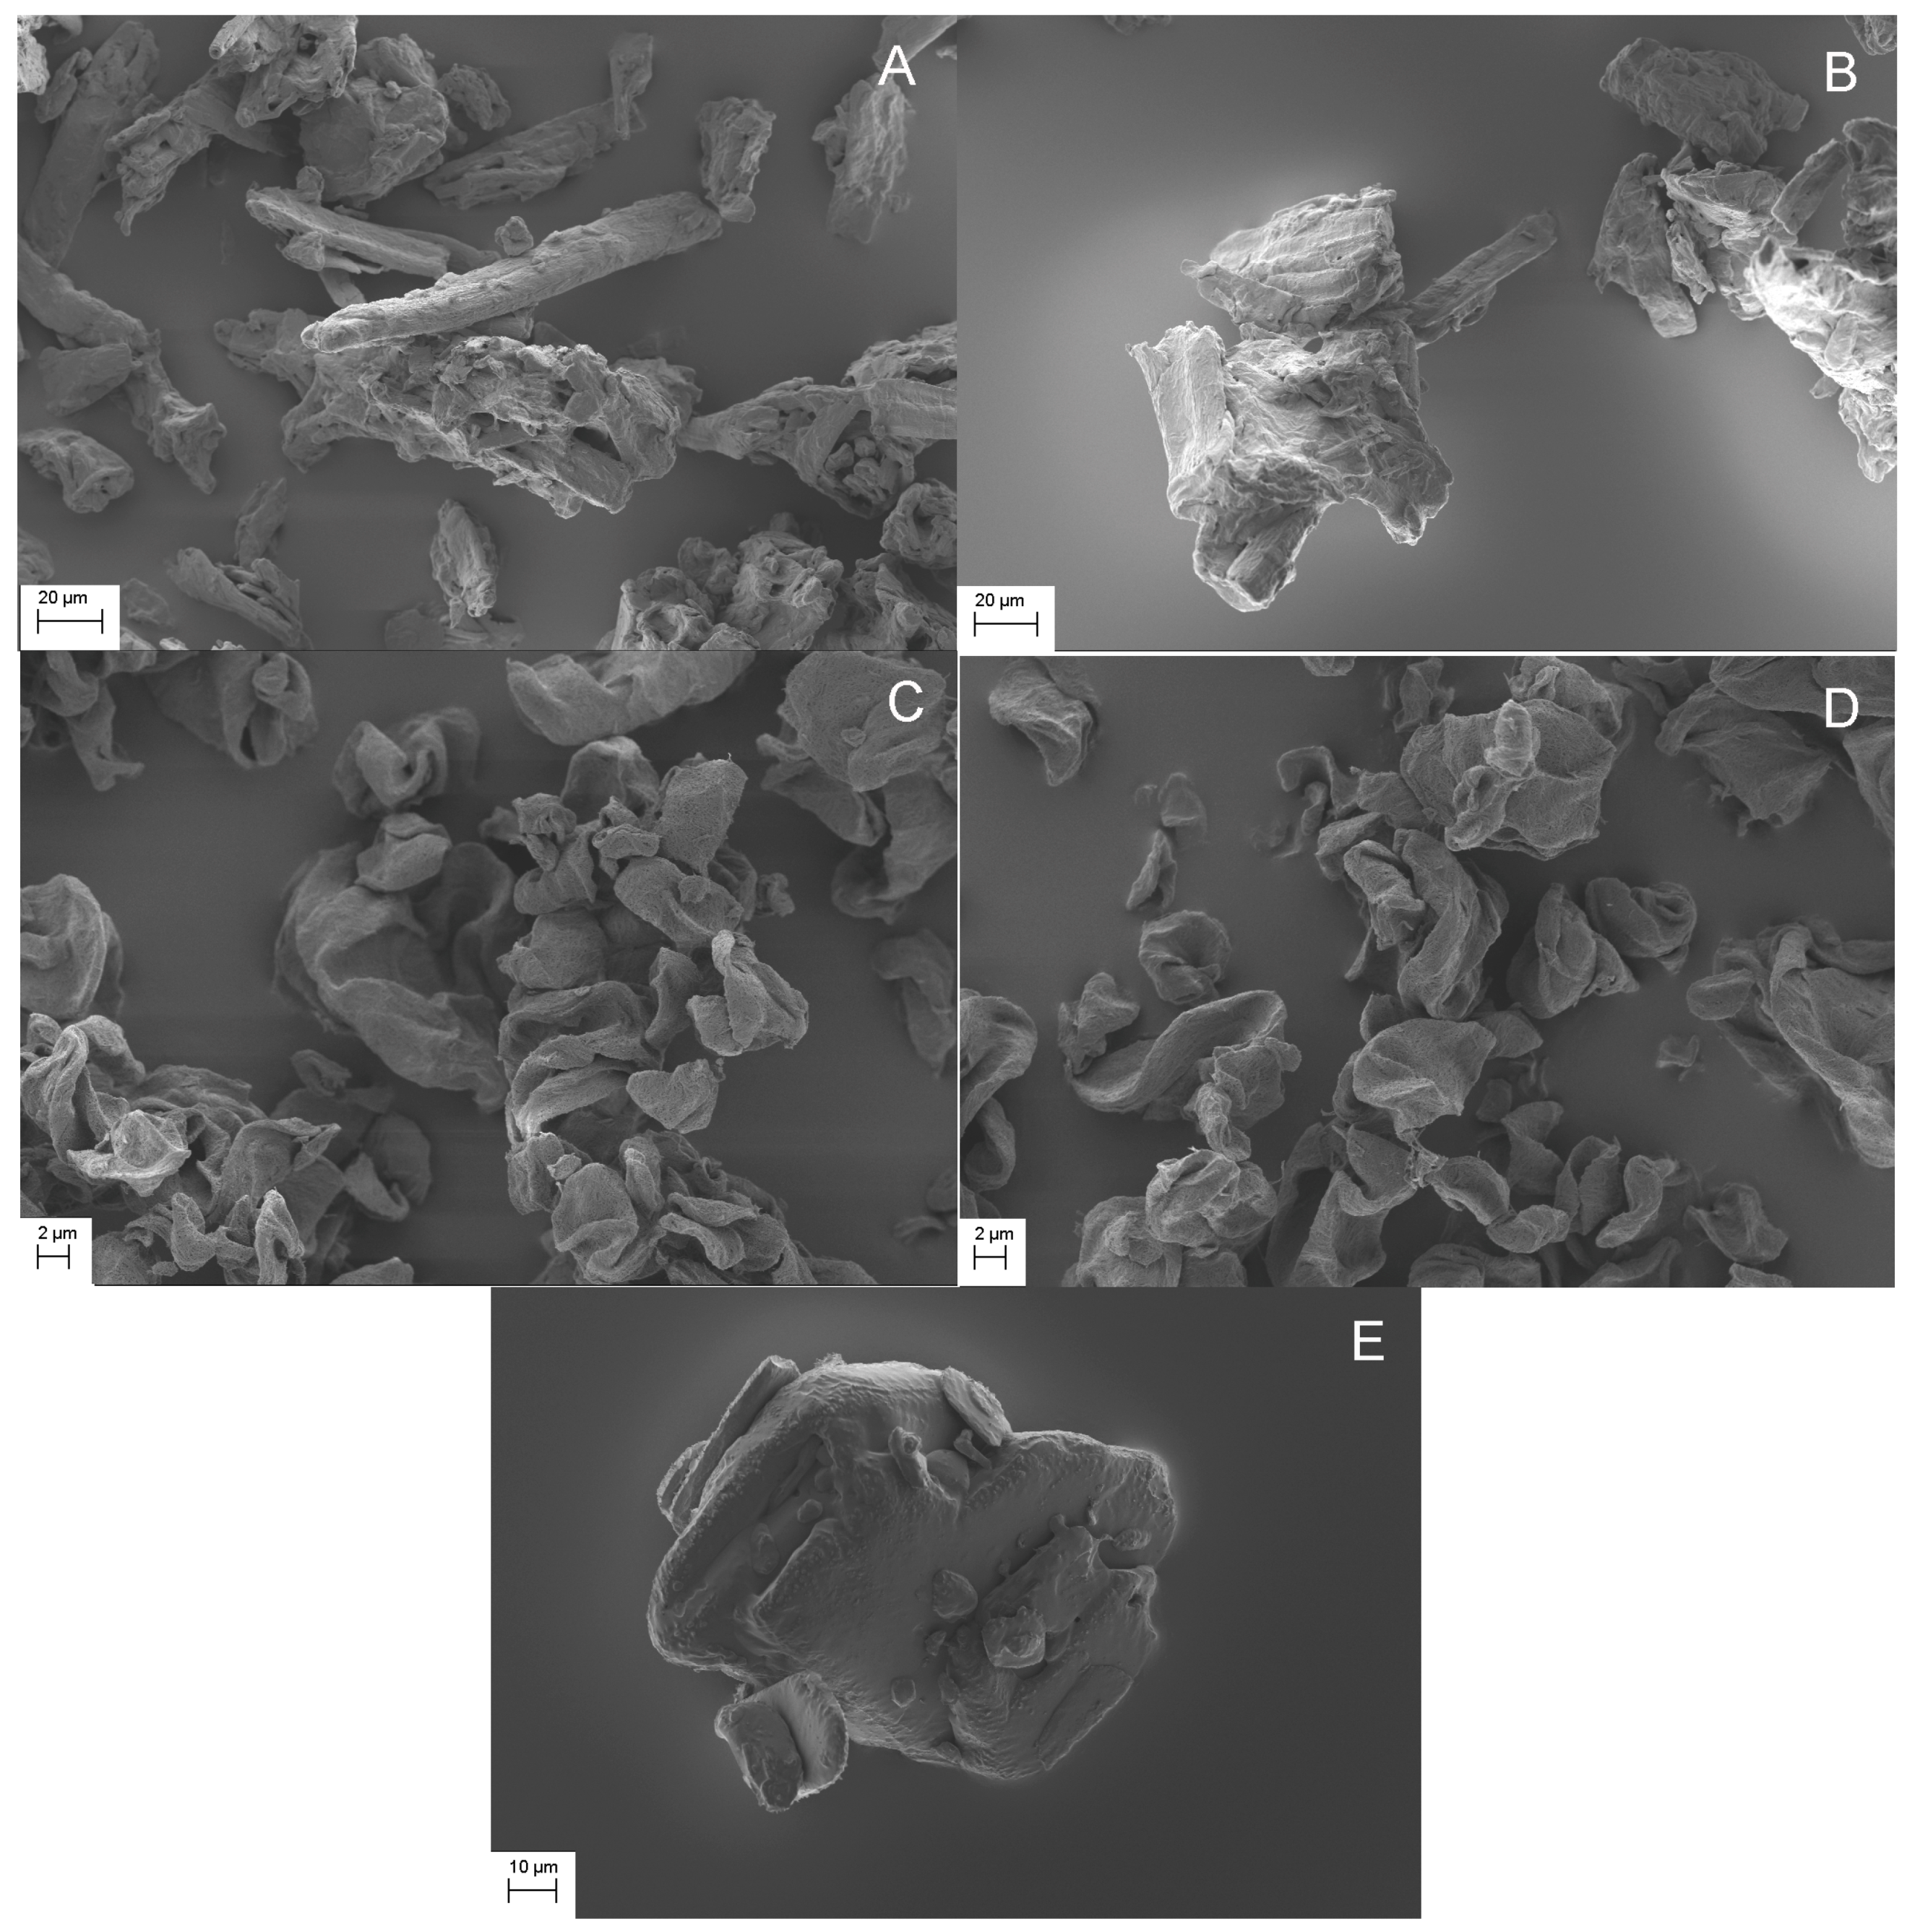
2.3. Scanning Electron Microscopy (SEM)
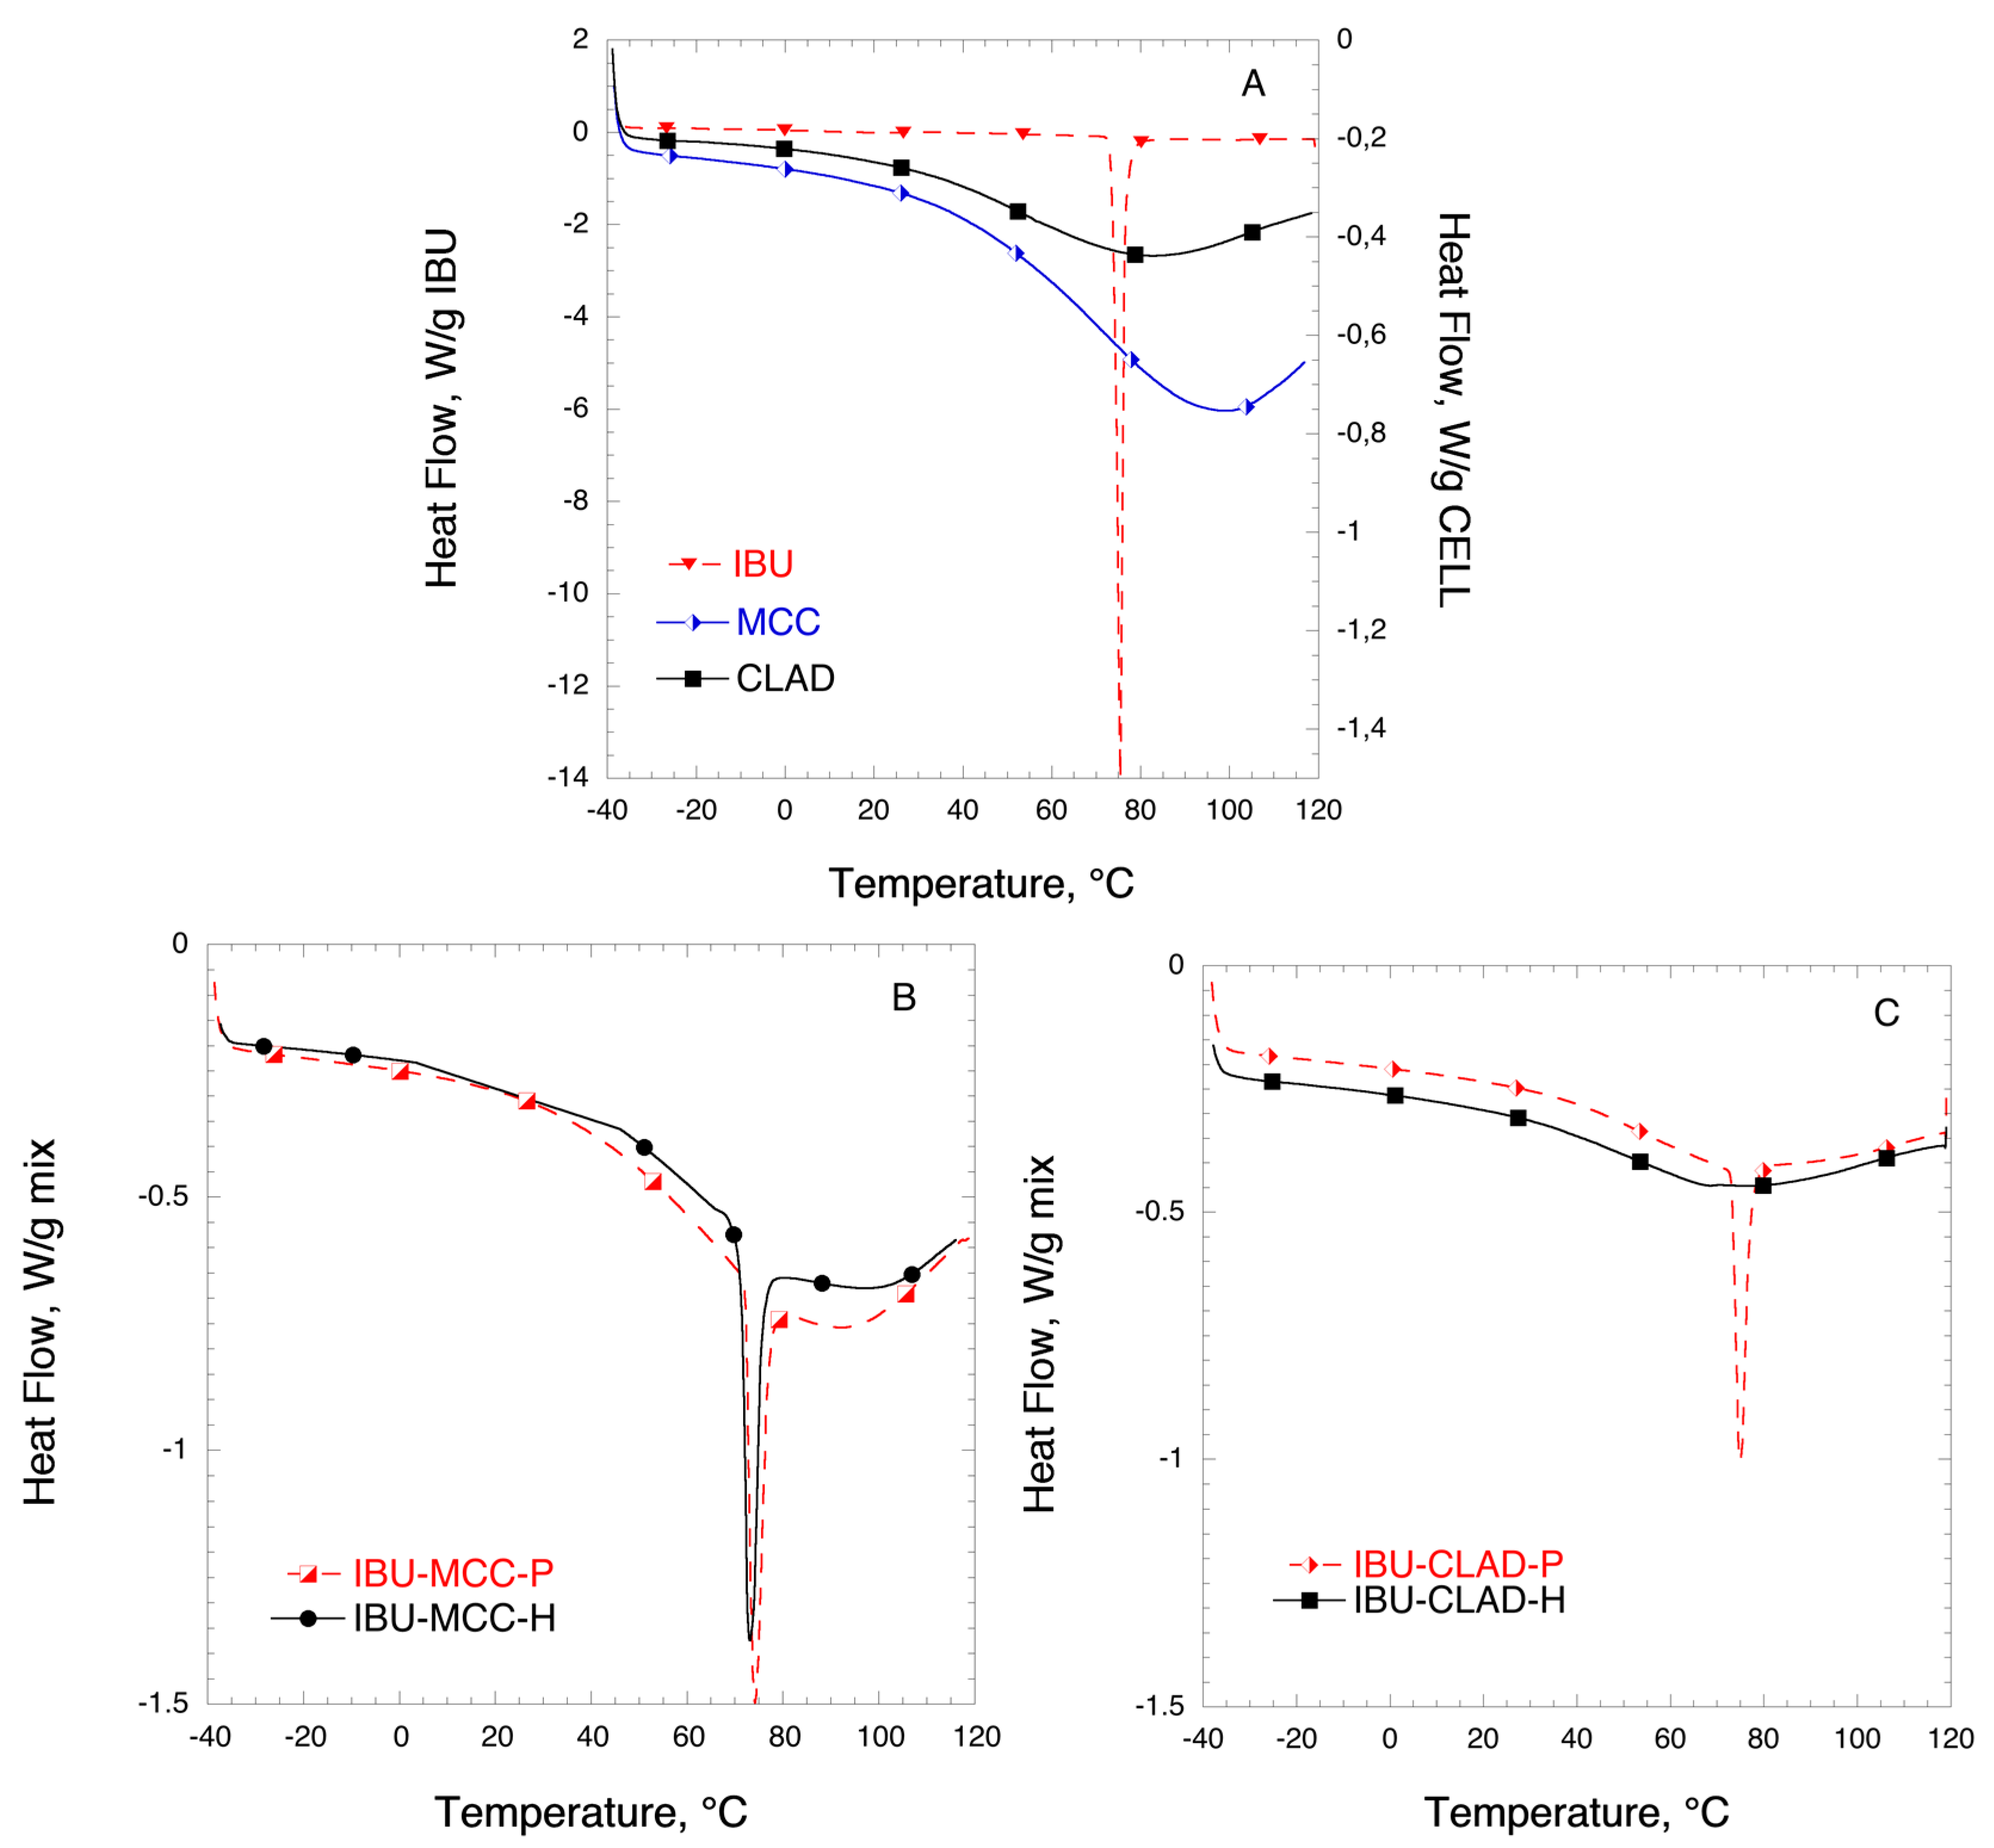
2.4. Differential Scanning Calorimetry (DSC)
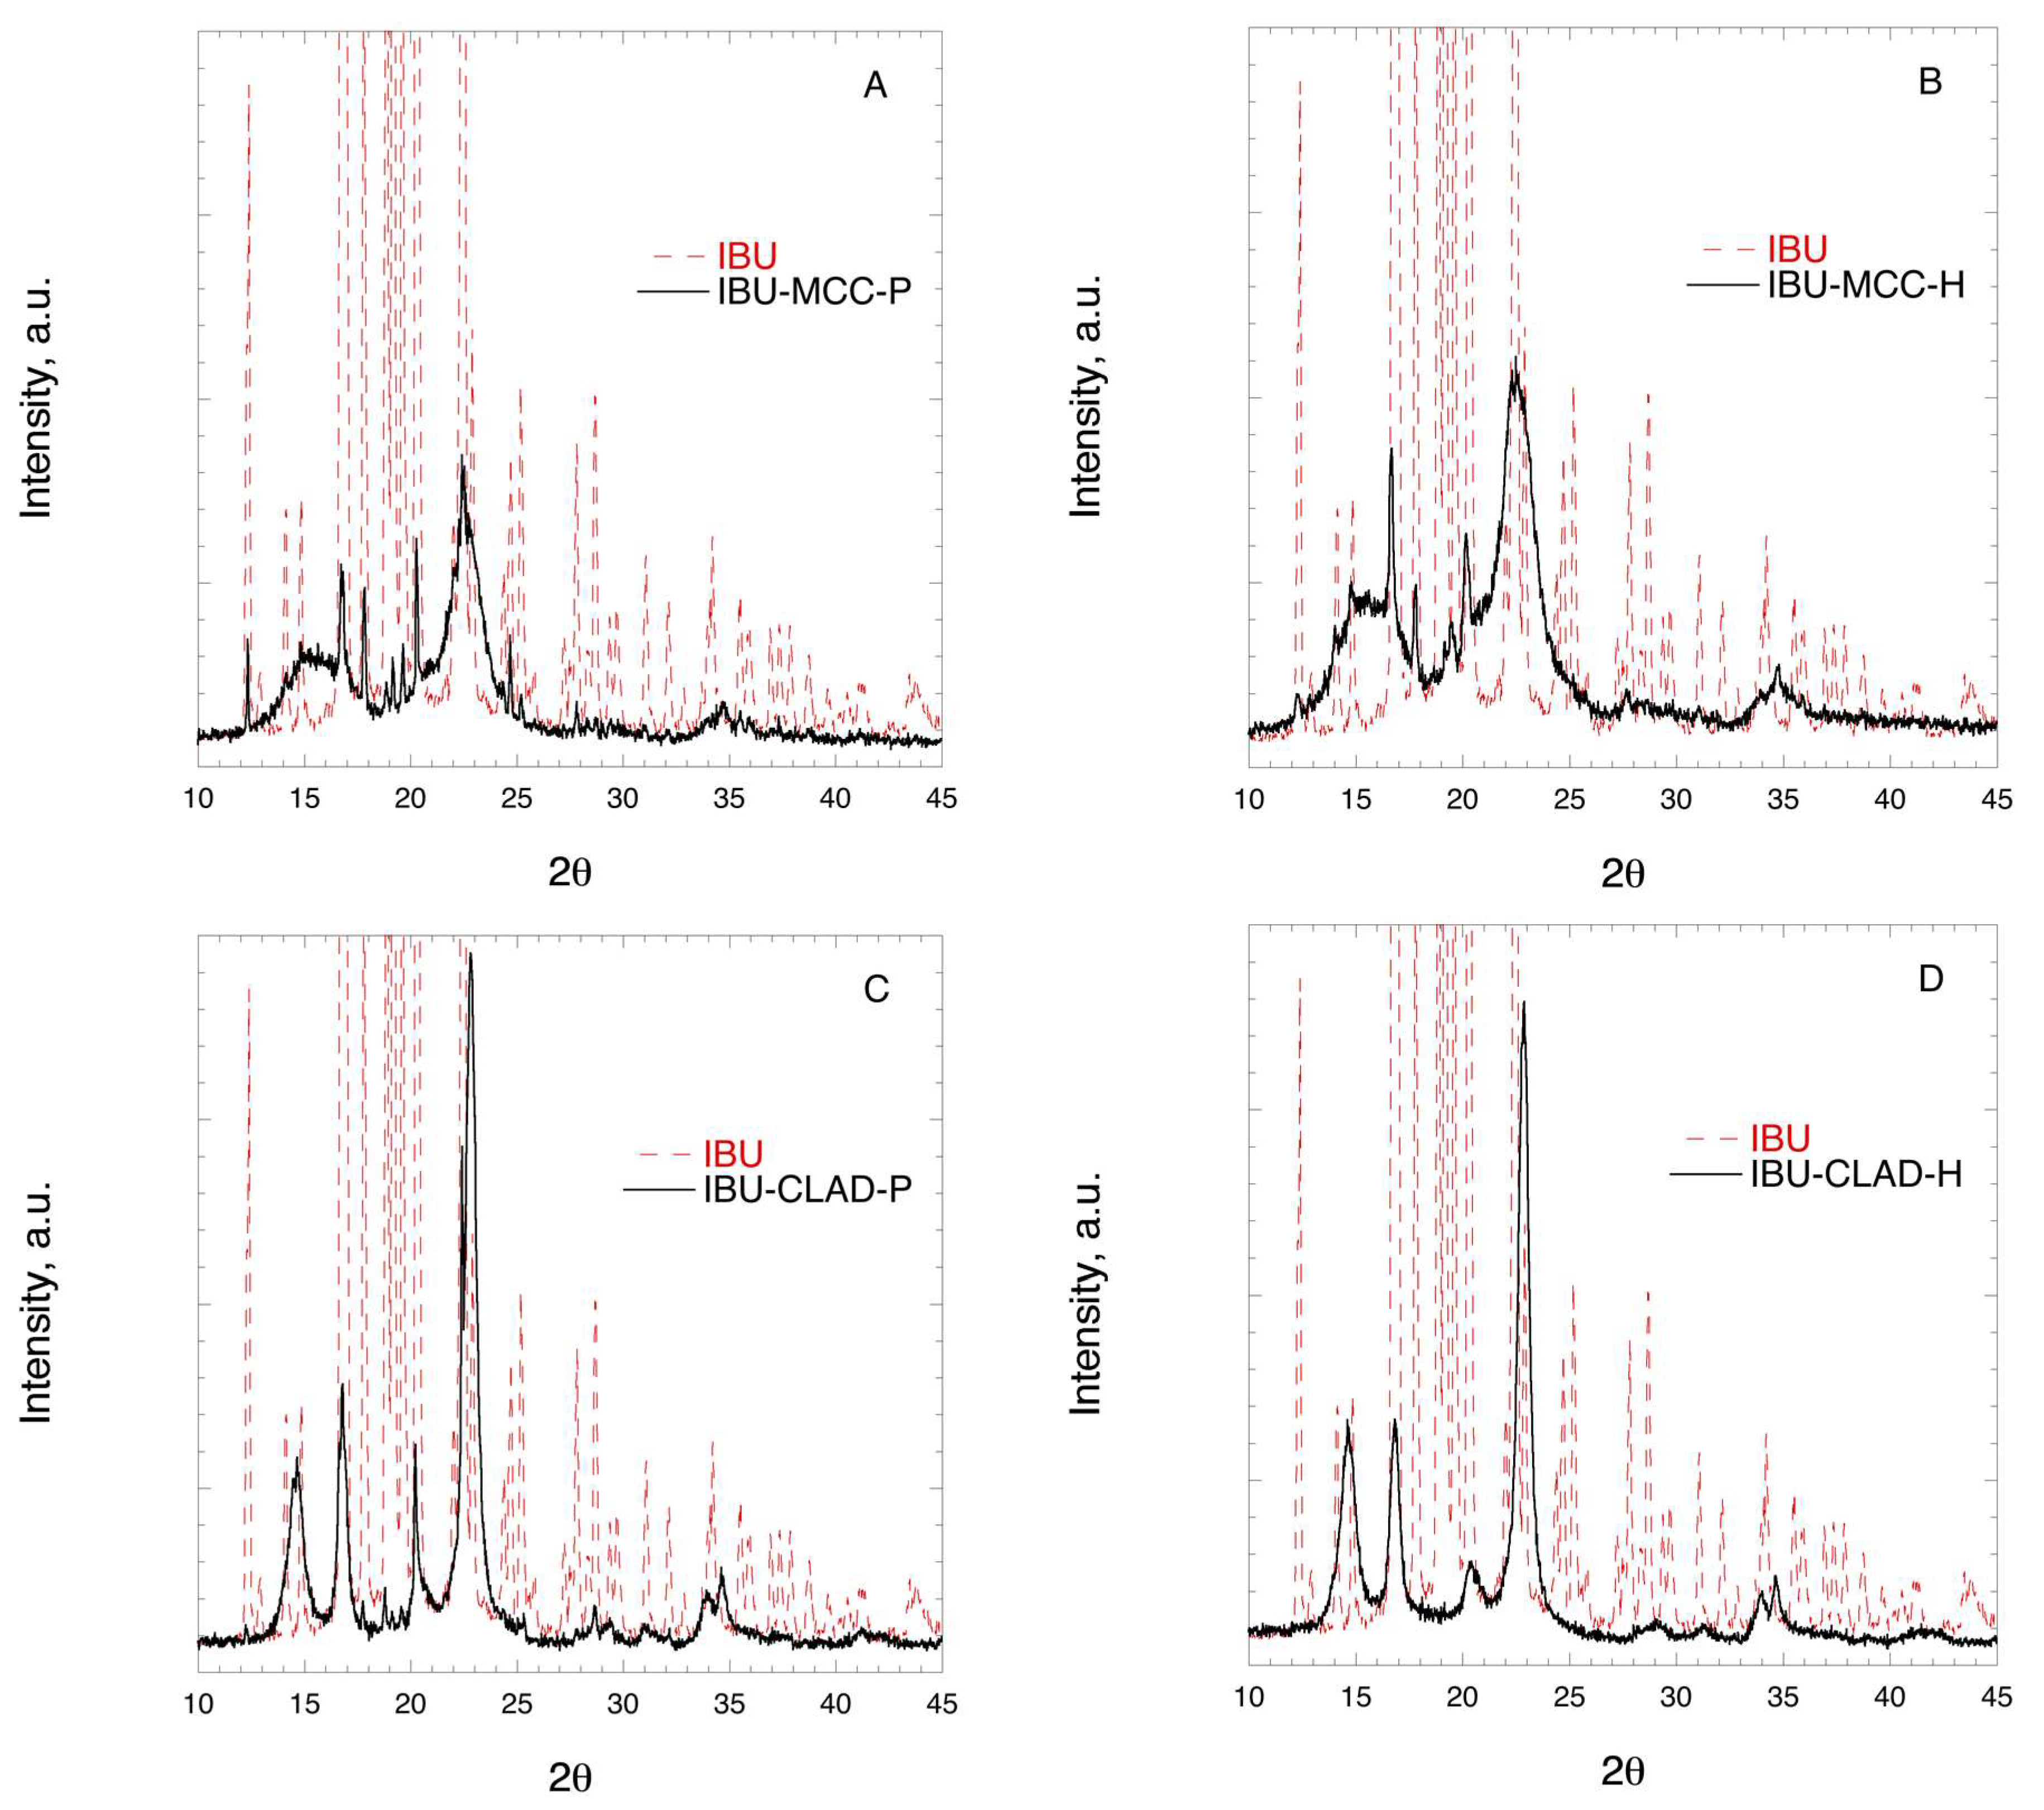
2.5. X-ray Diffraction (XRD)
2.6. Fourier-Transform Infrared Spectroscopy (FTIR)
2.7. In Vitro Drug Release—Dissolution Test in Biorelevant Media
2.8. HPLC Analysis
2.9. In Vivo Drug Release—Administration in Animals
2.10. Analysis of Plasma Samples
2.11. Plasma Sample Preparation
2.12. Pharmacokinetic Data Evaluation
- -
- AUC0–t (area under the curve from 0 h to the time point of the last quantifiable concentration) was calculated according to the log linear trapezoidal method, μg mL−1;
- -
- AUC0–∞ (area under the curve from time 0 to infinity) was calculated as the sum of AUC0–t and AUCt–∞, where AUCt–∞ = Ct/λz (the measured concentration at the last time point with quantifiable data divided by the elimination rate constant), μg mL−1;
- -
- Mean residence time (MRT), min;
- -
- Non-compartmental t½ (terminal half-life), min.
3. Results
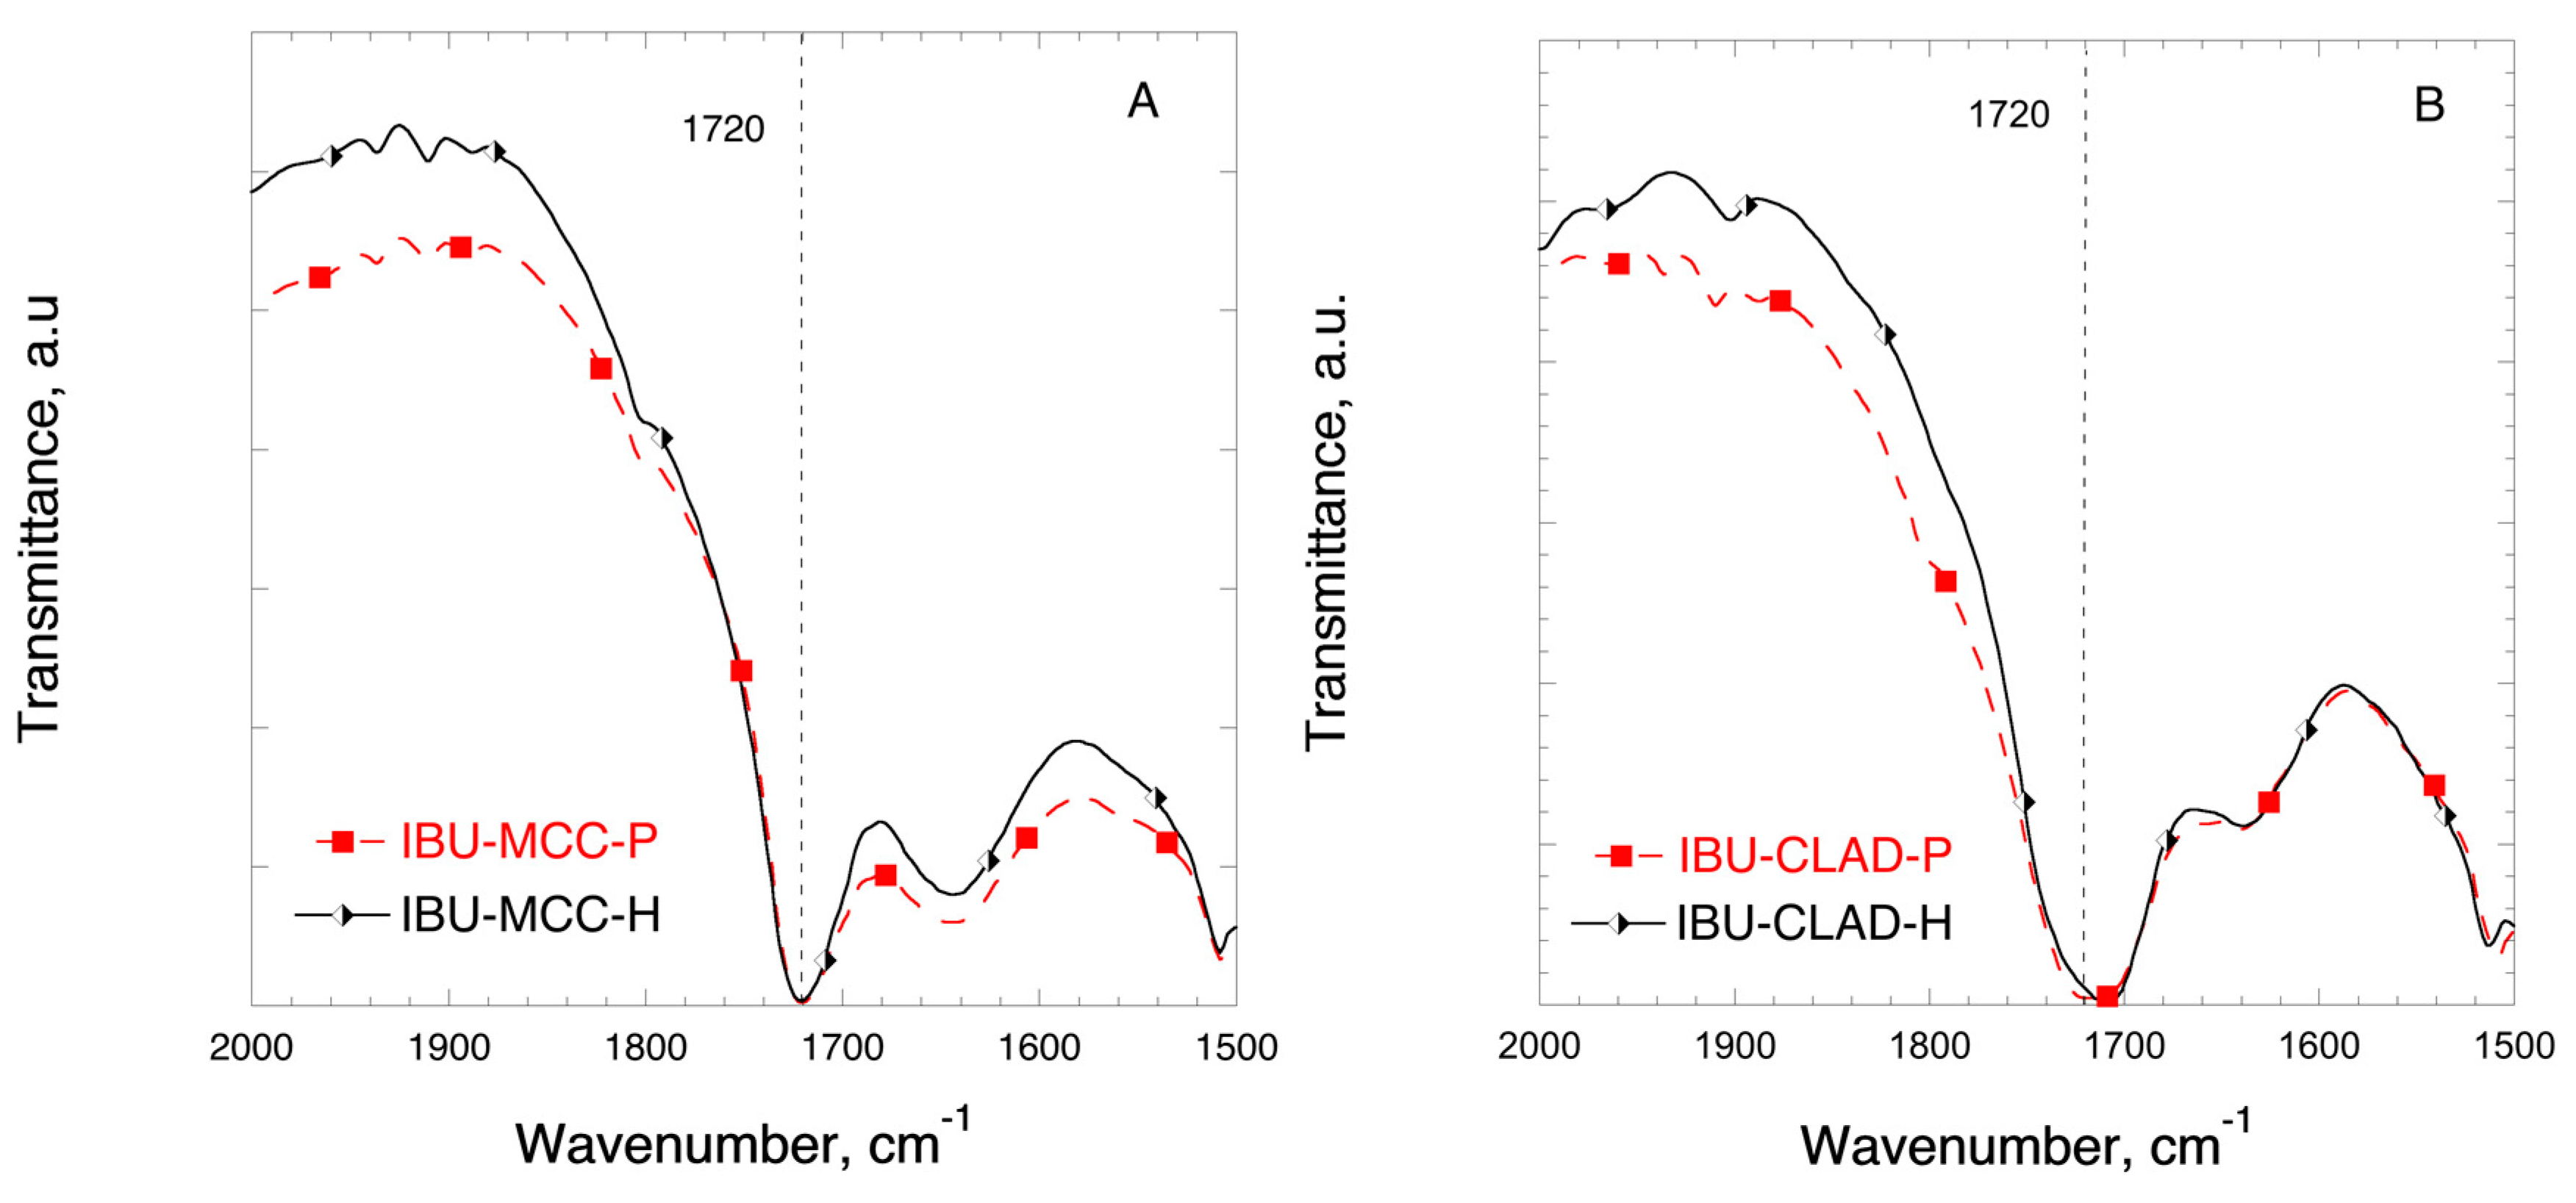
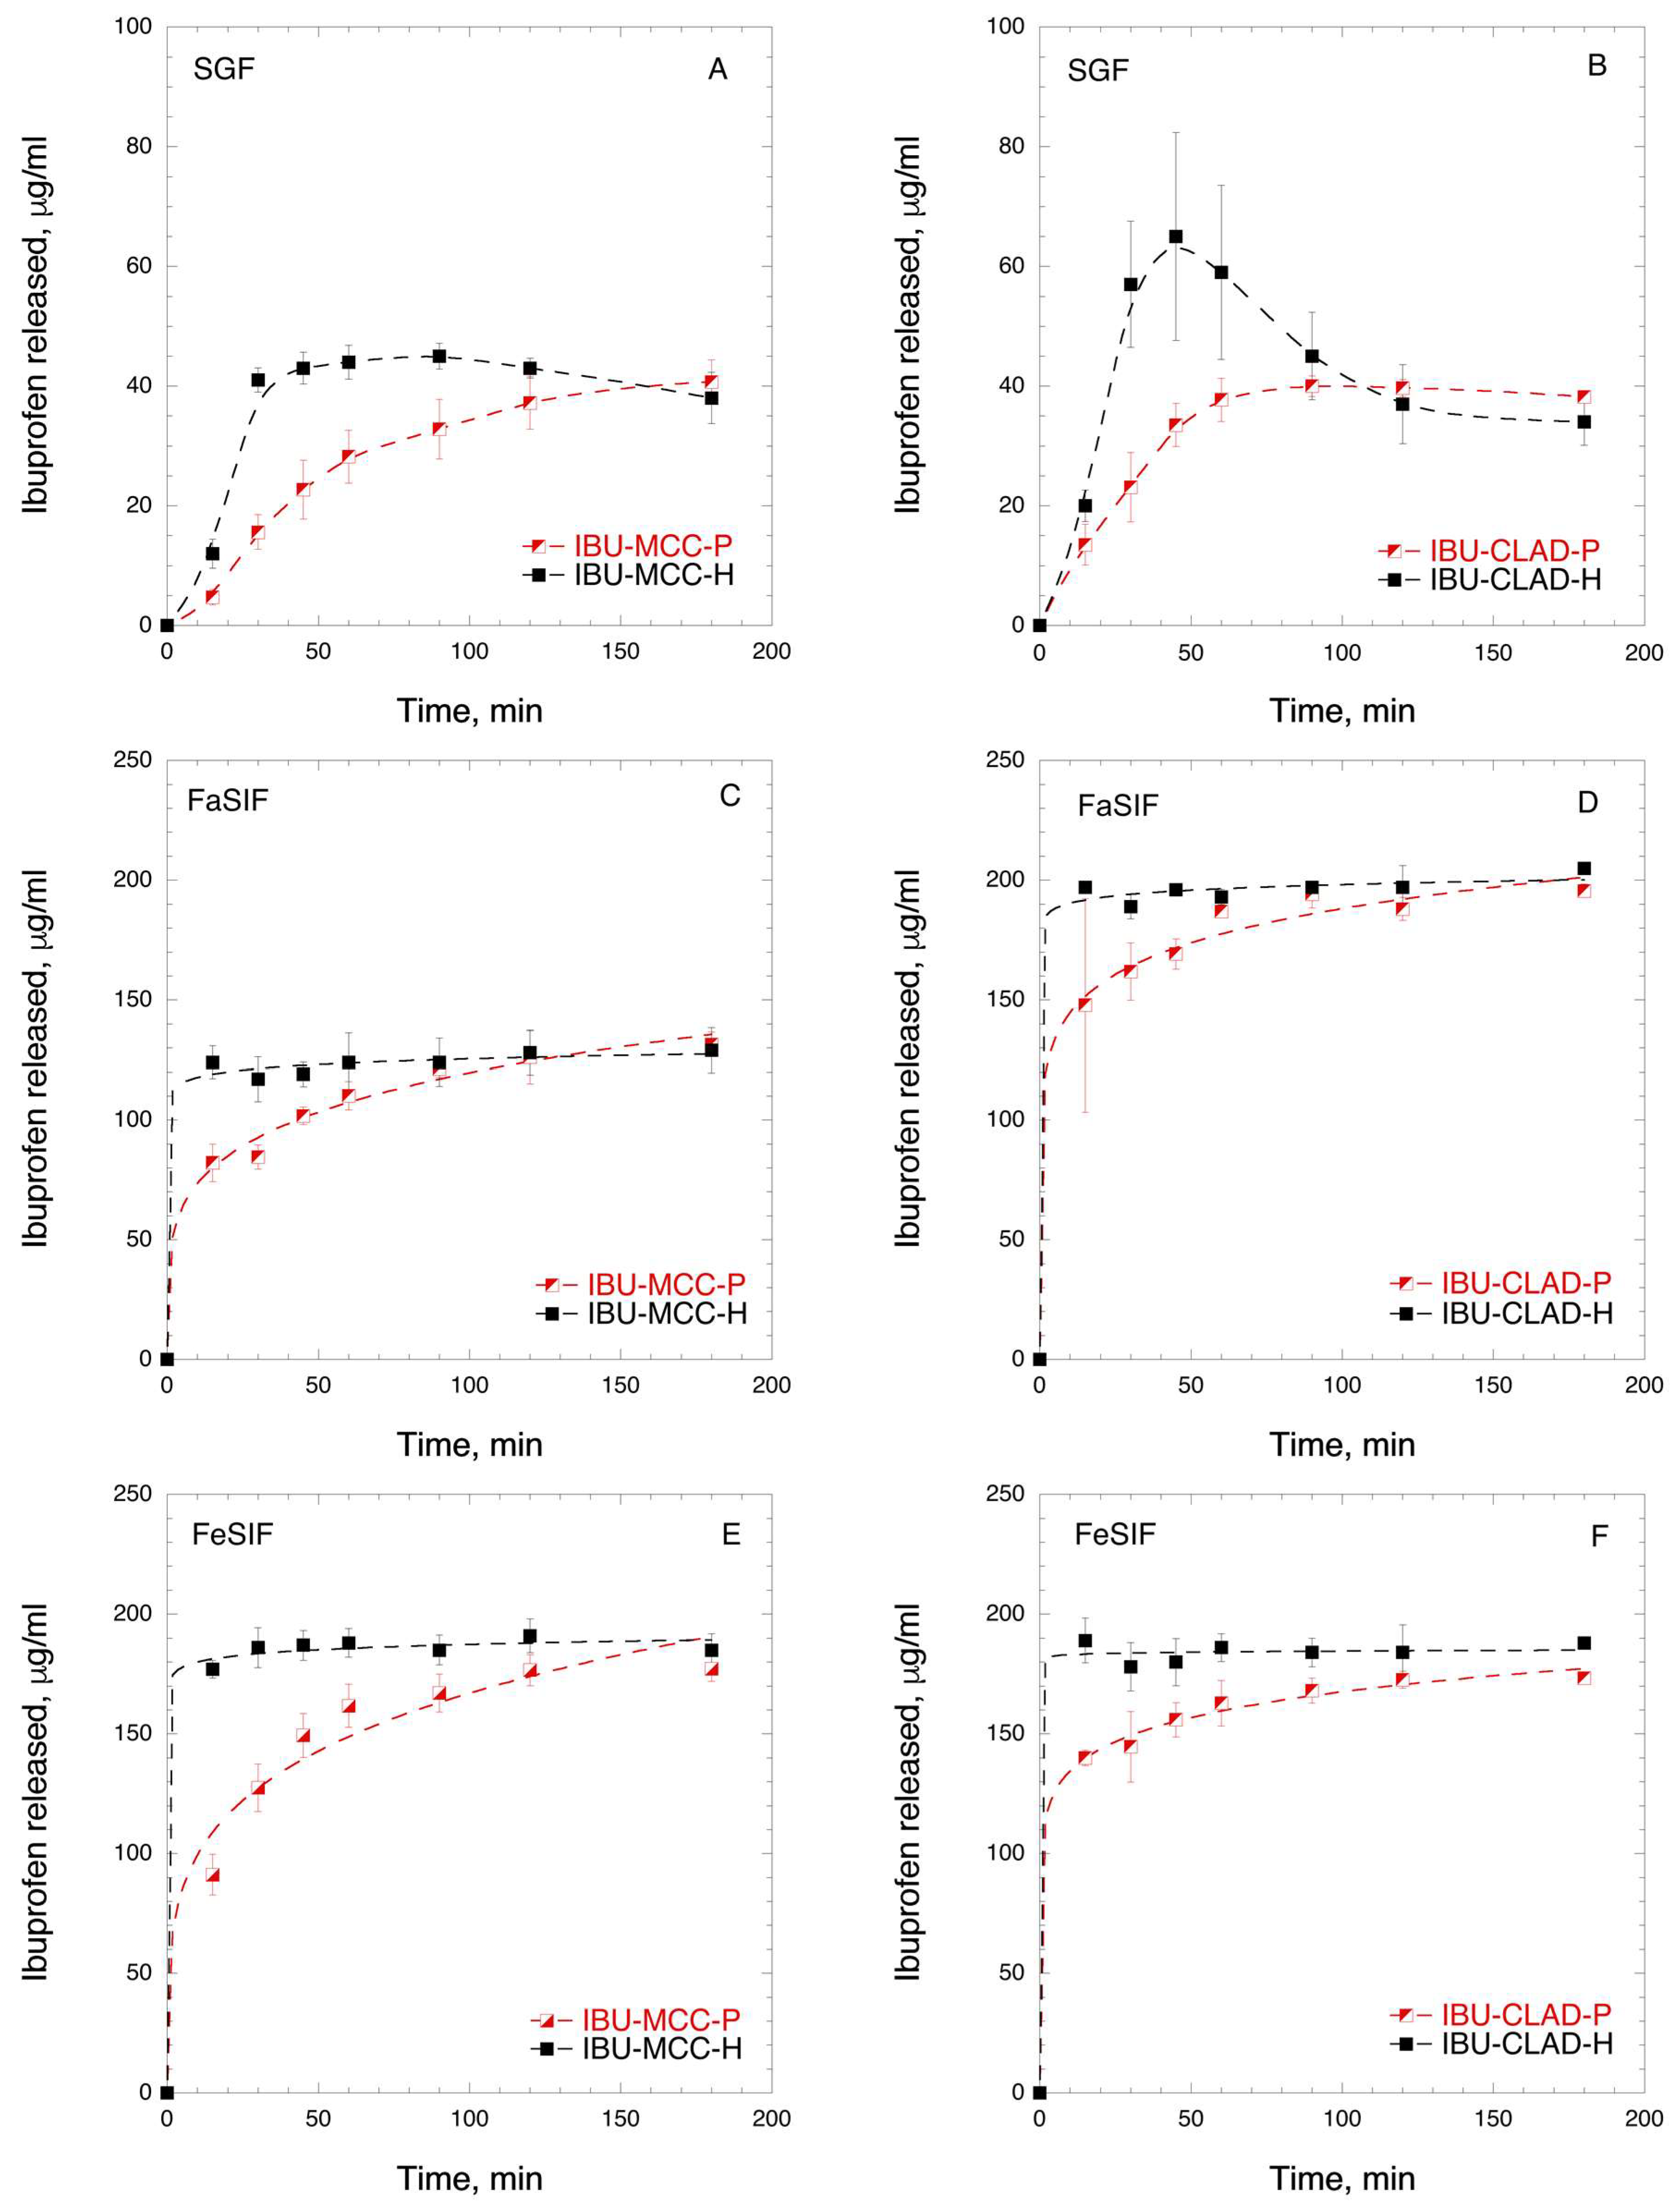
3.1. Ibuprofen Mixtures
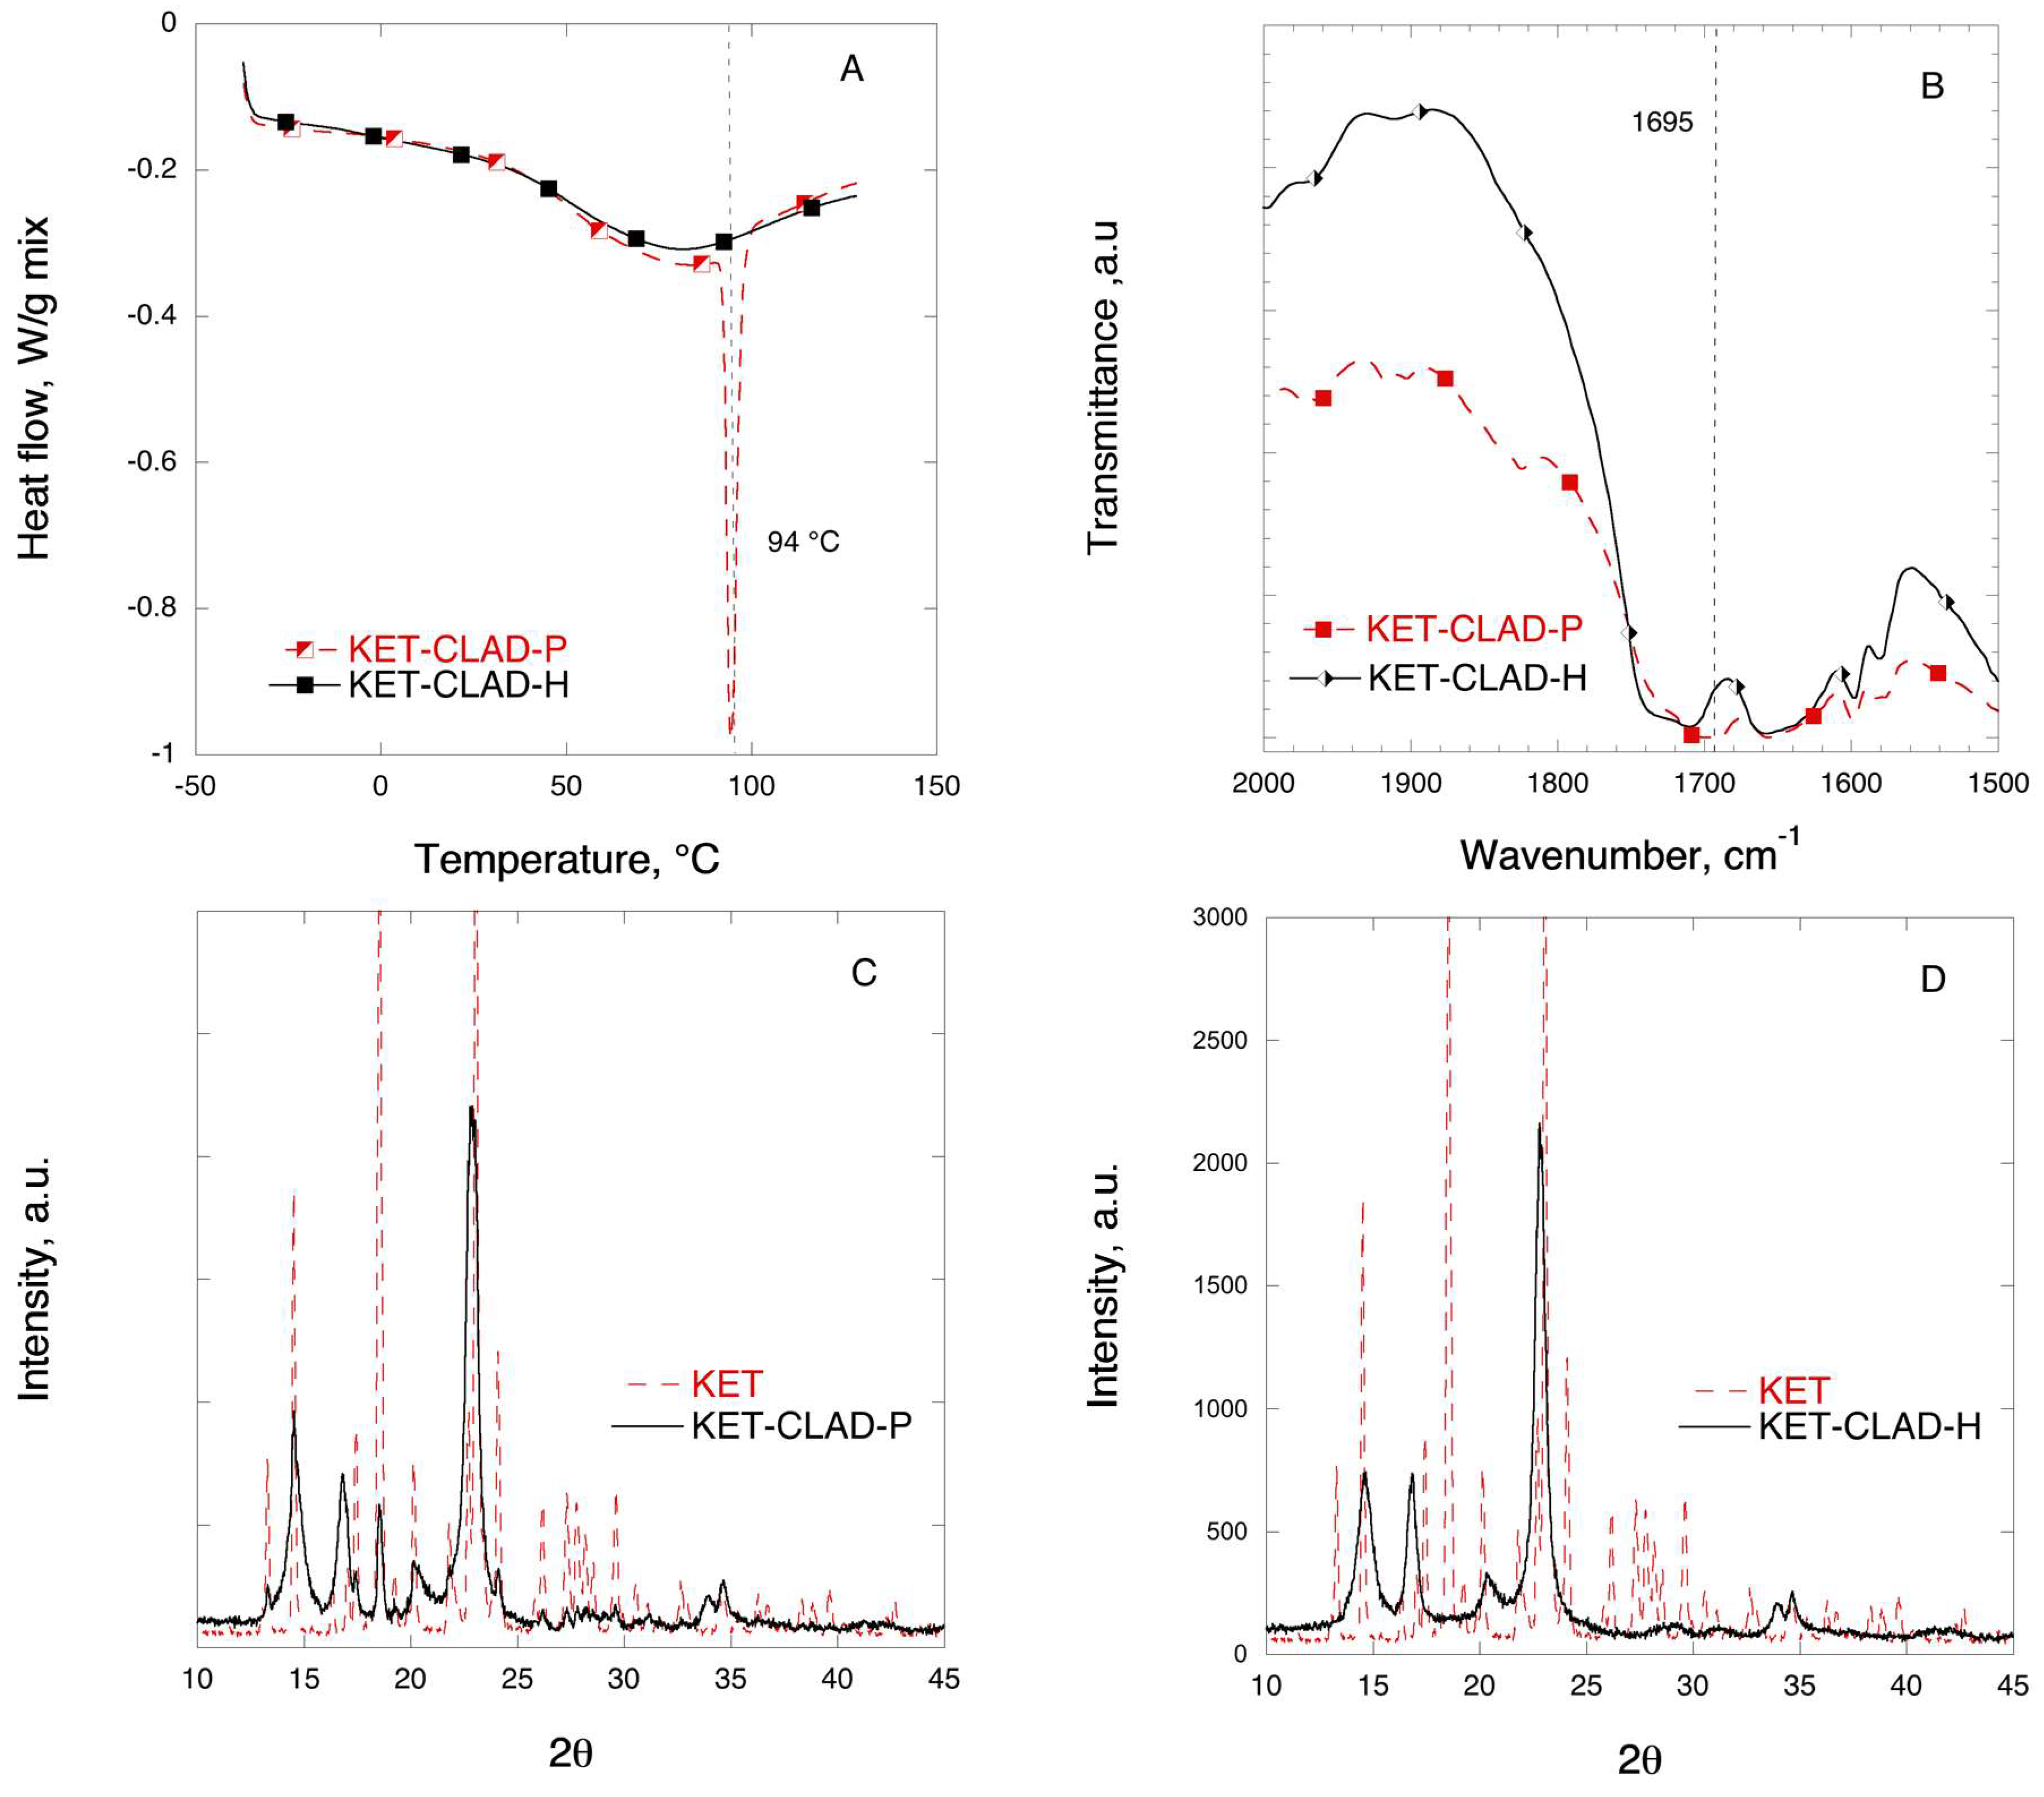
3.2. Ketoprofen Mixtures
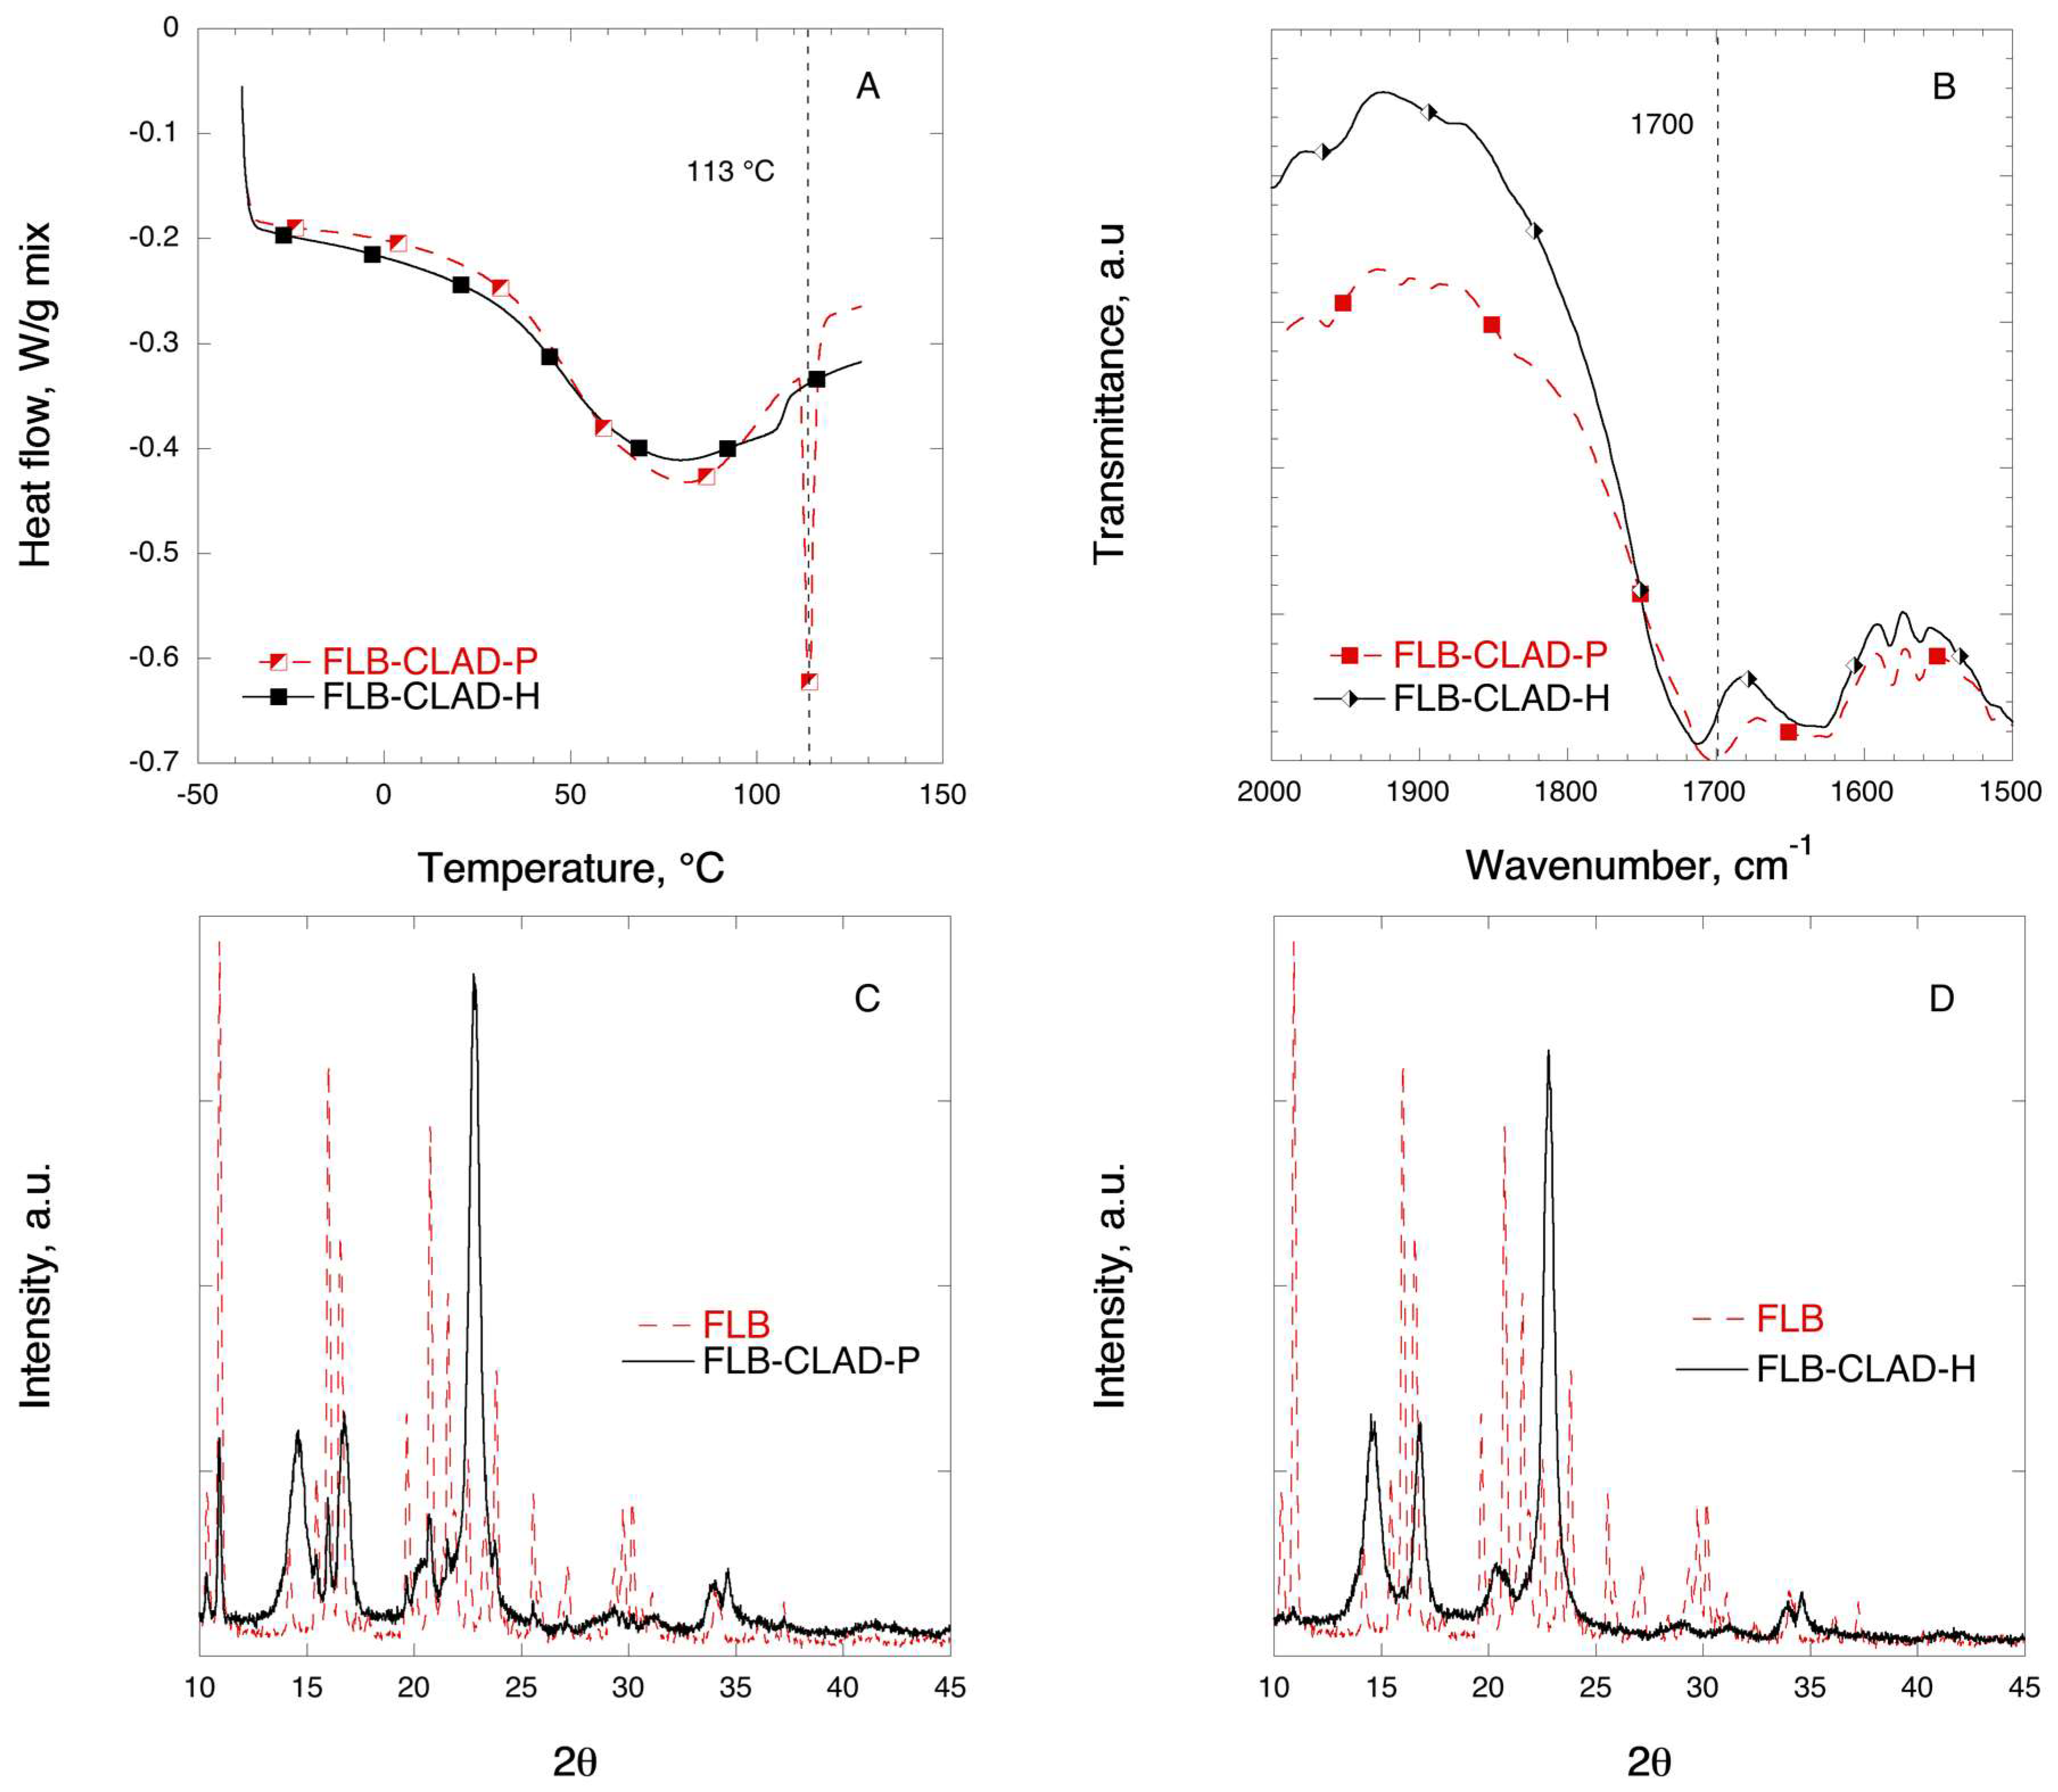
3.3. Flurbiprofen Mixtures
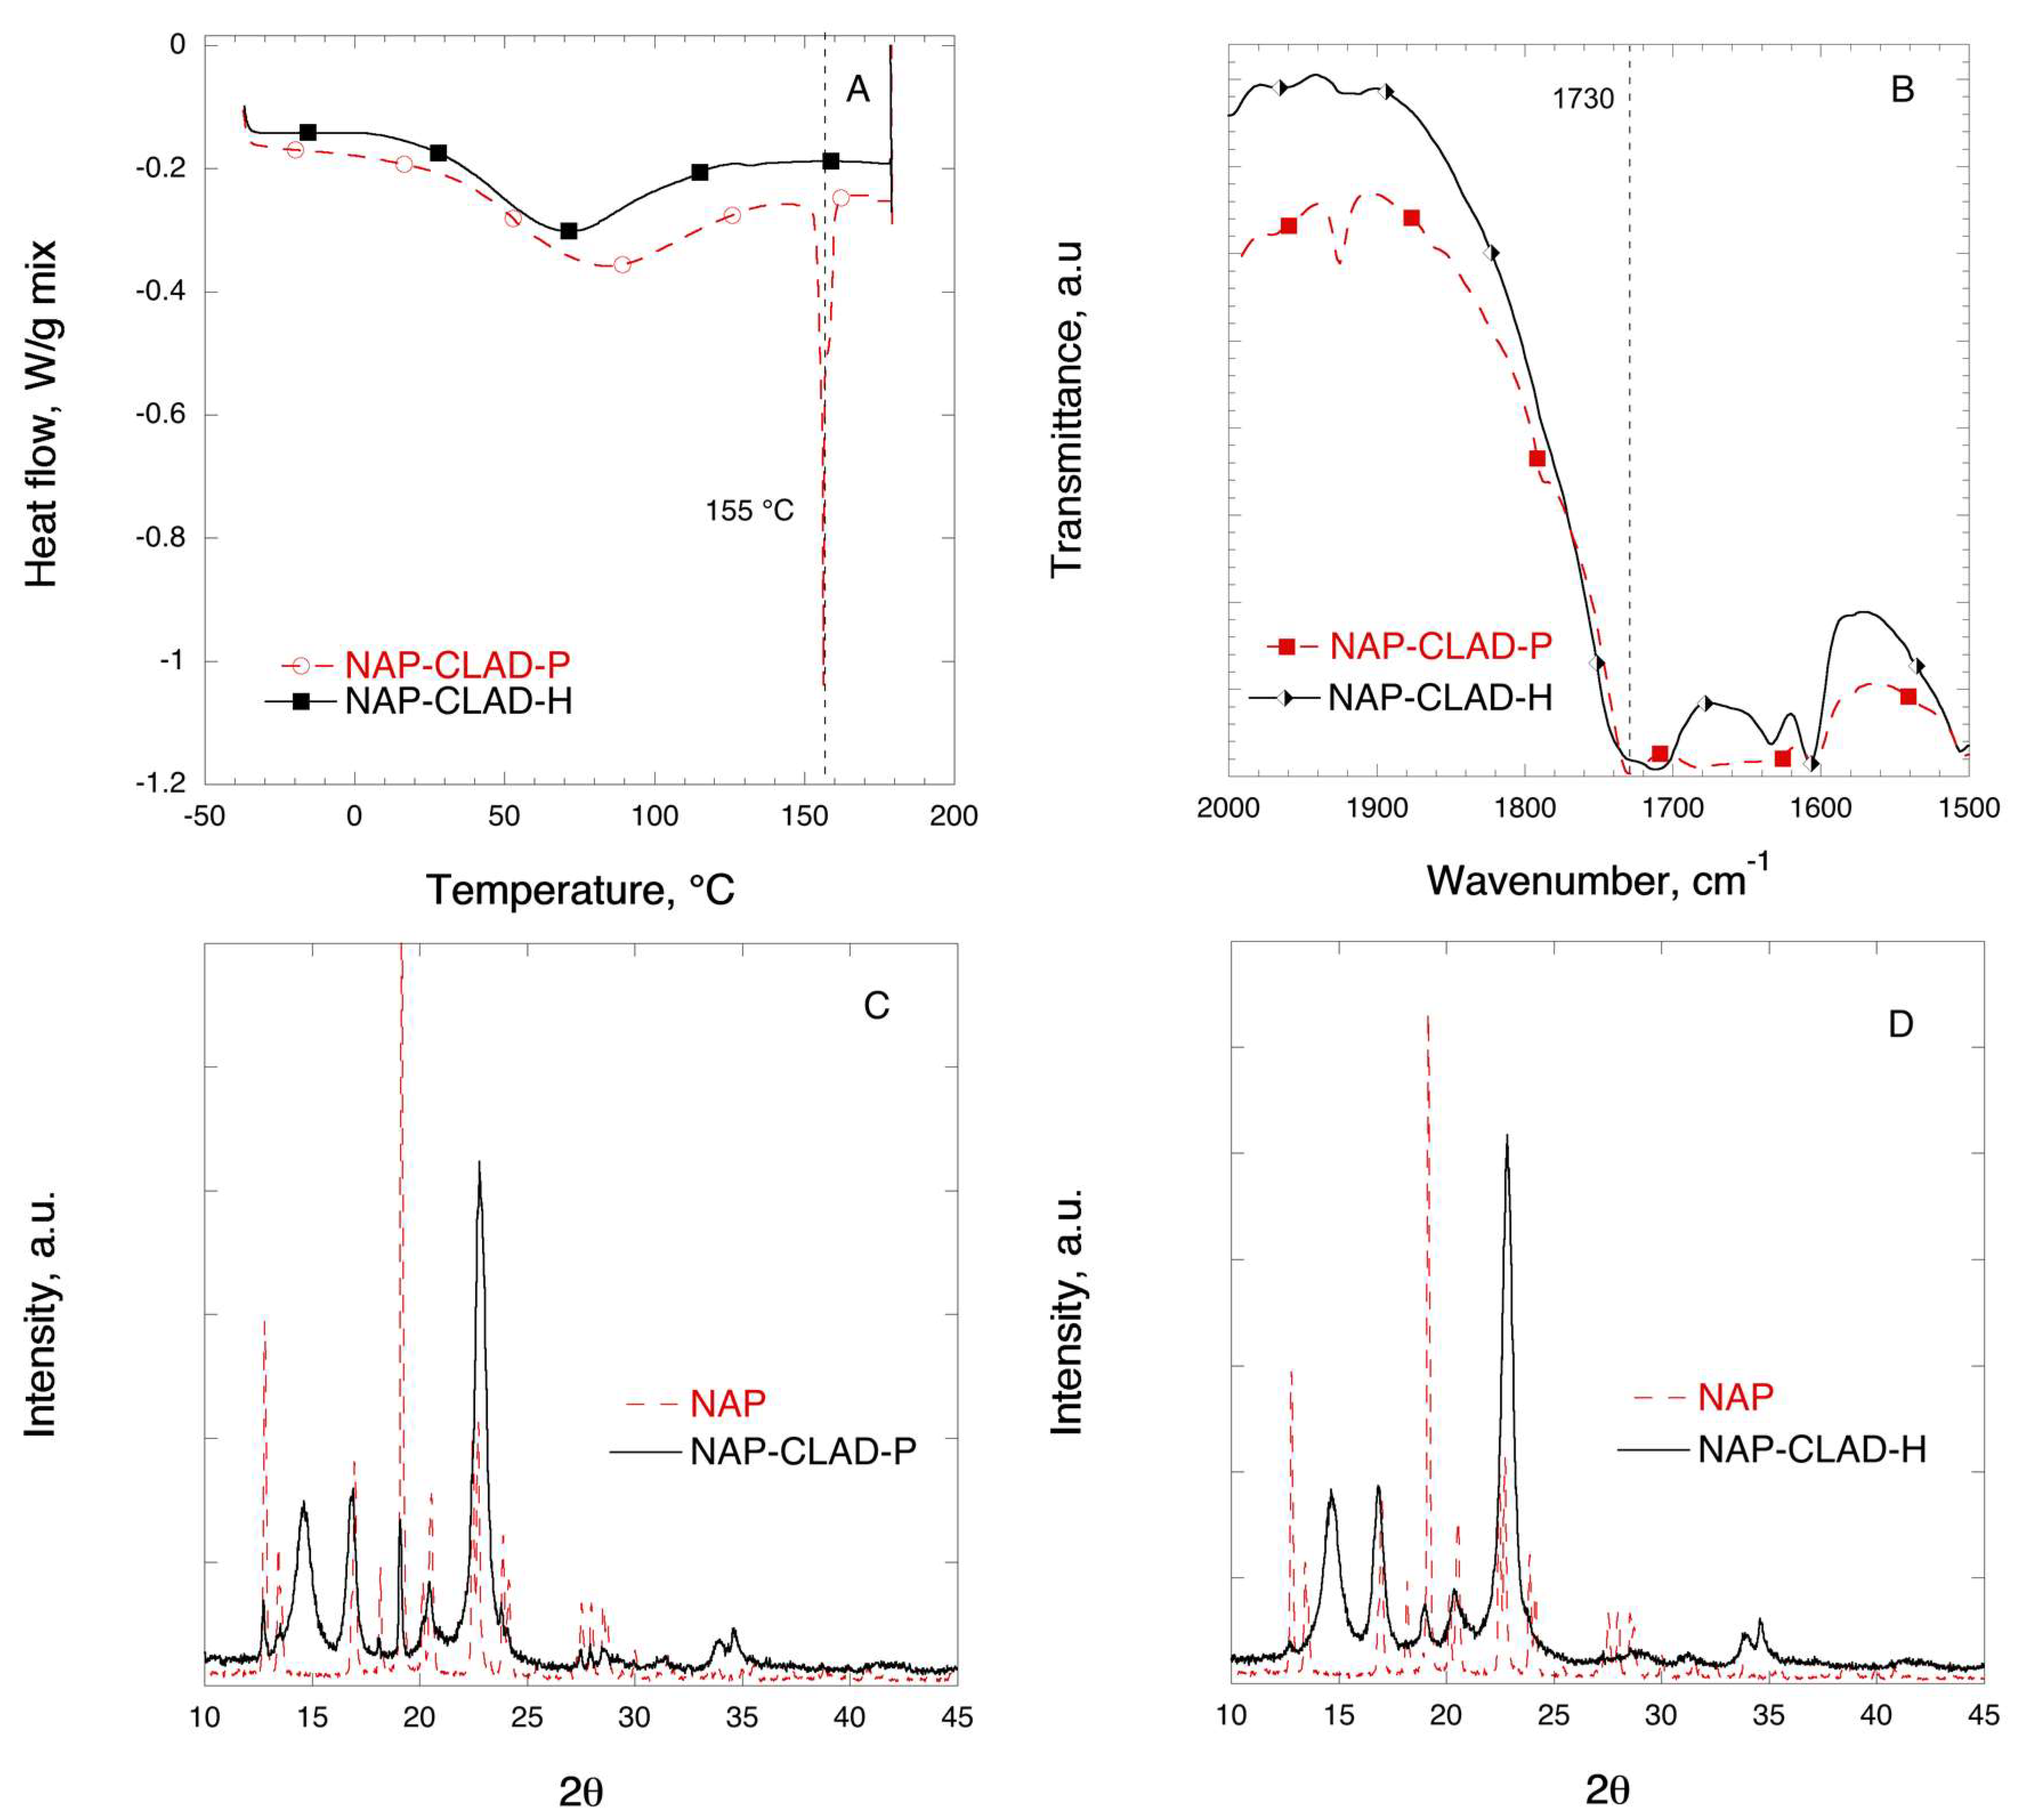
3.4. Naproxen Mixtures
- -
- It involves a minimal number of processing steps;
- -
- Profens are used in their free acidic form;
- -
- There is no need for organic solvents for drug loading;
- -
- There is no need for salt conjugates or soft gel liquid capsules.
4. Conclusions
Author Contributions
Funding
Acknowledgments
Conflicts of Interest
Abbreviations
| IBU | ibuprofen |
| MCC | microcrystalline cellulose |
| CLAD | Cladophora cellulose |
| DSC | differential scanning calorimetry |
| SGF | simulated gastric fluid |
| FaSIF | fasted simulated intestinal fluid |
| FeSIF | fed simulated intestinal fluid |
| KET | ketoprofen |
| XRD | X-ray diffraction |
| FTIR | Fourier-transform infrared spectroscopy |
| FLB | flurbiprofen |
| NAP | naproxen |
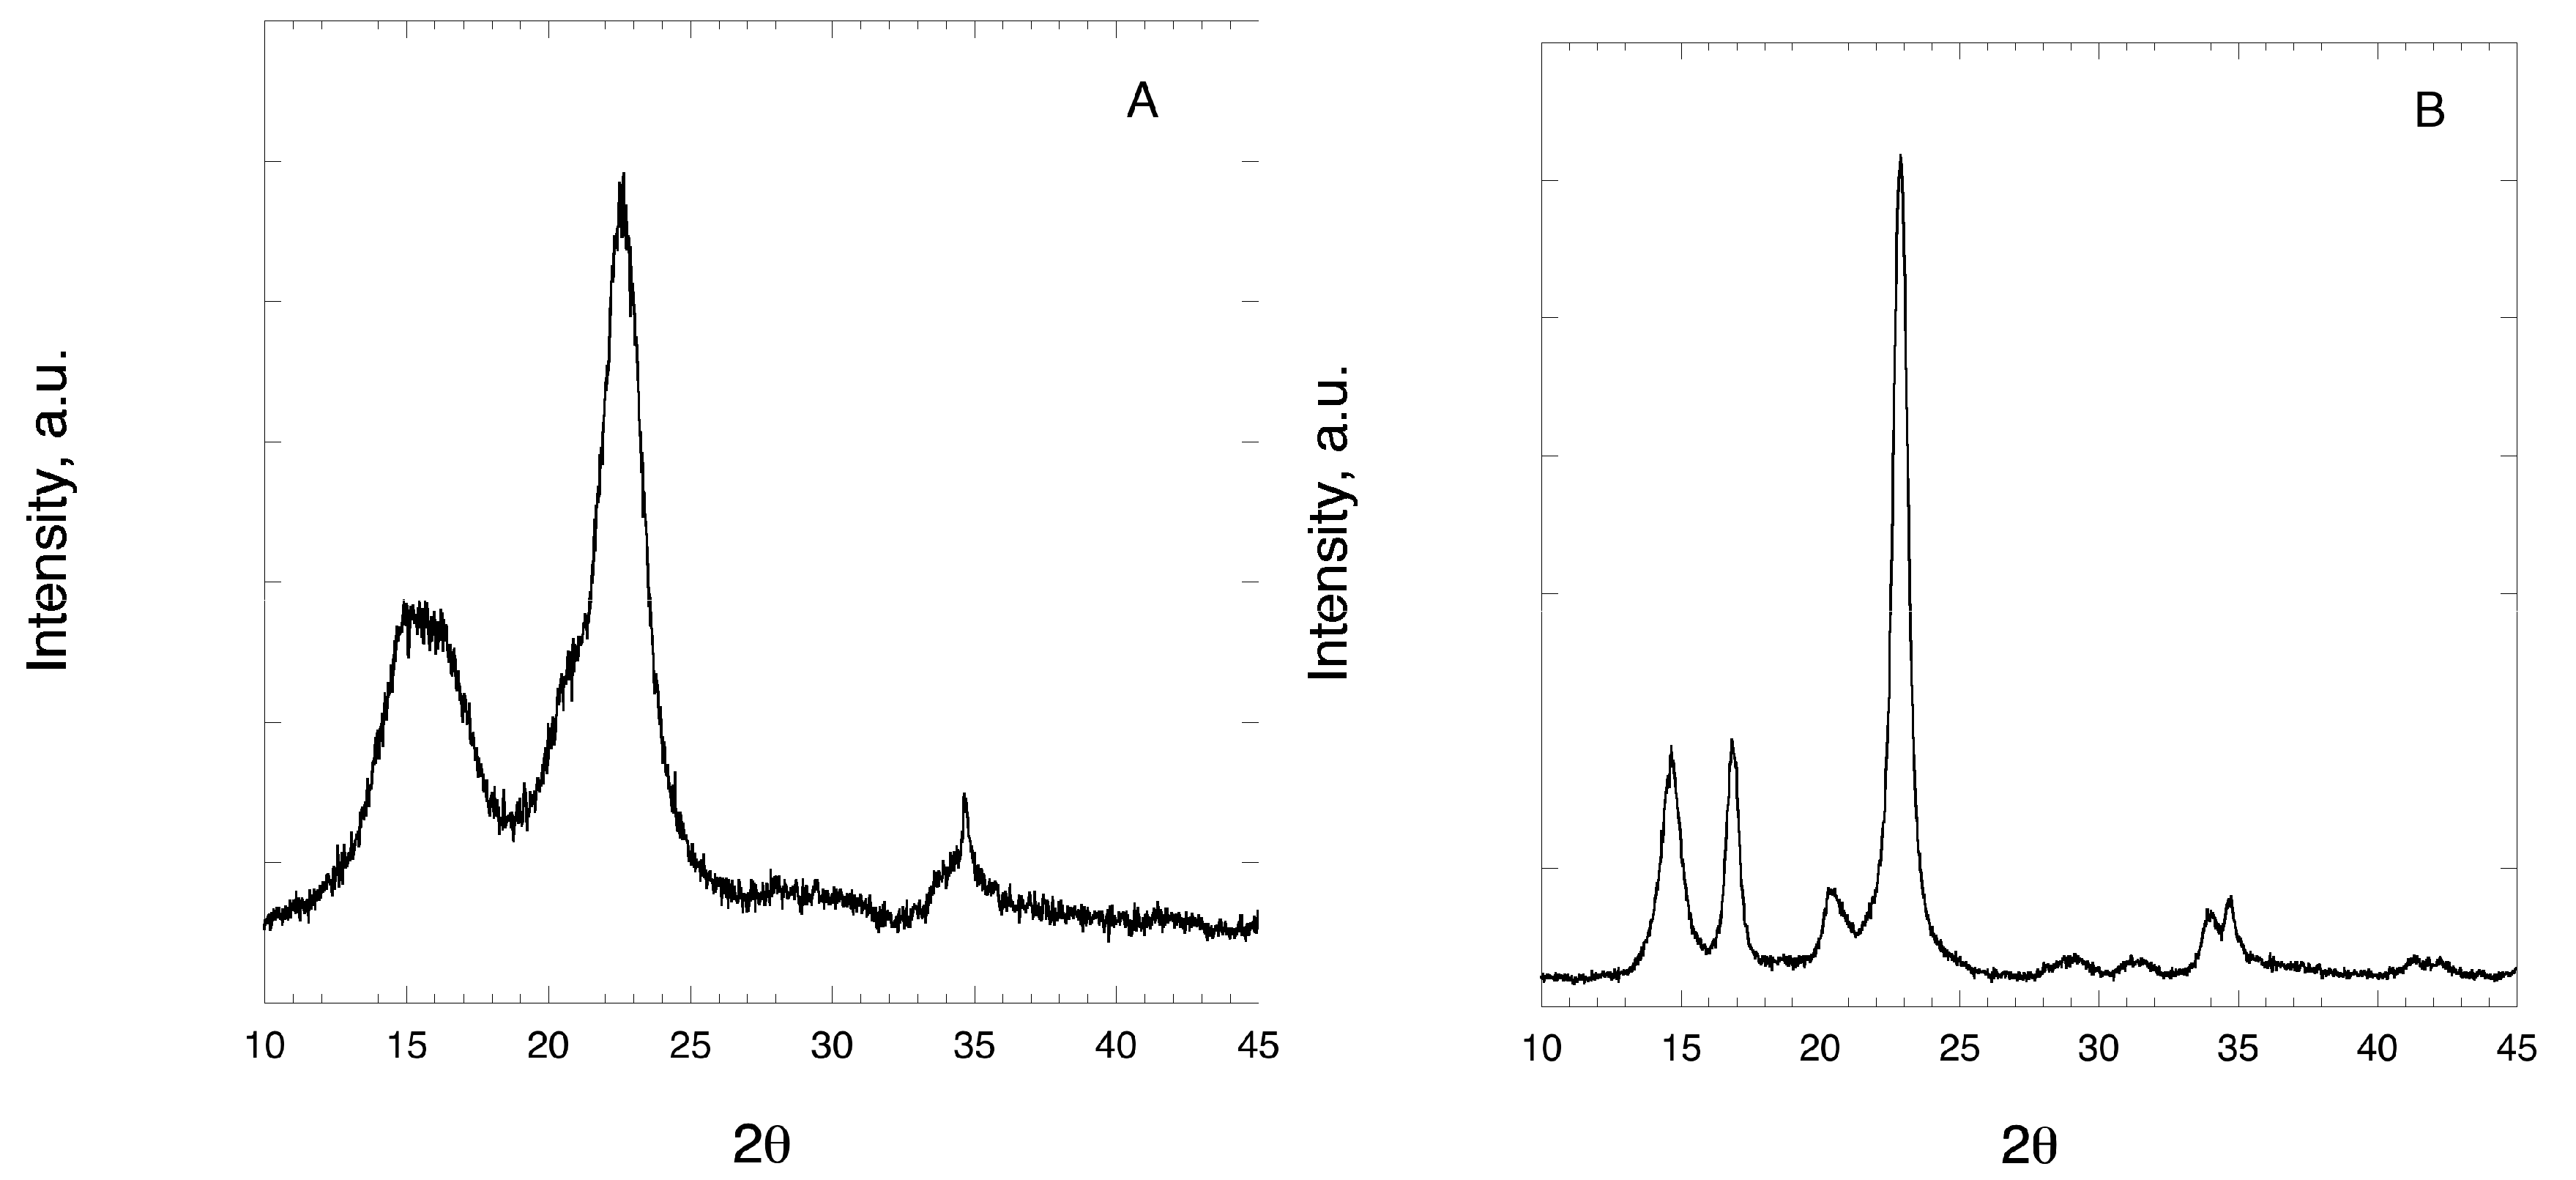
Appendix A


| Component | Concentration mM | ||
|---|---|---|---|
| SGF | FaSIF | FeSIF | |
| Taurocholate | 0.08 | 3 | 15 |
| Phospholipids | 0.02 | 0.75 | 3.75 |
| Sodium | 34 | 148 | 319 |
| Chloride | 59 | 106 | 209 |
| Phosphate | - | 29 | - |
| Acetic acid | - | - | 144 |
References
- Kaufman, D.W.; Kelly, J.P.; Rosenberg, L.; Anderson, T.E.; Mitchell, A.A. Recent patterns of medication use in the ambulatory adult population of the United States—The Slone survey. JAMA J. Am. Med. Assoc. 2002, 287, 337–344. [Google Scholar] [CrossRef]
- Weiss, S. Compliance packaging for over-the-counter drug products. J. Public Health 2009, 17, 155. [Google Scholar] [CrossRef]
- Young, D. FDA labors over NSAID decisions: Panel suggests COX-2 inhibitors stay available. Am. J. health-Syst. Pharm. AJHP 2005, 62, 668–672. [Google Scholar] [CrossRef] [PubMed]
- Ong, C.K.; Lirk, P.; Tan, C.H.; Seymour, R.A. An evidence-based update on nonsteroidal anti-inflammatory drugs. Clin. Med. Res. 2007, 5, 19–34. [Google Scholar] [CrossRef] [PubMed]
- Davies, N.M. Clinical pharmacokinetics of ibuprofen. The first 30 years. Clin. Pharmacokinet. 1998, 34, 101–154. [Google Scholar] [CrossRef] [PubMed]
- Gupta, A.; Zheng, L.; Ramanujam, V.; Gallagher, J. Novel Use of Pharmacogenetic Testing in the Identification of CYP2C9 Polymorphisms Related to NSAID-Induced Gastropathy. Pain Med. 2015, 16, 866–869. [Google Scholar] [CrossRef] [PubMed]
- Svetlik, S.; Hronova, K.; Bakhouche, H.; Matouskova, O.; Slanar, O. Pharmacogenetics of Chronic Pain and Its Treatment. Mediat. Inflamm. 2013, 2013, 864139. [Google Scholar] [CrossRef] [PubMed]
- Potthast, H.; Dressman, J.B.; Junginger, H.E.; Midha, K.K.; Oeser, H.; Shah, V.P.; Vogelpoel, H.; Barends, D.M. Biowaiver monographs for immediate release solid oral dosage forms: Ibuprofen. J. Pharm. Sci. 2005, 94, 2121–2131. [Google Scholar] [CrossRef]
- Shohin, I.E.; Kulinich, J.I.; Ramenskaya, G.V.; Abrahamsson, B.; Kopp, S.; Langguth, P.; Polli, J.E.; Shah, V.P.; Groot, D.W.; Barends, D.M.; et al. Biowaiver monographs for immediate-release solid oral dosage forms: Ketoprofen. J. Pharm. Sci. 2012, 101, 3593–3603. [Google Scholar] [CrossRef]
- Irvine, J.; Afrose, A.; Islam, N. Formulation and delivery strategies of ibuprofen: Challenges and opportunities. Drug Dev. Ind. Pharm. 2018, 44, 173–183. [Google Scholar] [CrossRef]
- Levis, K.A.; Lane, M.E.; Corrigan, O.I. Effect of buffer media composition on the solubility and effective permeability coefficient of ibuprofen. Int. J. Pharm. 2003, 253, 49–59. [Google Scholar] [CrossRef]
- Klueglich, M.; Ring, A.; Scheuerer, S.; Trommeshauser, D.; Schuijt, C.; Liepold, B.; Berndl, G. Ibuprofen extrudate, a novel, rapidly dissolving ibuprofen formulation: Relative bioavailability compared to ibuprofen lysinate and regular ibuprofen, and food effect on all formulations. J. Clin. Pharm. 2005, 45, 1055–1061. [Google Scholar] [CrossRef] [PubMed]
- Cattaneo, D.; Clementi, E. Clinical pharmacokinetics of ibuprofen arginine. Curr. Clin. Pharmacol. 2010, 5, 239–245. [Google Scholar] [CrossRef] [PubMed]
- Saano, V.; Paronen, P.; Peura, P.; Vidgren, M. Relative pharmacokinetics of three oral 400 mg ibuprofen dosage forms in healthy volunteers. Int. J. Clin. Pharmacol. Ther. Toxicol. 1991, 29, 381–385. [Google Scholar] [PubMed]
- Moote, C.A. Ibuprofen arginine in the management of pain. A review. Clin. Drug Investig. 1996, 11, 1–7. [Google Scholar] [CrossRef]
- Desjardins, P.; Black, P.; Papageorge, M.; Norwood, T.; Shen, D.D.; Norris, L.; Ardia, A. Ibuprofen arginate provides effective relief from postoperative dental pain with a more rapid onset of action than ibuprofen. Eur. J. Clin. Pharm. 2002, 58, 387–394. [Google Scholar] [CrossRef] [PubMed]
- Ferrero-Cafiero, J.M.; Gich, I.; Puntes, M.; Martinez, J.; Ballester, M.R.; Coimbra, J.; Mathison, Y.; Tarre, M.; Font, X.; Antonijoan, R.M. Ibuprofen lysinate, quicker and less variable: Relative bioavailability compared to ibuprofen base in a pediatric suspension dosage form. Int. J. Clin. Pharm. Ther. 2015, 53, 972–979. [Google Scholar] [CrossRef] [PubMed]
- Yonemochi, E.; Yamamoto, K. Porous glass. In Encyclopedia of Surface and Colloid Science; Somasundaran, P., Ed.; Taylor & Francis: Boca Raton, FL, USA, 2006; Volume 6, pp. 5068–5077. [Google Scholar]
- Vasconcelos, T.; Sarmento, B.; Costa, P. Solid dispersions as strategy to improve oral bioavailability of poor water soluble drugs. Drug Discov. Today 2007, 12, 1068–1075. [Google Scholar] [CrossRef] [PubMed]
- Edueng, K.; Mahlin, D.; Bergstrom, C.A.S. The Need for Restructuring the Disordered Science of Amorphous Drug Formulations. Pharm. Res.-Dordr. 2017, 34, 1754–1772. [Google Scholar] [CrossRef] [PubMed]
- Shah, S.; Maddineni, S.; Lu, J.; Repka, M.A. Melt extrusion with poorly soluble drugs. Int. J. Pharm. 2013, 453, 233–252. [Google Scholar] [CrossRef] [PubMed]
- Forsgren, J.; Andersson, M.; Nilsson, P.; Mihranyan, A. Mesoporous Calcium Carbonate as a Phase Stabilizer of Amorphous Celecoxib—An Approach to Increase the Bioavailability of Poorly Soluble Pharmaceutical Substances. Adv. Healthc. Mater. 2013, 2, 1469–1476. [Google Scholar] [CrossRef] [PubMed]
- Chiarappa, G.; Piccolo, A.; Colombo, I.; Hasa, D.; Voinovich, D.; Moneghini, M.; Grassi, G.; Farra, R.; Abrami, M.; Posocco, P.; et al. Exploring the Shape Influence on Melting Temperature, Enthalpy, and Solubility of Organic Drug Nanocrystals by a Thermodynamic Model. Cryst. Growth Des. 2017, 17, 4072–4083. [Google Scholar] [CrossRef]
- 8.0, P.E. Microcrystalline Cellulose; European Pharmacopoeia: Strasbourg, France, 2014; pp. 1824–1828.
- Thoorens, G.; Krier, F.; Leclercq, B.; Carlin, B.; Evrard, B. Microcrystalline cellulose, a direct compression binder in a quality by design environment—A review. Int. J. Pharm. 2014, 473, 64–72. [Google Scholar] [CrossRef] [PubMed]
- Mihranyan, A. Cellulose from Cladophorales Green Algae: From Environmental Problem to High-Tech Composite Materials. J. Appl. Polym. Sci. 2011, 119, 2449–2460. [Google Scholar] [CrossRef]
- Gustafsson, C.; Lennholm, H.; Iversen, T.; Nystrom, C. Evaluation of surface and bulk characteristics of cellulose I powders in relation to compaction behavior and tablet properties. Drug Dev. Ind. Pharm. 2003, 29, 1095–1107. [Google Scholar] [CrossRef] [PubMed]
- Stromme, M.; Mihranyan, A.; Ek, R. What to do with all these algae? Mater. Lett. 2002, 57, 569–572. [Google Scholar] [CrossRef]
- Mihranyan, A.; Andersson, S.B.; Ek, R. Sorption of nicotine to cellulose powders. Eur. J. Pharm. Sci. 2004, 22, 279–286. [Google Scholar] [CrossRef] [PubMed]
- Heidarian, M.; Mihranyan, A.; Stromme, M.; Ek, R. Influence of water-cellulose binding energy on stability of acetylsalicylic acid. Int. J. Pharm. 2006, 323, 139–145. [Google Scholar] [CrossRef] [PubMed]
- Carlsson, D.O.; Hua, K.; Forsgren, J.; Mihranyan, A. Aspirin degradation in surface-charged TEMPO-oxidized mesoporous crystalline nanocellulose. Int. J. Pharm. 2014, 461, 74–81. [Google Scholar] [CrossRef]
- Mihranyan, A.; Stromme, M.; Ek, R. Influence of cellulose powder structure on moisture-induced degradation of acetylsalicylic acid. Eur. J. Pharm. Sci. 2006, 27, 220–225. [Google Scholar] [CrossRef]
- Löbmann, K.; Svagan, A.J. Cellulose nanofibers as excipient for the delivery of poorly soluble drugs. Int. J. Pharm. 2017, 533, 285–297. [Google Scholar] [CrossRef] [PubMed]
- Svagan, A.J.; Müllertz, A.; Löbmann, K. Floating solid cellulose nanofibre nanofoams for sustained release of the poorly soluble model drug furosemide. J. Pharm. Pharmacol. 2017, 69, 1477–1484. [Google Scholar] [CrossRef] [PubMed]
- Kolakovic, R.; Peltonen, L.; Laukkanen, A.; Hellman, M.; Laaksonen, P.; Linder, M.B.; Hirvonen, J.; Laaksonen, T. Evaluation of drug interactions with nanofibrillar cellulose. Eur. J. Pharm. Biopharm. 2013, 85, 1238–1244. [Google Scholar] [CrossRef]
- Kolakovic, R.; Laaksonen, T.; Peltonen, L.; Laukkanen, A.; Hirvonen, J. Spray-dried nanofibrillar cellulose microparticles for sustained drug release. Int. J. Pharm. 2012, 430, 47–55. [Google Scholar] [CrossRef]
- Gao, J.; Li, Q.; Chen, W.; Liu, Y.; Yu, H. Self-assembly of nanocellulose and indomethacin into hierarchically ordered structures with high encapsulation efficiency for sustained release applications. ChemPlusChem 2014, 79, 725–731. [Google Scholar] [CrossRef]
- Bannow, J.; Benjamins, J.W.; Wohlert, J.; Löbmann, K.; Svagan, A.J. Solid nanofoams based on cellulose nanofibers and indomethacin—The effect of processing parameters and drug content on material structure. Int. J. Pharm. 2017, 526, 291–299. [Google Scholar] [CrossRef] [PubMed]
- Löbmann, K.; Wohlert, J.; Müllertz, A.; Wågberg, L.; Svagan, A.J. Cellulose Nanopaper and Nanofoam for Patient-Tailored Drug Delivery. Adv. Mater. Interfaces 2017, 4. [Google Scholar] [CrossRef]
- Arca, H.C.; Mosquera-Giraldo, L.I.; Bi, V.; Xu, D.; Taylor, L.S.; Edgar, K.J. Pharmaceutical Applications of Cellulose Ethers and Cellulose Ether Esters. Biomacromolecules 2018, 19, 2351–2376. [Google Scholar] [CrossRef]
- Gilley, A.D.; Arca, H.C.; Nichols, B.L.B.; Mosquera-Giraldo, L.I.; Taylor, L.S.; Edgar, K.J.; Neilson, A.P. Novel cellulose-based amorphous solid dispersions enhance quercetin solution concentrations in vitro. Carbohydr. Polym. 2017, 157, 86–93. [Google Scholar] [CrossRef] [PubMed]
- Winslow, C.J.; Nichols, B.L.B.; Novo, D.C.; Mosquera-Giraldo, L.I.; Taylor, L.S.; Edgar, K.J.; Neilson, A.P. Cellulose-based amorphous solid dispersions enhance rifapentine delivery characteristics in vitro. Carbohydr. Polym. 2018, 182, 149–158. [Google Scholar] [CrossRef]
- Amin, M.; Abbas, N.S.; Hussain, M.A.; Sher, M.; Edgar, K.J. Design of cellulose ether-based macromolecular prodrugs of ciprofloxacin for extended release and enhanced bioavailability. Int. J. Biol. Macromol. 2018, 113, 719–728. [Google Scholar] [CrossRef] [PubMed]
- Arca, H.C.; Mosquera-Giraldo, L.I.; Dahal, D.; Taylor, L.S.; Edgar, K.J. Multidrug, Anti-HIV Amorphous Solid Dispersions: Nature and Mechanisms of Impacts of Drugs on Each Other’s Solution Concentrations. Mol. Pharm. 2017, 14, 3617–3627. [Google Scholar] [CrossRef] [PubMed]
- Albarahmieh, E.A. An Investigation into the Relationship between Predicted Drug Miscibility and Product Stability for Hot Melt Extruded Systems: Ibuprofen Dispersions in Eudragit RS PO. MOJ Bioequiv. Bioavailab. 2015, 1. [Google Scholar] [CrossRef]
- Mihranyan, A.; Llagostera, A.P.; Karmhag, R.; Stromme, M.; Ek, R. Moisture sorption by cellulose powders of varying crystallinity. Int. J. Pharm. 2004, 269, 433–442. [Google Scholar] [CrossRef] [PubMed]
- Sun, D.D.; Lee, P.I. Evolution of Supersaturation of Amorphous Pharmaceuticals: The Effect of Rate of Supersaturation Generation. Mol. Pharm. 2013, 10, 4330–4346. [Google Scholar] [CrossRef]
- Taylor, L.S.; Zografi, G. Spectroscopic characterization of interactions between PVP and indomethacin in amorphous molecular dispersions. Pharm. Res.-Dordr. 1997, 14, 1691–1698. [Google Scholar] [CrossRef]
- Tozuka, Y.; Tashiro, E.; Yonemochi, E.; Oguchi, T.; Yamamoto, K. Solid-state fluorescence study of naphthalene adsorption on porous material. J. Colloid Interface Sci. 2002, 248, 239–243. [Google Scholar] [CrossRef]
- Tozuka, Y.; Yonemochi, E.; Oguchi, T.; Yamamoto, K. Fluorometric studies of pyrene adsorption on porous crystalline cellulose. J. Colloid Interface Sci. 1998, 205, 510–515. [Google Scholar] [CrossRef]
- Tozuka, Y.; Yonemochi, E.; Oguchi, T.; Yamamoto, K. Molecular states of 2-naphthoic acid in solid dispersions with porous crystalline cellulose, as investigated by fluorescence spectroscopy. Bull. Chem. Soc. Jpn. 2000, 73, 1567–1572. [Google Scholar] [CrossRef]
- Lombardo, S.; Chen, P.; Larsson, P.A.; Thielemans, W.; Wohlert, J.; Svagan, A.J. Toward Improved Understanding of the Interactions between Poorly Soluble Drugs and Cellulose Nanofibers. Langmuir 2018, 34, 5464–5473. [Google Scholar] [CrossRef]


| Drug | Structure | IUPAC Name | Mol. Mass, g/mol | Tm, °C | pKa | logP |
|---|---|---|---|---|---|---|
| IBU |  | Iso-butylphenylpropionic acid | 206 | 78 | 4.9 | 4.0 |
| KET |  | 2-(3-benzoylphenyl)-propanoic acid | 254 | 94 | 3.9 | 3.1 |
| FLB |  | 2-(3-fluoro-4-phenylphenyl)-propanoic acid | 244 | 111 | 4.4 | 4.2 |
| NAP |  | (2S)-2-(6-methoxynaphthalen-2-yl)-propanoic acid | 230 | 155 | 4.2 | 3.3 |
| Cellulose | BET Surface Area, m²/g | Pore Volume, cm³/g | DFT Pore Mode, nm |
|---|---|---|---|
| MCC | 0.9 | 0.002 a | - |
| CLAD | 98.8 | 0.553 b | 37 |
| Drugs Samples | Ton, °C | Tm, °C | ΔH, J/g drug | CrI, % |
|---|---|---|---|---|
| IBU | 74.9 | 75.7 | 197.6 | 100 |
| IBU-MCC-P | 71.5 | 74.4 | 196.9 | 99.6 |
| IBU-MCC-H | 72.2 | 73.1 | 149.9 | 75.8 |
| IBU-CLAD-P | 71.5 | 73.1 | 154.7 | 78.3 |
| IBU-CLAD-H | 62.6 | 67.6 | 1.7 | 0.9 |
| KET | 92.4 | 94.4 | 149.3 | 100 |
| KET-CLAD-P | 92.4 | 94.4 | 137.8 | 92.3 |
| KET-CLAD-H | - | - | 0.3 | 0.2 |
| FLB | 112.0 | 114.2 | 131.8 | 100 |
| FLB-CLAD-P | 112.0 | 114.2 | 52.6 | 39.9 |
| FLB-CLAD-H | 103.0 | 105.5 | 3.2 | 2.4 |
| NAP | 153.0 | 155.1 | 174.4 | 100 |
| NAP-CLAD-P | 155.9 | 156.3 | 98.3 | 56.4 |
| NAP-CLAD-H | 128.1 | 132.2 | 1.0 | 0.6 |
| Samples | AUC0–t min (µg mL−1) | AUC0–∞ min (µg mL−1) | MRT, min | T1/2, min |
|---|---|---|---|---|
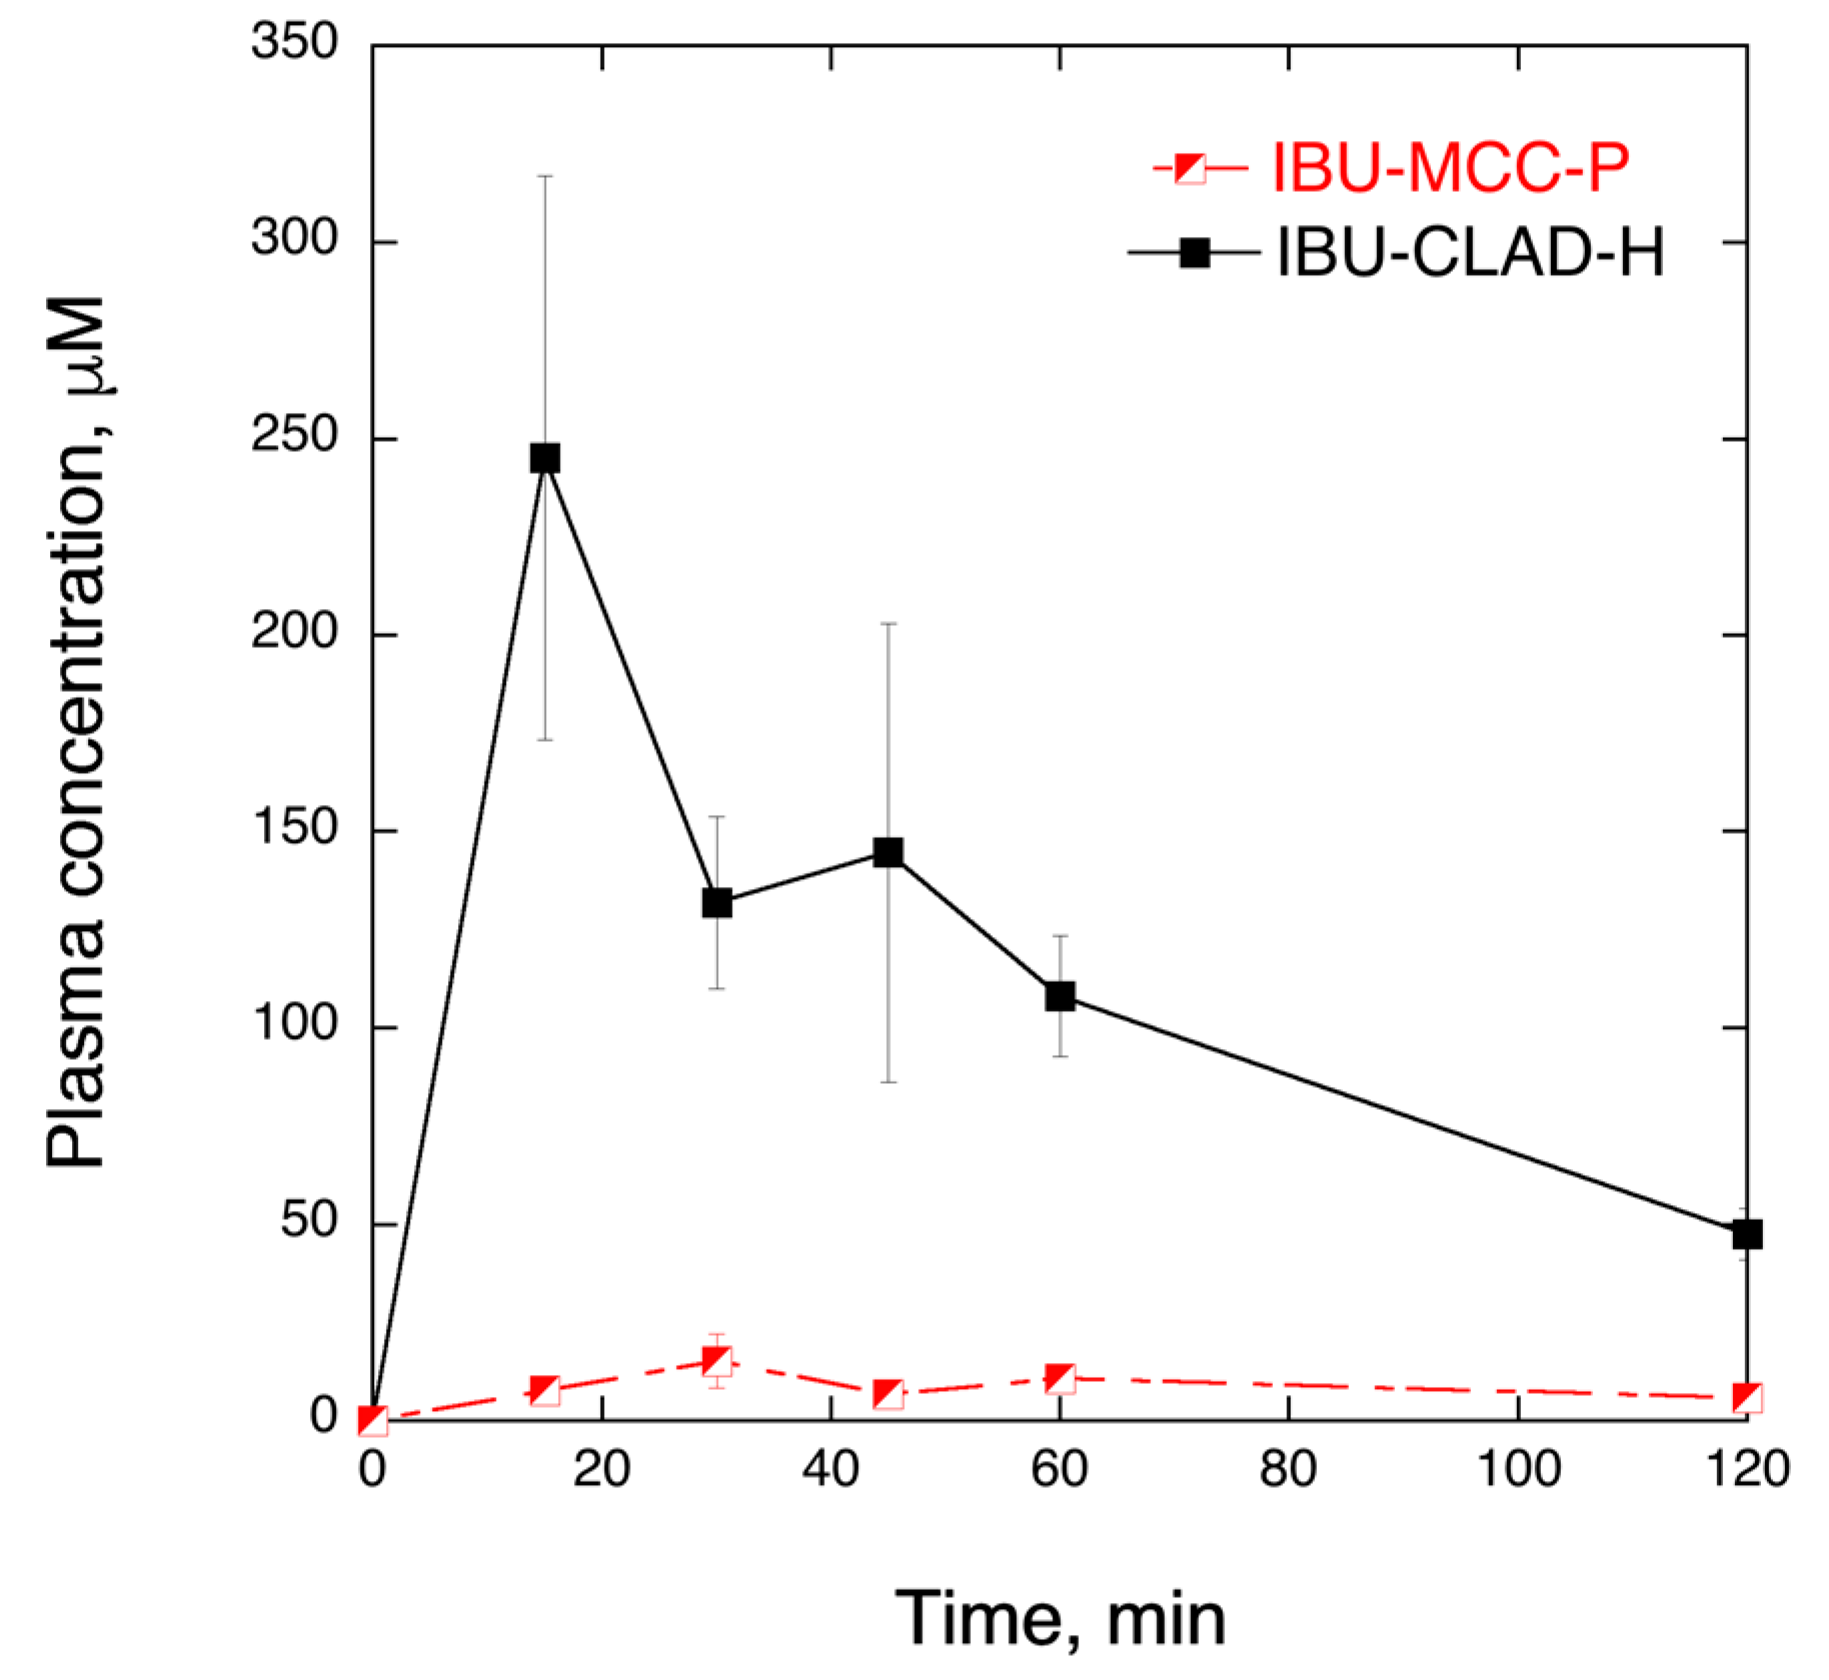
| IBU-MCC-P | 197.0 ± 20.8 | 419.9 ± 328.3 | 192 ± 202 | 133 ± 140 |
| IBU-CLAD-H | 2323.7 ± 170.1 | 3026.0 ± 186.4 | 85 ± 11 | 59 ± 8 |
© 2019 by the authors. Licensee MDPI, Basel, Switzerland. This article is an open access article distributed under the terms and conditions of the Creative Commons Attribution (CC BY) license (http://creativecommons.org/licenses/by/4.0/).
Share and Cite
Mantas, A.; Labbe, V.; Loryan, I.; Mihranyan, A. Amorphisation of Free Acid Ibuprofen and Other Profens in Mixtures with Nanocellulose: Dry Powder Formulation Strategy for Enhanced Solubility. Pharmaceutics 2019, 11, 68. https://doi.org/10.3390/pharmaceutics11020068
Mantas A, Labbe V, Loryan I, Mihranyan A. Amorphisation of Free Acid Ibuprofen and Other Profens in Mixtures with Nanocellulose: Dry Powder Formulation Strategy for Enhanced Solubility. Pharmaceutics. 2019; 11(2):68. https://doi.org/10.3390/pharmaceutics11020068
Chicago/Turabian StyleMantas, Athanasios, Valentine Labbe, Irena Loryan, and Albert Mihranyan. 2019. "Amorphisation of Free Acid Ibuprofen and Other Profens in Mixtures with Nanocellulose: Dry Powder Formulation Strategy for Enhanced Solubility" Pharmaceutics 11, no. 2: 68. https://doi.org/10.3390/pharmaceutics11020068