Development and Evaluation of Physiologically Based Pharmacokinetic Drug–Disease Models for Predicting Rifampicin Exposure in Tuberculosis and Cirrhosis Populations

 ,
,  , ,
, ,
Abstract
:
1. Introduction
2. Materials and Methods
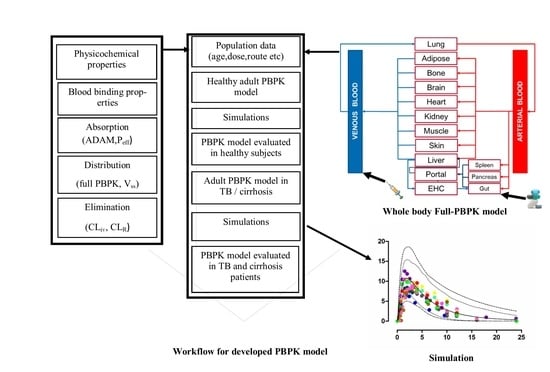
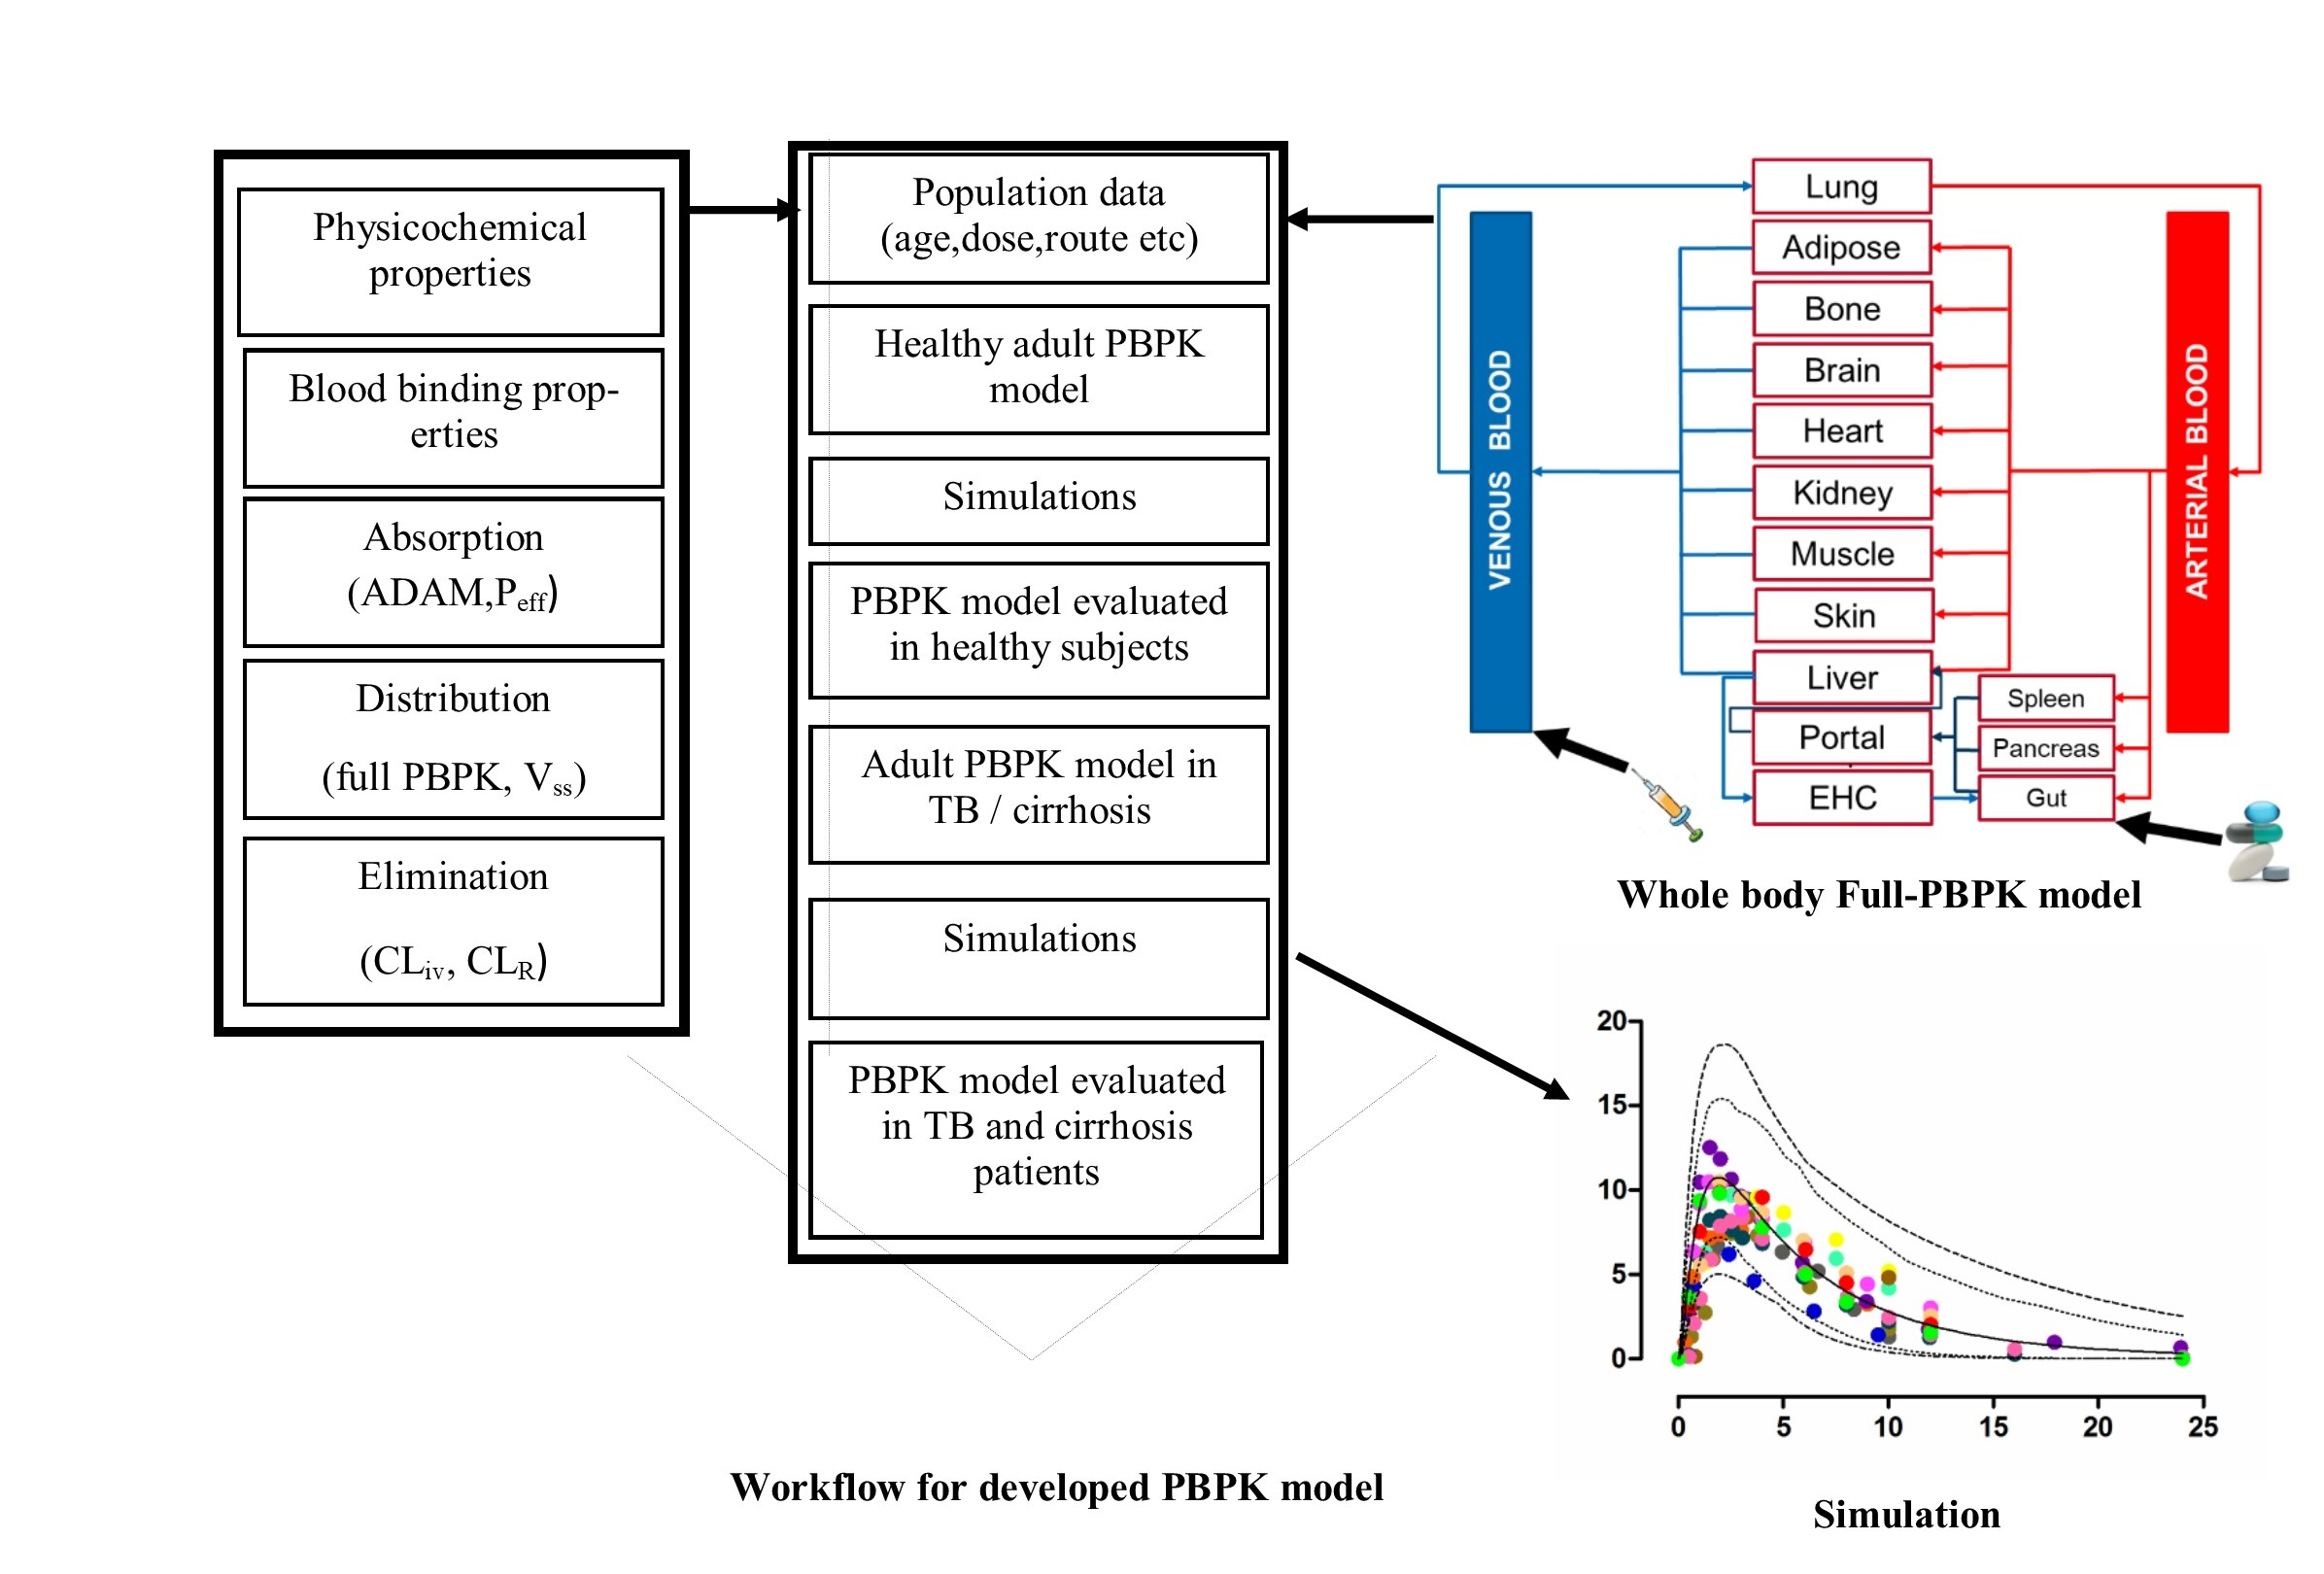
2.1. Modeling Software and Strategy
2.2. Model Structure
2.2.1. Physicochemical Properties
2.2.2. Absorption
2.2.3. Distribution
2.2.4. Elimination
2.3. Population Specific (System) Data
2.3.1. Disease-Specific Pathophysiological Changes
Tuberculosis
Liver Cirrhosis
2.4. Ethics
2.5. Pharmacokinetic Data
2.6. Model Evaluation
2.7. Simulations in Different Clinical Scenarios
3. Results
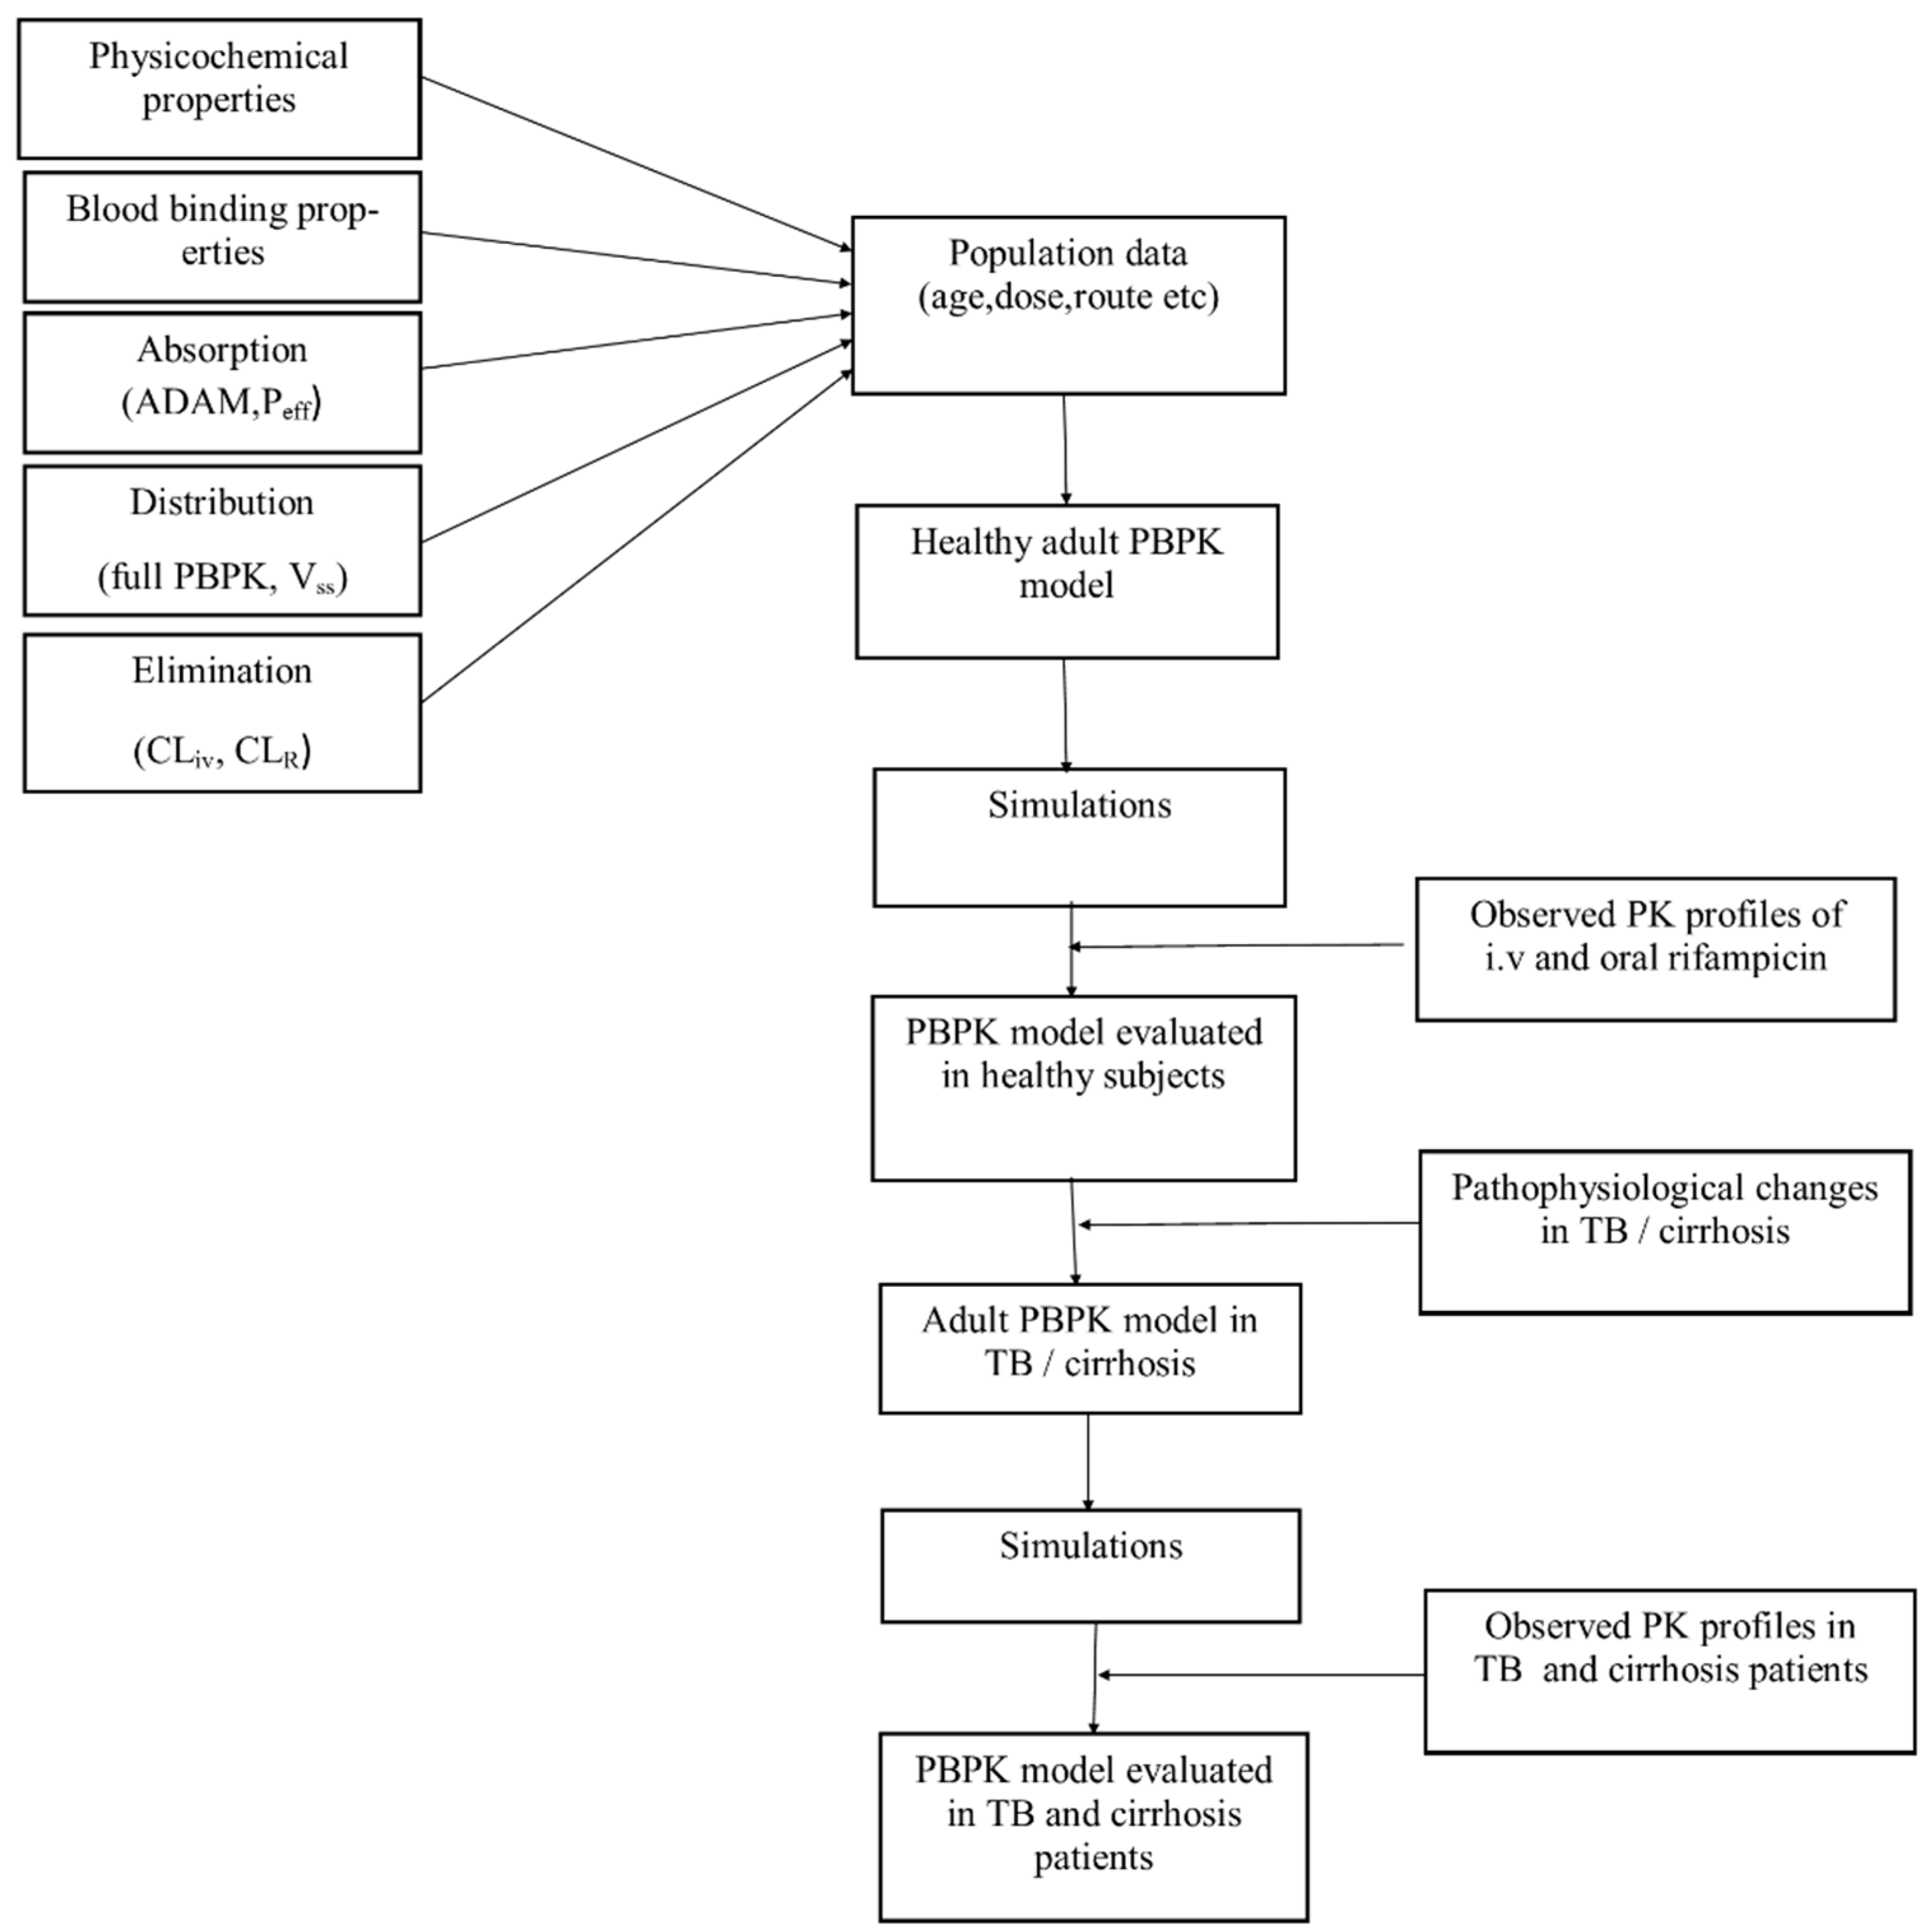
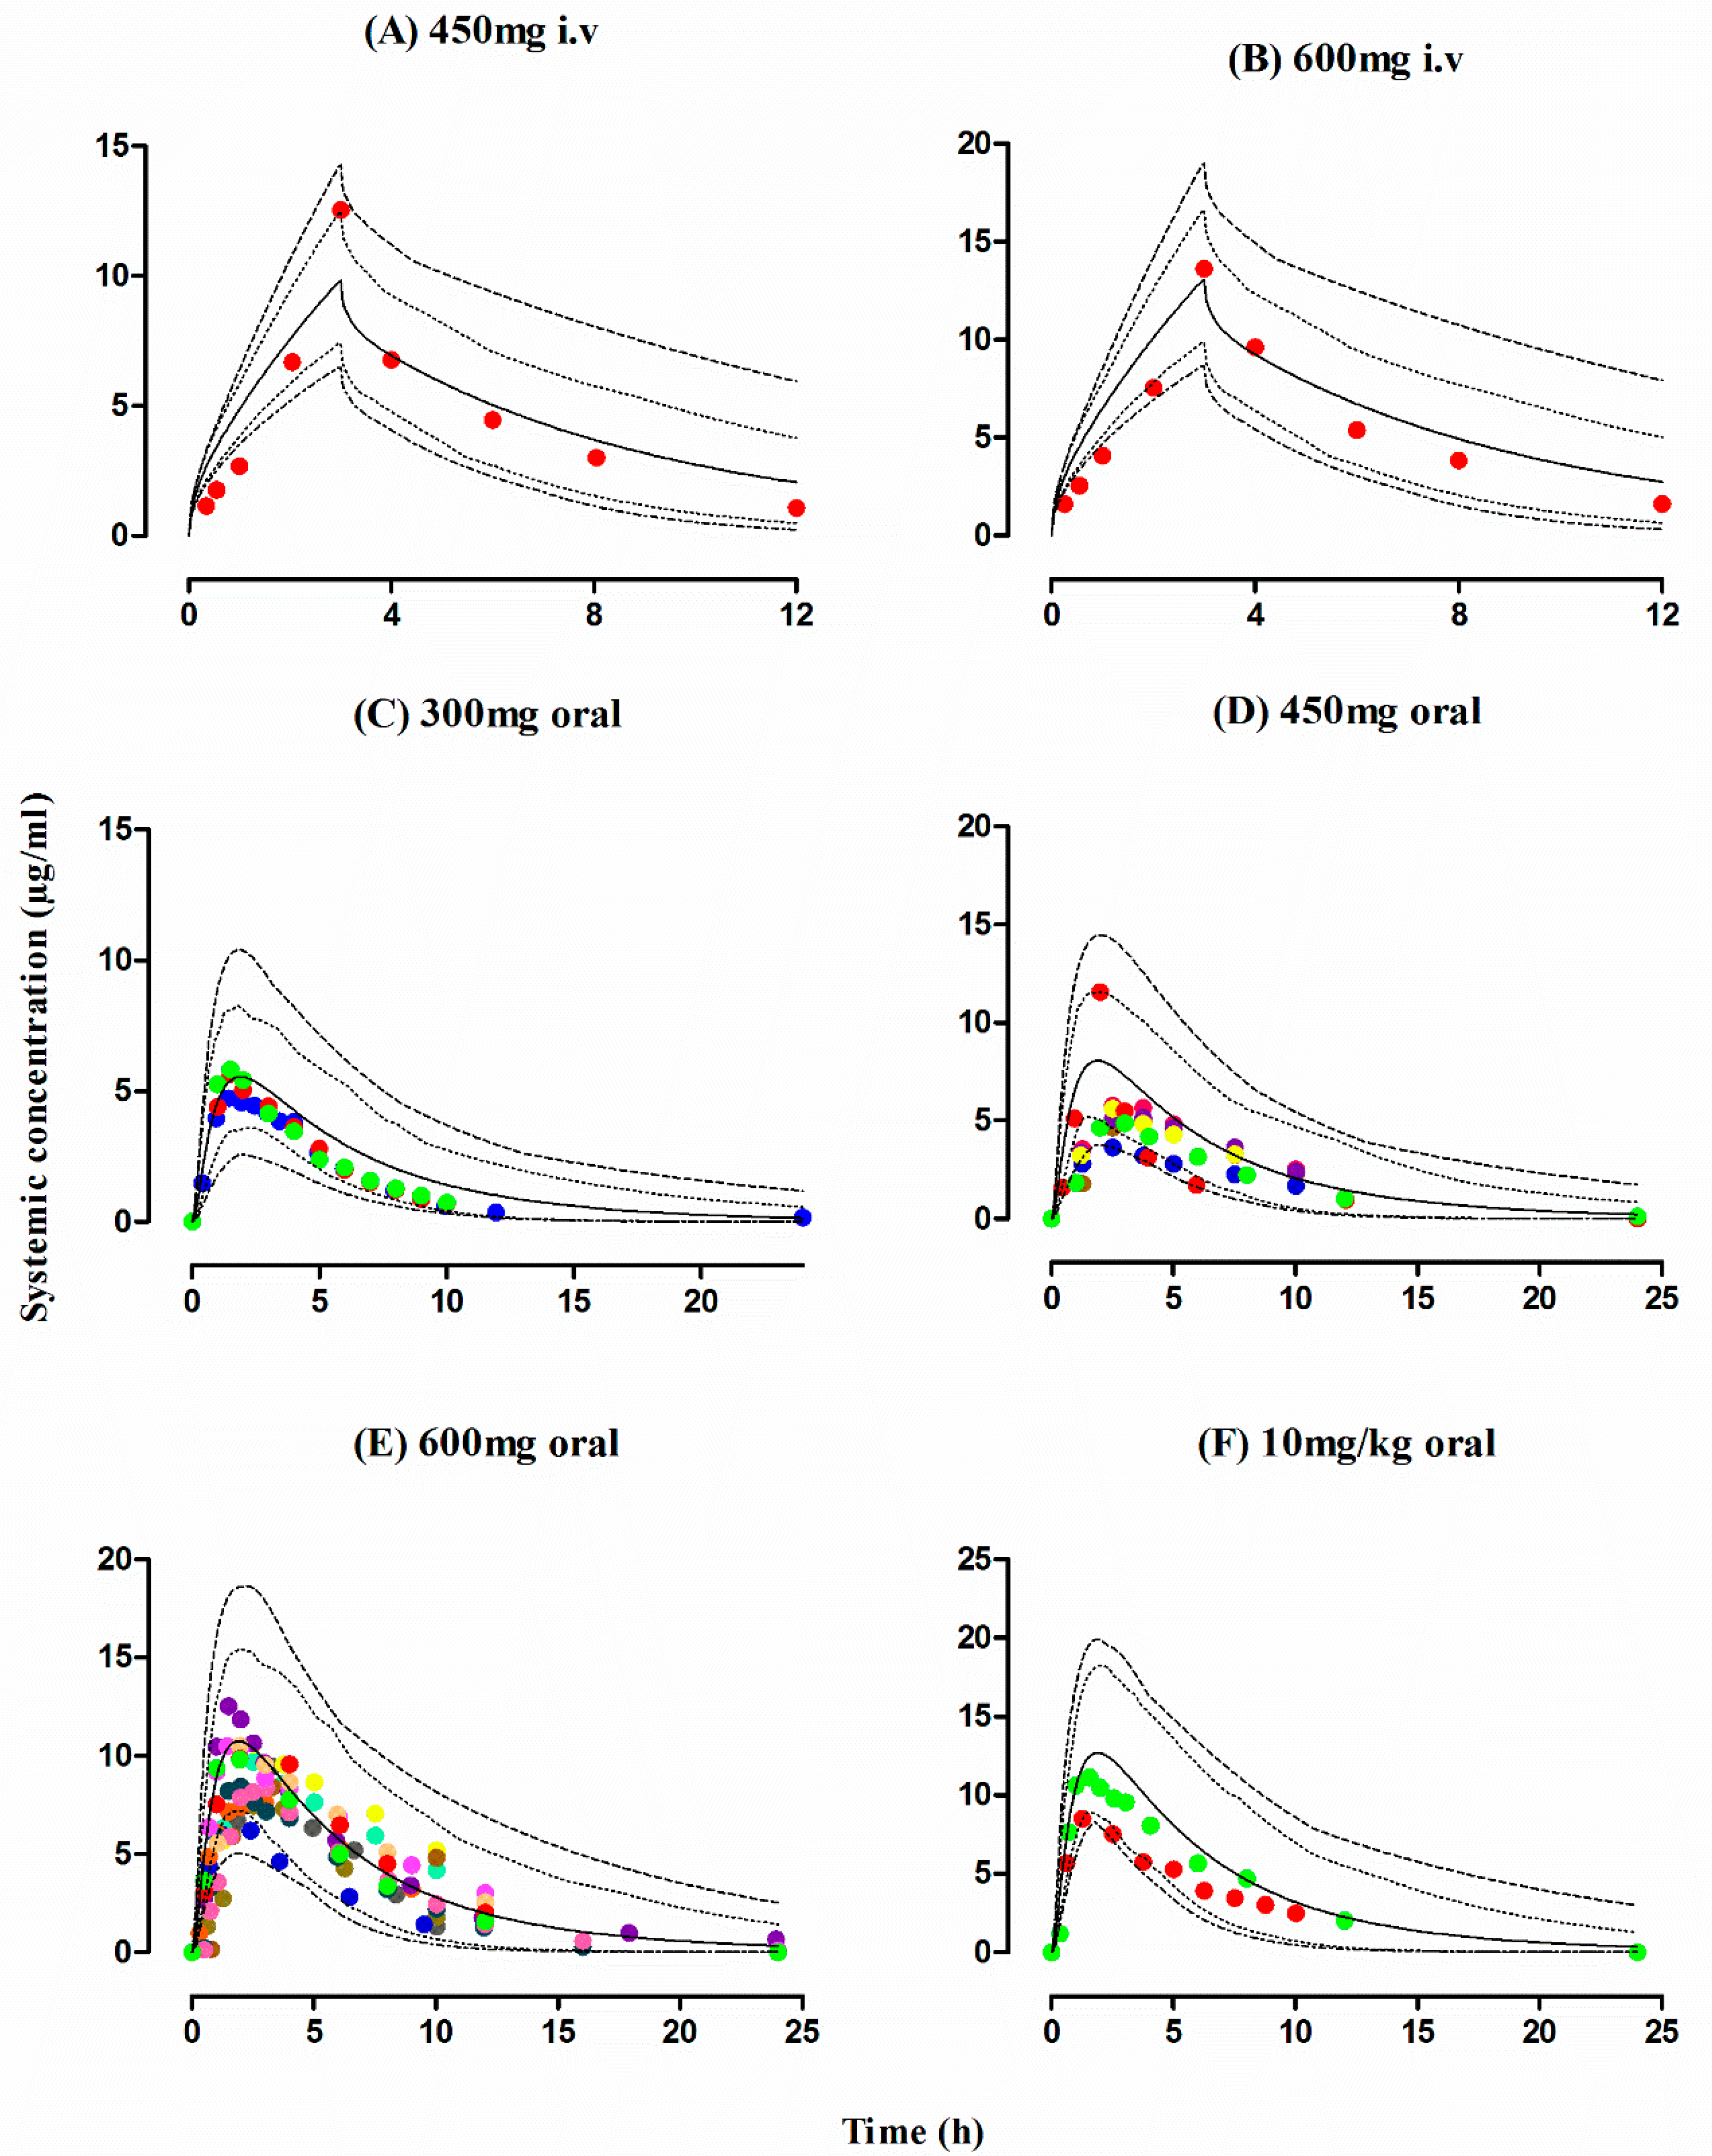
3.1. Healthy Population
3.2. Tuberculosis Patients
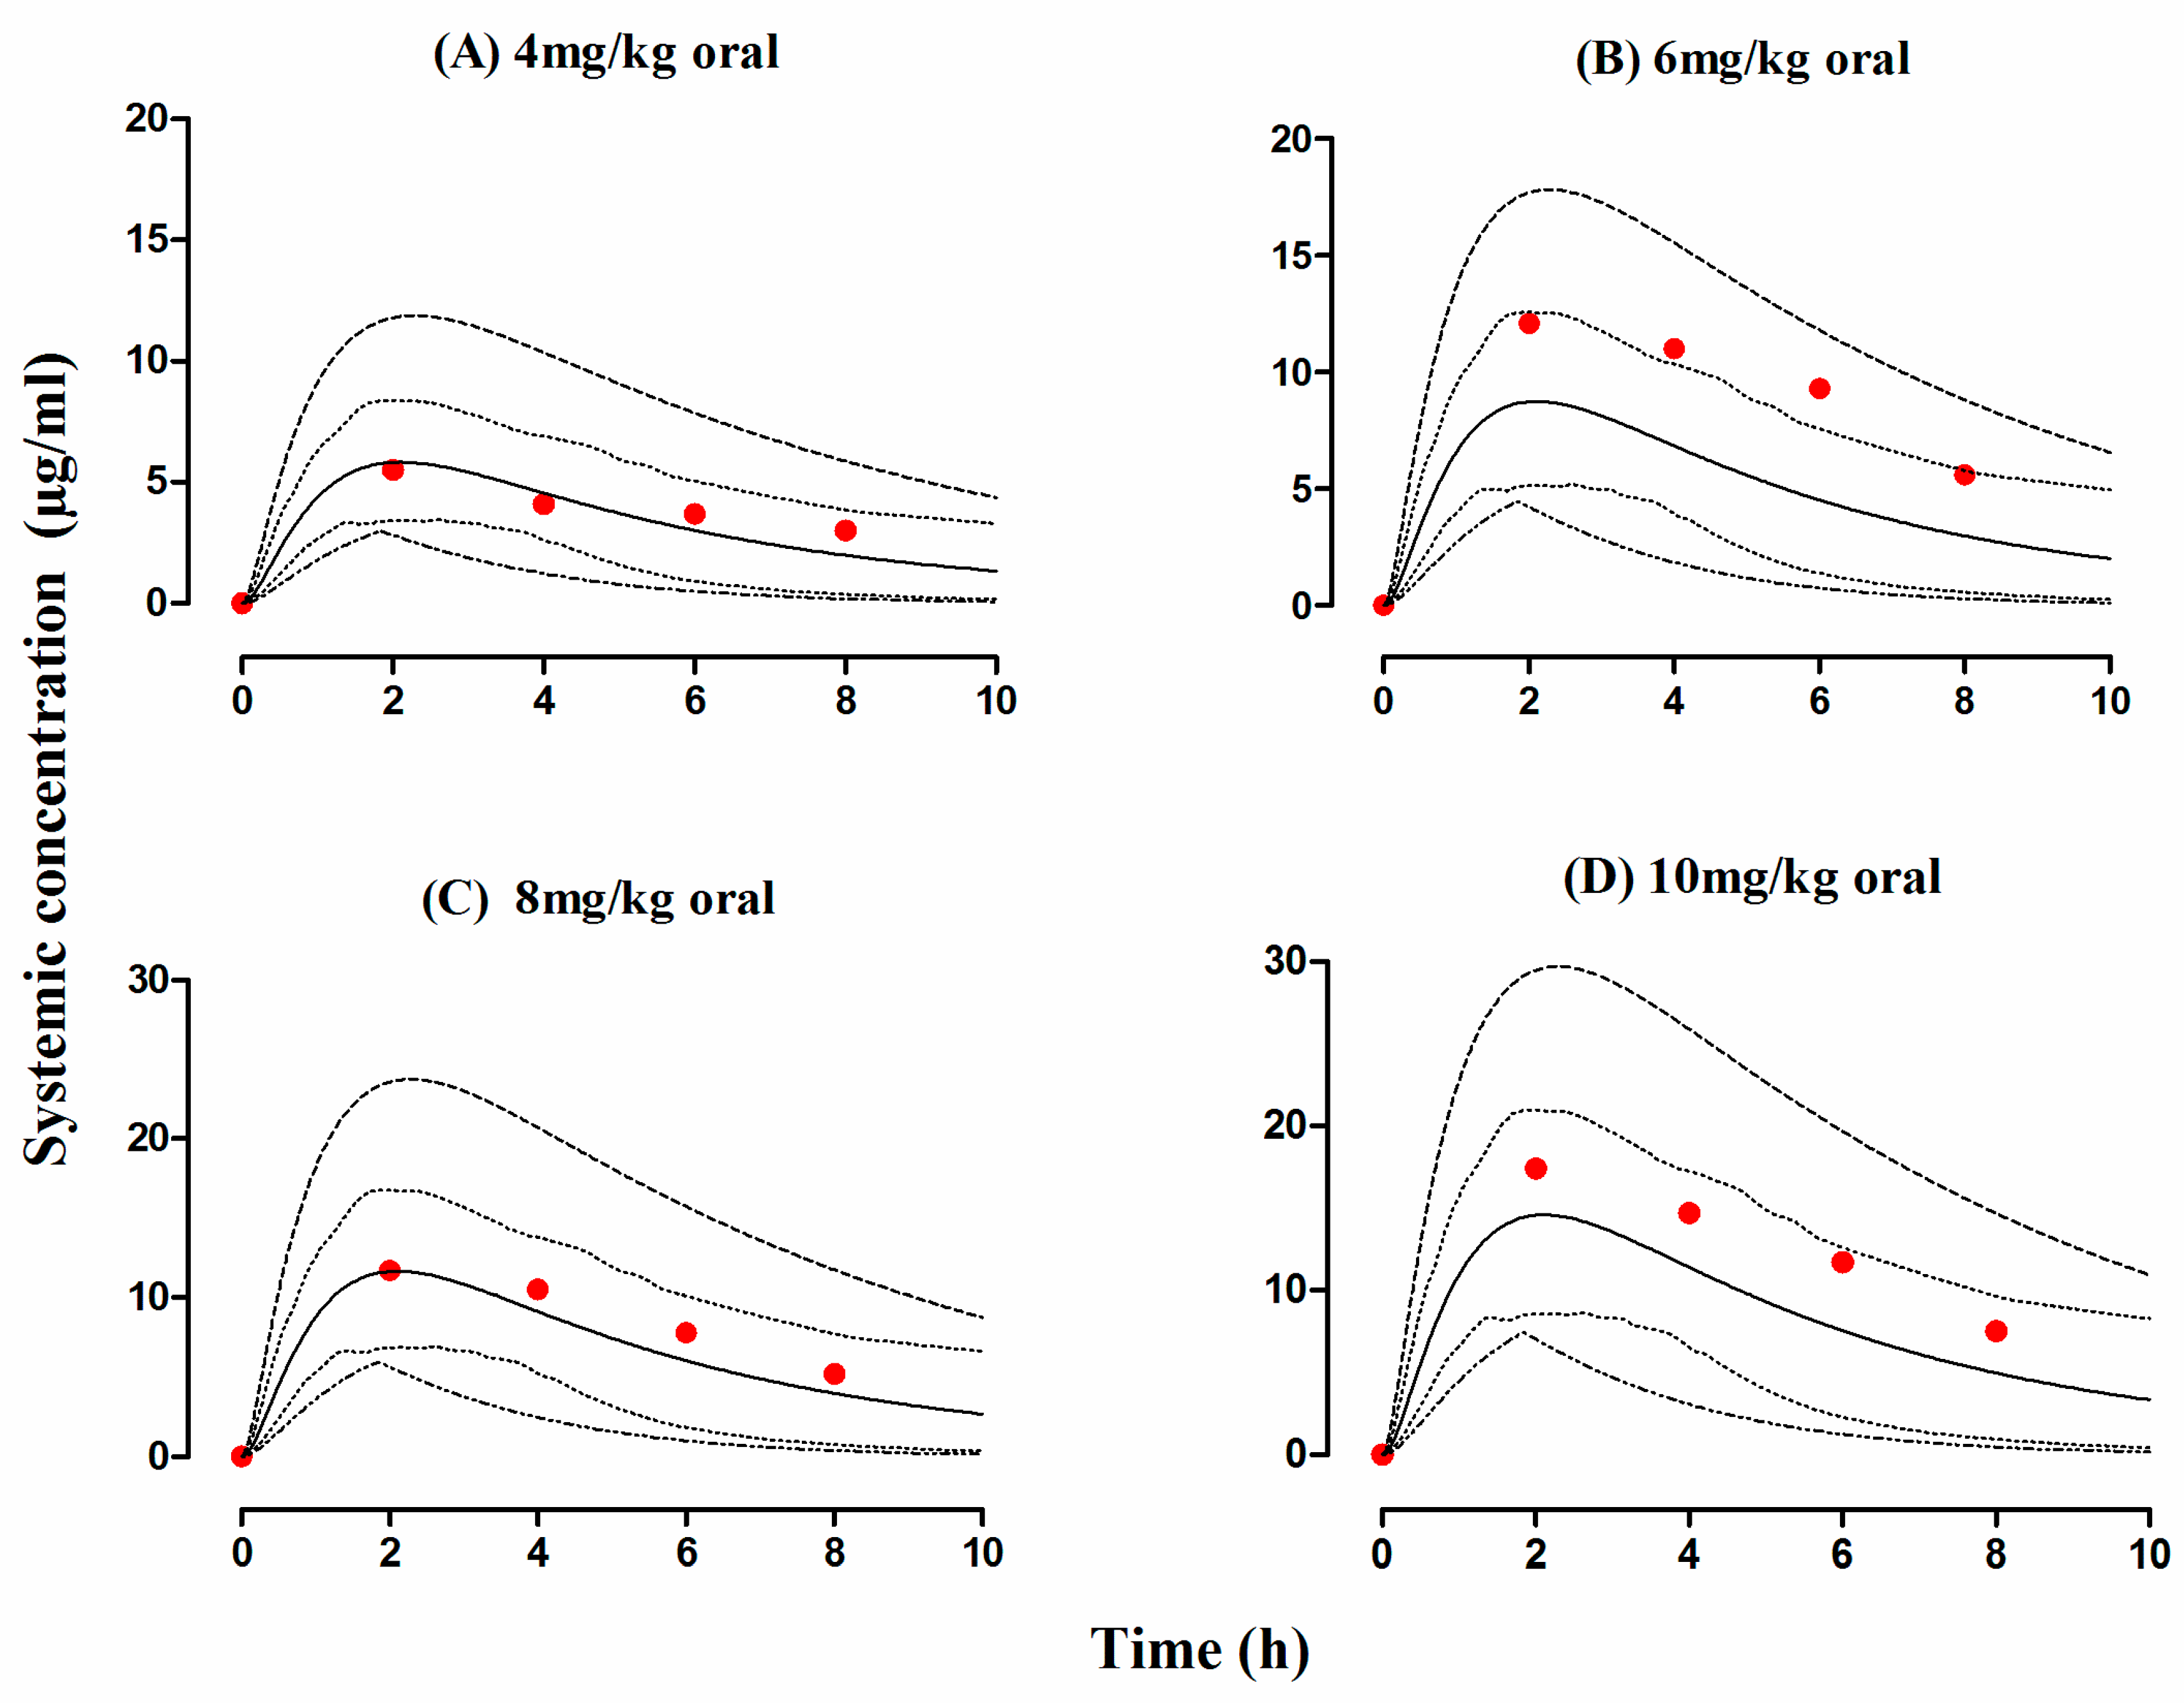
3.3. Liver Cirrhosis Patients
4. Discussion
5. Conclusions
6. Limitations
Supplementary Materials
Author Contributions
Funding
Acknowledgments
Conflicts of Interest
References
- Rasool, M.F.; Khalil, F.; Läer, S. A Physiologically Based Pharmacokinetic Drug–Disease Model to Predict Carvedilol Exposure in Adult and Paediatric Heart Failure Patients by Incorporating Pathophysiological Changes in Hepatic and Renal Blood Flows. Clin. Pharmacokinet. 2015, 54, 943–962. [Google Scholar] [CrossRef] [PubMed]
- Sayama, H.; Takubo, H.; Komura, H.; Kogayu, M.; Iwaki, M. Application of a physiologically based pharmacokinetic model informed by a top-down approach for the prediction of pharmacokinetics in chronic kidney disease patients. AAPS J. 2014, 16, 1018–1028. [Google Scholar] [CrossRef] [PubMed]
- Tan, M.-L.; Zhao, P.; Zhang, L.; Ho, Y.-F.; Varma, M.V.S.; Neuhoff, S.; Nolin, T.D.; Galetin, A.; Huang, S.-M. Use of Physiologically Based Pharmacokinetic Modeling to Evaluate the Effect of Chronic Kidney Disease on the Disposition of Hepatic CYP2C8 and OATP1B Drug Substrates. Clin. Pharmacol. Ther. 2019, 105, 719–729. [Google Scholar] [CrossRef] [PubMed]
- Zhao, P.; Zhang, L.; Grillo, J.; Liu, Q.; Bullock, J.; Moon, Y.; Song, P.; Brar, S.; Madabushi, R.; Wu, T. Applications of physiologically based pharmacokinetic (PBPK) modeling and simulation during regulatory review. Clin. Pharmacol. Ther. 2011, 89, 259–267. [Google Scholar] [CrossRef] [PubMed]
- Zhuang, X.; Lu, C. PBPK modeling and simulation in drug research and development. Acta Pharm. Sin. B 2016, 6, 430–440. [Google Scholar] [CrossRef] [PubMed] [Green Version]
- Miller, N.A.; Reddy, M.B.; Heikkinen, A.T.; Lukacova, V.; Parrott, N. Physiologically Based Pharmacokinetic Modelling for First-In-Human Predictions: An Updated Model Building Strategy Illustrated with Challenging Industry Case Studies. Clin. Pharmacokinet. 2019, 58, 727–746. [Google Scholar] [CrossRef] [Green Version]
- Pilari, S.; Huisinga, W. Lumping of physiologically-based pharmacokinetic models and a mechanistic derivation of classical compartmental models. J. Pharmacokinet. Pharmacodyn. 2010, 37, 365–405. [Google Scholar] [CrossRef]
- Shardlow, C.E.; Generaux, G.T.; Patel, A.H.; Tai, G.; Tran, T.; Bloomer, J.C. Impact of physiologically based pharmacokinetic modeling and simulation in drug development. Drug Metab. Dispos. 2013, 41, 1994–2003. [Google Scholar] [CrossRef]
- Edginton, A.N.; Willmann, S. Physiology-based simulations of a pathological condition. Clin. Pharmacokinet. 2008, 47, 743–752. [Google Scholar] [CrossRef]
- Khalil, F.; Läer, S. Physiologically based pharmacokinetic modeling: Methodology, applications, and limitations with a focus on its role in pediatric drug development. Biomed. Res. Int. 2011, 1–13. [Google Scholar] [CrossRef]
- Reddy, M.B.; Clewell, H.J., III; Lave, T.; Andersen, M.E. Physiologically based pharmacokinetic modeling: A tool for understanding ADMET properties and extrapolating to human. In New Insights into Toxicity and Drug Testing; IntechOpen: London, UK, 2013. [Google Scholar] [CrossRef]
- Zhao, P.; de LT Vieira, M.; Grillo, J.A.; Song, P.; Wu, T.C.; Zheng, J.H.; Arya, V.; Berglund, E.G.; Atkinson, A.J.; Sugiyama, Y. Evaluation of exposure change of nonrenally eliminated drugs in patients with chronic kidney disease using physiologically based pharmacokinetic modeling and simulation. J. Clin. Pharmacol. 2012, 52, 91S–108S. [Google Scholar] [CrossRef] [PubMed]
- Verscheijden, L.F.; Koenderink, J.B.; de Wildt, S.N.; Russel, F.G. Development of a physiologically-based pharmacokinetic pediatric brain model for prediction of cerebrospinal fluid drug concentrations and the influence of meningitis. PLoS Comput. Biol. 2019, 15, e1007117. [Google Scholar] [CrossRef] [PubMed]
- Marsousi, N.; Desmeules, J.A.; Rudaz, S.; Daali, Y. Usefulness of PBPK modeling in incorporation of clinical conditions in personalized medicine. J. Pharm. Sci. 2017, 106, 2380–2391. [Google Scholar] [CrossRef] [PubMed]
- Medellín-Garibay, S.; Cortez-Espinosa, N.; Milán-Segovia, R.; Magaña-Aquino, M.; Vargas-Morales, J.; González-Amaro, R.; Portales-Pérez, D.; Romano-Moreno, S. Clinical pharmacokinetics of rifampicin in patients with tuberculosis and type 2 diabetes mellitus: Association with biochemical and immunological parameters. Antimicrob. Agents Chemother. 2015, 59, 7707–7714. [Google Scholar] [CrossRef] [PubMed]
- Denholm, J.T.; McBryde, E.S. The use of anti-tuberculosis therapy for latent TB infection. Infect. Drug Resist. 2010, 3, 63. [Google Scholar] [CrossRef] [PubMed]
- Ramakrishnan, K.; Shenbagarathai, R.; Kavitha, K.; Uma, A.; Balasubramaniam, R.; Thirumalaikolundu Subramanian, P. Serum zinc and albumin levels in pulmonary tuberculosis patients with and without HIV. Jpn. J. Infect. Dis. 2008, 61, 202–204. [Google Scholar] [PubMed]
- Sudfeld, C.R.; Isanaka, S.; Aboud, S.; Mugusi, F.M.; Wang, M.; Chalamilla, G.E.; Fawzi, W.W. Association of serum albumin concentration with mortality, morbidity, CD4 T-cell reconstitution among tanzanians initiating antiretroviral therapy. J. Infect. Dis. 2013, 207, 1370–1378. [Google Scholar] [CrossRef]
- Rowland, M. Protein binding and drug clearance. Clin. Pharmacokinet. 1984, 9, 10–17. [Google Scholar] [CrossRef]
- Glaeser, H.; Drescher, S.; Eichelbaum, M.; Fromm, M. Influence of rifampicin on the expression and function of human intestinal cytochrome P450 enzymes. Br. J. Clin. Pharmacol. 2005, 59, 199–206. [Google Scholar] [CrossRef]
- Agrawal, S.; Panchagnula, R. Implication of biopharmaceutics and pharmacokinetics of rifampicin in variable bioavailability from solid oral dosage forms. Biopharm. Drug Dispos. 2005, 26, 321–334. [Google Scholar] [CrossRef]
- Svensson, R.J.; Aarnoutse, R.E.; Diacon, A.H.; Dawson, R.; Gillespie, S.H.; Boeree, M.J.; Simonsson, U.S. A population pharmacokinetic model incorporating saturable pharmacokinetics and autoinduction for high rifampicin doses. Clin. Pharmacol. Ther. 2018, 103, 674–683. [Google Scholar] [CrossRef] [PubMed]
- Gu, H.; Dutreix, C.; Rebello, S.; Ouatas, T.; Wang, L.; Chun, D.Y.; Einolf, H.J.; He, H. Simultaneous Physiologically Based Pharmacokinetic (PBPK) Modeling of Parent and Active Metabolites to Investigate Complex CYP3A4 Drug-Drug Interaction Potential: A Case Example of Midostaurin. Drug Metab. Dispos. 2018, 46, 109–121. [Google Scholar] [CrossRef] [PubMed]
- Varma, M.V.; Lai, Y.; Feng, B.; Litchfield, J.; Goosen, T.C.; Bergman, A. Physiologically based modeling of pravastatin transporter-mediated hepatobiliary disposition and drug-drug interactions. Pharm. Res. 2012, 29, 2860–2873. [Google Scholar] [CrossRef] [PubMed]
- Baneyx, G.; Parrott, N.; Meille, C.; Iliadis, A.; Lavé, T. Physiologically based pharmacokinetic modeling of CYP3A4 induction by rifampicin in human: Influence of time between substrate and inducer administration. Eur. J. Pharm. Sci. 2014, 56, 1–15. [Google Scholar] [CrossRef] [PubMed]
- Milan-Segovia, R.; Dominguez-Ramirez, A.; Jung-Cook, H.; Magana-Aquino, M.; Romero-Mendez, M.; Medellin-Garibay, S.; Vigna-Perez, M.; Romano-Moreno, S. Relative bioavailability of rifampicin in a three-drug fixed-dose combination formulation. Int. J. Tuberc. Lung Dis. 2010, 14, 1454–1460. [Google Scholar]
- Pähkla, R.; Lambert, J.; Ansko, P.; Winstanley, P.; Davies, P.; Kiivet, R.A. Comparative bioavailability of three different preparations of rifampicin. J. Clin. Pharm. Ther. 1999, 24, 219–225. [Google Scholar] [CrossRef]
- Zwolska, Z.; Augustynowicz-Kopec, E.; Niemirowska-Mikulska, H. The pharmacokinetic factors and bioavailability of rifampicin, isoniazid and pyrazinamid fixed in one dose capsule. Acta Pol. Pharm. 2002, 59, 448–451. [Google Scholar]
- Khadka, P.; Dummer, J.; Hill, P.C.; Das, S.C. Considerations in preparing for clinical studies of inhaled rifampicin to enhance tuberculosis treatment. Int. J. Pharm. 2018, 548, 244–254. [Google Scholar] [CrossRef]
- Loos, U.; Musch, E.; Jensen, J.; Mikus, G.; Schwabe, H.; Eichelbaum, M. Pharmacokinetics of oral and intravenous rifampicin during chronic administration. Klin. Wochenschr. 1985, 63, 1205–1211. [Google Scholar] [CrossRef]
- Asaumi, R.; Toshimoto, K.; Tobe, Y.; Hashizume, K.; Nunoya, K.i.; Imawaka, H.; Lee, W.; Sugiyama, Y. Comprehensive PBPK Model of Rifampicin for Quantitative Prediction of Complex Drug-Drug Interactions: CYP3A/2C9 Induction and OATP Inhibition Effects. CPT Pharmacomet. Syst. Pharmacol. 2018, 7, 186–196. [Google Scholar] [CrossRef]
- Jamei, M.; Marciniak, S.; Feng, K.; Barnett, A.; Tucker, G.; Rostami-Hodjegan, A. The Simcyp® population-based ADME simulator. Expert Opin. Drug Metab. Toxicol. 2009, 5, 211–223. [Google Scholar] [CrossRef] [PubMed]
- Khalil, F.; Laer, S. Physiologically based pharmacokinetic models in the prediction of oral drug exposure over the entire pediatric age range—Sotalol as a model drug. AAPS J. 2014, 16, 226–239. [Google Scholar] [CrossRef] [PubMed]
- PubChem. Rifmpicin (Compound Summary). Available online: https://pubchem.ncbi.nlm.nih.gov/compound/Rifampicin (accessed on 3 April 2018).
- Jamei, M.; Turner, D.; Yang, J.; Neuhoff, S.; Polak, S.; Rostami-Hodjegan, A.; Tucker, G. Population-based mechanistic prediction of oral drug absorption. AAPS J. 2009, 11, 225–237. [Google Scholar] [CrossRef] [PubMed]
- Rodgers, T.; Rowland, M. Mechanistic approaches to volume of distribution predictions: Understanding the processes. Pharm. Res. 2007, 24, 918–933. [Google Scholar] [CrossRef] [PubMed]
- Rafiq, S.; Iqbal, T.; Jamil, A.; Khan, F.H. Pharmacokinetic studies of rifampicin in healthy volunteers and tuberculosis patients. Int. J. Agric. Biol. 2010, 12, 391–395. [Google Scholar]
- Johnson, T.N.; Boussery, K.; Rowland-Yeo, K.; Tucker, G.T.; Rostami-Hodjegan, A. A semi-mechanistic model to predict the effects of liver cirrhosis on drug clearance. Clin. Pharmacokinet. 2010, 49, 189–206. [Google Scholar] [CrossRef]
- GetData Graph Digitizer. Available online: http://getdata-graph-digitizer.com/ (accessed on 17 February 2018).
- Nitti, V.; Virgilio, R.; Patricolo, M.; Iuliano, A. Pharmacokinetic study of intravenous rifampicin. Chemotherapy 1977, 23, 1–6. [Google Scholar] [CrossRef]
- Chouchane, N.; Barre, J.; Toumi, A.; Tillement, J.; Benakis, A. Bioequivalence study of two pharmaceutical forms of rifampicin capsules in man. Eur. J. Drug Metab. Pharmacokinet. 1995, 20, 315–320. [Google Scholar] [CrossRef]
- Peloquin, C.A.; Jaresko, G.S.; Yong, C.-L.; Keung, A.; Bulpitt, A.E.; Jelliffe, R.W. Population pharmacokinetic modeling of isoniazid, rifampin, and pyrazinamide. Antimicrob. Agents Chemother. 1997, 41, 2670–2679. [Google Scholar] [CrossRef] [Green Version]
- Xu, J.; Jin, H.; Zhu, H.; Zheng, M.; Wang, B.; Liu, C.; Chen, M.; Zhou, L.; Zhao, W.; Fu, L. Oral bioavailability of rifampicin, isoniazid, ethambutol, and pyrazinamide in a 4-drug fixed-dose combination compared with the separate formulations in healthy Chinese male volunteers. Clin. Ther. 2013, 35, 161–168. [Google Scholar] [CrossRef]
- Agrawal, S.; Singh, I.; Kaur, K.J.; Bhade, S.R.; Kaul, C.L.; Panchagnula, R. Comparative bioavailability of rifampicin, isoniazid and pyrazinamide from a four drug fixed dose combination with separate formulations at the same dose levels. Int. J. Pharm. 2004, 276, 41–49. [Google Scholar] [CrossRef] [PubMed]
- Agrawal, S.; Singh, I.; Kaur, K.J.; Bhade, S.; Kaul, C.L.; Panchagnula, R. Bioequivalence trials of rifampicin containing formulations: Extrinsic and intrinsic factors in the absorption of rifampicin. Pharmacol. Res. 2004, 50, 317–327. [Google Scholar] [CrossRef] [PubMed]
- Peloquin, C.A.; Namdar, R.; Singleton, M.D.; Nix, D.E. Pharmacokinetics of rifampin under fasting conditions, with food, and with antacids. Chest 1999, 115, 12–18. [Google Scholar] [CrossRef]
- Advenier, C.; Gobert, C.; Houin, G.; Bidet, D.; Richelet, S.; Tillement, J. Pharmacokinetic studies of rifampicin in the elderly. Ther. Drug Monit. 1983, 5, 61–65. [Google Scholar] [CrossRef] [PubMed]
- Agrawal, S.; Kaur, K.J.; Singh, I.; Bhade, S.R.; Kaul, C.L.; Panchagnula, R. Assessment of bioequivalence of rifampicin, isoniazid and pyrazinamide in a four drug fixed dose combination with separate formulations at the same dose levels. Int. J. Pharm. 2002, 233, 169–177. [Google Scholar] [CrossRef]
- Marchidanu, D.; Raducanu, N.; Miron, D.S.; Radulescu, F.; Anuta, V.; Mircioiu, I.; Prasacu, I. Comparative pharmacokinetics of rifampicin and 25-desacetyl rifampicin in healthy volunteers after single oral dose administration. FARMACIA 2013, 61, 398–410. [Google Scholar]
- Ruslami, R.; Nijland, H.M.; Alisjahbana, B.; Parwati, I.; van Crevel, R.; Aarnoutse, R.E. Pharmacokinetics and tolerability of a higher rifampin dose versus the standard dose in pulmonary tuberculosis patients. Antimicrob. Agents Chemother. 2007, 51, 2546–2551. [Google Scholar] [CrossRef]
- Ruslami, R.; Nijland, H.M.; Adhiarta, I.G.N.; Kariadi, S.H.; Alisjahbana, B.; Aarnoutse, R.E.; van Crevel, R. Pharmacokinetics of antituberculosis drugs in pulmonary tuberculosis patients with type 2 diabetes. Antimicrob. Agents Chemother. 2010, 54, 1068–1074. [Google Scholar] [CrossRef]
- Saktiawati, A.M.; Sturkenboom, M.G.; Stienstra, Y.; Subronto, Y.W.; Kosterink, J.G.; van der Werf, T.S.; Alffenaar, J.-W.C. Impact of food on the pharmacokinetics of first-line anti-TB drugs in treatment-naive TB patients: A randomized cross-over trial. J. Antimicrob. Chemother. 2015, 71, 703–710. [Google Scholar] [CrossRef]
- Curci, G.; Claar, E.; Bergamini, N.; Ninni, A.; Claar, G.; Ascione, A.; Nitti, V. Studies on blood serum levels of rifampicin in patients with normal and impaired liver function. Chemother. 1973, 19, 197–205. [Google Scholar] [CrossRef]
- Marsousi, N.; Daali, Y.; Rudaz, S.; Almond, L.; Humphries, H.; Desmeules, J.; Samer, C.F. Prediction of Metabolic Interactions with Oxycodone via CYP2D6 and CYP3A Inhibition Using a Physiologically Based Pharmacokinetic Model. CPT Pharmacomet. Syst. Pharmacol. 2014, 3, 1–8. [Google Scholar] [CrossRef] [PubMed]
- Jiang, X.L.; Zhao, P.; Barrett, J.S.; Lesko, L.J.; Schmidt, S. Application of physiologically based pharmacokinetic modeling to predict acetaminophen metabolism and pharmacokinetics in children. CPT Pharmacomet. Syst Pharm. 2013, 2, e80. [Google Scholar] [CrossRef] [PubMed]
- Jamei, M.; Bajot, F.; Neuhoff, S.; Barter, Z.; Yang, J.; Rostami-Hodjegan, A.; Rowland-Yeo, K. A mechanistic framework for in vitro-in vivo extrapolation of liver membrane transporters: Prediction of drug-drug interaction between rosuvastatin and cyclosporine. Clin. Pharm. 2014, 53, 73–87. [Google Scholar] [CrossRef] [PubMed]
- Chen, Y.; Cabalu, T.D.; Callegari, E.; Einolf, H.; Liu, L.; Parrott, N.; Peters, S.A.; Schuck, E.; Sharma, P.; Tracey, H.; et al. Recommendations for the Design of Clinical Drug-Drug Interaction Studies with Itraconazole using a Mechanistic PBPK Model. CPT Pharmacomet. Syst. Pharmacol. 2019. [Google Scholar] [CrossRef] [PubMed]
- Chen, Y.; Ma, F.; Lu, T.; Budha, N.; Jin, J.Y.; Kenny, J.R.; Wong, H.; Hop, C.E.C.A.; Mao, J. Development of a Physiologically Based Pharmacokinetic Model for Itraconazole Pharmacokinetics and Drug–Drug Interaction Prediction. Clin. Pharmacokinet. 2016, 55, 735–749. [Google Scholar] [CrossRef]
- Heimbach, T.; Lin, W.; Hourcade-Potelleret, F.; Tian, X.; Combes, F.P.; Horvath, N.; He, H. Physiologically Based Pharmacokinetic Modeling to Supplement Nilotinib Pharmacokinetics and Confirm Dose Selection in Pediatric Patients. J. Pharm. Sci. 2019, 108, 2191–2198. [Google Scholar] [CrossRef]
- Zhang, Y.; Huo, M.; Zhou, J.; Xie, S. PKSolver: An add-in program for pharmacokinetic and pharmacodynamic data analysis in Microsoft Excel. Comput. Methods Programs Biomed. 2010, 99, 306–314. [Google Scholar] [CrossRef]
- De Buck, S.S.; Sinha, V.K.; Fenu, L.A.; Nijsen, M.J.; Mackie, C.E.; Gilissen, R.A. Prediction of human pharmacokinetics using physiologically based modeling: A retrospective analysis of 26 clinically tested drugs. Drug Metab. Dispos. 2007, 35, 1766–1780. [Google Scholar] [CrossRef]
- Li, G.-F.; Wang, K.; Chen, R.; Zhao, H.-R.; Yang, J.; Zheng, Q.-S. Simulation of the pharmacokinetics of bisoprolol in healthy adults and patients with impaired renal function using whole-body physiologically based pharmacokinetic modeling. Acta Pharmacol. Sin. 2012, 33, 1359. [Google Scholar] [CrossRef]
- Verscheijden, L.; Koenderink, J.; Allegaert, K.; de Wildt, S.; Russel, F. O19 Development of a paediatric brain PBPK model in children with and without meningitis. Arch. Dis. Child. 2019, 104, e8–e9. [Google Scholar] [CrossRef]
- Shaheen, A.; Najmi, M.H.; Saeed, W.; Farooqi, Z.-U.-R. Pharmacokinetics of standard dose regimens of rifampicin in patients with pulmonary tuberculosis in Pakistan. Scand. J. Infect. Dis. 2012, 44, 459–464. [Google Scholar] [CrossRef] [PubMed]
- Benet, L.Z.; Hoener, B.A. Changes in plasma protein binding have little clinical relevance. Clin. Pharmacol. Ther. 2002, 71, 115–121. [Google Scholar] [CrossRef] [PubMed]
- Kenny, M.; Strates, B. Metabolism and pharmacokinetics of the antibiotic rifampin. Drug Metab. Rev. 1981, 12, 159–218. [Google Scholar] [CrossRef] [PubMed]
- Loos, U.; Musch, E.; Jensen, J.; Schwabe, H.; Eichelbaum, M. Influence of the enzyme induction by rifampicin on its presystemic metabolism. Pharmacol. Ther. 1987, 33, 201–204. [Google Scholar] [CrossRef]
- CYP2C9, C.C.; CYP2D6, C.A. The effect of cytochrome P450 metabolism on drug response, interactions, and adverse effects. Am. Fam. Phys. 2007, 76, 391–396. [Google Scholar]
- Polasa, K.; Murthy, K.; Krishnaswamy, K. Rifampicin kinetics in undernutrition. Br. J. Clin. Pharmacol. 1984, 17, 481–484. [Google Scholar] [CrossRef]
- Um, S.; Lee, S.; Kwon, S.; Yoon, H.I.; Park, K.U.; Song, J.; Lee, C.T.; Lee, J. Low serum concentrations of anti-tuberculosis drugs and determinants of their serum levels. Int. J. Tuberc. Lung Dis. 2007, 11, 972–978. [Google Scholar]
- Westphal, J.-F.; Brogard, J.-M. Drug administration in chronic liver disease. Drug Saf. 1997, 17, 47–73. [Google Scholar] [CrossRef]
- Verbeeck, R.K. Pharmacokinetics and dosage adjustment in patients with hepatic dysfunction. Eur. J. Clin. Pharmacol. 2008, 64, 1147. [Google Scholar] [CrossRef]
- Capelle, P.; Dhumeaux, D.; Mora, M.; Feldmann, G.; Berthelot, P. Effect of rifampicin on liver function in man. Gut 1972, 13, 366–371. [Google Scholar] [CrossRef] [Green Version]


| Parameters | Reported Values | Model Input Values | Reference |
|---|---|---|---|
| Physicochemical Properties | |||
| Molecular weight (g/mol) | 822.9 | 822.9 | [34] |
| LogPo:w | 2.7 | 2.7 | [34] |
| pKa1 | 1.7 | 1.7 | [24] |
| pKa2 | 7.9 | 7.9 | [24] |
| Compound type | Ampholyte | ||
| Absorption | |||
| Model | ADAM | ||
| Peff,man (cm/s) | 2.15 × 10⁻⁴ | 2.4 × 10⁻⁴ a | [23] |
| Distribution | |||
| Model | Full PBPK | ||
| Prediction Method 2 | Rodger and Rowland method | ||
| B/P ratio | 0.52–0.90 | 0.67 a | [24,25] |
| fu | 0.15 | 0.34 a | [24] |
| Vss (L/kg) | 0.33–0.53 | 0.33 | [23,24,25] |
| Elimination | |||
| CLiv (L/h) | 7 | 7 | [24] |
| CLR (L/h) | 1.5 | 1.5 | [25] |
| No | Population | No. of Subjects | Dose | Route | Age (Years) | Weight (kg) | Female Proportion | Reference Study * |
|---|---|---|---|---|---|---|---|---|
| 1 | Healthy | 2 | 450 mg | Intravenous infusion | 25–60 | 0 | [40] | |
| 2 | Healthy | 6 | 600 mg | Intravenous infusion | 25–60 | 0 | [40] | |
| 3 | Healthy | 12 | 300 mg | Oral | 25–53 | 48–88 | 0 | [41] |
| 4 | Healthy | 24 | 600 mg | Oral | 19–45 | 60–101.4 | 0 | [42] |
| 5 | Healthy | 18 | 600 mg | Oral | 18–55 | >50 | 0 | [43] |
| 6 | Healthy | 22 | 600 mg | Oral | 18–55 | >50 | 0 | [44] |
| 7 | Healthy | 16 | 600 mg | Oral | 28–59 | 51–80 | 0.68 | [28] |
| 8 | Healthy | 18 | 600 mg | Oral | 18–40 | Mean: 68.73 | 0.5 | [26] |
| 9 | Healthy | 66 | 450 mg | Oral | 18–55 | >50 | 0.5 | [45] |
| 10 | Healthy | 61 | 600 mg | Oral | 18–55 | >50 | [45] | |
| 11 | Healthy | 19 | 600 mg | Oral | 19–29 | 49–95 | 0.73 | [27] |
| 12 | Healthy | 8 | 600 mg | Oral | 18–50 | Mean: 79.3 | 0.5 | [46] |
| 13 | Healthy | 6 | 10 mg/kg | Oral | 60–95 | 44–81 | 0.33 | [47] |
| 14 | Healthy | 13 | 450 mg | Oral | 18–45 | 0 | [48] | |
| 15 | Healthy | 13 | 450 mg | Oral | 15–59 | 0 | [37] | |
| 16 | Healthy | 30 | 300 mg | Oral | 0.5 | [49] | ||
| 17 | Healthy | 24 | 10 mg/kg | Oral | 18–65 | 0.6 | [15] |
| No. | Population | No. of Subjects | Dose | Route | Age (Years) | Weight (kg) | Female Proportion | Reference Study |
|---|---|---|---|---|---|---|---|---|
| 1 | Tuberculosis | 24 | 10 mg/kg | Oral | 18–65 | 0.6 | [15] | |
| 2 | Tuberculosis | 23 | 600 mg | Oral | 18–55 | Mean: 47 | 0.47 | [50] |
| 3 | Tuberculosis | 24 | 450 mg | Oral | 18–55 | Mean: 47 | 0.47 | [50] |
| 4 | Tuberculosis | 18 | 450 mg | Oral | 18–60 | 47.3 | 0.61 | [51] |
| 5 | Tuberculosis | 13 | 450 mg | Oral | 15–59 | 0 | [37] | |
| 6 | Tuberculosis | 20 | 450 mg | Oral | Mean: 40.5 | Mean: 42.9 | 0.4 | [52] |
| 7 | Liver cirrhosis | 7 | 4 mg/kg | Oral | 18–60 | [53] | ||
| 8 | Liver cirrhosis | 7 | 6 mg/kg | Oral | 18–60 | [53] | ||
| 9 | Liver cirrhosis | 7 | 8 mg/kg | Oral | 18–60 | [53] | ||
| 10 | Liver cirrhosis | 7 | 10 mg/kg | oral | 18–60 | [53] |
| PK Parameters | Dose | Healthy | Tuberculosis | Liver Cirrhosis | |||
|---|---|---|---|---|---|---|---|
| Observed | Predicted | Observed | Predicted | Observed | Predicted | ||
| Intravenous Administration | |||||||
| AUC0–∞ (µg/mL·h) | 450 mg | 52.49 | 58.16 | ||||
| 600 mg | 73.50 | 96.38 | |||||
| CL (L/h) | 450 mg | 7.86 | 6.23 | ||||
| 600 mg | 8.15 | 6.22 | |||||
| Cmax (µg/mL) | 450 mg | 12.53 | 9.80 | ||||
| 600 mg | 13.61 | 13.07 | |||||
| Oral Administration | |||||||
| AUC0–∞ (µg/mL·h) | 300 mg | 29.93 | 40.19 | ||||
| 450 mg | 42.04 | 60.20 | 65.52 | 64.67 | |||
| 600 mg | 76.95 | 81.06 | 93.40 | 86.70 | |||
| 4 mg/kg | 29.6 | 33.8 | |||||
| 6 mg/kg | 70.4 | 50.7 | |||||
| 8 mg/kg | 65.2 | 67.6 | |||||
| 10 mg/kg | 68.85 | 86.20 | 66.7 | 95.3 | 95.1 | 84.5 | |
| CL (L/h) | 300 mg | 9.98 | 7.38 | ||||
| 450 mg | 10.77 | 7.44 | 7.15 | 6.92 | |||
| 600 mg | 8.25 | 7.44 | 6.4 | 0.9 | |||
| 4 mg/kg | 0.135 | 0.113 | |||||
| 6 mg/kg | 0.085 | 0.113 | |||||
| 8 mg/kg | 0.122 | 0.113 | |||||
| 10 mg/kg | 0.145 | 0.115 | 0.14 | 0.10 | 0.105 | 0.113 | |
| Cmax (µg/mL) | 300 mg | 5.37 | 5.47 | ||||
| 450 mg | 5.88 | 9.08 | 8.30 | 11.45 | |||
| 600 mg | 9.85 | 10.30 | 13.3 | 15.6 | |||
| 4 mg/kg | 5.50 | 5.52 | |||||
| 6 mg/kg | 12.10 | 8.28 | |||||
| 8 mg/kg | 11.70 | 11.04 | |||||
| 10 mg/kg | 10.8 | 10.55 | 8.50 | 18.4 | 17.40 | 13.80 | |
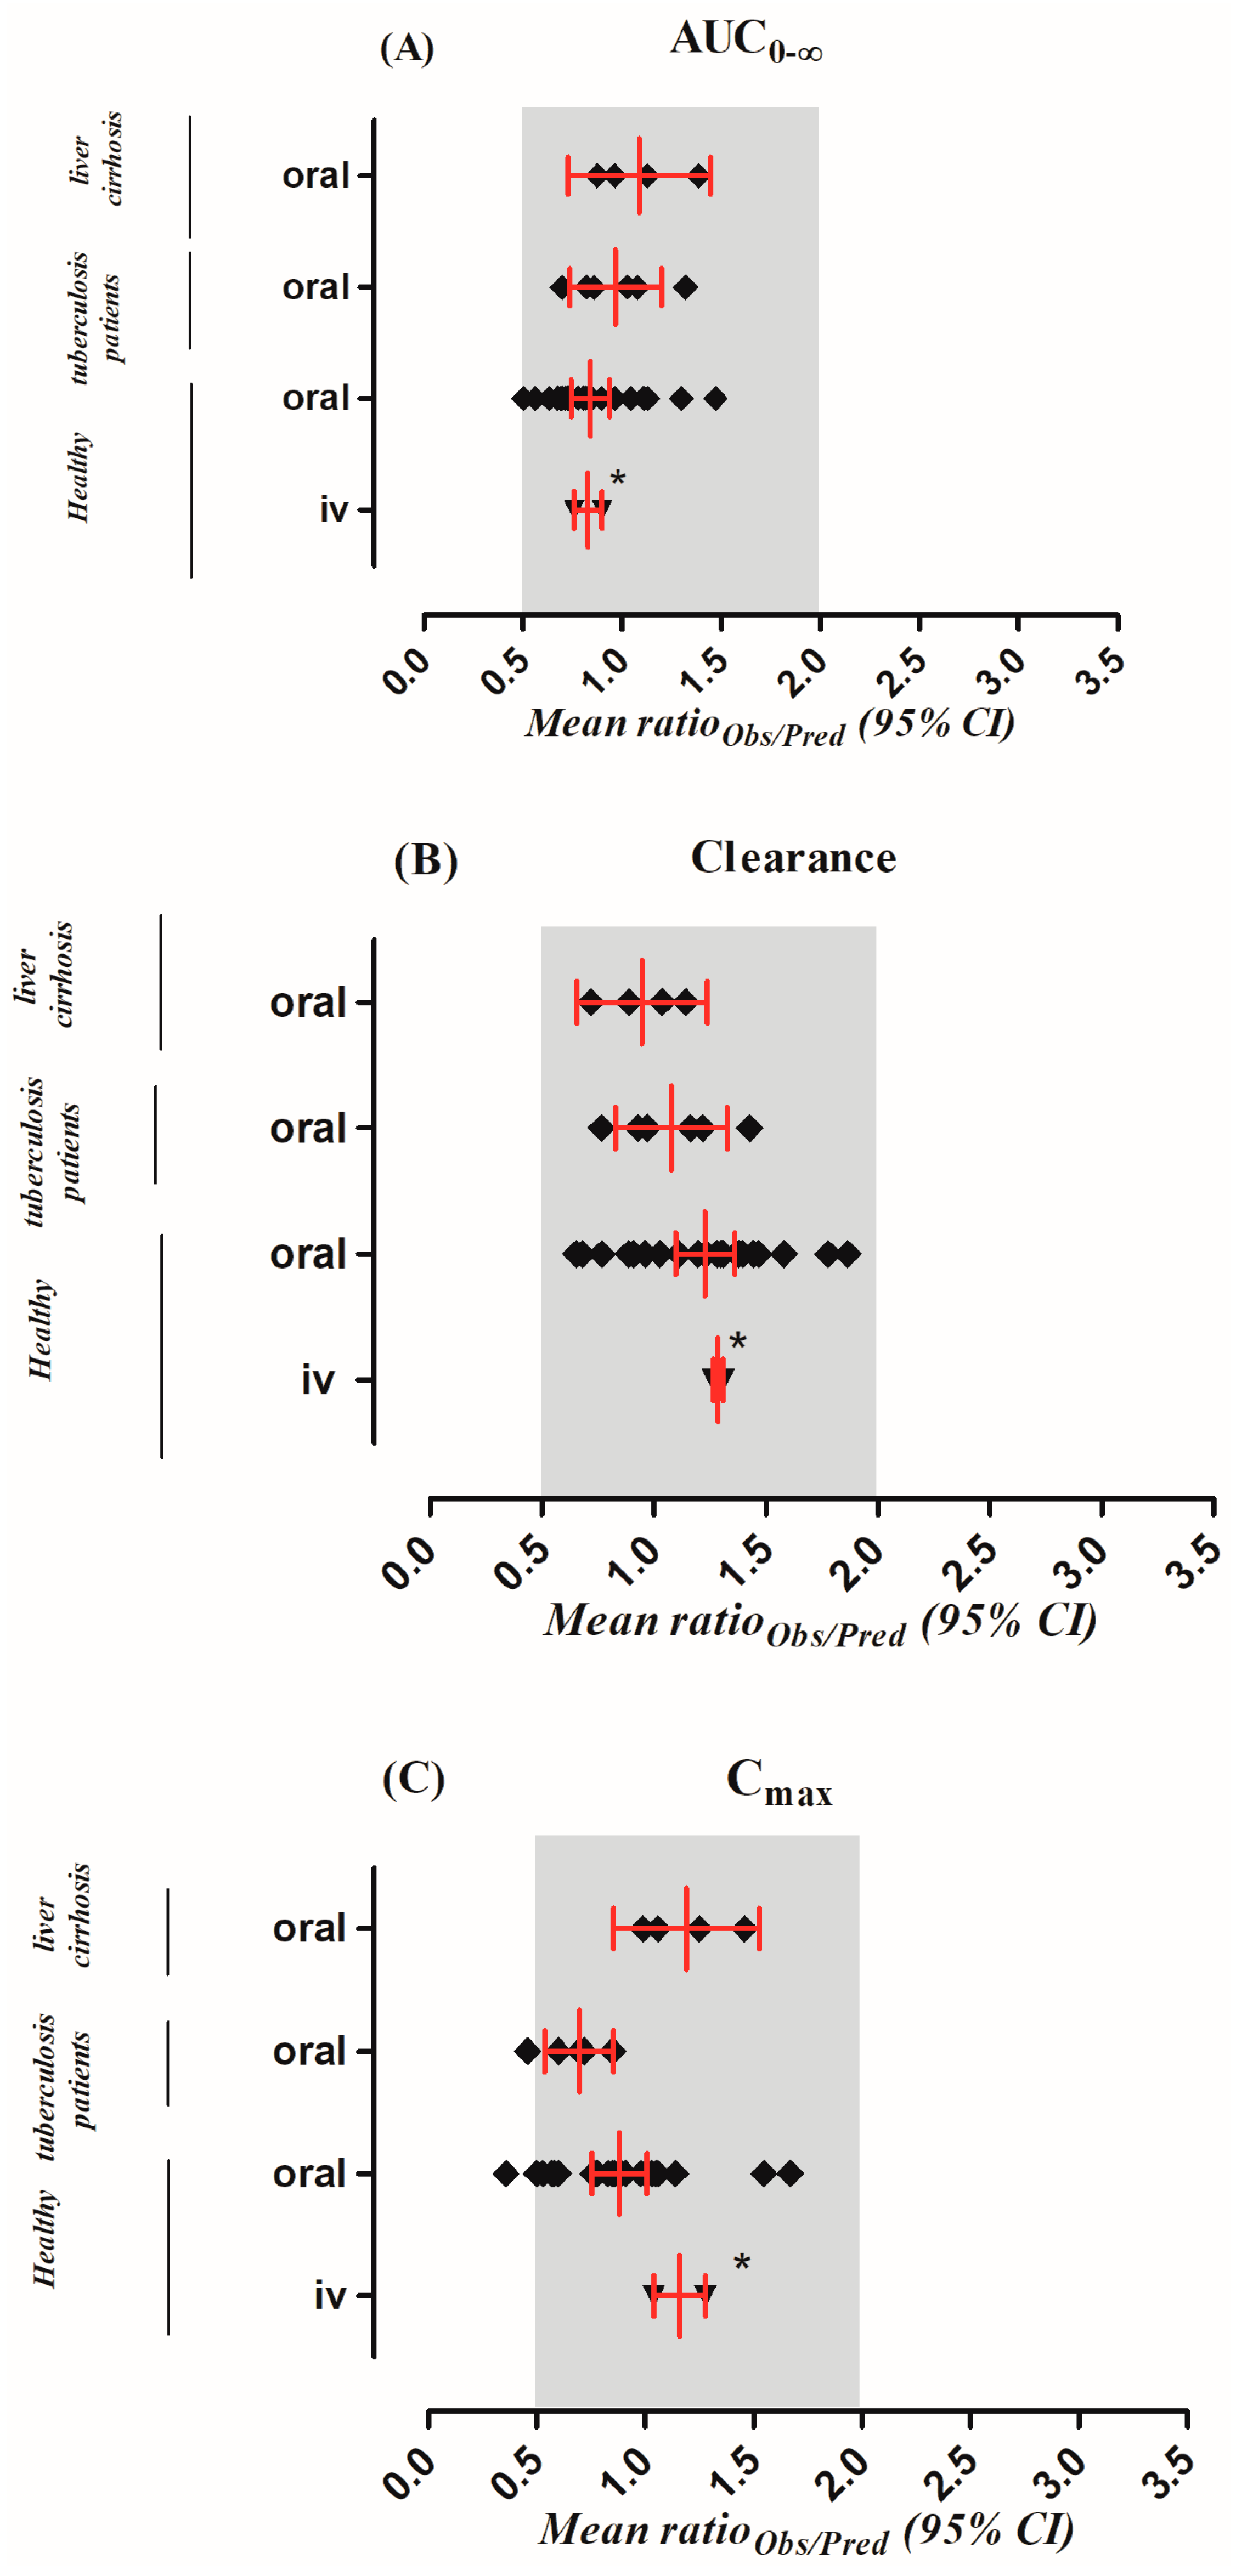
| Parameters | Mean Ratioobs/pred (Range) | AFE | RMSE |
|---|---|---|---|
| Intravenous Application in Healthy Population | |||
| AUC0–∞ (µg/mL·h) | 0.82 (0.76–0.89) | 0.78 | 19.39 |
| CL (L/h) | 1.28 (1.26–1.31) | 1.27 | 1.78 |
| Cmax (µg/mL) | 1.16 (1.04–1.27) | 1.14 | 1.96 |
| Oral Application in Healthy Population | |||
| AUC0–∞ (µg/mL·h) | 0.84 (0.51–1.47) | 0.80 | 51.80 |
| CL (L/h) | 1.22 (0.65–1.86) | 1.14 | 2.83 |
| Cmax (µg/mL) | 0.88 (0.36–1.67) | 0.79 | 5.95 |
| Oral Application in Tuberculosis Population | |||
| AUC0–∞ (µg/mL·h) | 0.96 (0.69–1.31) | 0.93 | 16.10 |
| CL (L/h) | 1.08 (0.76–1.42) | 1.02 | 1.04 |
| Cmax (µg/mL) | 0.69 (0.46–0.85) | 0.66 | 13.82 |
| Oral Application in Liver Cirrhosis Population | |||
| AUC0–∞ (µg/mL·h) | 1.09 (0.87–1.38) | 1.30 | 11.27 |
| CL (L/h) | 0.94 (0.72–1.14) | 0.98 | 0.009 |
| Cmax (µg/mL) | 1.19 (0.99–1.46) | 1.10 | 2.67 |
© 2019 by the authors. Licensee MDPI, Basel, Switzerland. This article is an open access article distributed under the terms and conditions of the Creative Commons Attribution (CC BY) license (http://creativecommons.org/licenses/by/4.0/).
Share and Cite
Rasool, M.F.; Khalid, S.; Majeed, A.; Saeed, H.; Imran, I.; Mohany, M.; Al-Rejaie, S.S.; Alqahtani, F. Development and Evaluation of Physiologically Based Pharmacokinetic Drug–Disease Models for Predicting Rifampicin Exposure in Tuberculosis and Cirrhosis Populations. Pharmaceutics 2019, 11, 578. https://doi.org/10.3390/pharmaceutics11110578
Rasool MF, Khalid S, Majeed A, Saeed H, Imran I, Mohany M, Al-Rejaie SS, Alqahtani F. Development and Evaluation of Physiologically Based Pharmacokinetic Drug–Disease Models for Predicting Rifampicin Exposure in Tuberculosis and Cirrhosis Populations. Pharmaceutics. 2019; 11(11):578. https://doi.org/10.3390/pharmaceutics11110578
Chicago/Turabian StyleRasool, Muhammad F., Sundus Khalid, Abdul Majeed, Hamid Saeed, Imran Imran, Mohamed Mohany, Salim S. Al-Rejaie, and Faleh Alqahtani. 2019. "Development and Evaluation of Physiologically Based Pharmacokinetic Drug–Disease Models for Predicting Rifampicin Exposure in Tuberculosis and Cirrhosis Populations" Pharmaceutics 11, no. 11: 578. https://doi.org/10.3390/pharmaceutics11110578