Article

Ecological Niche Modeling of Aedes and Culex Mosquitoes: A Risk Map for Chikungunya and West Nile Viruses in Zambia

by
Rachel Milomba Velu
1,2,*,
Geoffrey Kwenda
3,
Samuel Bosomprah
1,4,
Moses Ngongo Chisola
5,
Michelo Simunyandi
1,
Caroline Cleopatra Chisenga
1,
Flavien Nsoni Bumbangi
6,
Nicholus Chintu Sande
7,
Limonty Simubali
8,
Monicah Mirai Mburu
8,
John Tembo
9,
Matthew Bates
9,10,
Martin Chitolongo Simuunza
2,11,
Roma Chilengi
1,12,
Yasuko Orba
13,14,15,
Hirofumi Sawa
2,14,15,16,17 and
Edgar Simulundu
2,8,*
1
Centre for Infectious Disease Research in Zambia, Lusaka P.O. Box 34681, Zambia
2
Department of Disease Control, School of Veterinary Medicine, University of Zambia, Lusaka P.O. Box 32379, Zambia
3
Department of Biomedical Sciences, School of Health Sciences, University of Zambia, Lusaka P.O. Box 50110, Zambia
4
Department of Biostatistics, School of Public Health, University of Ghana, Accra P.O. Box LG13, Ghana
5
Department of Geography and Environmental Studies, School of Natural Sciences, University of Zambia, Lusaka P.O. Box 32379, Zambia
6
Department of Medicine and Clinical Sciences, School of Medicine, Eden University, Lusaka P.O. Box 37727, Zambia
7
National Malaria Elimination Centre, Chainama Hills Hospital Grounds, Lusaka P.O. Box 32509, Zambia
8
Macha Research Trust, Choma P.O. Box 630166, Zambia
9
HerpeZ, University Teaching Hospital, Lusaka 10101, Zambia
10
Joseph Banks Laboratories, School of Life and Environmental Sciences, University of Lincoln, Lincolnshire LN6 7TS, UK
11
Africa Centre of Excellence for Infectious Diseases of Humans and Animals, University of Zambia, Lusaka P.O. Box 32379, Zambia
12
Zambia National Public Health Institute, Ministry of Health, Lusaka P.O. Box 51925, Zambia
13
Division of Molecular Pathobiology, International Institute for Zoonosis Control, Hokkaido University, N 20 W10, Kita-Ku, Sapporo 001-0020, Japan
14
International Collaboration Unit, International Institute for Zoonosis Control, Hokkaido University, Hokkaido 060-0808, Japan
15
One Health Research Center, Hokkaido University, Sapporo 001-0020, Japan
16
Institute for Vaccine Research and Development, Hokkaido University, Sapporo 001-0021, Japan
17
International Collaboration Unit, Global Virus Network, Baltimore, MD 21201, USA
*
Authors to whom correspondence should be addressed.
Viruses 2023, 15(9), 1900; https://doi.org/10.3390/v15091900
Submission received: 31 July 2023 / Revised: 25 August 2023 / Accepted: 26 August 2023 / Published: 8 September 2023
(This article belongs to the Special Issue Emerging Vector Borne Viruses in Africa)

Abstract

:
The circulation of both West Nile Virus (WNV) and Chikungunya Virus (CHIKV) in humans and animals, coupled with a favorable tropical climate for mosquito proliferation in Zambia, call for the need for a better understanding of the ecological and epidemiological factors that govern their transmission dynamics in this region. This study aimed to examine the contribution of climatic variables to the distribution of Culex and Aedes mosquito species, which are potential vectors of CHIKV, WNV, and other arboviruses of public-health concern. Mosquitoes collected from Lusaka as well as from the Central and Southern provinces of Zambia were sorted by species within the Culex and Aedes genera, both of which have the potential to transmit viruses. The MaxEnt software was utilized to predict areas at risk of WNV and CHIKV based on the occurrence data on mosquitoes and environmental covariates. The model predictions show three distinct spatial hotspots, ranging from the high-probability regions to the medium- and low-probability regions. Regions along Lake Kariba, the Kafue River, and the Luangwa Rivers, as well as along the Mumbwa, Chibombo, Kapiri Mposhi, and Mpika districts were predicted to be suitable habitats for both species. The rainfall and temperature extremes were the most contributing variables in the predictive models.

1. Introduction

Emerging and re-emerging arboviral infectious diseases, such as Chikungunya Virus (CHIKV) and West Nile Virus (WNV), are a significant threat to global-health security, particularly in sub-Saharan Africa where large epidemics have been observed [1,2]. CHIKV is an alphavirus transmitted by Aedes aegypti and Aedes albopictus mosquitoes [3,4]. It has caused several outbreaks globally and its symptomatology is characterized by an acute weakening syndrome, often accompanied by fever, polyarthralgia, and rash [5,6]. CHIKV is endemic in various African countries, including Uganda, the Democratic Republic of Congo, Zimbabwe, Senegal, Nigeria, South Africa, Tanzania, and Kenya [3]. On the other hand, WNV belongs to the Flavivirus genus in the Flaviviridae family and is a member of the Japanese encephalitis (JE) virus serocomplex transmitted by Culex mosquitoes [7,8]. WNV infects humans, equines, domestic animals, and wild birds [7]. The transmission of WNV occurs through an enzootic cycle, where birds serve as vertebrate hosts and mosquitoes act as the primary vectors [9]. Most WNV infections in humans are asymptomatic, but in some cases, flu-like symptoms, fever, myalgia, and severe neurological complications, such as meningoencephalitis and flaccid paralysis, may occur, leading to death [7,10].
The occurrence of mosquito-borne viruses, including CHIKV and WNV in Zambia, has been investigated mainly through human serological studies, which found the circulation of CHIKV in the Central province at a prevalence of 36.9 percent and WNV in the Northwestern and Western provinces at a prevalence of 10.3 percent [11,12,13,14,15]. Furthermore, WNV was detected in Culex mosquitoes in the Western province and in farmed crocodiles in the Southern province [16,17]. Despite evidence of the occurrence of CHIKV and WNV in the country, there is no routine surveillance of these mosquito-borne viruses. Although Zambia has not reported any epidemics of WNV or CHIKV in the last 3 decades, the favorable tropical climate for mosquito breeding and the occurrence of outbreaks in neighboring countries [5,18,19] warrants an understanding of the ecological factors influencing the dynamics of arboviral transmission and their natural maintenance cycles in the environment. To achieve this understanding, Ecological Niche Modeling (ENM), also known as Species Distribution Modeling (SDM), has been employed worldwide to study arboviruses such as CHIKV, Yellow Fever Virus (YFV), and WNV, and their vectors [20,21,22,23,24].
This study aimed to examine the contribution of climatic variables to the distribution of Culex and Aedes mosquito species, which are potential vectors of WNV and CHIKV, respectively. This will help in implementing appropriate and targeted surveillance strategies and epidemic preparedness for the country.

2. Materials and Methods
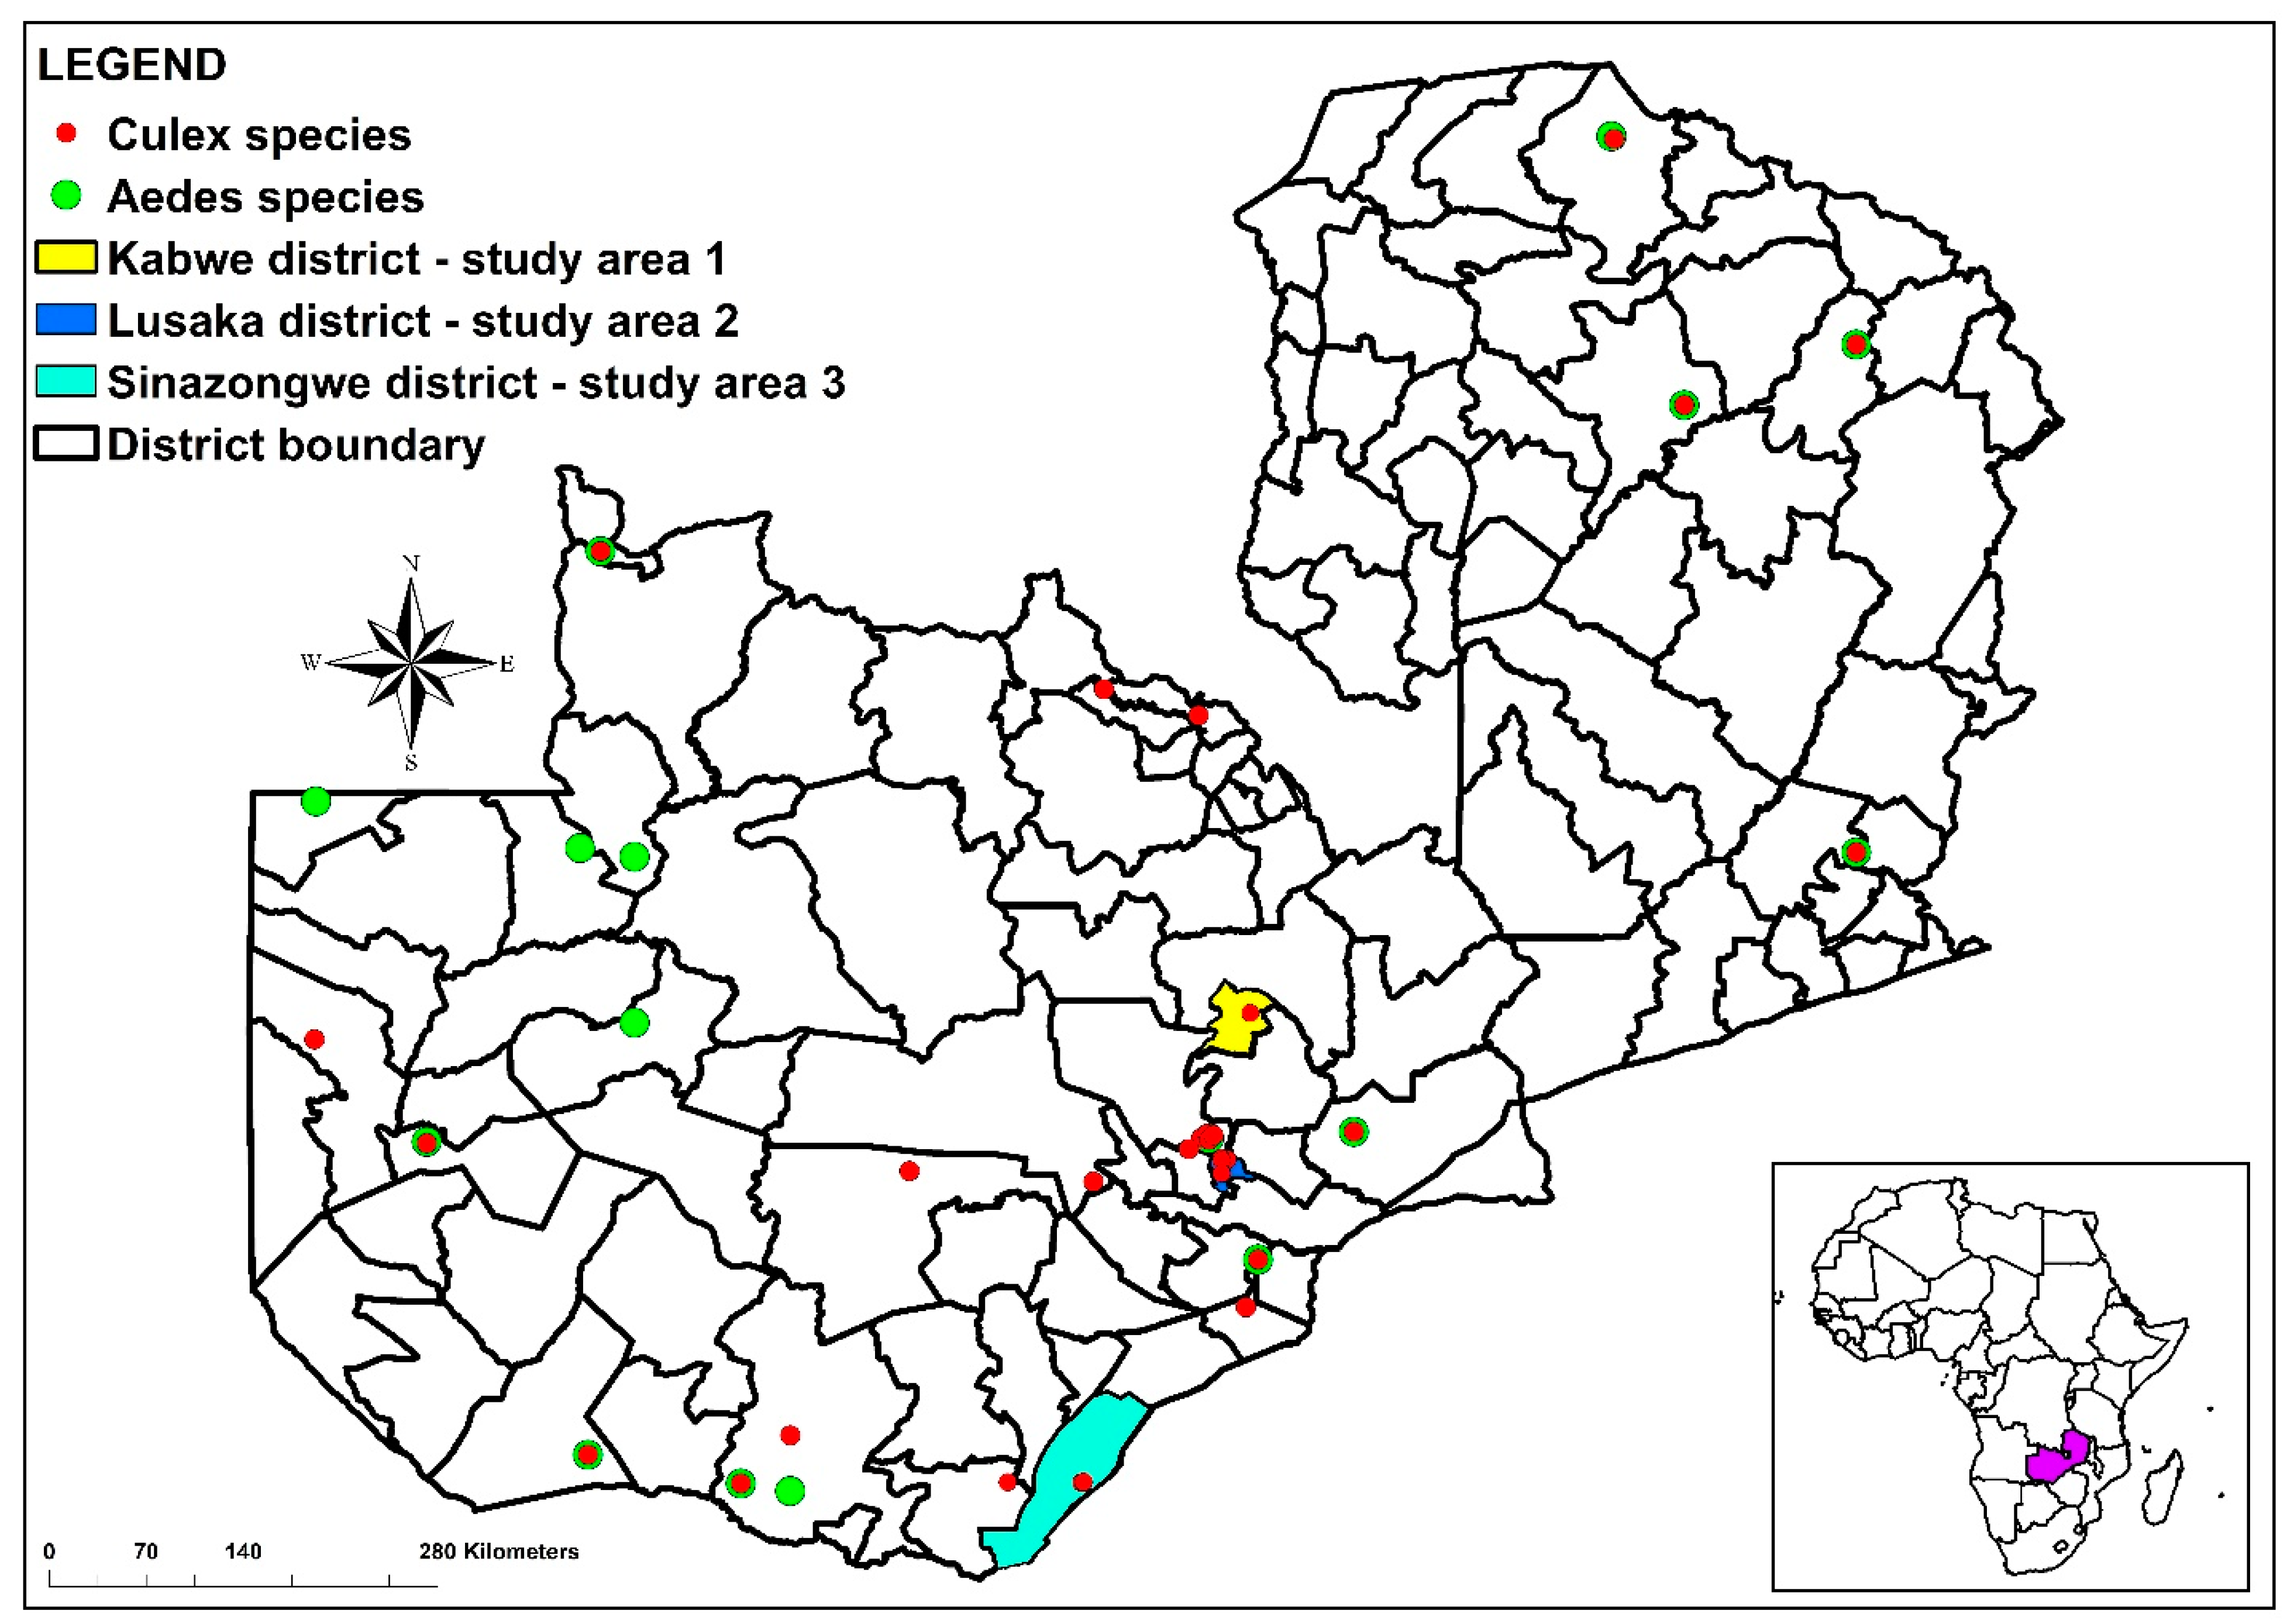
2.1. Study Areas

Zambia, located in the southern part of Africa between latitudes 8° and 18° south and longitudes 22° and 34° east, covers a total area of 752, 618 square kilometers, of which 9220 km2 are covered by water. The country experiences three distinct seasons: the cool-dry season from May to August, the hot-dry season from August to November, and the hot-wet season from November to April [25]. Zambia is divided into three agroecological zones, including Region I, which is the driest zone, with a mean annual rainfall of less than 800 mm, and this zone covers the Lusaka Province, the Southern Province, and a part of the Eastern and Western provinces. Region II receives between 800 and 1000 mm of rain and Region III has a mean annual rainfall of 1000 to 1500 mm [26]. Zone II covers the Western and Central provinces, as well as a part of the Eastern and Southern provinces. The study sites included Lusaka, Sinazongwe, and the Kapiri districts in Lusaka and in the Southern and Central provinces, respectively, which are part of Regions I and II. These sites were chosen based on previous reports of mosquito-borne viral activity in the country [27].

2.2. Mosquito Occurrence Data

Adult mosquitoes (n = 834) were trapped within the Lusaka, Kapiri, and Sinazongwe districts in February and May 2021 using the CO2-baited CDC light traps (John W. Hock Co., Gainesville, FL, USA). The traps were set indoors and outdoors from the afternoon (15:00 h) to the next morning (09:00 h). Outdoor traps were placed closer to potential mosquito-breeding habitats, whereas indoor traps were placed in bedrooms closer to the bed during the sleeping hours. The sampling was conducted for 3 nights at each site. Captured mosquitoes were frozen at −20 °C and sorted out per sex and species on ice packs using the morphological referencing keys of African mosquitoes [28]. After sorting, a total of 12 mosquito-field occurrence points were recorded after removing spatially autocorrelated records. An additional 37 occurrence points of both Culex and Aedes were obtained from published literature [16,29,30] (Tables S1 and S2).

2.3. Environmental Covariates

Nineteen (19) suitable environmental covariates and one altitude variable were retrieved from WorldClim [31] at a spatial resolution of 10 km. The environmental covariates incorporated in the models included temperature and its extremes: annual mean temperature, mean diurnal range, temperature seasonality, maximum temperature of the warmest month, minimum temperature of the coldest month, temperature annual range, mean temperature of the wettest quarter, mean temperature of the driest quarter, mean temperature of the warmest quarter, and mean temperature of the coldest quarter. Others were moisture variables (annual precipitation, precipitation of the wettest month, precipitation of the driest month, precipitation seasonality, precipitation of the wettest quarter, precipitation of the driest quarter, precipitation of the warmest quarter, and precipitation of the coldest quarter). We used ENMTOOLs to test for multicollinearity between the predictor variables [32]. We ran a pairwise Pearson correlation and only variables with a correlation of less than (±0.75) were retained in the final prediction models (Table S3). After accounting for multicollinearity, only nine variables comprising three moisture variables, five temperature variables, and one altitude variable were retained (Table 1).

Modeling Procedure

For the ecological modeling, we used MaxEnt version 3.3 k, with the settings determined by the ENMEval R package in RStudio. Based on the lowest delta AIC model for the Culex species, a linear features model with a regularization multiplier of 1 and 10,000 background points was needed. For the Aedes species, the settings were the same, but with a regularization multiplier of 2. These model settings were then used to run the suitability models in MaxEnt. Seventy-five percent of the occurrence data was randomly set aside for training the model and 25% for testing or validating the accuracy of the model. The independent variables input into MaxEnt were the spatial layers of the 9 environmental variables in ASCII-file format. The dependent variable was the species’ (Aedes and Culex) presence-point coordinates in a CSV-file format. The predictive performance of the model was assessed using the Receiver Operating Curve (ROC) [20]. The MaxEnt outputs were imported into the QGIS 2.18.3 mapping software to develop the final maps. The contribution of each environmental variable to the models was tested using the Jackknife method built-in to MaxEnt. The Jackknife analysis provides three types of model outputs: (1) a full model created with all variables; (2) several models created with all variables, but with one variable excluded at a time; and (3) several models created with one variable at a time. Variables with high contribution to the model outputs were those showing the biggest Area Under the Curve (AUC) when included separately and the smallest AUC when removed [33]. The distribution maps were generated in MaxEnt from 50 bootstrap replicates.

3. Results

3.1. Distribution of Mosquitoes across the Sampling Areas

A total of 834 adult mosquitoes belonging to three genera were captured in three of the ten provinces of Zambia. Culex (n = 652) mosquitoes were the most predominant across the three provinces. A total of 87 Aedes were captured across the three provinces. The other genus was Anopheles (not included in this study as they are not potential vectors of both viruses under study). Figure 1 illustrates the distribution of the occurrence data in the study areas as well as from the literature.

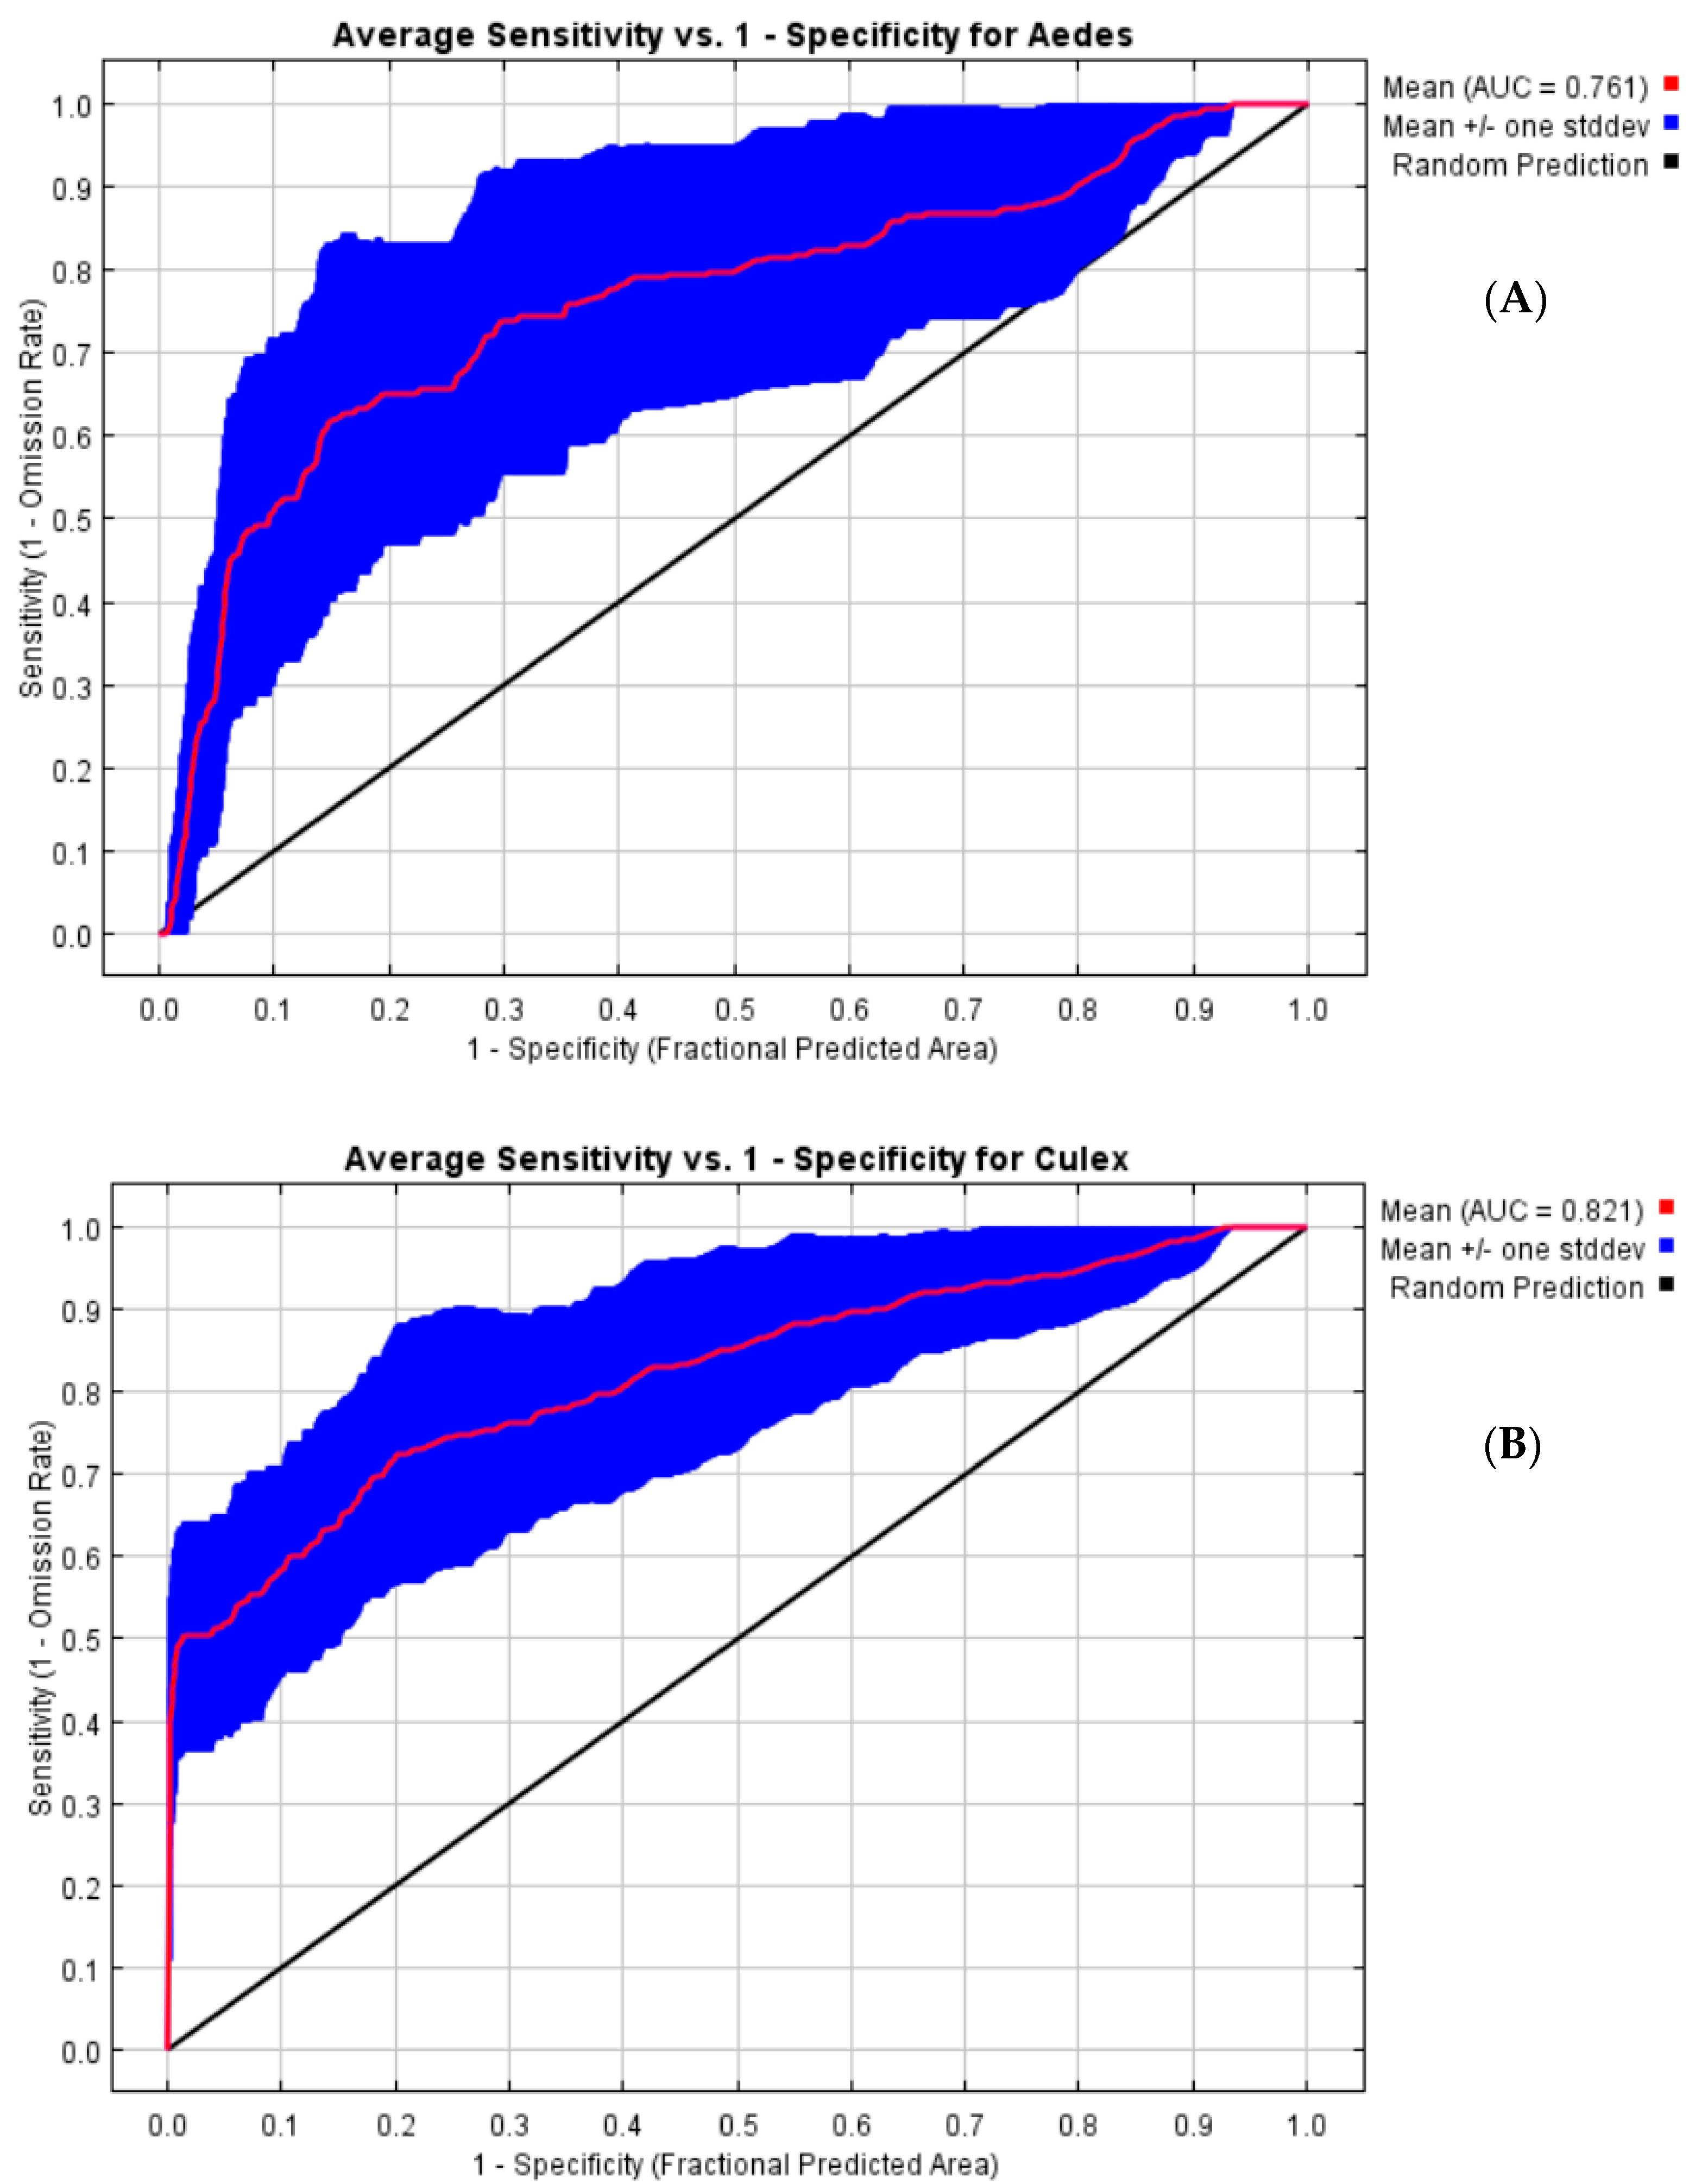
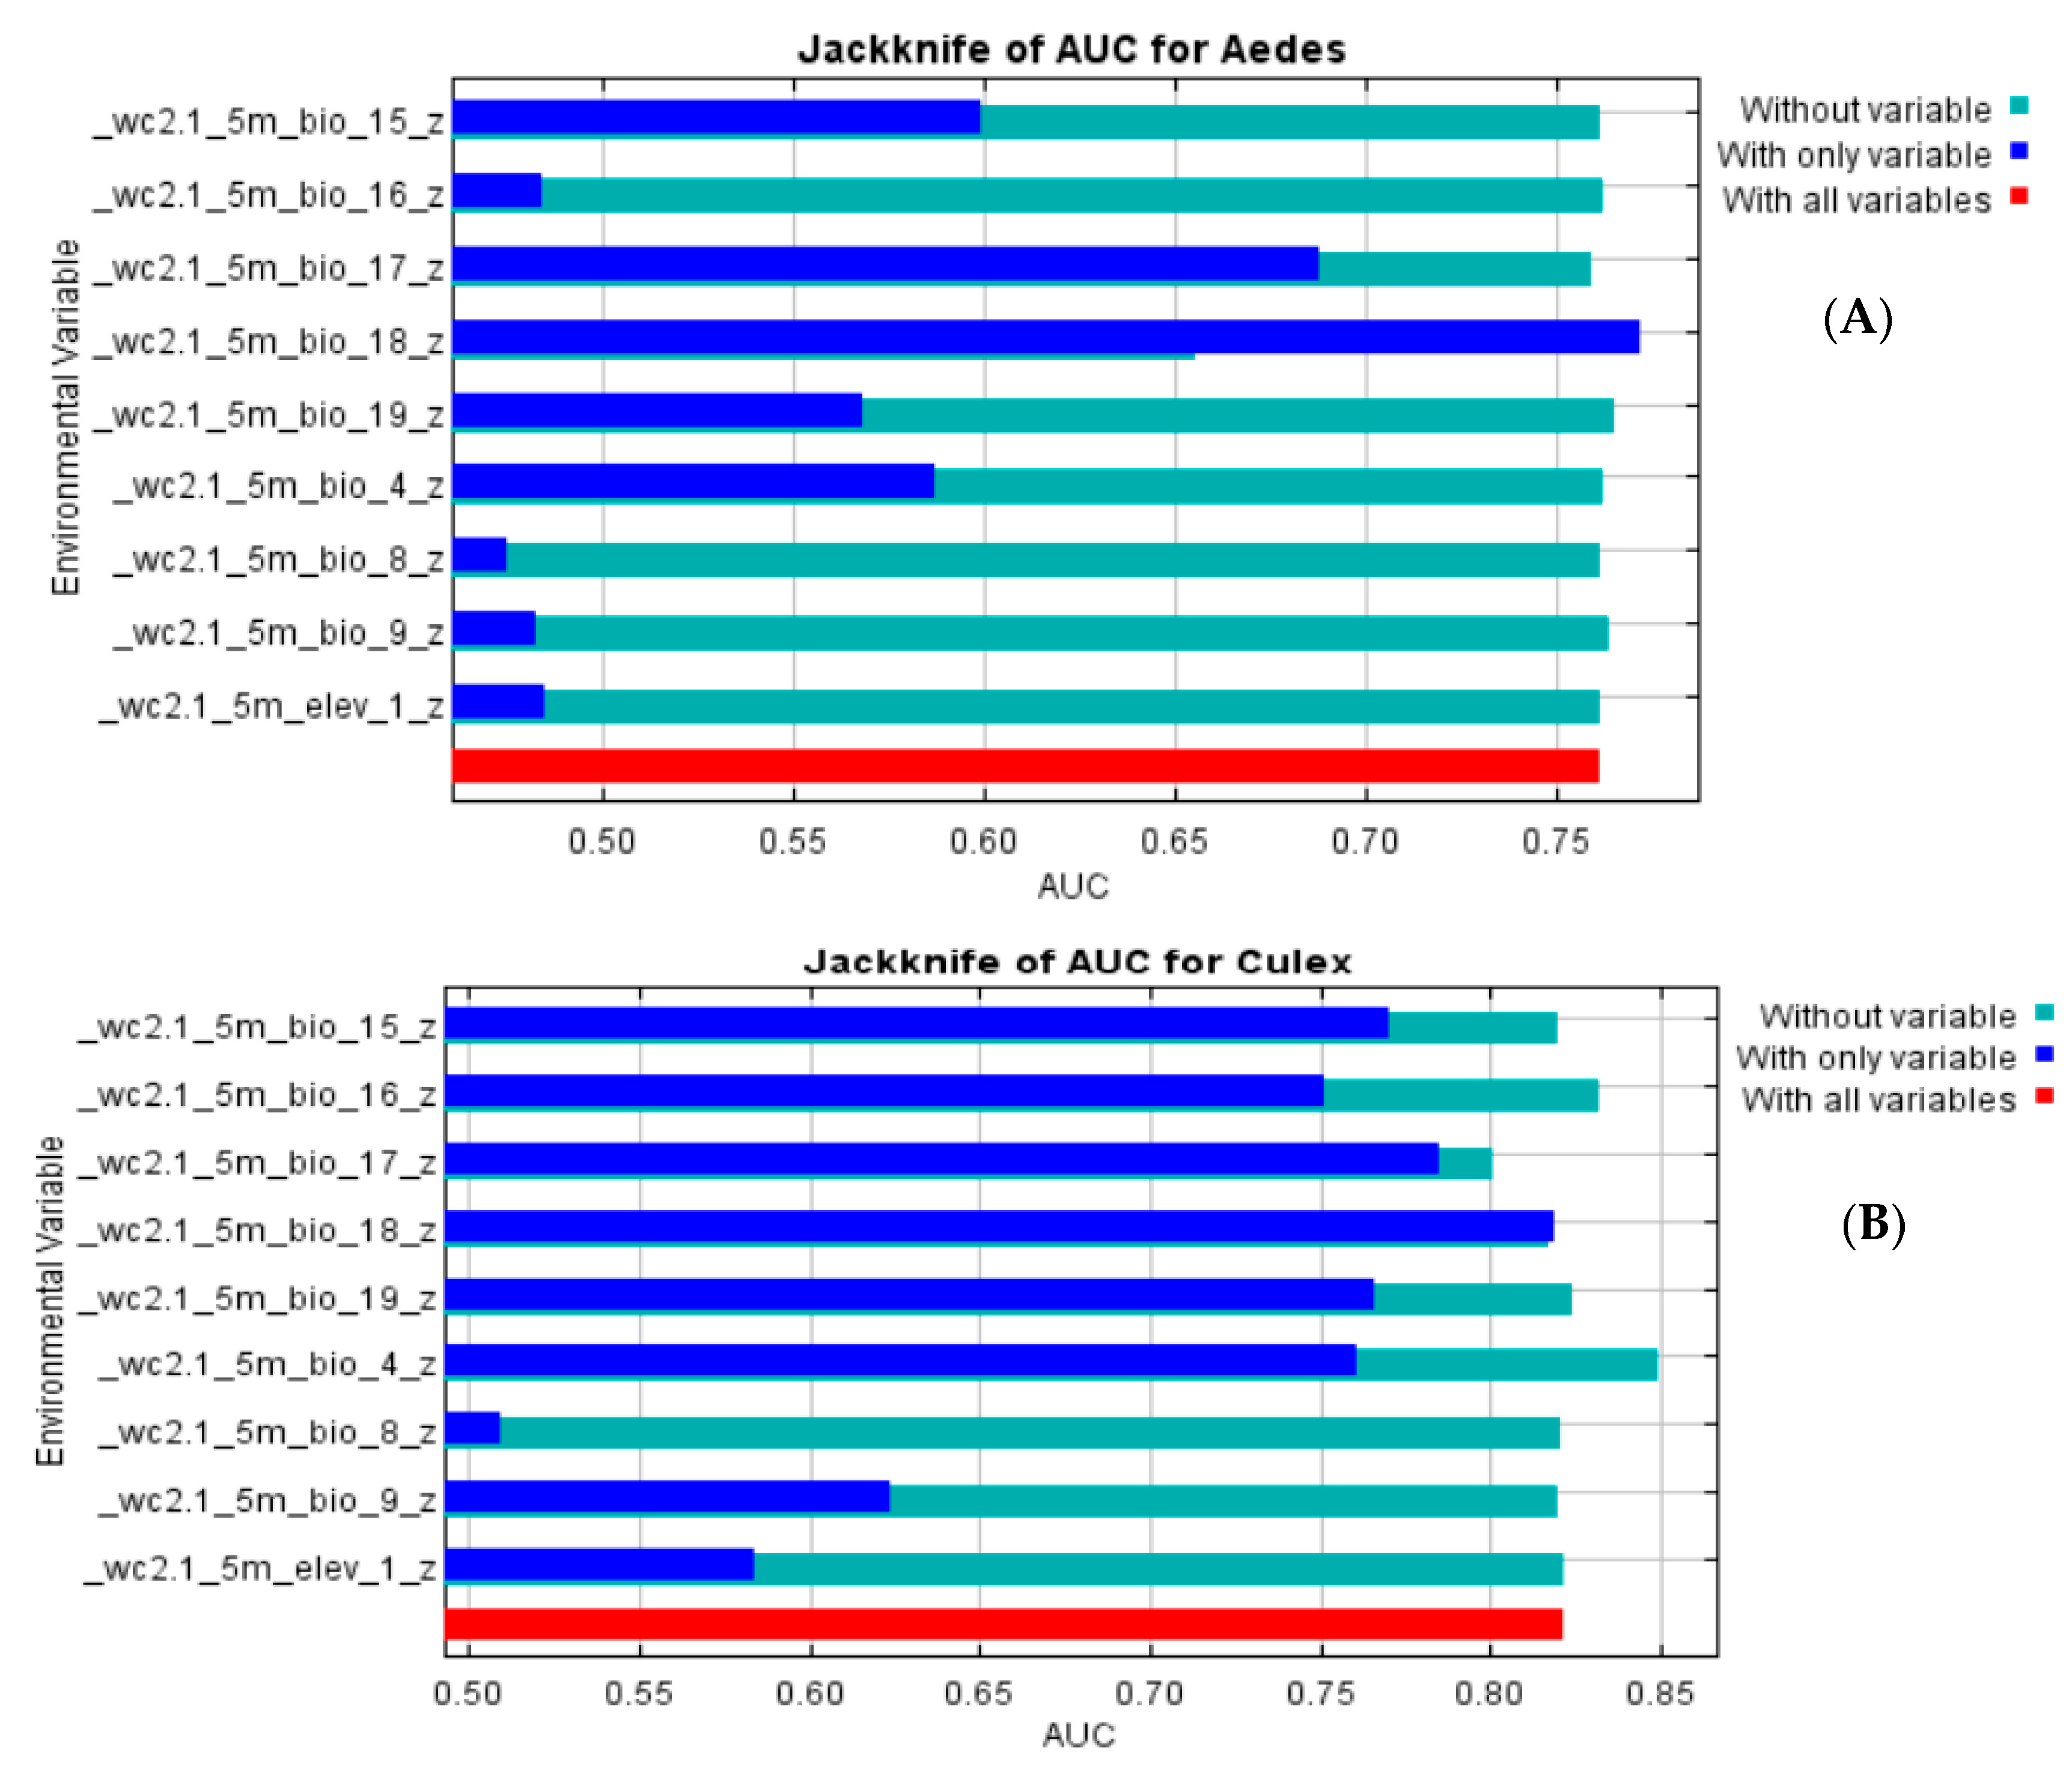
3.2. Model Performance

The MaxEnt model outputs provided AUC values of 0.761 and 0.821 for both Aedes and Culex, respectively, indicating an acceptable model performance (Figure 2). The test revealed a statistically significant difference between the AUC from the model prediction and the AUC at a randomness set at 0.5 [20].

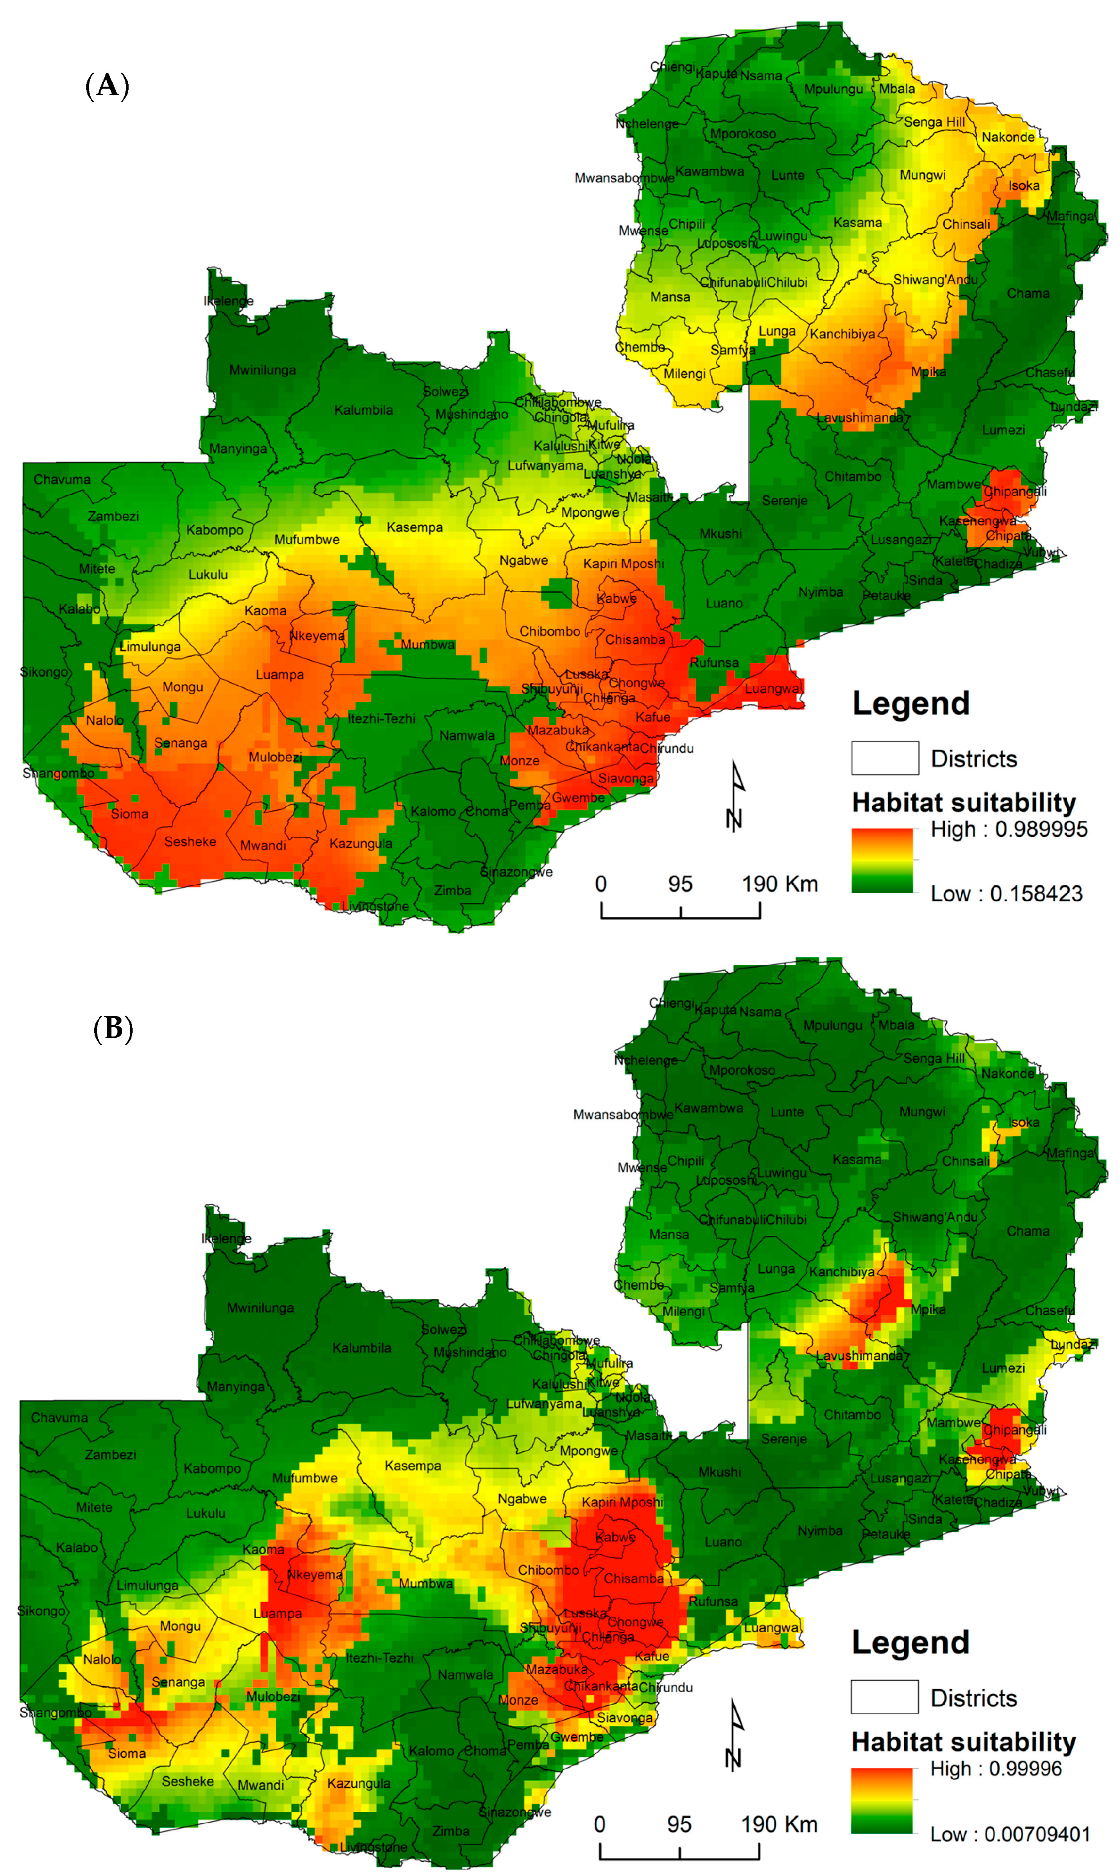
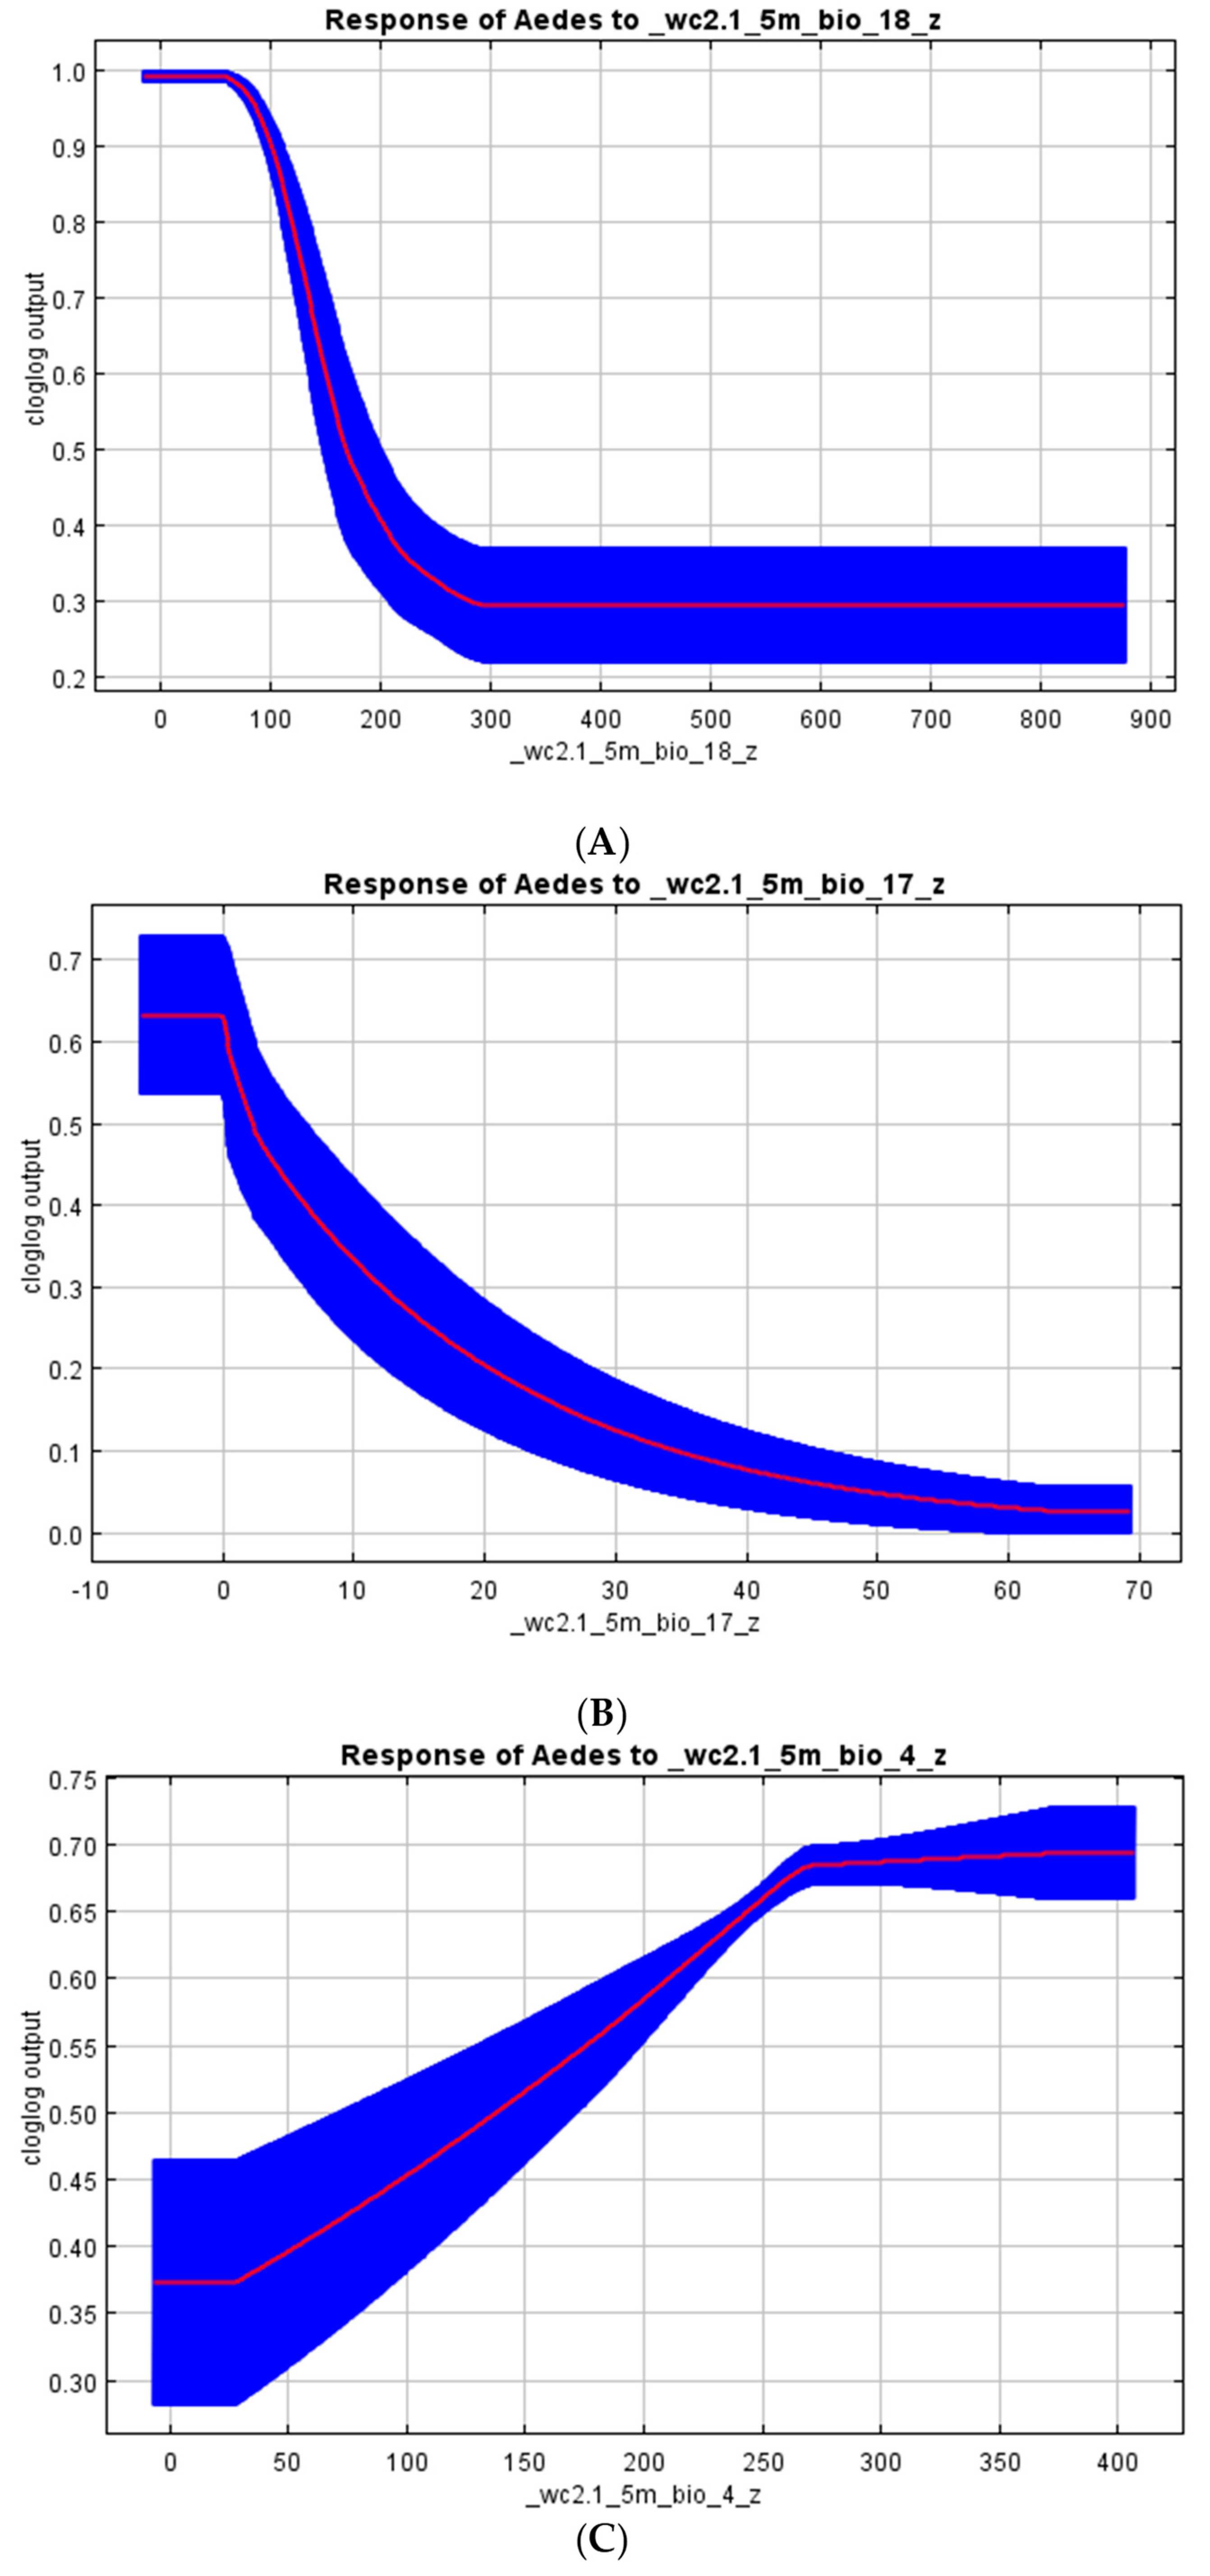
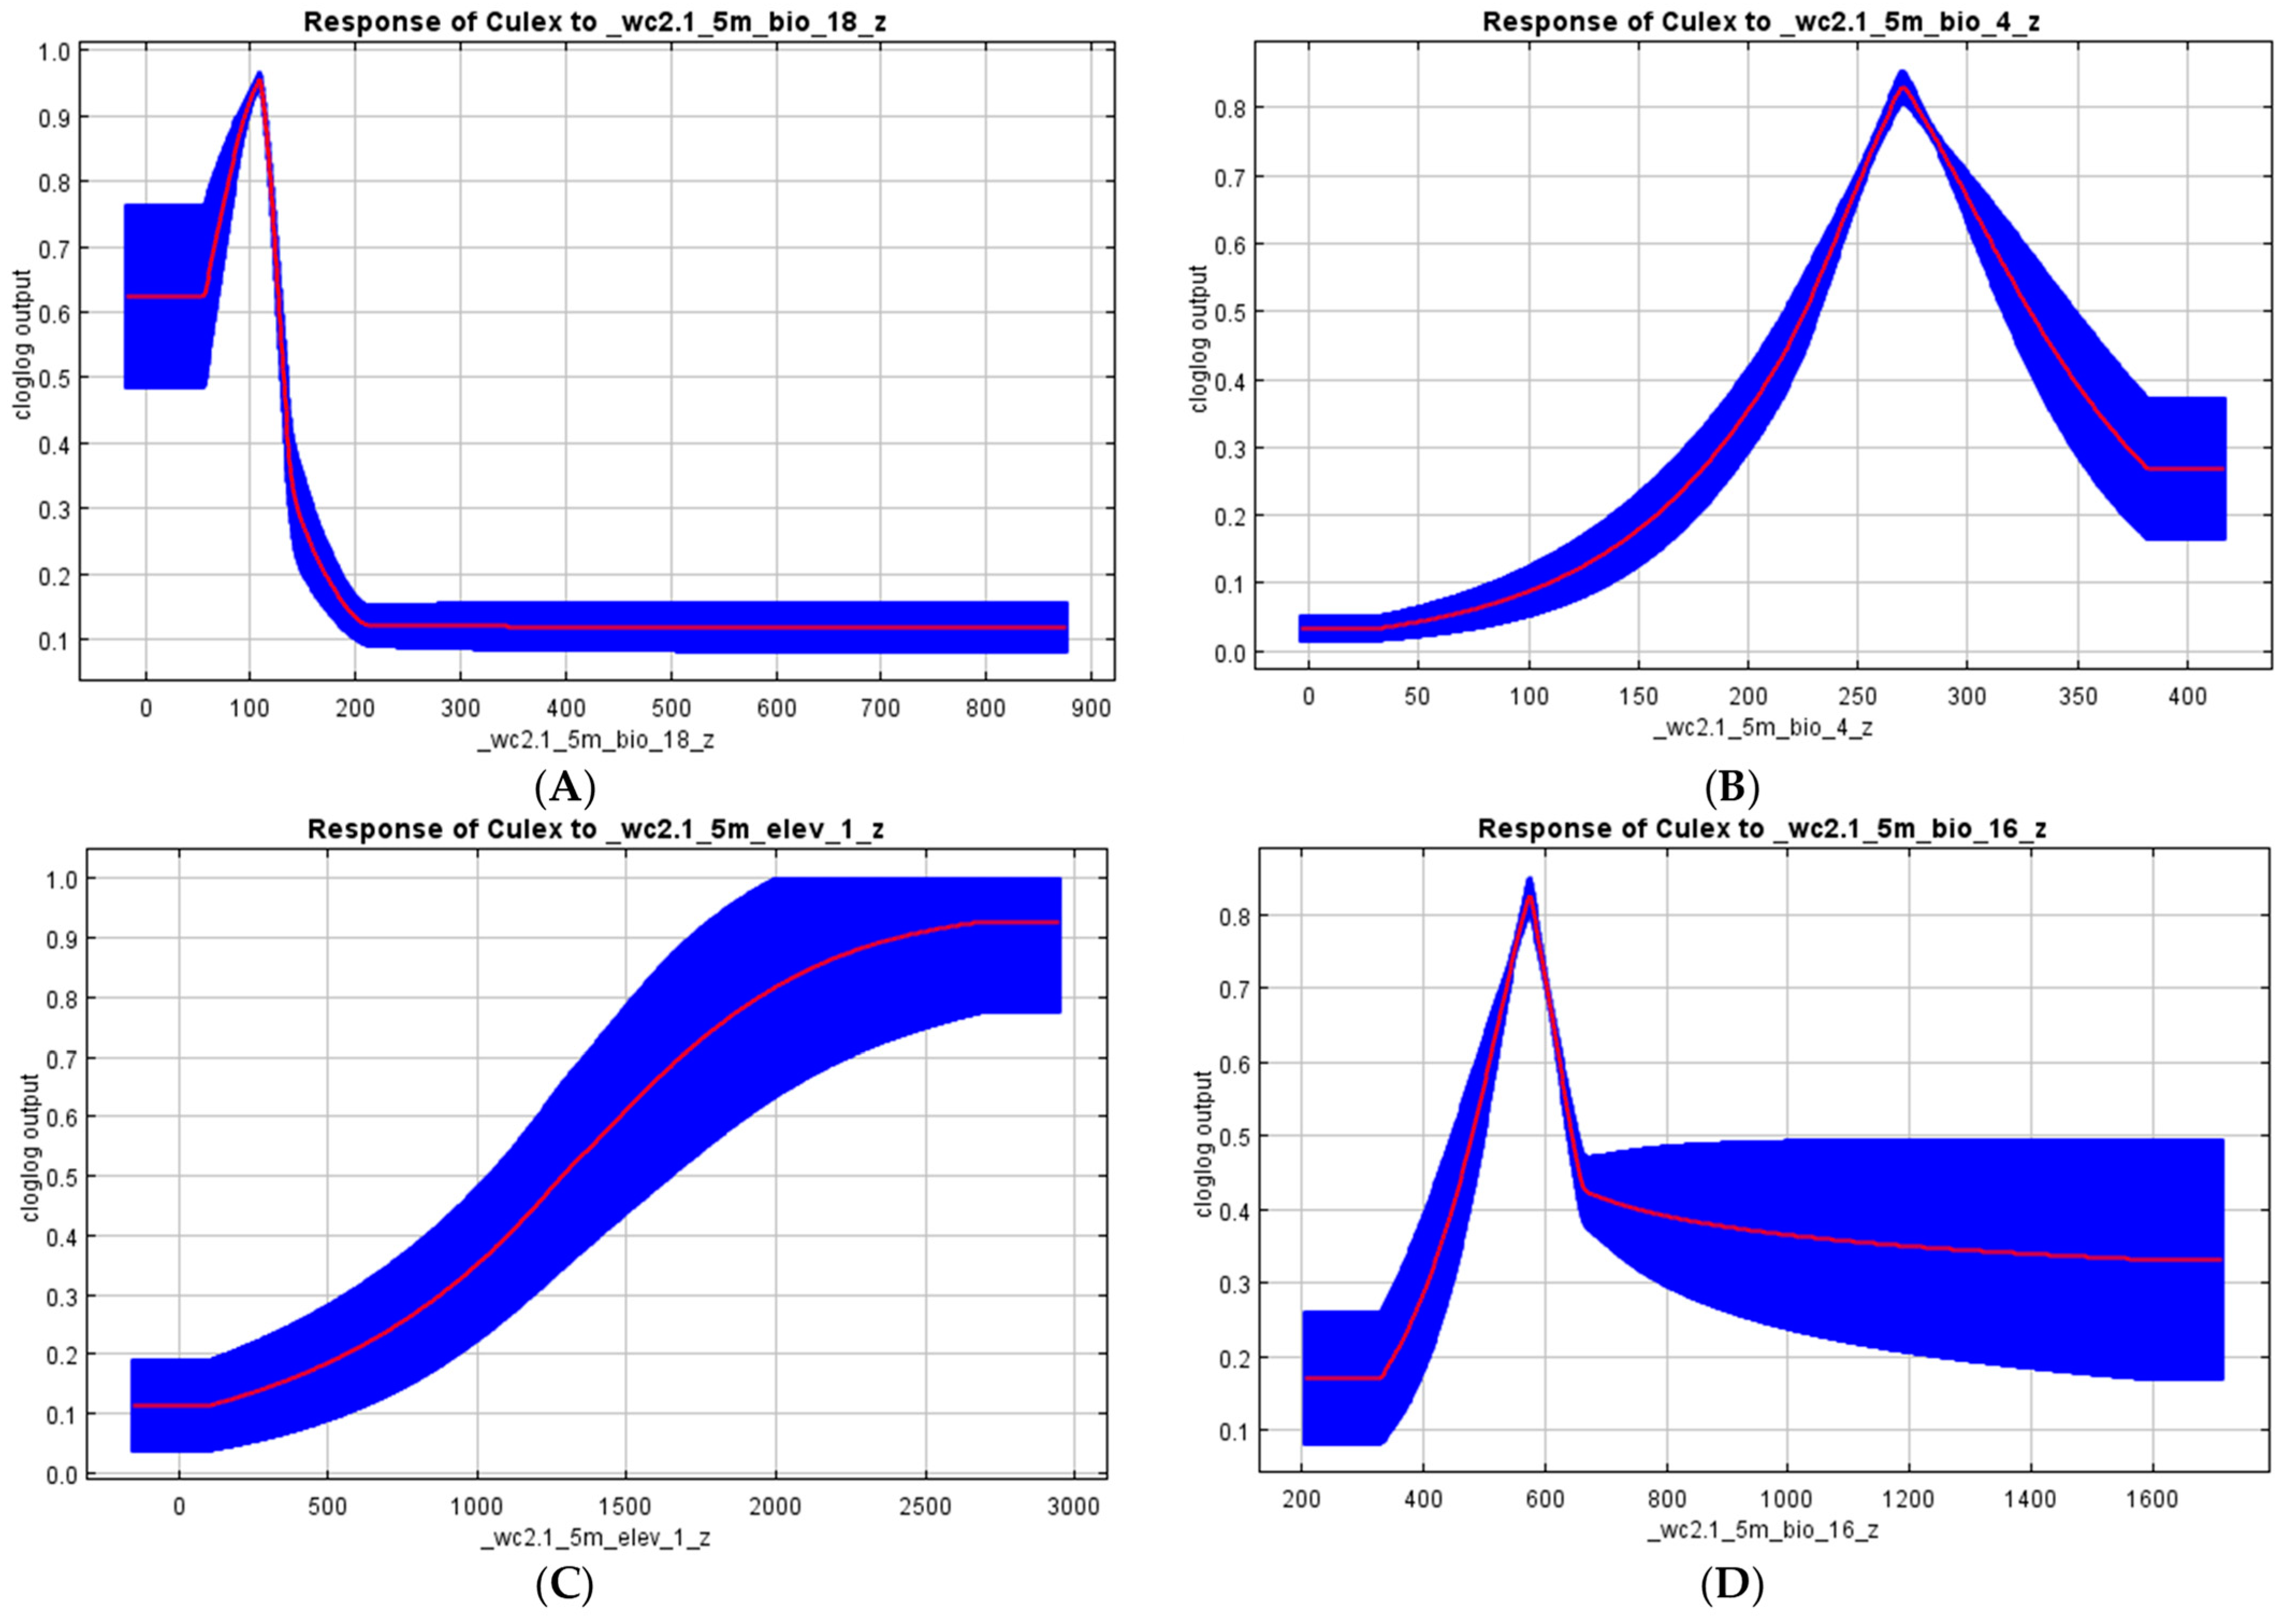
3.3. Vectors’ Habitat Suitability

Overall, the MaxEnt model outputs predicted suitable vector habitats with high accuracy rates. We found that the precipitation seasonality (BIO18; 85%), precipitation of the driest quarter (BIO17; 14.3%), precipitation of the coldest quarter (BIO19; 0.4%), and temperature seasonality (BIO4; 0.2%) had the highest contributions to the Aedes species model distribution (Table 2 and Figure 3A). However, in the Culex model outputs, the precipitation of the warmest quarter (BIO18; 41.2%), precipitation of the driest quarter (BIO17; 37.7%), temperature seasonality (BIO4; 11.7%), precipitation of the coldest quarter (BIO19; 3.7%), precipitation of the wettest quarter (BIO16; 3.0%), elevation (1.2%), and precipitation seasonality (BIO15; 1.0%) significantly influenced the Culex species’ suitability habitat (Table 2 and Figure 3B).
The Relative Probability of Presence (RPP) ranged from very suitable areas with a probability value of closer to 0.98% (Figure 4A). The findings show that most parts of Zambia are suitable for Aedes breeding but most notably in the following districts: Kapiri-Mposhi, Kabwe, Chisamba, and Chibombo (in the Central province); Mazabuka, Chikankata, Chirundu, Siavonga, Gwembe, Monze, and Kazungula (in the Southern province); Lusaka, Chongwe, Chilanga, Kafue, and Luangwa (in the Lusaka province); Sesheke, Mwandi, Sioma, and Luampa (in the Western province); Kanchibiya (in the Muchinga province); Chipanguli (in the Eastern province); and Chinsali (in the Northern province). Moderately suitable regions cover most districts of the Northwestern and Northern provinces (Figure 4A).
High RPP for the Culex species was predicted in most districts in the following provinces: Central (Kapiri-Mposhi, Kabwe, and Chibombo), Lusaka (Lusaka, Chongwe, and Chilanga), Southern (Mazabuka and Chikankata), Eastern (Chipanguli and Kasenengwa), Muchinga (Mpika), and Western (Kaoma, Nkeyema, Luampa, and Sioma). Moderately suitable regions cover most parts and districts of the Northwestern, Western, and Copperbelt provinces (Figure 4B). The RPP of Culex was mainly influenced by the precipitation of the warmest quarter at 41.2%, precipitation of the driest quarter at 37.7%, temperature seasonality at 11.7%, and precipitation of the coldest quarter at 3.7% (Table 2).
The response curves of the variables that contributed the most to the Aedes and Culex species’ habitat suitability are shown in Figure 5 and Figure 6. Precipitation of less than 100 mm during the warmest quarter of the year (Figure 5A) increased the probability of Aedes species’ occurrence to closer to 99%; however, this probability quickly dropped as the precipitation increased to above 300 mm, reaching a probability of 30%. This was expected as high-intensity rainfall would probably destroy both larvae and, in some instances, adult mosquitoes. The probability of Aedes occurrence is at a maximum with the first rainfall during the driest quarter of the year (Figure 5B) and it decreases with increasing rainfall amounts. Furthermore, it varies with the change in temperature over the course of the year. Increased temperature variations were related to increasing likelihoods of Aedes species’ occurrence. The optimal occurrence would take place when the temperature variations from the mean are above 25 °C (Figure 5C).
On the other hand, the model outputs for the Culex species showed that their probability of occurrence is optimal at minimum rainfalls (110 mm) during the warmest quarter of the year and drops until the flattening of the curve when precipitation is above 200 mm (Figure 6A). Furthermore, the suitability of the presence of the Culex species increases when the temperature is closer to 27 °C, reaching a probability of 80% and dropping very quickly to closer to 20% with a temperature above 27 °C (Figure 6B). Furthermore, elevation greatly affected the distribution of the Culex species as the probability of finding the Culex species increases with an altitude above 2000 m (Figure 6C). Precipitation of the wettest quarter (BIO 16) is an index that provides the total precipitation during the wettest three months of the year (Figure 6D). The probability of occurrence of Culex mosquitoes increases with the first rainfalls during this quarter, reaches a peak at closer to 590 mm of precipitation with an 82% probability, and soon reduces at 42% for an increased amount of rainfall (above 620 mm of precipitation; Figure 6D).

4. Discussion

In this study, occurrence records of the Aedes and Culex species from different provinces of Zambia were used as presence-only data to study their environmental suitability. The knowledge gained on their current distribution is of great value in identifying the areas at risk of CHIKV, WNV, and other arboviruses transmitted by both mosquito species for targeted surveillance.
Our study revealed the occurrence of both the Aedes and Culex species in the sampling areas during the study period, with the Culex species appearing in larger numbers. The low number of the Aedes species in the sampling areas could be attributed to the collection time as traps were set in the afternoon around 15:00 (h) whilst Aedes mosquitos are day-time feeders. Furthermore, for both species, the short duration of the sampling could have, as well, played a role in their abundance. Nonetheless, their presence, even in small populations, calls for monitoring and an investigation of the potential risk of arboviral disease transmission.
Overall, the model predictions for the distribution of the Culex and Aedes mosquito species showed three distinct spatial hotspots ranging from the regions of high to moderate and low probability of occurrence. Regions of high RPP for both vectors mostly corresponded to areas that reflect specific environmental conditions for each species, such as rainfall patterns. The important environmental predictors for the final environmental suitability models were mainly related to precipitation and temperature extremes.
Even though the training AUC values for both the Aedes and Culex species could be considered low (0.76 and 0.82, respectively) compared to other studies that found AUC values above 90% for the same species [21,22], our predictions remain above the randomness’ prediction value set at 50% [20]. The difference in terms of AUC values might be due to the number of occurrence points used in the models. Our results, however, agree with those from various authors [23,24,34] in terms of AUC values.
The association between mosquitoes and precipitation is not surprising as the life cycle of mosquitoes at larval and pupae stages requires water [35]. These results are consistent with the findings of various authors who explored the impact of precipitation variability on mosquito development and abundance [30,35]. On the other hand, a minimum amount of precipitation during the warmest quarter, in the case of Zambia, corresponding to mid-August to mid-November, would have a positive impact on the distribution of both mosquito species. This could be explained by the rise in temperature observed in that quarter of the year. However, the response of the mosquitoes to the variation of temperature is species-specific; some species survive in higher temperatures (e.g., Culex quinquefasciatus), whereas others (e.g., Culex pipiens) may be more sensitive [36]. Furthermore, it was noted that temperature variations between 25 °C and 27 °C would increase the probability of occurrence of both species and higher temperatures (above 27 °C) would be a limiting factor to their occurrence. These findings agree with several authors who explored the effect of temperature on mosquitoes’ development [37,38,39].
In the Culex model outputs, elevation was positively associated with the probability of occurrence. This result disagrees with previous findings that observed that highly elevated areas were unsuitable for Culex species’ development [40,41]. This is unsurprising because in an ideal scenario, the higher the elevation, the cooler it becomes, and this should normally affect the development and survival capacity of the Culex species; however, climate warming or any other factor that modifies the microclimatic conditions, such as land use, land cover, and deforestation, could likely shift and promote their presence and distribution even in areas previously unsuitable, such as high-elevation areas, as it has been reported with other mosquitoes’ species, such as Anopheles and Aedes [42,43,44,45]. Interestingly, Carolina Garcia et al. (2010) found that some Culex species, specifically Culex quinquefasciatus, had been adapting to higher-elevation zones [46]. Furthermore, a study conducted in four high-altitude areas in East Africa using temperature data from 1950 to 2002 revealed a noticeable warming trend at all four study sites and projected that a 0.5 °C rise in temperature may result in an increase of 30–100% in mosquito abundance [47].
The Culex and Aedes probability maps showed that most parts of the country are suitable habitats for these species but mainly the regions along Lake Kariba, the Kafue River, and the Luangwa river-basin districts, as well as the Mumbwa, Chibombo, Kapiri, and Mpika districts. Interestingly, most of these areas have reported some mosquito-borne viral activity, which was confirmed by serological surveys and the detection of viruses [11,17,27,30,48], except for the districts in the Muchinga province; this exception may imply a lack of documented data rather than an actual absence of the circulation of mosquito-borne viruses given the favorable environmental conditions in the area.
It is worth highlighting that vector-distribution models reflect a potential distribution of vector-borne pathogens rather than their complete distribution [33]. Nevertheless, modeling the vectors is, foremost, more effective than modeling their hosts, specifically human hosts as these are subject to high-dispersal ranges due to their mobility, for example.
Despite using few occurrence points for the mosquito species, MaxEnt has shown to be successful in generating biologically meaningful models with minimal occurrence records of as few as six [49]. Furthermore, we used mostly climatic or environmental variables as key drivers of suitability and/or the geographic distribution of the studied species; this should be taken with caution as the suitability habitats were modeled with the assumption that the species will not encounter any dispersed limitation. Our prediction is an ideal state and should be considered as a point of reference for targeted surveillance in areas identified as high-risk for mosquito-borne viruses.
Although Zambia has not reported any epidemics of WNV or CHIKV in the last three decades, the tropical climate of Zambia offers favorable breeding sites for mosquitoes that can transmit both WNV and CHIKV. Furthermore, the continuous mosquito-borne viral-disease outbreaks in the neighboring countries, such as in Angola and the Democratic Republic of Congo, places Zambia at risk of mosquito-borne outbreaks. Furthermore, the absence of epidemics does not mean that the viruses are not circulating in the country, as evidenced by the serological studies conducted by other scholars. Thus, there is a need to alert decision-making officials to strengthen surveillance in the country, especially in the hotspot points outlined in this manuscript.

5. Conclusions

In this study, we used the occurrence records of mosquitoes (Aedes and Culex) in conjunction with environmental covariates to assess their habitat suitability and/or distribution. Overall, the model predictions show three distinct spatial hotspots, ranging from the high-probability regions to the medium- and low-probability regions. The precipitation of the warmest and driest quarters as well as the temperature seasonality were important predictors of the Culex and Aedes species, which are potential vectors of WNV, CHIKV, and other arboviruses of public-health importance. The probability maps showed a wide range of areas that could be potential mosquito-borne infectious-disease hotspots with climate-change phenomena, which could, consequently, lead to emerging diseases. These models can be used by public-health officials under the “One Health” umbrella for targeted arboviral surveillance primarily in high-probability areas in the country.

Supplementary Materials

The following supporting information can be downloaded at: https://www.mdpi.com/article/10.3390/v15091900/s1. Table S1: Aedes occurrence data; Table S2: Culex occurrence data; Table S3: Multicollinearity test of environmental variables.

Author Contributions

Conceptualization, R.M.V., G.K., S.B. and E.S.; methodology, R.M.V., M.N.C., E.S., S.B., M.M.M., N.C.S. and L.S.; software, R.M.V. and M.N.C.; writing—original draft preparation, R.M.V., F.N.B. and S.B.; writing—review and editing, C.C.C., M.C.S., M.S., R.C., Y.O., H.S., G.K., M.B., J.T., F.N.B. and E.S.; supervision, E.S., G.K., C.C.C., R.C. and M.S.; funding acquisition, E.S., G.K., M.B. and M.C.S. All authors have read and agreed to the published version of the manuscript.

Funding

This research was funded by the Africa Centre of Excellence for Infectious Disease of Humans and Animals (ACEIDHA) project (grant number P151847), funded by the World Bank. The work was also supported by the Japan Program for Infectious Diseases Research and Infrastructure (JP21wm0125008) from the Japan Agency for Medical Research and Development (AMED) and by the European and Developing Countries Clinical Trials Partnership (EDCTP2) program under the PANDORA-IDNET Consortium (EDCTP Reg/Grant RIA2016E-1609). The funders had no role in the study design, collection, analysis and interpretation of data, manuscript writing, and the decision to submit the article for publication.

Institutional Review Board Statement

The study was conducted in accordance with the Declaration of Helsinki and approved by the Ethics Committee of the University of Zambia Biomedical Research Ethics Committee (UNZABREC; protocol number 628-2019, approved on 28 January 2020).

Informed Consent Statement

Not applicable.

Data Availability Statement

All relevant data are within the paper and its Supporting Information files.

Acknowledgments

R.M.V. would like to thank the Centre for Infectious Disease Research in Zambia (CIDRZ) and Kabwe Mpundu (Department of Mathematics and Computer Science, Keele University, Keele, Newcastle ST5 5BG, United Kingdom) for their support. Authors E.S., J.T. and M.B. are members of the Pan-African Network for Rapid Research, Response, Relief, and Preparedness for Infectious Diseases Epidemics funded by the European and Developing Countries Clinical Trials Partnership, which is supported by Horizon 2020, the EU’s Framework Programme for Research and Innovation.

Conflicts of Interest

The authors declare no conflict of interest. The funders had no role in the design of the study; in the collection, analyses, or interpretation of data; in the writing of the manuscript; or in the decision to publish the results.

References

  1. Zerbo, A.; Delgado, R.C.; González, P.A. Aedes-borne viral infections and risk of emergence/resurgence in Sub-Saharan African urban areas. J. Biosaf. Biosecurity 2020, 2, 58–63. [Google Scholar] [CrossRef]
  2. Girard, M.; Nelson, C.B.; Picot, V.; Gubler, D.J. Arboviruses: A global public health threat. Vaccine 2020, 38, 3989–3994. [Google Scholar] [CrossRef] [PubMed]
  3. Wahid, B.; Ali, A.; Rafique, S.; Idrees, M. Global expansion of chikungunya virus: Mapping the 64-year history. Int. J. Infect. Dis. 2017, 58, 69–76. [Google Scholar] [CrossRef] [PubMed]
  4. Kaur, P.; Chu, J.J.H. Chikungunya virus: An update on antiviral development and challenges. Drug Discov. Today 2013, 18, 969–983. [Google Scholar] [CrossRef] [PubMed]
  5. Proesmans, S.; Katshongo, F.; Milambu, J.; Fungula, B.; Mavoko, H.M.; Ahuka-Mundeke, S.; Da Luz, R.I.; Van Esbroeck, M.; Ariën, K.K.; Cnops, L. Dengue and Chikungunya among Febrile Outpatients in Kinshasa, Democratic Republic of Congo: A cross-sectional study. PLoS Negl Trop Dis. 2019, 13, e0007047. [Google Scholar] [CrossRef]
  6. Bonn, D. How Did Chikungunya Reach Indian Ocean? Lancet Infect. Dis. 2006, 6, 543. [Google Scholar] [CrossRef]
  7. Hayes, E.B.; Sejvar, J.J.; Zaki, S.R.; Lanciotti, R.S.; Bode, A.V.; Campbell, G.L. Virology, pathology, and clinical manifestations of West Nile virus disease. Emerg. Infect. Dis. 2005, 11, 1174. [Google Scholar] [CrossRef]
  8. Komar, N. West Nile viral encephalitis. Rev. Sci. Et Tech. Int. Off. Epizoot. 2000, 19, 166–176. [Google Scholar] [CrossRef]
  9. Kilpatrick, A.M.; Kramer, L.D.; Campbell, S.R.; Alleyne, E.O.; Dobson, A.P.; Daszak, P. West Nile virus risk assessment and the bridge vector paradigm. Emerg. Infect. Dis. 2005, 11, 425. [Google Scholar] [CrossRef]
  10. Petersen, L.R.; Marfin, A.A. West Nile virus: A primer for the clinician. Ann. Intern. Med. 2002, 137, 173–179. [Google Scholar] [CrossRef]
  11. Chisenga, C.C.; Bosomprah, S.; Musukuma, K.; Mubanga, C.; Chilyabanyama, O.N.; Velu, R.M.; Kim, Y.C.; Reyes-Sandoval, A.; Chilengi, R. Sero-prevalence of arthropod-borne viral infections among Lukanga swamp residents in Zambia. PLoS ONE 2020, 15, e0235322. [Google Scholar] [CrossRef] [PubMed]
  12. Mweene-Ndumba, I.; Siziya, S.; Monze, M.; Mazaba, M.L.; Masaninga, F.; Songolo, P.; Mwaba, P.; Babaniyi, O.A. Seroprevalence of West Nile virus specific IgG and IgM antibodies in North-Western and Western provinces of Zambia. Afr. Health Sci. 2015, 15, 803–809. [Google Scholar] [CrossRef] [PubMed]
  13. Rodger, L. An outbreak of suspected chikungunya fever in Nothern Rhodesia. S. Afr. Med. J. 1961, 35, 126–128. [Google Scholar] [PubMed]
  14. Mazaba-Liwewe, M.L.; Babaniyi, O.; Monza, M.; Mweene-Ndumba, I.; Mulenga, D.; Masaninga, F.; Songolo, P.; Kasolo, F.; Siziya, S. Dengue fever and factors associated with it in Western provinces of Zambia. Int. Public Health J. 2016, 8, 65. [Google Scholar]
  15. Babaniyi, O.; Mazaba-Liwewe, M.L.; Masaninga, F.; Mwaba, P.; Mulenga, D.; Songolo, P.; Mweene-Ndumba, I.; Rudatsikira, E.; Siziya, S. Prevalence of yellow fever in North-Western Province of Zambia. Int. J. Public Health Epidemiol. 2016, 8, 29–32. [Google Scholar]
  16. Orba, Y.; Hang’ombe, B.M.; Mweene, A.S.; Wada, Y.; Anindita, P.D.; Phongphaew, W.; Qiu, Y.; Kajihara, M.; Mori-Kajihara, A.; Eto, Y.; et al. First isolation of West Nile virus in Zambia from mosquitoes. Transbound. Emerg. Dis. 2018, 65, 434. [Google Scholar] [CrossRef]
  17. Simulundu, E.; Ndashe, K.; Chambaro, H.M.; Squarre, D.; Reilly, P.M.; Chitanga, S.; Changula, K.; Mukubesa, A.N.; Ndebe, J.; Tembo, J. West Nile Virus in Farmed Crocodiles, Zambia, 2019. Emerg. Infect. Dis. 2020, 26, 811. [Google Scholar] [CrossRef]
  18. Takaya, S.; Kutsuna, S.; Nakayama, E.; Taniguchi, S.; Tajima, S.; Katanami, Y.; Yamamoto, K.; Takeshita, N.; Hayakawa, K.; Kato, Y. Chikungunya fever in traveler from Angola to Japan, 2016. Emerg. Infect. Dis. 2017, 23, 156. [Google Scholar] [CrossRef]
  19. Hertz, J.T.; Munishi, O.M.; Ooi, E.E.; Howe, S.; Lim, W.Y.; Chow, A.; Morrissey, A.B.; Bartlett, J.A.; Onyango, J.J.; Maro, V.P. Chikungunya and dengue fever among hospitalized febrile patients in northern Tanzania. Am. J. Trop. Med. Hyg. 2012, 86, 171. [Google Scholar] [CrossRef]
  20. Townsend Peterson, A.; Papeş, M.; Eaton, M. Transferability and model evaluation in ecological niche modeling: A comparison of GARP and Maxent. Ecography 2007, 30, 550–560. [Google Scholar] [CrossRef]
  21. Abdelkrim, O.; Samia, B.; Said, Z.; Souad, L. Modeling and mapping the habitat suitability and the potential distribution of Arboviruses vectors in Morocco. Parasite 2021, 28, 37. [Google Scholar] [CrossRef] [PubMed]
  22. Sofia, M.; Giannakopoulos, A.; Giantsis, I.A.; Touloudi, A.; Birtsas, P.; Papageorgiou, K.; Athanasakopoulou, Z.; Chatzopoulos, D.C.; Vrioni, G.; Galamatis, D. West Nile Virus Occurrence and Ecological Niche Modeling in Wild Bird Species and Mosquito Vectors: An Active Surveillance Program in the Peloponnese Region of Greece. Microorganisms 2022, 10, 1328. [Google Scholar] [CrossRef] [PubMed]
  23. León, B.; Jiménez-Sánchez, C.; Retamosa-Izaguirre, M. An environmental niche model to estimate the potential presence of Venezuelan equine encephalitis virus in Costa Rica. Int. J. Environ. Res. Public Health 2021, 18, 227. [Google Scholar] [CrossRef] [PubMed]
  24. Burch, C.; Loraamm, R.; Unnasch, T.; Downs, J. Utilizing ecological niche modelling to predict habitat suitability of eastern equine encephalitis in Florida. Ann. GIS 2020, 26, 133–147. [Google Scholar] [CrossRef]
  25. Libanda, B.; Bwalya, K.; Nkolola, N.B.; Chilekana, N. Quantifying long-term variability of precipitation and temperature over Zambia. J. Atmos. Sol. Terr. Phys. 2020, 198, 105201. [Google Scholar] [CrossRef]
  26. Dautu, G.; Mweene, A.S.; Samui, K.L.; Sindato, C.; Roy, P.; Noad, R.; Paweska, J.; Majiwa, P.A.; Musoke, A.J. Rift Valley fever: Real or perceived threat for Zambia? Onderstepoort J. Vet. Res. 2012, 79, 1–6. [Google Scholar] [CrossRef]
  27. Velu, R.M.; Kwenda, G.; Libonda, L.; Chisenga, C.C.; Flavien, B.N.; Chilyabanyama, O.N.; Simunyandi, M.; Bosomprah, S.; Sande, N.C.; Changula, K. Mosquito-Borne Viral Pathogens Detected in Zambia: A Systematic Review. Pathogens 2021, 10, 1007. [Google Scholar] [CrossRef]
  28. Kent, R.J. The Mosquitoes of Macha, Zambia; Johns Hopkins Malaria Research Institute: Baltimore, MD, USA, 2006. [Google Scholar]
  29. Chambaro, H.M.; Hirose, K.; Sasaki, M.; Libanda, B.; Sinkala, Y.; Fandamu, P.; Muleya, W.; Banda, F.; Chizimu, J.; Squarre, D. An unusually long Rift valley fever inter-epizootic period in Zambia: Evidence for enzootic virus circulation and risk for disease outbreak. PLoS Neglected Trop. Dis. 2022, 16, e0010420. [Google Scholar] [CrossRef]
  30. Masaninga, F.; Muleba, M.; Masendu, H.; Songolo, P.; Mweene-Ndumba, I.; Mazaba-Liwewe, M.L.; Kamuliwo, M.; Ameneshewa, B.; Siziya, S.; Babaniyi, O.A. Distribution of yellow fever vectors in Northwestern and Western Provinces, Zambia. Asian Pac. J. Trop. Med. 2014, 7, S88–S92. [Google Scholar] [CrossRef]
  31. Data, W.-G.C. Free Climate Data for Ecological Modeling and GIS. 2016. Available online: http://www.worldclim.org (accessed on 3 March 2023).
  32. Warren, D.L.; Glor, R.E.; Turelli, M. ENMTools: A toolbox for comparative studies of environmental niche models. Ecography 2010, 33, 607–611. [Google Scholar] [CrossRef]
  33. Phillips, S.J.; Anderson, R.P.; Schapire, R.E. Maximum entropy modeling of species geographic distributions. Ecol. Model. 2006, 190, 231–259. [Google Scholar] [CrossRef]
  34. Richman, R.; Diallo, D.; Diallo, M.; Sall, A.A.; Faye, O.; Diagne, C.T.; Dia, I.; Weaver, S.C.; Hanley, K.A.; Buenemann, M. Ecological niche modeling of Aedes mosquito vectors of chikungunya virus in southeastern Senegal. Parasites Vectors 2018, 11, 255. [Google Scholar] [CrossRef] [PubMed]
  35. Schaeffer, B.; Mondet, B.; Touzeau, S. Using a climate-dependent model to predict mosquito abundance: Application to Aedes (Stegomyia) africanus and Aedes (Diceromyia) furcifer (Diptera: Culicidae). Infect. Genet. Evol. 2008, 8, 422–432. [Google Scholar] [CrossRef] [PubMed]
  36. Ciota, A.T.; Matacchiero, A.C.; Kilpatrick, A.M.; Kramer, L.D. The effect of temperature on life history traits of Culex mosquitoes. J. Med. Entomol. 2014, 51, 55–62. [Google Scholar] [CrossRef] [PubMed]
  37. Brault, A.C. Changing patterns of West Nile virus transmission: Altered vector competence and host susceptibility. Veter. Res. 2009, 40, 43–49. [Google Scholar] [CrossRef]
  38. Nayar, J. Effects of constant and fluctuating temperatures on life span of Aedes taeniorhynchus adults. J. Insect Physiol. 1972, 18, 1303–1313. [Google Scholar] [CrossRef]
  39. Waldock, J.; Chandra, N.L.; Lelieveld, J.; Proestos, Y.; Michael, E.; Christophides, G.; Parham, P.E. The role of environmental variables on Aedes albopictus biology and chikungunya epidemiology. Pathog. Glob. Health 2013, 107, 224–241. [Google Scholar] [CrossRef]
  40. Gangoso, L.; Aragonés, D.; Martínez-de la Puente, J.; Lucientes, J.; Delacour-Estrella, S.; Peña, R.E.; Montalvo, T.; Bueno-Marí, R.; Bravo-Barriga, D.; Frontera, E. Determinants of the current and future distribution of the West Nile virus mosquito vector Culex pipiens in Spain. Environ. Res. 2020, 188, 109837. [Google Scholar] [CrossRef]
  41. Bravo-Barriga, D.; Gomes, B.; Almeida, A.P.; Serrano-Aguilera, F.J.; Pérez-Martín, J.E.; Calero-Bernal, R.; Reina, D.; Frontera, E.; Pinto, J. The mosquito fauna of the western region of Spain with emphasis on ecological factors and the characterization of Culex pipiens forms. J. Vector Ecol. 2017, 42, 136–147. [Google Scholar] [CrossRef]
  42. Minakawa, N.; Sonye, G.; Mogi, M.; Githeko, A.; Yan, G. The effects of climatic factors on the distribution and abundance of malaria vectors in Kenya. J. Med. Entomol. 2002, 39, 833–841. [Google Scholar] [CrossRef]
  43. Linton, Y.-M.; Dao, A.; Diallo, M.; Sanogo, Z.L.; Samake, D.; Ousmane, Y.; Kouam, C.; Krajacich, B.J.; Faiman, R.; Bamou, R. Diversity, composition, altitude, and seasonality of high-altitude windborne migrating mosquitoes in the Sahel: Implications for disease transmission. Front. Epidemiol. 2022, 2, 40. [Google Scholar]
  44. Afrane, Y.A.; Zhou, G.; Lawson, B.W.; Githeko, A.K.; Yan, G. Life-table analysis of Anopheles arabiensis in western Kenya highlands: Effects of land covers on larval and adult survivorship. Am. J. Trop. Med. Hyg. 2007, 77, 660–666. [Google Scholar] [CrossRef] [PubMed]
  45. Brady, O.J.; Golding, N.; Pigott, D.M.; Kraemer, M.U.; Messina, J.P.; Reiner, R.C., Jr.; Scott, T.W.; Smith, D.L.; Gething, P.W.; Hay, S.I. Global temperature constraints on Aedes aegypti and Ae. albopictus persistence and competence for dengue virus transmission. Parasites Vectors 2014, 7, 338. [Google Scholar] [CrossRef] [PubMed]
  46. García, C.; Escovar, J.; Moncada, L. Altitude and life tables of Culex quinquefasciatus (Diptera cucilidae) populations. Rev. Colomb. Entomol. 2010, 36, 62–67. [Google Scholar] [CrossRef]
  47. Pascual, M.; Ahumada, J.A.; Chaves, L.F.; Rodo, X.; Bouma, M. Malaria resurgence in the East African highlands: Temperature trends revisited. Proc. Natl. Acad. Sci. USA 2006, 103, 5829–5834. [Google Scholar] [CrossRef]
  48. Mubemba, B.; Mburu, M.M.; Changula, K.; Muleya, W.; Moonga, L.C.; Chambaro, H.M.; Kajihara, M.; Qiu, Y.; Orba, Y.; Hayashida, K. Current knowledge of vector-borne zoonotic pathogens in Zambia: A clarion call to scaling-up “One Health” research in the wake of emerging and re-emerging infectious diseases. PLoS Neglected Trop. Dis. 2022, 16, e0010193. [Google Scholar] [CrossRef]
  49. Pearson, R.; Dawson, T.; Liu, C.; Raxworthy, C.J.; Nakamura, M.; Peterson, A.T. Predicting species’ distributions from small numbers of occurrence records: A test case using cryptic geckos in Madagascar. J. Biogeogr. 2007, 34, 102–117. [Google Scholar] [CrossRef]
Figure 1. Map of Zambia showing locations of Culex and Aedes occurrence records included in MaxEnt modeling. The red and green dots represent the Culex and Aedes species, respectively. The overlap of red and green points indicates that both species were captured in the location. The yellow, dark blue, and light blue colors represent the sampling areas.
Viruses 15 01900 g001
Figure 2. ROC curves for MaxEnt Aedes (A) and Culex (B) models’ performance (red line: training and testing data; blue line: standard deviation; and black line: random prediction). The AUC had values of 0.761 and 0.821 for Aedes and Culex, respectively.
Viruses 15 01900 g002
Figure 3. Jackknife of test gain for Aedes (A) and Culex (B). The blue bars show the effect of each variable on the model by itself, while the light blue bars show the effect in the model when this variable is not considered. The red bar represents the performance of the model when all variables are included in the model.
Viruses 15 01900 g003
Figure 4. Potential probability distribution of Aedes (A) and Culex (B) species in Zambia. Areas of high suitability are represented by the orange color through the light yellow color and less suitable areas are represented by the green color.
Viruses 15 01900 g004
Figure 5. The effect of each environmental variable that most contributes to the suitability habitat of Aedes species when the remaining variables are configured to their average value. (A): BIO 18, precipitation of the warmest quarter, for which the units are millimeters of precipitation; (B): BIO 17, precipitation of the driest quarter, for which the units are millimeters of precipitation; and (C): BIO 4, temperature seasonality, for which the units are degrees Celsius by 10.
Viruses 15 01900 g005
Figure 6. Shows the effect of each environmental variable that most contributes to the suitability habitat of Culex species when the remaining variables are configured to their average value. (A): BIO 18, precipitation of the warmest quarter, for which the units are millimeters of precipitation; (B): BIO 4, temperature seasonality, for which the units are degrees Celsius by 10; (C): elevation, for which X-axis units are millimeters above sea level; and (D): BIO 16, precipitation of wettest quarter (BIO 16), for which the units are millimeters of precipitation.
Viruses 15 01900 g006
Table 1. Environmental variables used in the models (adapted from WorldClim.org).
Variable DescriptionAbbreviationUnit
Temperature seasonality (standard deviation × 100)BIO4°C
Mean temperature of wettest quarterBIO8°C
Mean temperature of driest quarterBIO9°C
Precipitation seasonality (coefficient of variation)BIO15Mm
Precipitation of wettest quarterBIO16Mm
Precipitation of driest quarterBIO17Mm
Precipitation of warmest quarterBIO18Mm
Precipitation of coldest quarterBIO19Mm
ElevationN/AM
Table 2. Percent contribution of environmental variables for final models (Aedes and Culex species).
Culex ModelAedes Model
Environmental VariableContribution (%)Environmental VariableContribution (%)
Precipitation of warmest quarter (BIO18)41.2Precipitation of warmest quarter (BIO18)85
Precipitation of driest quarter (BIO17)37.7Precipitation of driest quarter (BIO17)14.3
Temperature seasonality (standard deviation × 100; BIO4)11.7Precipitation of coldest quarter (BIO19)0.4
Precipitation of coldest quarter (BIO19)3.7Temperature seasonality (standard deviation × 100; BIO4)0.2
Precipitation of wettest quarter (BIO16)3Mean temperature of driest quarter (BIO9)0
Elevation1.2Precipitation of wettest quarter (BIO16)0
Precipitation seasonality (coefficient of variation; BIO15)1Elevation0
Mean temperature of driest quarter (BIO9)0.4Mean temperature of driest quarter (BIO8)0
Mean temperature of driest quarter (BIO8)0.1Precipitation seasonality (coefficient of variation; BIO15)0
Disclaimer/Publisher’s Note: The statements, opinions and data contained in all publications are solely those of the individual author(s) and contributor(s) and not of MDPI and/or the editor(s). MDPI and/or the editor(s) disclaim responsibility for any injury to people or property resulting from any ideas, methods, instructions or products referred to in the content.

