
Mathematical Modeling of Oncolytic Virus Therapy Reveals Role of the Immune Response

Abstract
:1. Introduction
2. Materials and Methods
2.1. Experimental Data
2.2. Model Fitting and Statistical Analysis
3. Results
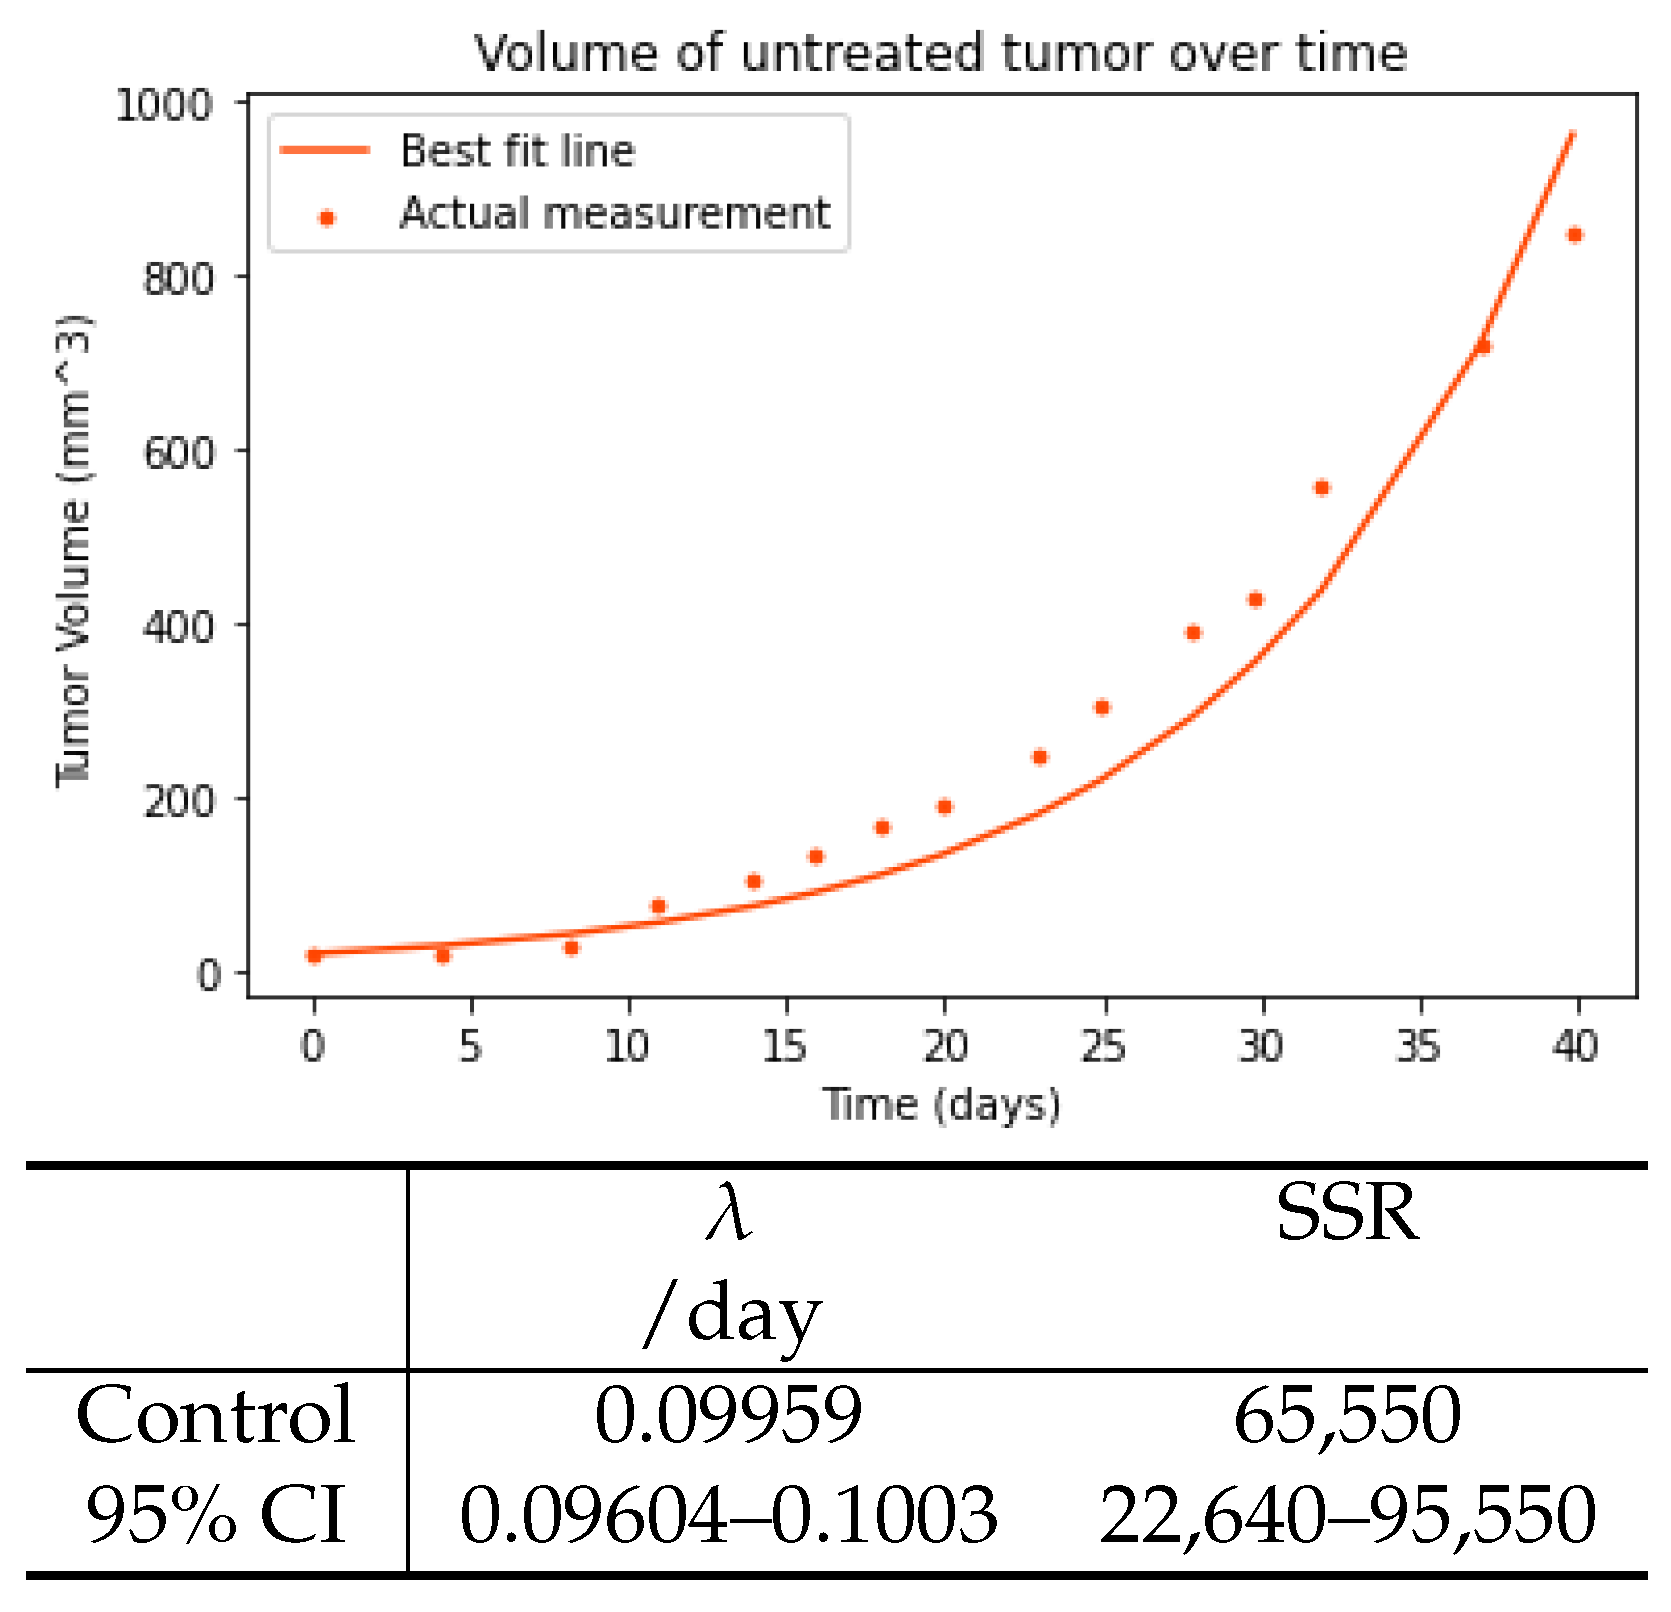
3.1. Control Tumor
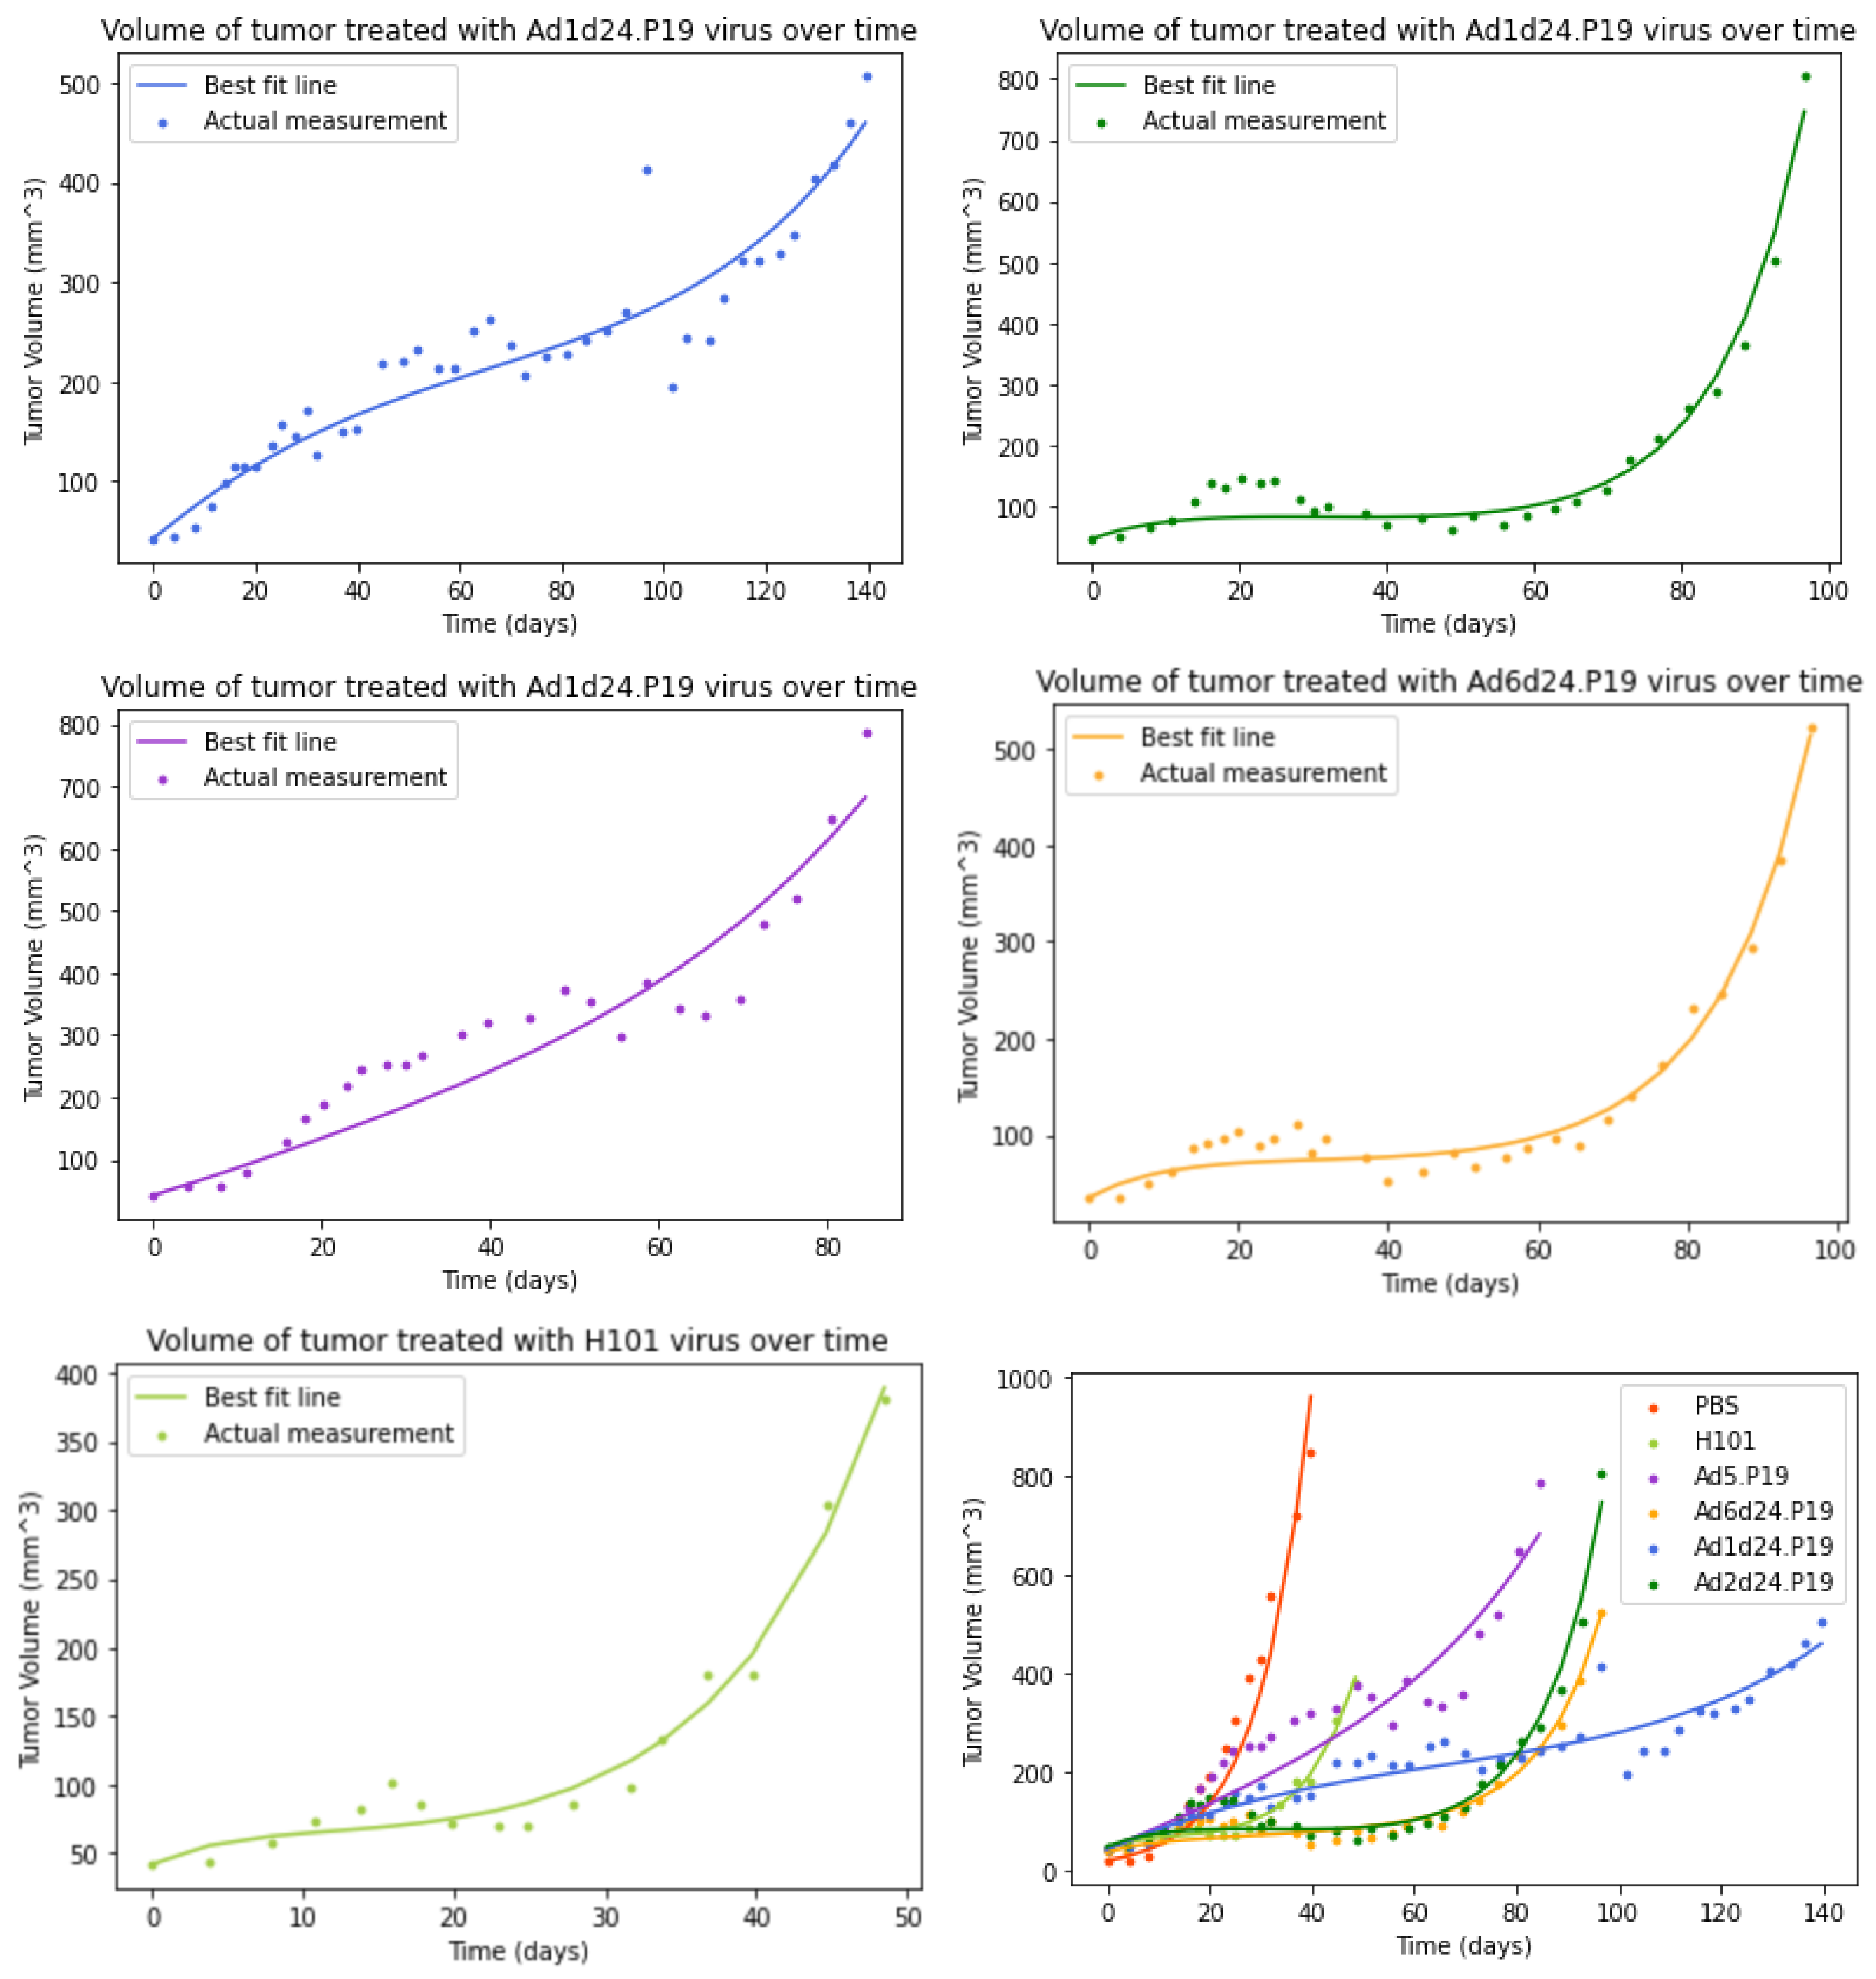
3.2. Model without an Immune Response
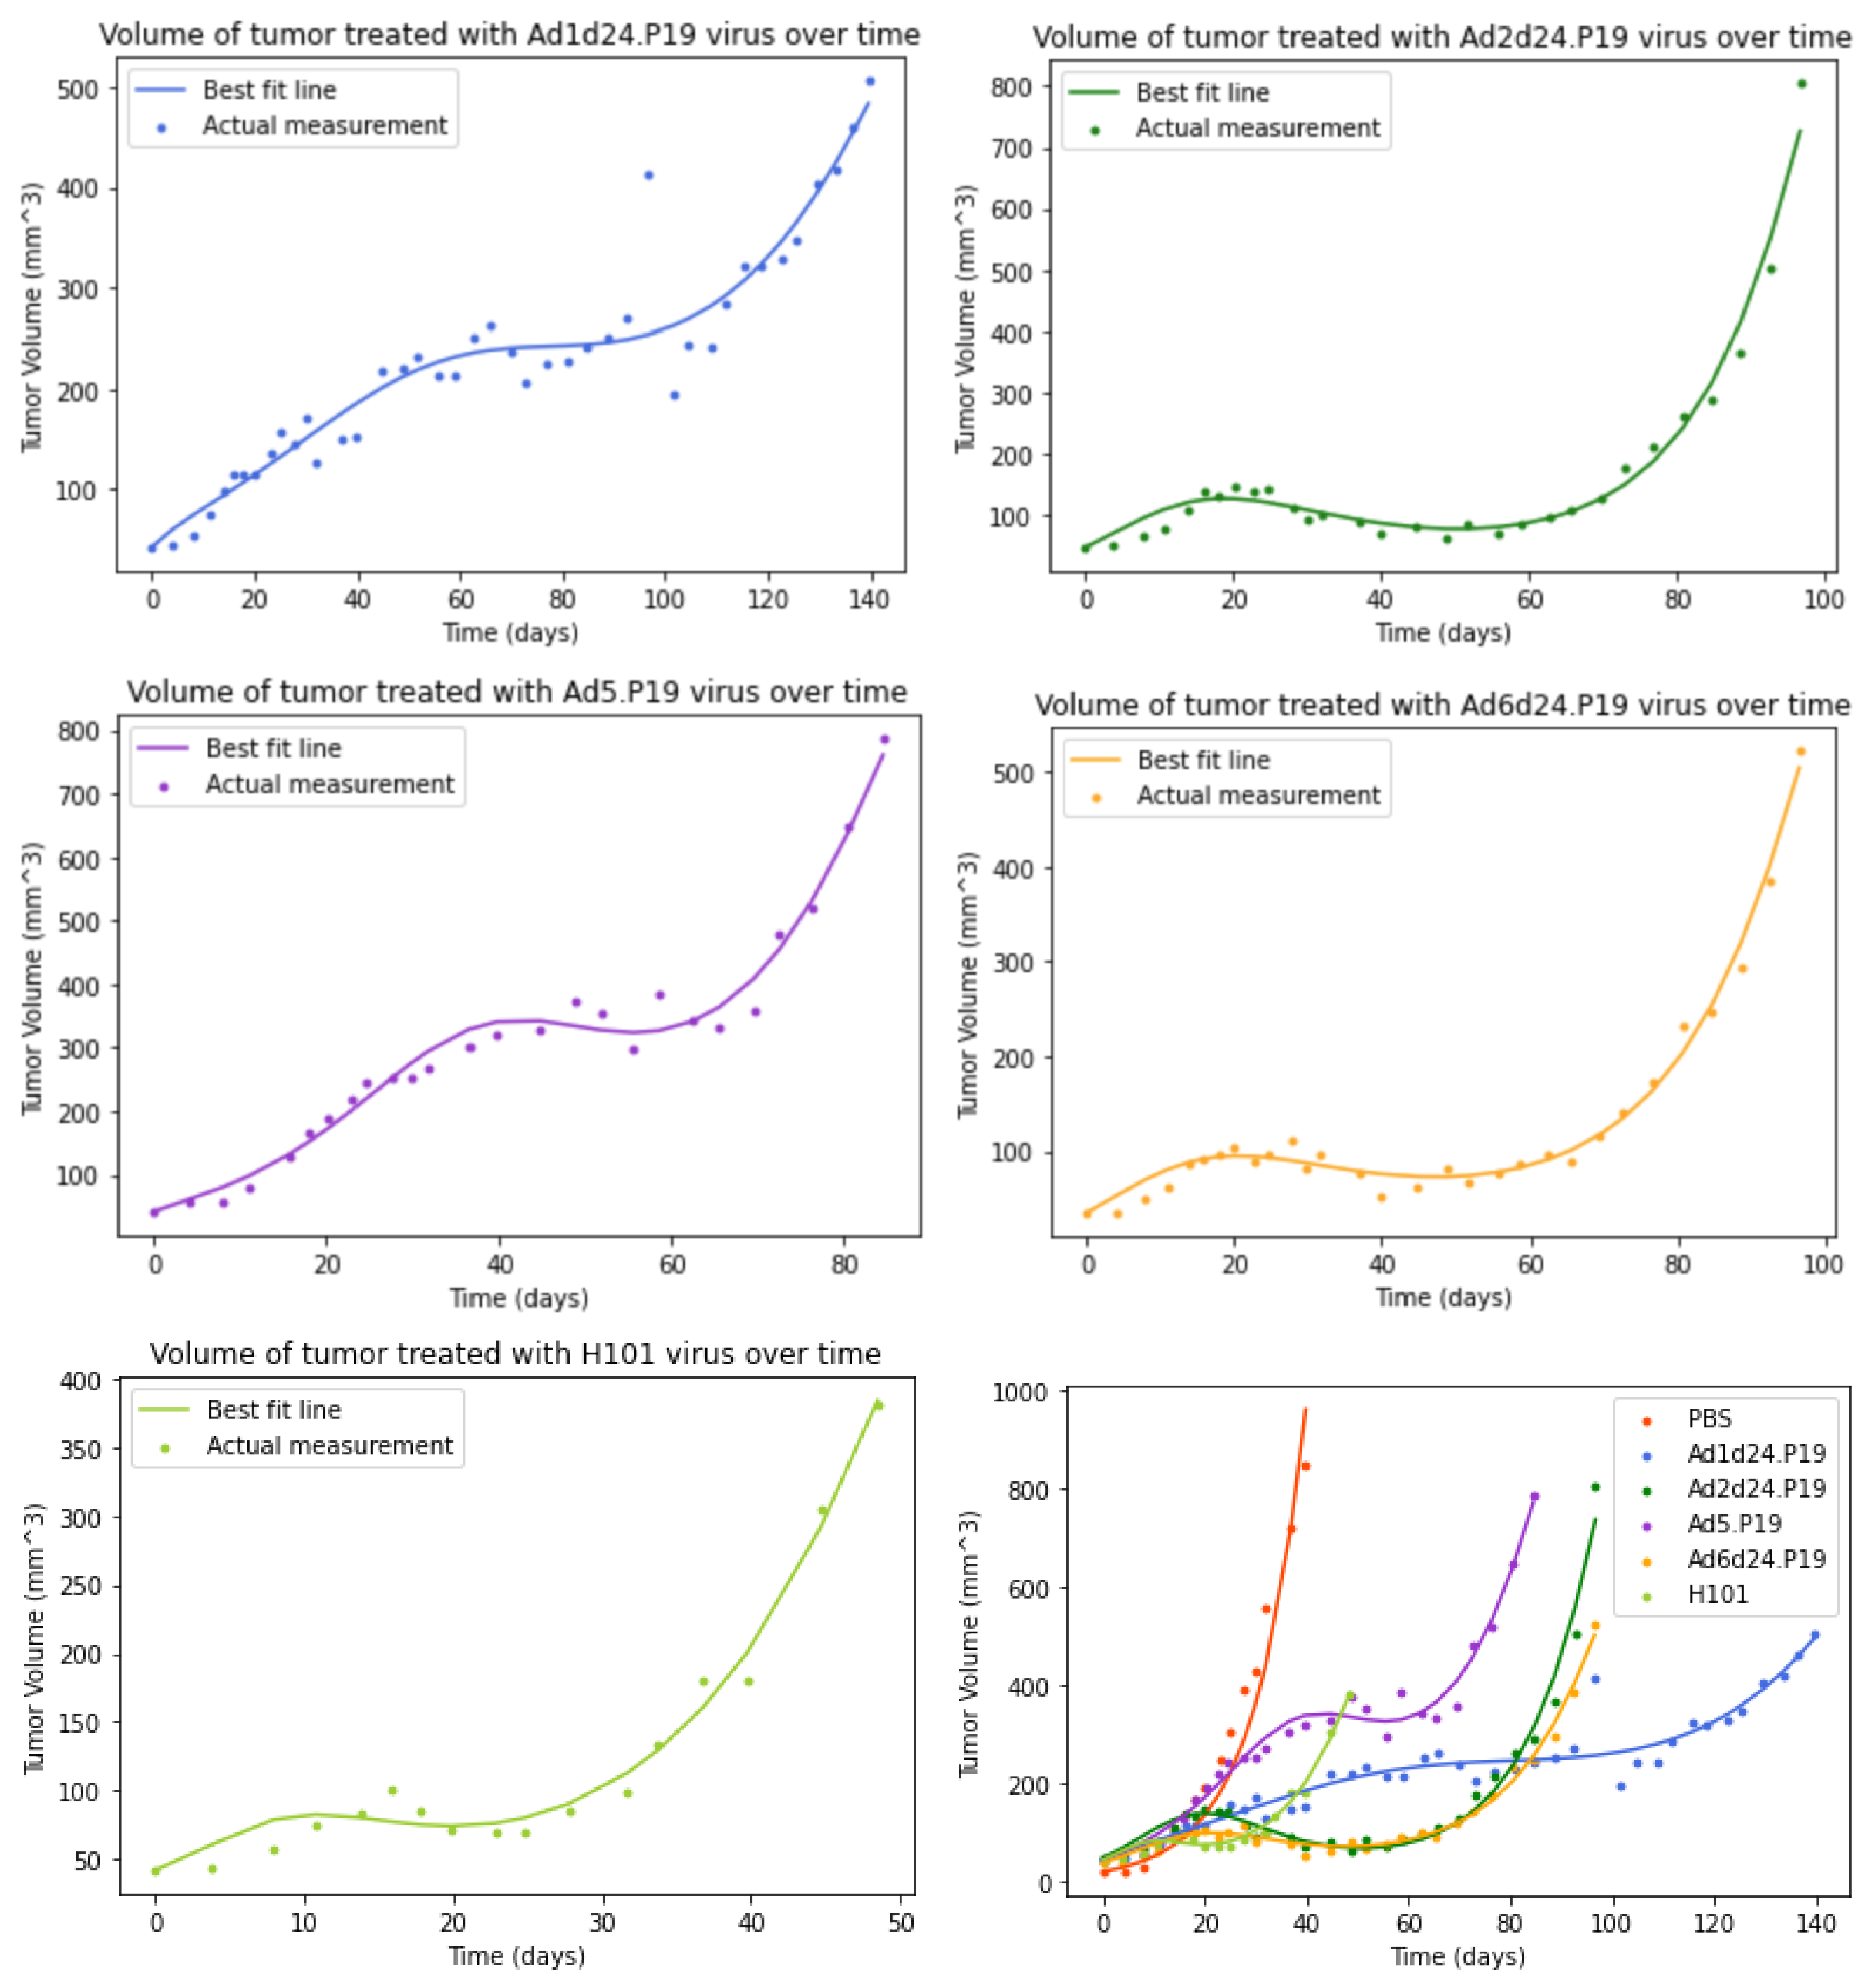
3.3. Model with an Immune Response
3.4. Comparison of Models
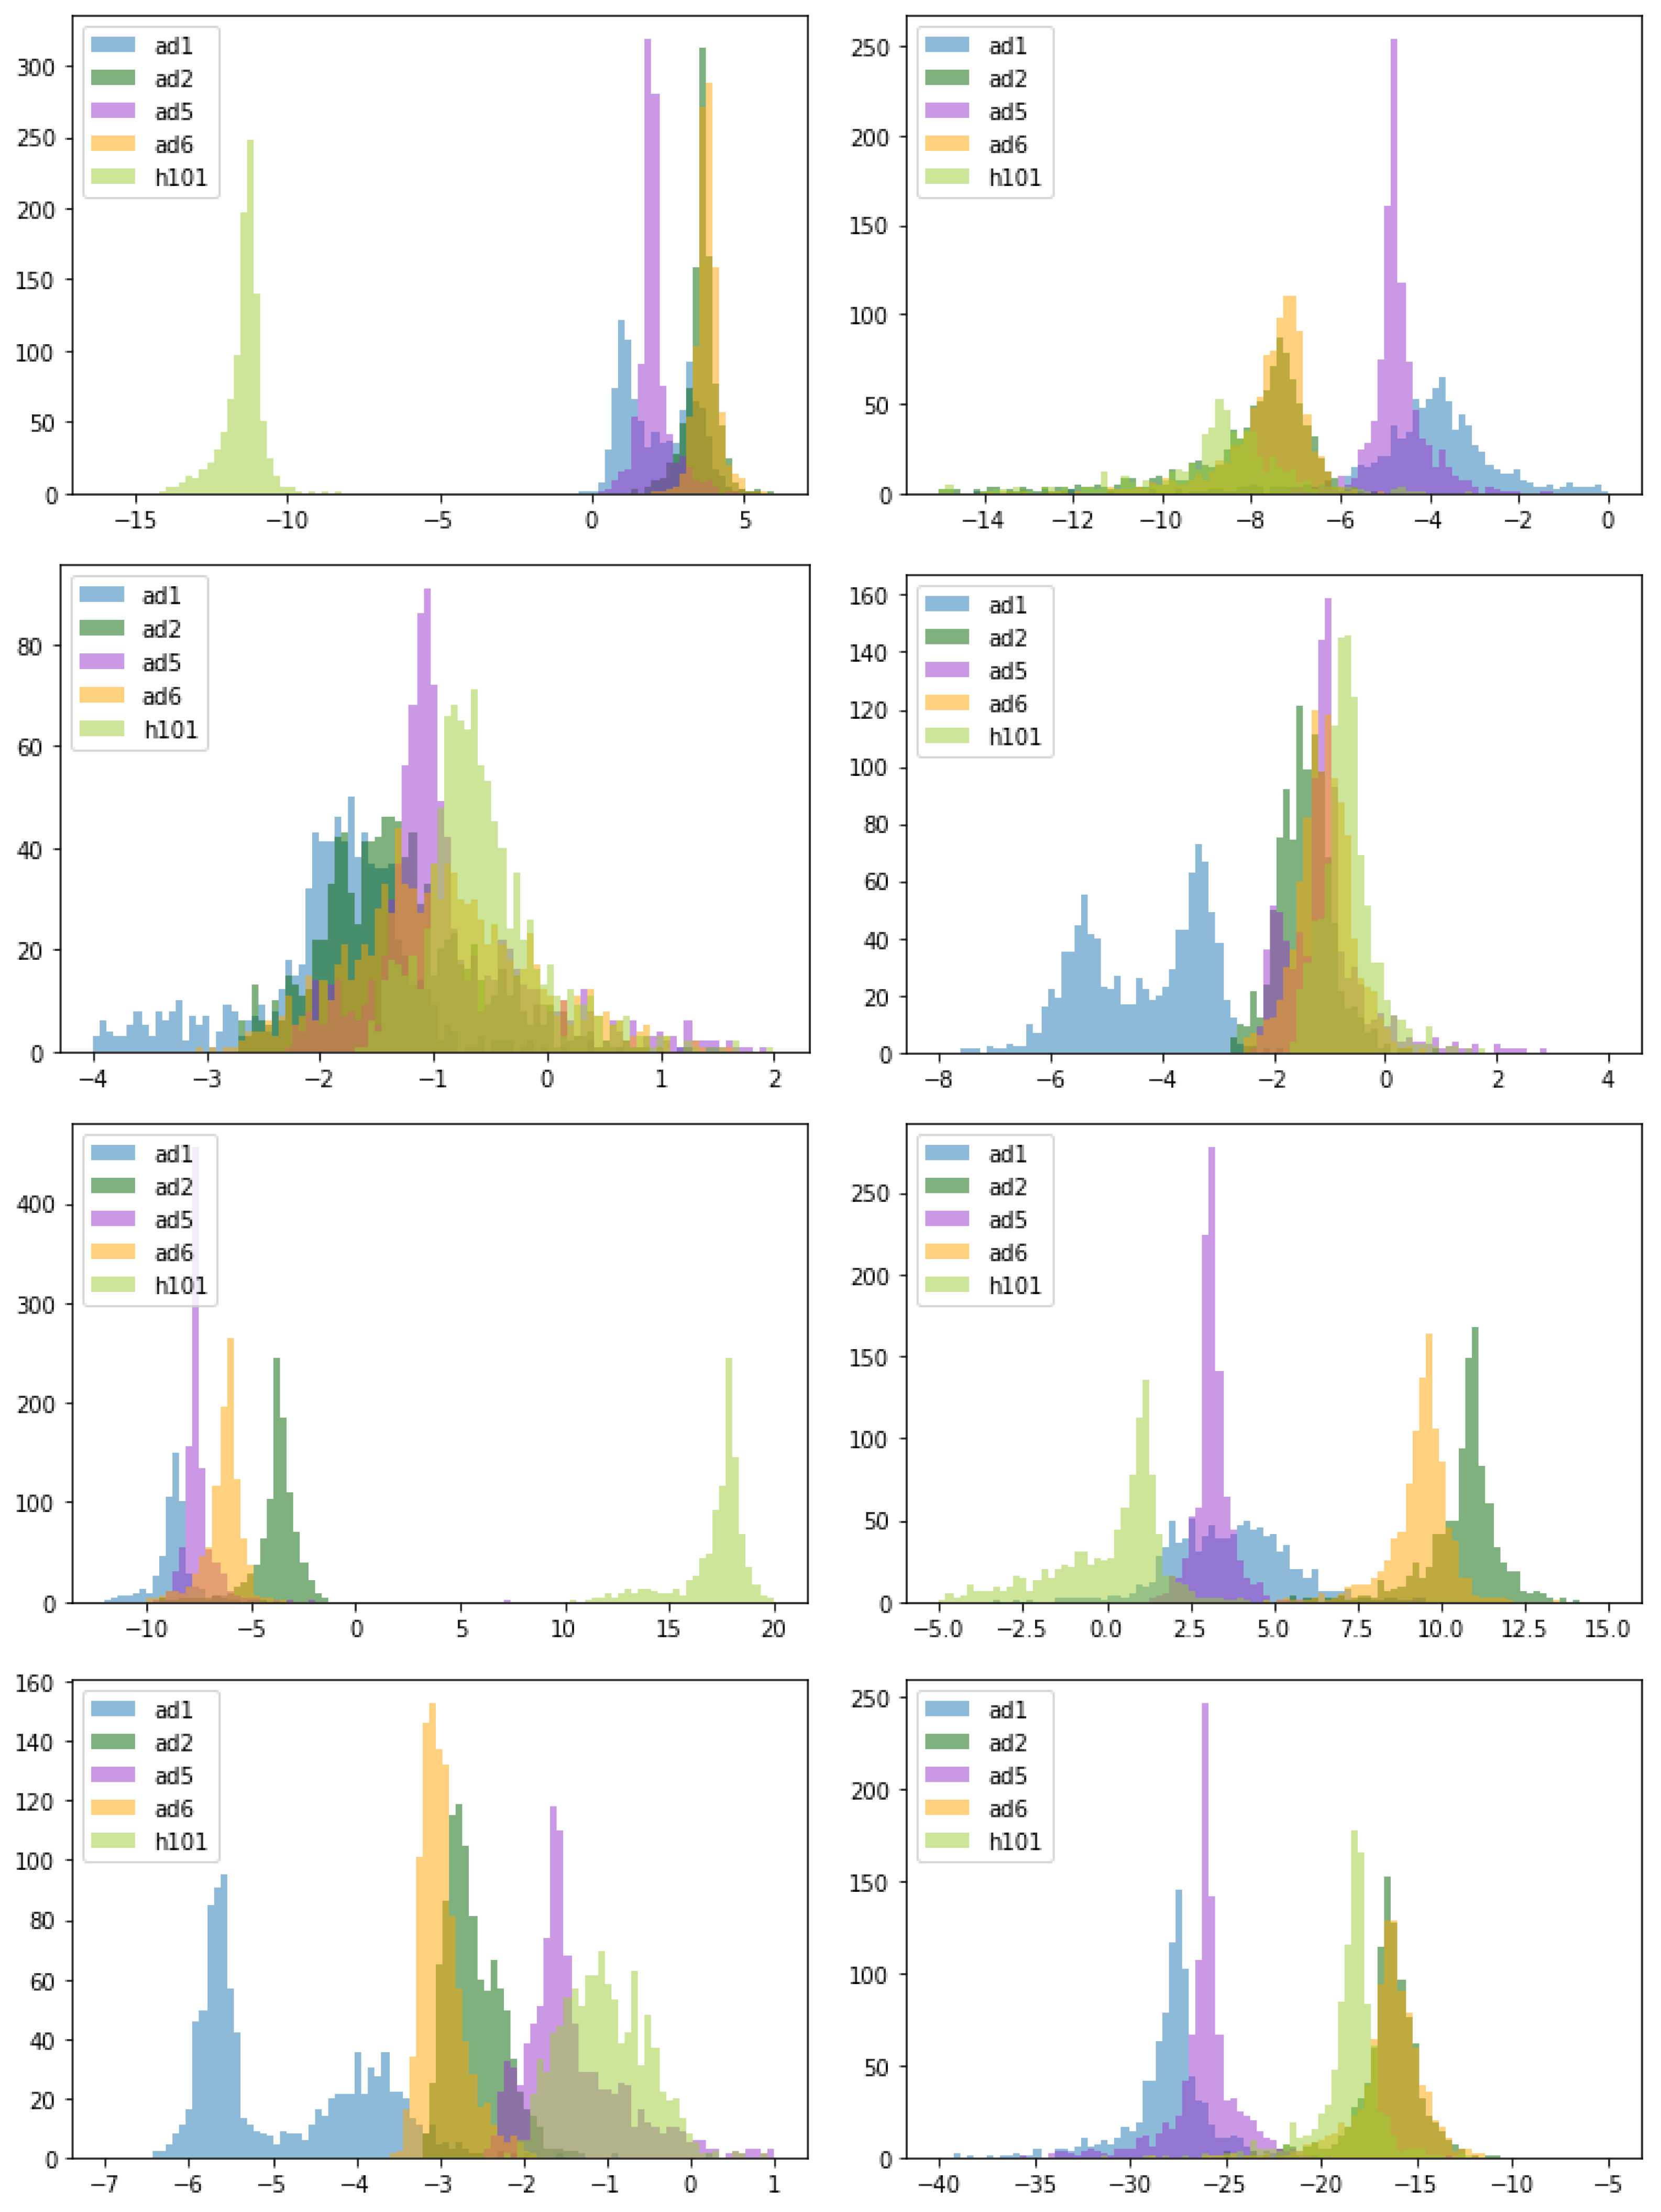
3.5. Comparison of Parameter Estimates for Different OAds
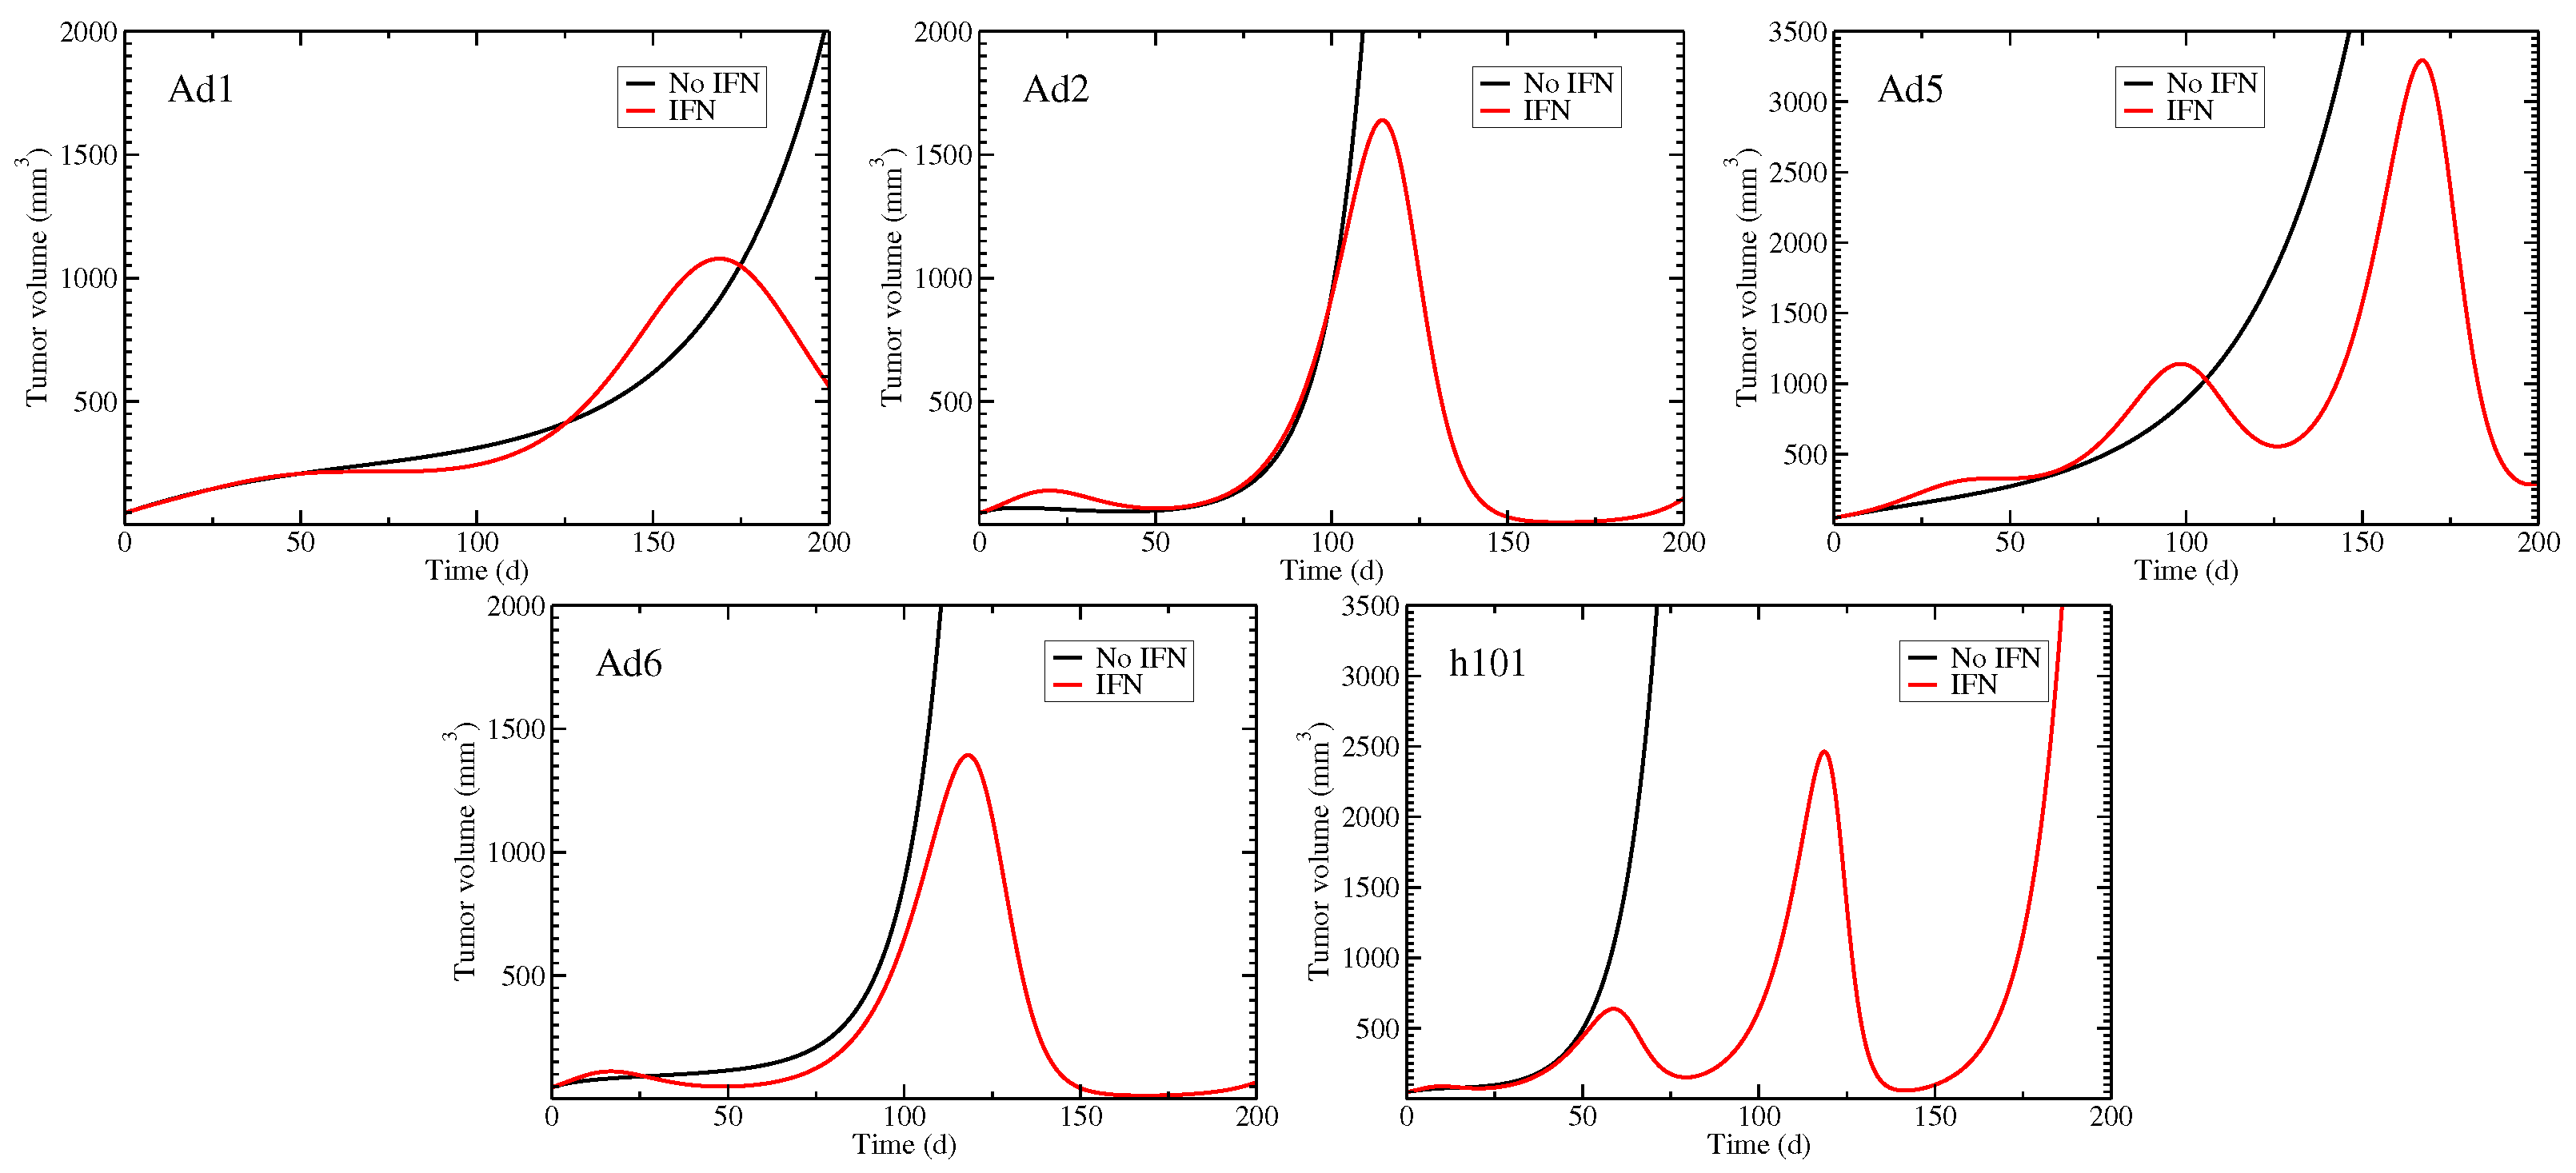
3.6. Role of the Immune Response in Suppressing Tumors
4. Discussion
Supplementary Materials
Author Contributions
Funding
Institutional Review Board Statement
Informed Consent Statement
Data Availability Statement
Conflicts of Interest
Abbreviations
| AIC | Akaike’s information criteria |
| CI | Confidence interval |
| FDA | Food and drug administration |
| OAd | Oncolytic adenovirus |
| ODE | Ordinary differential equation |
| OV | Oncolytic virus |
| RNA | Ribonucleic acid |
| SCID | Severe combined immunodeficiency |
| SSR | Sum of squared residuals |
References
- Ahmad, F.B.; Anderson, R.N. The leading causes of death in the US for 2020. JAMA 2021, 325, 1829–1830. [Google Scholar] [CrossRef] [PubMed]
- Hilscher, M.; Røder, A.; Helgstrand, J.T.; Klemann, N.; Brasso, K.; Vickers, A.J.; Stroomberg, H.V. Risk of prostate cancer and death after benign transurethral resection of the prostate—A 20-year population-based analysis. Cancer 2022, 128, 3674–3680. [Google Scholar] [CrossRef] [PubMed]
- Henry, D.H.; Viswanathan, H.N.; Elkin, E.P.; Traina, S.; Wade, S.; Cella, D. Symptoms and treatment burden associated with cancer treatment: Results from a cross-sectional national survey in the US. Support. Care Cancer 2008, 16, 791–801. [Google Scholar] [CrossRef] [PubMed]
- Gegechkori, N.; Haines, L.; Lin, J.J. Long-Term and Latent Side Effects of Specific Cancer Types. Med. Clin. N. Am. 2017, 101, 1053–1073. [Google Scholar] [PubMed]
- Lawler, S.E.; Speranza, M.C.; Cho, C.F.; Chiocca, E.A. Oncolytic viruses in cancer treatment: A review. JAMA Oncol. 2017, 3, 841–849. [Google Scholar] [CrossRef]
- Schirrmacher, V. Cancer vaccines and oncolytic viruses exert profoundly lower side effects in cancer patients than other systemic therapies: A comparative analysis. Biomedicines 2020, 8, 61. [Google Scholar]
- Li, K.; Zhao, Y.; Hu, X.; Jiao, J.; Wang, W.; Yao, H. Advances in the clinical development of oncolytic viruses. Am. J. Transl. Res. 2022, 14, 4192. [Google Scholar]
- Yu, W.; Fang, H. Clinical trials with oncolytic adenovirus in China. Curr. Cancer Drug Targets 2007, 7, 141–148. [Google Scholar] [CrossRef]
- Coffin, R. Interview with Robert Coffin, inventor of T-VEC: The first oncolytic immunotherapy approved for the treatment of cancer. Immunotherapy 2016, 8, 103–106. [Google Scholar] [CrossRef]
- Wu, J.T.; Kirn, D.H.; Wein, L.M. Analysis of a three-way race between tumor growth, a replication-competent virus and an immune response. Bull. Math. Biol. 2004, 66, 605–625. [Google Scholar] [CrossRef]
- Li, Q.; Tan, F.; Wang, Y.; Liu, X.; Kong, X.; Meng, J.; Yang, L.; Cen, S. The gamble between oncolytic virus therapy and IFN. Front. Immunol. 2022, 13, 971674. [Google Scholar] [CrossRef] [PubMed]
- Vaehae-Koskela, M.; Hinkkanen, A. Tumor Restrictions to Oncolytic Virus. Biomedicines 2014, 2, 163–194. [Google Scholar] [CrossRef] [PubMed]
- Apolonio, J.S.; de Souza Gonçalves, V.L.; Santos, M.L.C.; Luz, M.S.; Souza, J.V.S.; Pinheiro, S.L.R.; de Souza, W.R.; Loureiro, M.S.; de Melo, F.F. Oncolytic virus therapy in cancer: A current review. World J. Virol. 2021, 10, 229. [Google Scholar] [CrossRef] [PubMed]
- Goradel, N.H.; Mohajel, N.; Malekshahi, Z.V.; Jahangiri, S.; Najafi, M.; Farhood, B.; Mortezaee, K.; Negahdari, B.; Arashkia, A. Oncolytic adenovirus: A tool for cancer therapy in combination with other therapeutic approaches. J. Cell. Physiol. 2019, 234, 8636–8646. [Google Scholar] [PubMed]
- Mantwill, K.; Klein, F.G.; Wang, D.; Hindupur, S.V.; Ehrenfeld, M.; Holm, P.S.; Nawroth, R. Concepts in oncolytic adenovirus therapy. Int. J. Mol. Sci. 2021, 22, 10522. [Google Scholar]
- Doerner, J.; Sallard, E.; Zhang, W.; Solanki, M.; Liu, J.; Ehrke-Schulz, E.; Zirngibl, H.; Lieber, A.; Ehrhardt, A. Novel group C oncolytic adenoviruses carrying a microRNA inhibitor demonstrate enhanced oncolytic activity in vitro and in vivoEnhanced oncolytic activity using a miRNA inhibitor. Mol. Cancer Ther. 2022, 21, 460–470. [Google Scholar] [CrossRef]
- Cattaneo, R.; Miest, T.; Shashkova, E.V.; Barry, M.A. Reprogrammed viruses as cancer therapeutics: Targeted, armed and shielded. Nat. Rev. Microbiol. 2008, 6, 529–540. [Google Scholar]
- Mok, W.; Boucher, Y.; Jain, R.K. Matrix metalloproteinases-1 and -8 improve the distribution and efficacy of an oncolytic virus. Cancer Res. 2007, 67, 10664–10668. [Google Scholar] [CrossRef]
- Bridle, B.W.; Stephenson, K.B.; Boudreau, J.E.; Koshy, S.; Kazdhan, N.; Pullenayegum, E.; Brunelliere, J.; Bramson, J.L.; Lichty, B.D.; Wan, Y. Potentiating Cancer Immunotherapy Using an Oncolytic Virus. Mol. Ther. 2010, 18, 1430–1439. [Google Scholar] [CrossRef]
- Rojas, J.J.; Guedan, S.; Searle, P.F.; Martinez-Quintanilla, J.; Gil-Hoyos, R.; Alcayaga-Miranda, F.; Cascallo, M.; Alemany, R. Minimal RB-responsive E1A promoter modification to attain potency, selectivity, and transgene-arming capacity in oncolytic adenoviruses. Mol. Ther. 2010, 18, 1960–1971. [Google Scholar]
- Sarkar, S.; Quinn, B.A.; Shen, X.N.; Dash, R.; Das, S.K.; Emdad, L.; Klibanov, A.L.; Wang, X.Y.; Pellecchia, M.; Sarkar, D.; et al. Therapy of prostate cancer using a novel cancer terminator virus and a small molecule BH-3 mimetic. Oncotarget 2015, 6, 10712. [Google Scholar] [CrossRef] [PubMed]
- Rauschhuber, C.; Mueck-Haeusl, M.; Zhang, W.; Nettelbeck, D.M.; Ehrhardt, A. RNAi suppressor P19 can be broadly exploited for enhanced adenovirus replication and microRNA knockdown experiments. Sci. Rep. 2013, 3, 1363. [Google Scholar] [CrossRef] [PubMed]
- Wodarz, D. Computational modeling approaches to the dynamics of oncolytic viruses. Wiley Interdiscip. Rev. Syst. Biol. Med. 2016, 8, 242–252. [Google Scholar] [CrossRef] [PubMed]
- Gevertz, J.L.; Wares, J.R. Developing a minimally structured mathematical model of cancer treatment with oncolytic viruses and dendritic cell injections. Comput. Math. Methods Med. 2018, 2018, 8760371. [Google Scholar] [CrossRef]
- Mahasa, K.J.; Eladdadi, A.; de Pillis, L.; Ouifki, R. Oncolytic potency and reduced virus tumor-specificity in oncolytic virotherapy. A mathematical modelling approach. PLoS ONE 2017, 12, e0184347. [Google Scholar]
- Storey, K.M.; Lawler, S.E.; Jackson, T.L. Modeling Oncolytic Viral Therapy, Immune Checkpoint Inhibition, and the Complex Dynamics of Innate and Adaptive Immunity in Glioblastoma Treatment. Front. Physiol. 2020, 11, 151. [Google Scholar] [CrossRef]
- Eftimie, R.; Eftimie, G. Investigating Macrophages Plasticity Following Tumour-Immune Interactions During Oncolytic Therapies. Acta Biotheoret. 2020, 67, 321–359. [Google Scholar] [CrossRef]
- Parra-Guillen, Z.P.; Freshwater, T.; Cao, Y.; Mayawala, K.; Zalba, S.; Garrido, M.J.; de Alwis, D.; Troconiz, I.F. Mechanistic Modeling of a Novel Oncolytic Virus, V937, to Describe Viral Kinetic and Dynamic Processes Following Intratumoral and Intravenous Administration. Front. Pharmacol. 2021, 12, 705443. [Google Scholar]
- Okamoto, K.W.; Amarasekare, P.; Petty, I.T. Modeling oncolytic virotherapy: Is complete tumor-tropism too much of a good thing? J. Theor. Biol. 2014, 358, 166–178. [Google Scholar] [CrossRef]
- Al-Johani, N.; Simbawa, E.; Al-Tuwairqi, S. Modeling the spatiotemporal dynamics of virotherapy and immune response as a treatment for cancer. Comm. Math. Biol. Neurosci. 2019, 2019, 28. [Google Scholar] [CrossRef]
- Wein, L.M.; Wu, J.T.; Kirn, D.H. Validation and analysis of a mathematical model of a replication-competent oncolytic virus for cancer treatment: Implications for virus design and delivery. Cancer Res. 2003, 63, 1317–1324. [Google Scholar] [PubMed]
- Elaiw, A.; Al-Agha, A. Analysis of a delayed and diffusive oncolytic M1 virotherapy model with immune response. Nonlin. Anal. Real World Appl. 2020, 55, 103116. [Google Scholar] [CrossRef]
- Paiva, L.R.; Binny, C.; Ferreira, S.C.; Martins, M.L. A Multiscale Mathematical Model for Oncolytic Virotherapy. Cancer Res. 2009, 60, 1205–1211. [Google Scholar] [CrossRef]
- Eftimie, R.; Dushoff, J.; Bridle, B.W.; Bramson, J.L.; Earn, D.J. Multi-Stability and Multi-Instability Phenomena in a Mathematical Model of Tumor-Immune-Virus Interactions. Bull. Math. Biol. 2011, 73, 2932–2961. [Google Scholar] [CrossRef] [PubMed]
- Malinzi, J.; Sibanda, P.; Mambili-Mamboundou, H. Analysis of virotherapy in solid tumor invasion. Math. Biosci. 2015, 263, 102–110. [Google Scholar] [CrossRef] [PubMed]
- Zhang, J.; Zhang, Q.; Liu, Z.; Wang, J.; Shi, F.; Su, J.; Wang, T.; Wang, F. Efficacy and Safety of Recombinant Human Adenovirus Type 5 (H101) in Persistent, Recurrent, or Metastatic Gynecologic Malignancies: A Retrospective Study. Front. Oncol. 2022, 12, 877155. [Google Scholar] [CrossRef] [PubMed]
- Baccam, P.; Beauchemin, C.; Macken, C.A.; Hayden, F.G.; Perelson, A.S. Kinetics of influenza A virus infection in humans. J. Virol. 2006, 80, 7590–7599. [Google Scholar] [CrossRef]
- Pawelek, K.A.; Huynh, G.T.; Quinlivan, M.; Cullinane, A.; Rong, L.; Perelson, A.S. Modeling Within-Host Dynamics of Influenza Virus Infection Including Immune Responses. PLoS Comp. Biol. 2012, 8, e1002588. [Google Scholar] [CrossRef]
- Handel, A.; Longini, I.M.; Antia, R. Towards a quantitative understanding of the within-host dynamics of influenza A infections. J. R. Soc. Interface 2010, 7, 35–47. [Google Scholar] [CrossRef]
- Yu, J.L.; Jang, S.R.; Liu, K.Y. Exploring the Interactions of Oncolytic Viral Therapy and Immunotherapy of Anti-CTLA-4 for Malignant Melanoma Mice Model. Cells 2023, 12, 507. [Google Scholar] [CrossRef]
- Rodriguez-Brenes, I.A.; Hofacre, A.; Fan, H.; Wodarz, D. Complex Dynamics of Virus Spread from Low Infection Multiplicities: Implications for the Spread of Oncolytic Viruses. PLoS Comp. Biol. 2017, 13, e1005241. [Google Scholar] [CrossRef]
- Gao, F.; Han, L. Implementing the Nelder-Mead simplex algorithm with adaptive parameters. Comput. Optim. Appl. 2012, 51, 259–277. [Google Scholar] [CrossRef]
- Hunter, J.D. Matplotlib: A 2D graphics environment. Comput. Sci. Eng. 2007, 9, 90–95. [Google Scholar] [CrossRef]
- Efron, B.; Tibshirani, R. Bootstrap methods for standard errors, confidence intervals, and other measures of statistical accuracy. Stat. Sci. 1986, 1, 54–75. [Google Scholar] [CrossRef]
- Bagheri, N.; Shiina, M.; Lauffenburger, D.A.; Korn, W.M. A Dynamical Systems Model for Combinatorial Cancer Therapy Enhances Oncolytic Adenovirus Efficacy by MEK-Inhibition. PLoS Comp. Biol. 2011, 7, e1001085. [Google Scholar] [CrossRef]
- Akaike, H. A new look at the statistical model identification. IEEE Trans. Autom. Control 1974, 19, 716–723. [Google Scholar] [CrossRef]
- Sakamoto, Y.; Ishiguro, M.; Kitagawa, G. Akaike Information Criterion Statistics; D. Reidel: Dordrecht, The Netherlands, 1986; Volume 81, p. 26853. [Google Scholar]
- Parra-Guillén, Z.P.; Sancho-Araiz, A.; Mayawala, K.; Zalba, S.; Garrido, M.J.; de Alwis, D.; Troconiz, I.F.; Freshwater, T. Assessment of clinical response to V937 oncolytic virus after intravenous or intratumoral administration using physiologically-based modelling. Clin. Pharmacol. Ther. 2023, 114, 623–632. [Google Scholar] [CrossRef]
- Prestwich, R.J.; Errington, F.; Diaz, R.M.; Pandha, H.S.; Harrington, K.J.; Melcher, A.A.; Vile, R.G. The case of oncolytic viruses versus the immune system: Waiting on the judgment of Solomon. Hum. Gene Ther. 2009, 20, 1119–1132. [Google Scholar]
- Godlewski, J.; Farhath, M.; Ricklefs, F.L.; Passaro, C.; Kiel, K.; Nakashima, H.; Chiocca, E.A.; Bronisz, A. Oncolytic Virus Therapy Alters the Secretome of Targeted Glioblastoma Cells. Cancers 2021, 13, 1287. [Google Scholar] [CrossRef]
- Ying, L.; Cheng, H.; Xiong, X.W.; Yuan, L.; Peng, Z.H.; Wen, Z.W.; Kai, L.J.; Xiao, X.; Jing, C.; Qian, T.Y.; et al. Interferon alpha antagonizes the anti-hepatoma activity of the oncolytic virus M1 by stimulating anti-viral immunity. Oncotarget 2017, 8, 24694–24705. [Google Scholar] [CrossRef]
- Kurozumi, K.; Hardcastle, J.; Thakur, R.; Yang, M.; Christoforidis, G.; Fulci, G.; Hochberg, F.H.; Weissleder, R.; Carson, W.; Chiocca, E.A.; et al. Effect of tumor microenvironment modulation on the efficacy of oncolytic virus therapy. J. Nat. Cancer Inst. 2007, 99, 1768–1781. [Google Scholar] [CrossRef]
- Achard, C.; Boisgerault, N.; Delaunay, T.; Roulois, D.; Nedellec, S.; Royer, P.J.; Pain, M.; Combredet, C.; Mesel-Lemoine, M.; Cellerin, L.; et al. Sensitivity of human pleural mesothelioma to oncolytic measles virus depends on defects of the type I interferon response. Oncotarget 2015, 6, 44892–44904. [Google Scholar] [CrossRef] [PubMed]
- Larrieux, A.; Sanjuan, R. Cellular resistance to an oncolytic virus is driven by chronic activation of innate immunity. iScience 2022, 26, 105749. [Google Scholar] [CrossRef] [PubMed]
- Stewart, J.; Ahmed, M.; Northrup, S.; Willingham, M.; Lyles, D. Vesicular stomatitis virus as a treatment for colorectal cancer. Cancer Gene Ther. 2011, 18, 837–849. [Google Scholar] [CrossRef] [PubMed]
- Stojdl, D.; Lichty, B.; Knowles, S.; Marius, R.; Atkins, H.; Sonenberg, N.; Bell, J. Exploiting tumor-specific defects in the interferon pathway with a previously unknown oncolytic virus. Nat. Med. 2000, 6, 821–825. [Google Scholar] [CrossRef] [PubMed]
- Felt, S.A.; Moerdyk-Schauwecker, M.J.; Grdzelishvili, V.Z. Induction of apoptosis in pancreatic cancer cells by vesicular stomatitis virus. Virology 2015, 474, 163–173. [Google Scholar] [CrossRef] [PubMed]
- Jenner, A.L.; Yun, C.O.; Kim, P.S.; Coster, A.C. Mathematical modelling of the interaction between cancer cells and an oncolytic virus: Insights into the effects of treatment protocols. Bull. Math. Biol. 2018, 80, 1615–1629. [Google Scholar] [CrossRef]
- Lee, T.; Jenner, A.L.; Kim, P.S.; Lee, J. Application of control theory in a delayed-infection and immune-evading oncolytic virotherapy. Math. Biosci. Eng. 2020, 17, 2361–2383. [Google Scholar] [CrossRef]
- Eftimie, R.; Macnamara, C.; Dushoff, J.; Bramson, J.; Earn, D. Bifurcations and Chaotic Dynamics in a Tumour-Immune-Virus System. Math. Model. Nat. Phenom. 2016, 11, 65–85. [Google Scholar] [CrossRef]
- Kim, D.; Shin, D.H.; Sung, C.K. The Optimal Balance between Oncolytic Viruses and Natural Killer Cells: A Mathematical Approach. Mathematics 2022, 10, 3370. [Google Scholar] [CrossRef]
- Senekal, N.S.; Mahasa, K.J.; Eladdadi, A.; de Pillis, L.; Ouifki, R. Natural Killer Cells Recruitment in Oncolytic Virotherapy: A Mathematical Model. Bull. Math. Biol. 2021, 83, 75. [Google Scholar] [CrossRef] [PubMed]
- Friedman, A.; Lai, X. Combination therapy for cancer with oncolytic virus and checkpoint inhibitor: A mathematical model. PLoS ONE 2018, 13, e0192449. [Google Scholar] [CrossRef] [PubMed]
- Kang, S.; Kim, J.H.; Kim, S.Y.; Kang, D.; Je, S.; Song, J.J. Establishment of a mouse melanoma model system for the efficient infection and replication of human adenovirus type 5-based oncolytic virus. Biochem. Biophys. Res. Comm. 2014, 453, 480–485. [Google Scholar] [CrossRef]
- Han, Z.; Joo, Y.; Lee, J.; Ko, S.; Xu, R.; Oh, G.H.; Choi, S.; Hong, J.A.; Choi, H.J.; Son, J.J. High levels of Daxx due to low cellular levels of HSP25 in murine cancer cells result in inefficient adenovirus replication. Exp. Mol. Med. 2019, 51, 122. [Google Scholar] [CrossRef]
- Zschaler, J.; Schlorke, D.; Arnhold, J. Differences in Innate Immune Response between Man and Mouse. Crit. Rev. Immunol. 2014, 34, 433–454. [Google Scholar] [CrossRef]
- Sellers, R.S. Translating Mouse Models: Immune Variation and Efficacy Testing. Crit. Rev. Immunol. 2017, 45, 134–145. [Google Scholar] [CrossRef] [PubMed]
- Diekmann, O.; Heesterbeek, J.A.P.; Roberts, M.G. The construction of next-generation matrices for compartmental epidemic models. J. R. Soc. Interface 2010, 7, 873–885. [Google Scholar] [CrossRef]
- Foreman-Mackey, D. Corner.py: Scatterplot matrices in python. J. Open Source Softw. 2016, 1, 24. [Google Scholar] [CrossRef]


| Parameter | Meaning |
|---|---|
| Viral infection rate | |
| Initial amount of virus | |
| k | Transition rate from eclipse to infectious cells |
| Death rate of infectious cells | |
| p | Viral production rate |
| Sensitivity to interferon | |
| c | Viral clearance rate |
| Interferon clearance rate |
| Adenovirus | k | p | c | SSR | |||
|---|---|---|---|---|---|---|---|
| /day | /days | /days | /days·mm | /days | |||
| Ad1d24.P19 | 15.68 | 0.02882 | 0.03211 | 53,730 | |||
| 95% CI | (5.402–9.487) | 11.28–19.97 | 0.0–0.09937 | 0.0–0.2212 | (0–1.345) | (3.923–49.29) | 20,460–91,360 |
| Ad2d24.P19 | 0.4754 | 0.4621 | 0.04066 | 0.4067 | 0.02928 | 30,240 | |
| 95% CI | 0.2514–0.8510 | 0.2600–0.8649 | 0–2.325 | 0–1.494 | (0–1.256) | 0.01892–0.06247 | 15,100–37,250 |
| Ad5.P19 | 0.2704 | 0.3151 | 0.04268 | 0.4268 | 105,000 | ||
| 95% CI | 0.1215–0.5603 | 0.1463–0.6748 | 0.0–1.625 | 0.0–0.9863 | (0.0–9.800) | (0.0–9.683) | 50,200–133,200 |
| Ad6d24.P19 | 286.3 | 200.0 | 0.03025 | 12,530 | |||
| 95% CI | 195.6–432.7 | (55.35–1.201) | 0–0.01935 | (6.709–13,540,000) | (0–6.589) | 0.02321–0.05481 | 6741–14,980 |
| H101 | 107.1 | 0.1321 | 0.1321 | 1.704 | 0.06521 | 3511 | |
| 95% CI | 50.25–270.5 | (7.213–40.17) | 0.01490–3.517 | (4.935–2753) | (0–3.275) | 0.03307–0.1552 | 1337–4795 |
| Adenovirus | V(0) | k | p | c | SSR | ||||
|---|---|---|---|---|---|---|---|---|---|
| /day | /day | /day | /days · mm | /day | /day | ||||
| Ad1d24.P19 | 14.51 | 0.07406 | 0.07406 | 47.58 | 0.06857 | 41,540 | |||
| 95% CI | 1.691–76.10 | 0.0–0.2957 | 0.01–0.6070 | (1.605–62.22) × | (0–4.427) | 1.841–1042 | (2.361–65.55) × | (0–1.637) × | 19,420–120,700 |
| Ad2d24.P19 | 39.00 | 0.2346 | 0.2333 | 0.02650 | 58,910 | 0.07022 | 17,790 | ||
| 95% CI | 10.93–100.9 | (1.459–18,480) × | 0.08211–1.161 | 0.08950–0.6671 | (9.445–1108) × | 2480–246,700 | 0.04706–0.1565 | (5.693–131,800) × | 6077–26,180 |
| Ad5.P19 | 7.297 | 0.3198 | 0.3198 | 22.87 | 0.2127 | 15,000 | |||
| 95% CI | 2.833–34.15 | 0.002776–0.03845 | 0.1335–3.397 | 0.1211–2.588 | (1.917–24.92) × | 7.208–84.24 | 0.1046–1.321 | (6.966–142,700) × | 6554–18,850 |
| Ad6d24.P19 | 45.35 | 0.3189 | 0.3162 | 6295 | 0.04982 | 4640 | |||
| 95% CI | 22.46–114.2 | (3.005–169.6) × | 0.08875–1.923 | 0.1195–0.9148 | (1.605–64.76) × | 679.2–21,930 | 0.03503–0.1028 | (7.127–691,000) × | 2041–6123 |
| H101 | 0.4649 | 0.4647 | 2.884 | 0.3752 | 2826 | ||||
| 95% CI | (1.939–28.44) × | 0– | 0.2496–2.115 | 0.2428–1.390 | (4.176–2043) × | 0.02134–10.85 | 0.1542–0.9240 | 0–1.335 × | 978.5–3644 |
| Adenovirus | With Immune Response | Without Immune Response |
|---|---|---|
| Ad1d24.P19 | 305.7 | 312.5 |
| Ad2d24.P19 | 208.1 | 219.5 |
| Ad5.P19 | 181.3 | 227.9 |
| Ad6d24.P19 | 167.2 | 193.0 |
| H101 | 102.9 | 102.6 |
Disclaimer/Publisher’s Note: The statements, opinions and data contained in all publications are solely those of the individual author(s) and contributor(s) and not of MDPI and/or the editor(s). MDPI and/or the editor(s) disclaim responsibility for any injury to people or property resulting from any ideas, methods, instructions or products referred to in the content. |
© 2023 by the authors. Licensee MDPI, Basel, Switzerland. This article is an open access article distributed under the terms and conditions of the Creative Commons Attribution (CC BY) license (https://creativecommons.org/licenses/by/4.0/).
Share and Cite
Guo, E.; Dobrovolny, H.M. Mathematical Modeling of Oncolytic Virus Therapy Reveals Role of the Immune Response. Viruses 2023, 15, 1812. https://doi.org/10.3390/v15091812
Guo E, Dobrovolny HM. Mathematical Modeling of Oncolytic Virus Therapy Reveals Role of the Immune Response. Viruses. 2023; 15(9):1812. https://doi.org/10.3390/v15091812
Chicago/Turabian StyleGuo, Ela, and Hana M. Dobrovolny. 2023. "Mathematical Modeling of Oncolytic Virus Therapy Reveals Role of the Immune Response" Viruses 15, no. 9: 1812. https://doi.org/10.3390/v15091812