Article

Transcription Factor Driven Gene Regulation in COVID-19 Patients

1
Institute for System Analysis and Computer Science “Antonio Ruberti”, National Research Council of Italy, 00185 Rome, Italy
2
Faculty of Mathematics, Informatics and Mechanics, University of Warsaw, 02-097 Warsaw, Poland
3
Department of Computer Science and Information Technology, Institute of Technical Education and Research, Siksha ‘O’ Anusandhan (Deemed to be University), Bhubaneswar 751030, India
4
Department of Biological, Geological and Environmental Sciences, Alma Mater Studiorum—University of Bologna, 40138 Bologna, Italy
5
Department of Computer Science and Engineering, National Institute of Technical Teachers’ Training and Research, Kolkata 700106, India
*
Author to whom correspondence should be addressed.
These authors contributed equally to this work.
Viruses 2023, 15(5), 1188; https://doi.org/10.3390/v15051188
Submission received: 19 April 2023 / Revised: 11 May 2023 / Accepted: 15 May 2023 / Published: 18 May 2023
(This article belongs to the Special Issue Emerging Concepts in SARS-CoV-2 Biology and Pathology)

Abstract

:

Simple Summary

The present work aims to shed light on the role that Transcription Factors (TFs) play in the alteration of gene expression and regulation driven by COVID-19 infection. In this regard, 19 human transcription factors were selected, since they are predicted to target and potentially regulate human proteins interacting with Spike glycoprotein of SARS-CoV-2. Thirty-one human genes, predicted as targets of these TFs, were selected since they showed statistically significant differences in their correlation values with respect to TFs between healthy and COVID-19 patients. It can be hypothesised that they are major players in the alteration of the regulation pattern driven by COVID-19. In this light, together with the 19 identified TFs, the 31 human genes be considered as potential targets to counteract COVID-19 infection.

Abstract

SARS-CoV-2 and its many variants have caused a worldwide emergency. Host cells colonised by SARS-CoV-2 present a significantly different gene expression landscape. As expected, this is particularly true for genes that directly interact with virus proteins. Thus, understanding the role that transcription factors can play in driving differential regulation in patients affected by COVID-19 is a focal point to unveil virus infection. In this regard, we have identified 19 transcription factors which are predicted to target human proteins interacting with Spike glycoprotein of SARS-CoV-2. Transcriptomics RNA-Seq data derived from 13 human organs are used to analyse expression correlation between identified transcription factors and related target genes in both COVID-19 patients and healthy individuals. This resulted in the identification of transcription factors showing the most relevant impact in terms of most evident differential correlation between COVID-19 patients and healthy individuals. This analysis has also identified five organs such as the blood, heart, lung, nasopharynx and respiratory tract in which a major effect of differential regulation mediated by transcription factors is observed. These organs are also known to be affected by COVID-19, thereby providing consistency to our analysis. Furthermore, 31 key human genes differentially regulated by the transcription factors in the five organs are identified and the corresponding KEGG pathways and GO enrichment are also reported. Finally, the drugs targeting those 31 genes are also put forth. This in silico study explores the effects of transcription factors on human genes interacting with Spike glycoprotein of SARS-CoV-2 and intends to provide new insights to inhibit the virus infection.

1. Introduction

COVID-19, the disease caused by SARS-CoV-2, has been disrupting our lives for more than two years now. Viral infection significantly alters host gene expression, which also changes the complex regulation system driven by Transcription Factors (TF). Studying TFs that have an impact on the regulation of genes involved in SARS-CoV-2 infection, as well as their differential role in COVID-19 patients and healthy individuals, can help us to understand how the virus acts so that we can fight against it.
According to [1,2], CoV infection such as SARS-CoV-1, MERS-CoV and SARS-CoV-2 affect host cell transcription, as well as its translation. Additionally, van Hemert et al. [3] has shown the involvement of host TFs in the replication and transcription activity of MERS-CoV. In this regard, Bari et al. [4] investigated human TFs that can bind with the SARS-CoV-2 sequence. Mosharaf et al. [5] explored key regulatory TFs of differentially expressed hub genes (hub-DEGs) and, based on a higher degree of topological measures, selected FOXC1, GATA2, SRF, FOXL1 and YY1 as the top five key regulatory TFs. Thereafter, they considered 10 hub-proteins corresponding to the hub-DEGs and their regulatory 5 key TFs-proteins as drug target receptors and performed their docking analysis with the SARS-CoV-2 3CL protease-guided top listed 90 FDA-approved drugs. In [6], Sardar et al. have considered an interaction network of 2197 human miRNAs leading to the identification of 51 miRNAs interacting with 77 TFs inducing activation or repression, as well as affecting gene expression of linked genes. Chen et al. [7] identified TFs such as CDX2, HNF4, SMAD4 and GATA that bind to the loci of ACE2 and TMPRSS2 in human intestines, having a very big impact on their gene expressions. In [8], Xu et al. evaluated TF such as KLF2 as a therapeutic target for COVID-19, which induced endothelial dysfunction. According to their study, the expression of KLF2 was reduced in endothelial cells of patients, and thus augmenting KLF2 levels may be therapeutically beneficial. Chapola et al. [9] have identified COVID-19 Master Regulators (MRs) from lung tissues of patients who developed the severe form of the disease. Such MRs include transcription factors such as TAL1, TEAD4, EPAS1, ATOH8, ERG, and ARNTL2.
Motivated by the literature, in this work, we have identified 19 TFs targeting the human proteins interacting with Spike glycoprotein of SARS-CoV-2 [10]. Subsequently, gene expressions of COVID-19 patients and healthy individuals are considered for 13 organs such as the blood, brain, eye, heart, intestine, kidney, liver, lung, pancreas, nasopharynx, respiratory tract, stomach, and uterus. The gene expressions are then used to find the correlations between TFs and the corresponding target genes, providing related p-values for each organ considering both the datasets of COVID-19 patients and healthy individuals. This led to the identification of key TFs and the most affected organs such as the blood, heart, lung, nasopharynx and respiratory tract. Thereafter, the key genes differentially regulated by the TFs in the five organs were identified based on ranking. This resulted in the identification of 31 genes in the five organs. Furthermore, the KEGG pathways and GO analysis are reported for the 31 identified genes. The KEGG enriched pathways include Vibrio Cholerae infection, Pathogenic Escheria coli infection, Coronavirus disease, AMPK signaling pathway etc. Finally, drugs targeting the identified 31 genes are reported using Enrichr tool [11,12]. In this regard, Amikacin, Ipratropium Bromide, and Captopril are some of the important drugs targeting the 31 genes in order to inhibit the spread of the virus. To the best of our knowledge, this is the first study to provide a global view, considering 13 different organs, of the role that human TFs can play in the differential regulation of genes linked to COVID infection through direct interaction with viral Spike protein. Furthermore, the use of very strict thresholds on P-value tests guarantees reliable results supported by a solid statistical analysis.

2. Materials and Methods

This section elaborates the data preparation followed by the discussion of the pipeline of the proposed work.

2.1. Data Preparation

In this work, initially, 317 human proteins interacting with Spike glycoprotein of SARS-CoV-2 are considered based on [10]. Thereafter, the TFs targeting the human genes are identified using the procedure mentioned in Section 2.2.1 (the reader can also refer to [13] for more details). Subsequently, mRNA expression data of the TFs and the target human genes for 784 COVID-19 patients and 425 healthy individuals are downloaded from COVID19db [14]. COVID19db has integrated 95 human transcriptomic datasets across 13 organs. The gene expression values of the 13 organs, including the blood, brain, eye, heart, intestine, kidney, liver, lung, pancreas, nasopharynx, respiratory tract, stomach, and uterus, are considered in this work. Please note that the expression data are log2 normalised. The statistics for the data are presented in Table 1. All the expression data are provided in the Supplementary Materials as excel files.

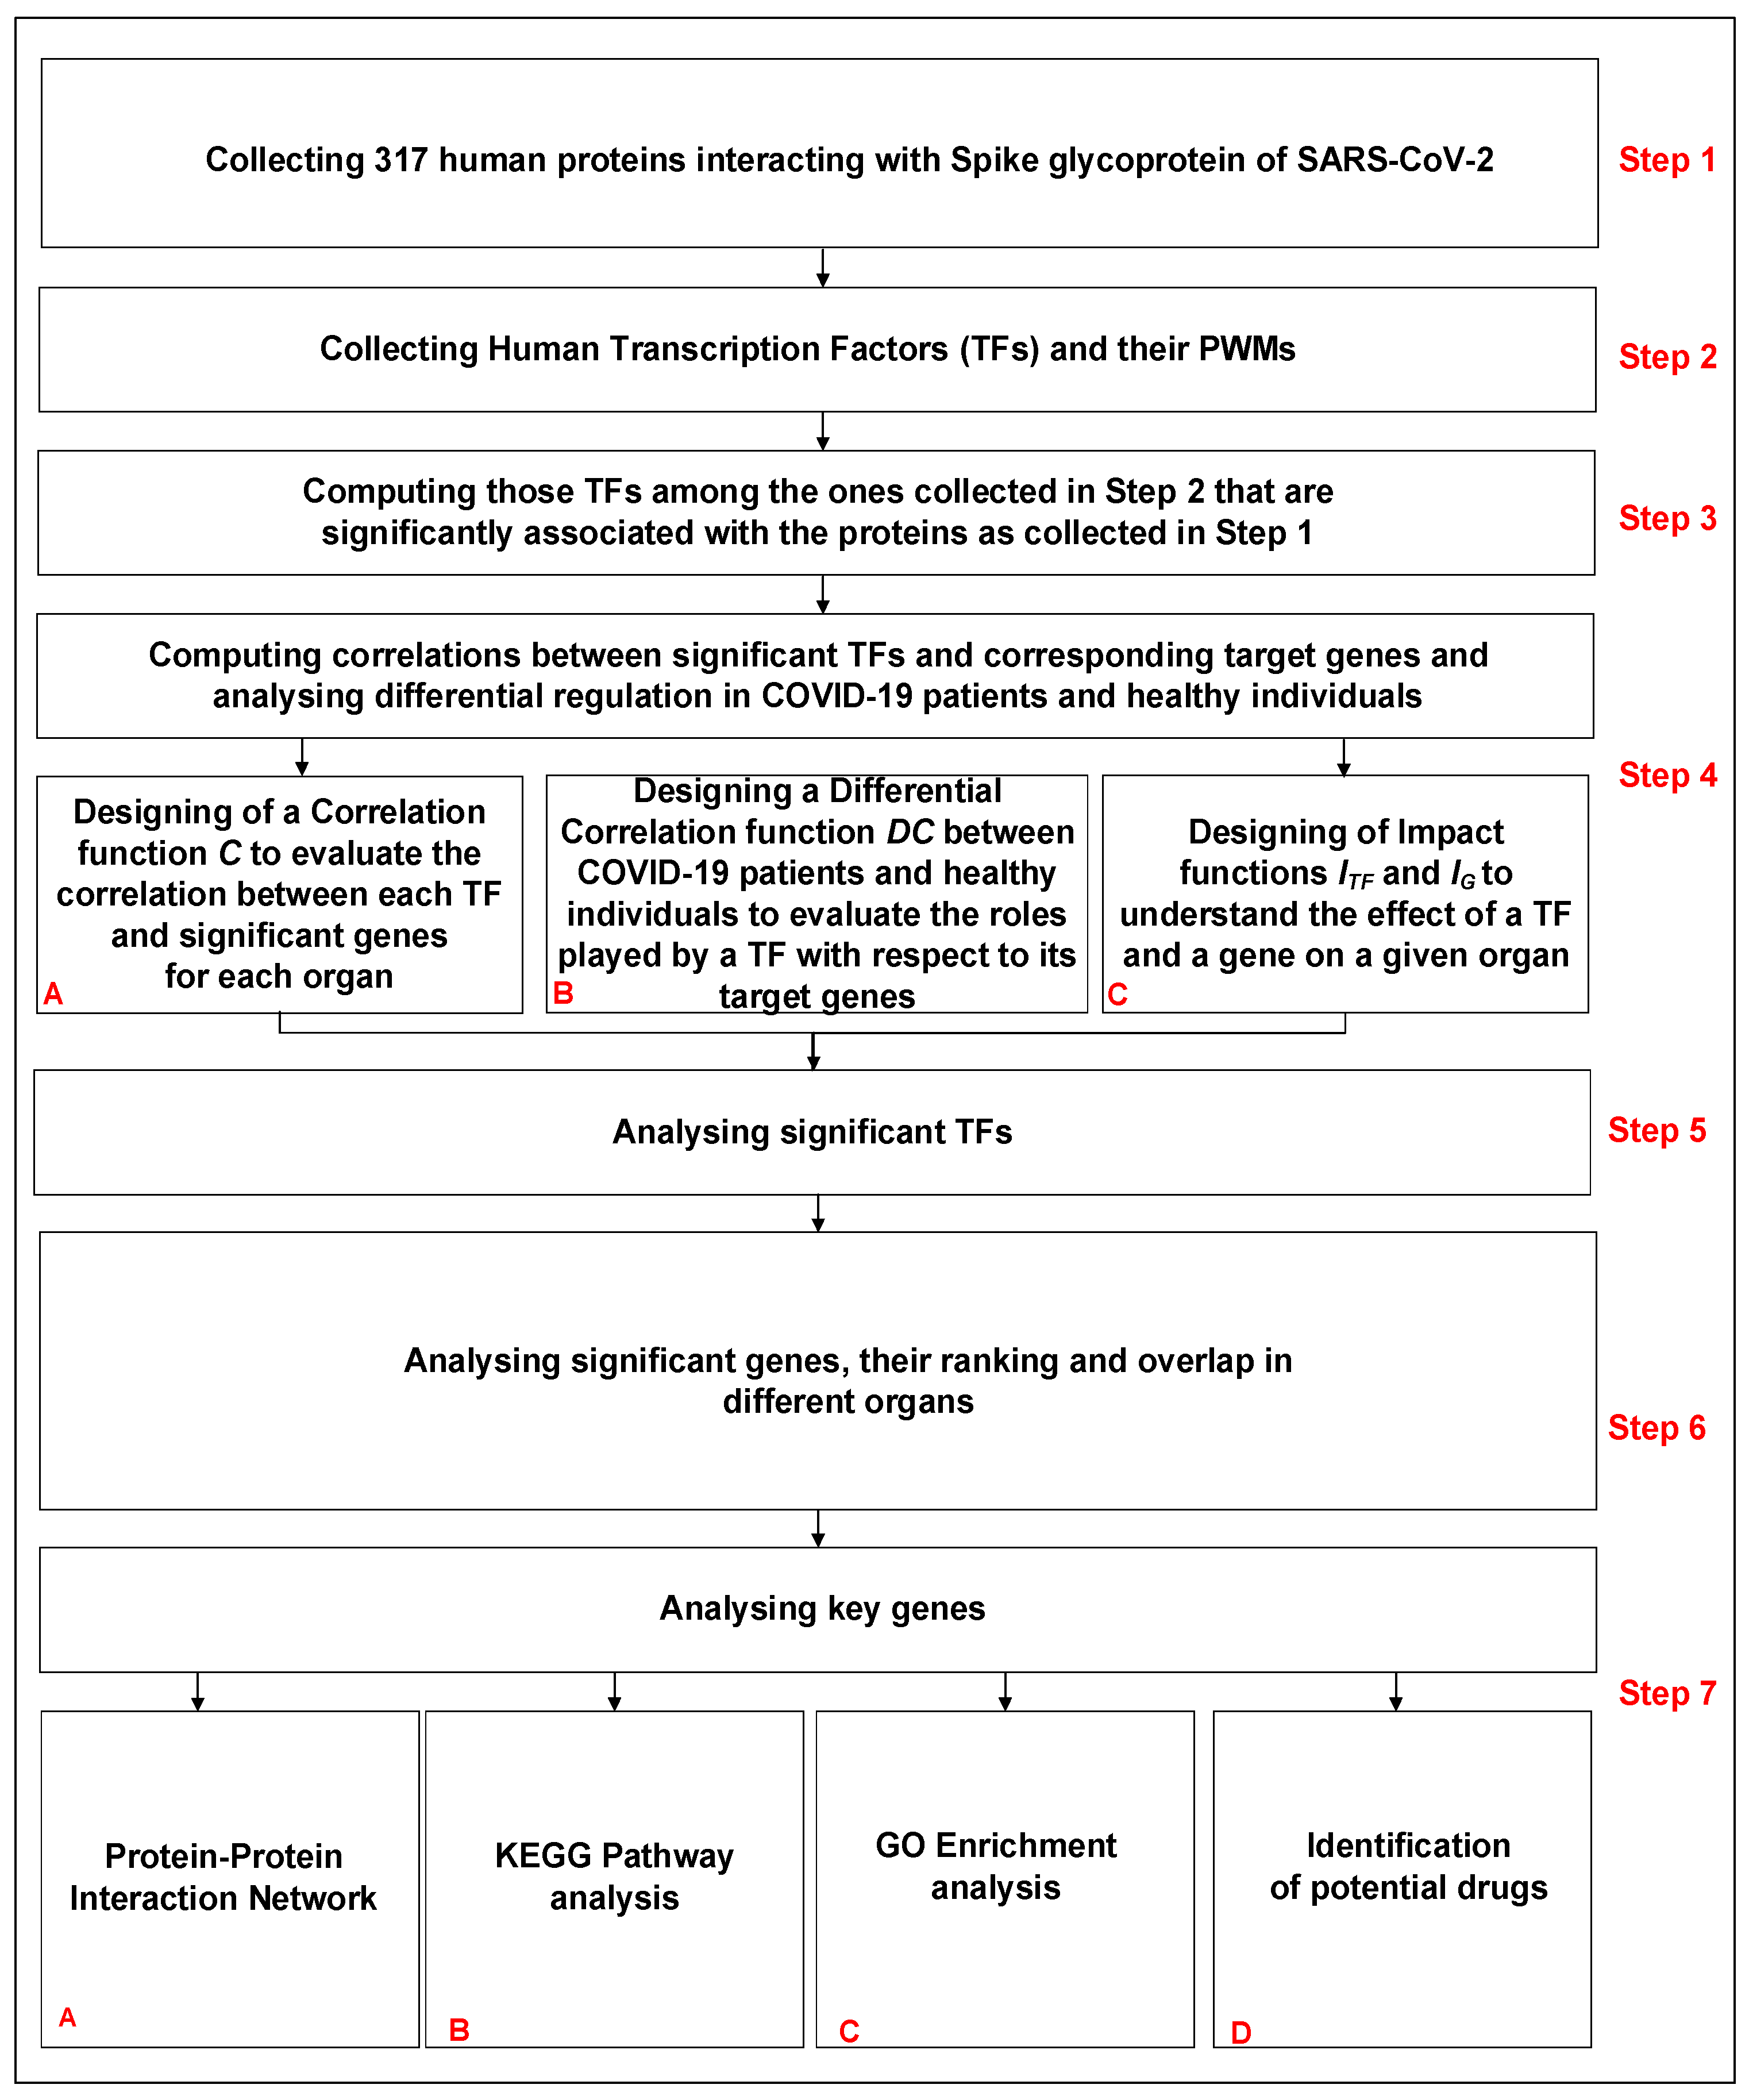
2.2. Pipeline of the Work

The pipeline of the work is shown in Figure 1. It consists of seven steps. The first four are related to the collection of data and the methodology, while the last three are related to the analysis and biological interpretation of the obtained results. The steps are as follows:
  • Step 1: Collecting human proteins interacting with Spike glycoprotein of SARS-CoV-2.
  • Step 2: Collecting human Transcription Factors and their PWMs.
  • Step 3: Computing those TFs among the ones collected in Step 2 that are significantly associated with the proteins collected in Step 1.
  • Step 4: Computing correlations between significant TFs (Step 3) and corresponding target genes and analysing differential regulation in COVID-19 patients and healthy individuals.
  • Step 5: Analysing significant TFs identified in Step 3.
  • Step 6: Analysing significant genes, their ranking and overlap in different organs.
  • Step 7: Analysing key genes.
Please note that the results obtained from Steps 1–4 are analysed in Steps 5–7.

2.2.1. Identification of Significant TFs

Initially, 317 human proteins which interact with Spike glycoprotein of SARS-CoV-2 are considered (Step 1 of Figure 1). Thereafter, a complete list of 23,459 human genes and 73,432 related transcripts is collected. Promoter sequences (2000 base pairs upstream of the Transcription Start Site are considered according to [15]) of the collected genes/transcripts are retrieved using the package “TxDb Hsapiens UCSC.hg19.KnownGene” version 3.2.2 of R software (https://bioconductor.org/packages/release/data/annotation/html/TxDb.Hsapiens.UCSC.hg19.knownGene.html, accessed on 22 January 2022). A complete list of known and reliable human 626 TFs is selected and the related consensus pattern sequences expressed in terms of Position Weight Matrices (PWMs) are retrieved via the JASPAR database [16] (Step 2 of Figure 1). Transcription Factor binding Sites (TFBSs) associated with each considered human TF are predicted through the matchPWM() function, integrated into the Biostrings R library (https://bioconductor.org/packages/release/bioc/html/Biostrings.html, accessed on 22 January 2022), with a threshold of 0.90. Hypergeometric tests are then performed to assess the association between a given TF and the input set of genes (Step 3 of Figure 1). Such tests are performed for each selected TF in order to evaluate TFBS enrichment in the promoter regions of COVID-19 associated human genes. In other words, the number of genes in the pool set associated with COVID-19 showing at least one TFBS in the promoter region is compared with the number of genes showing at least one TFBS in the set of all human genes, thereby providing the corresponding p-value. The obtained p-values are then adjusted using Bonferroni’s correction. Significant TFs are finally selected by setting a strict threshold corresponding to an adjusted p-value of < 5 × 10 2 . The whole procedure is fully described and the software is available in [13].

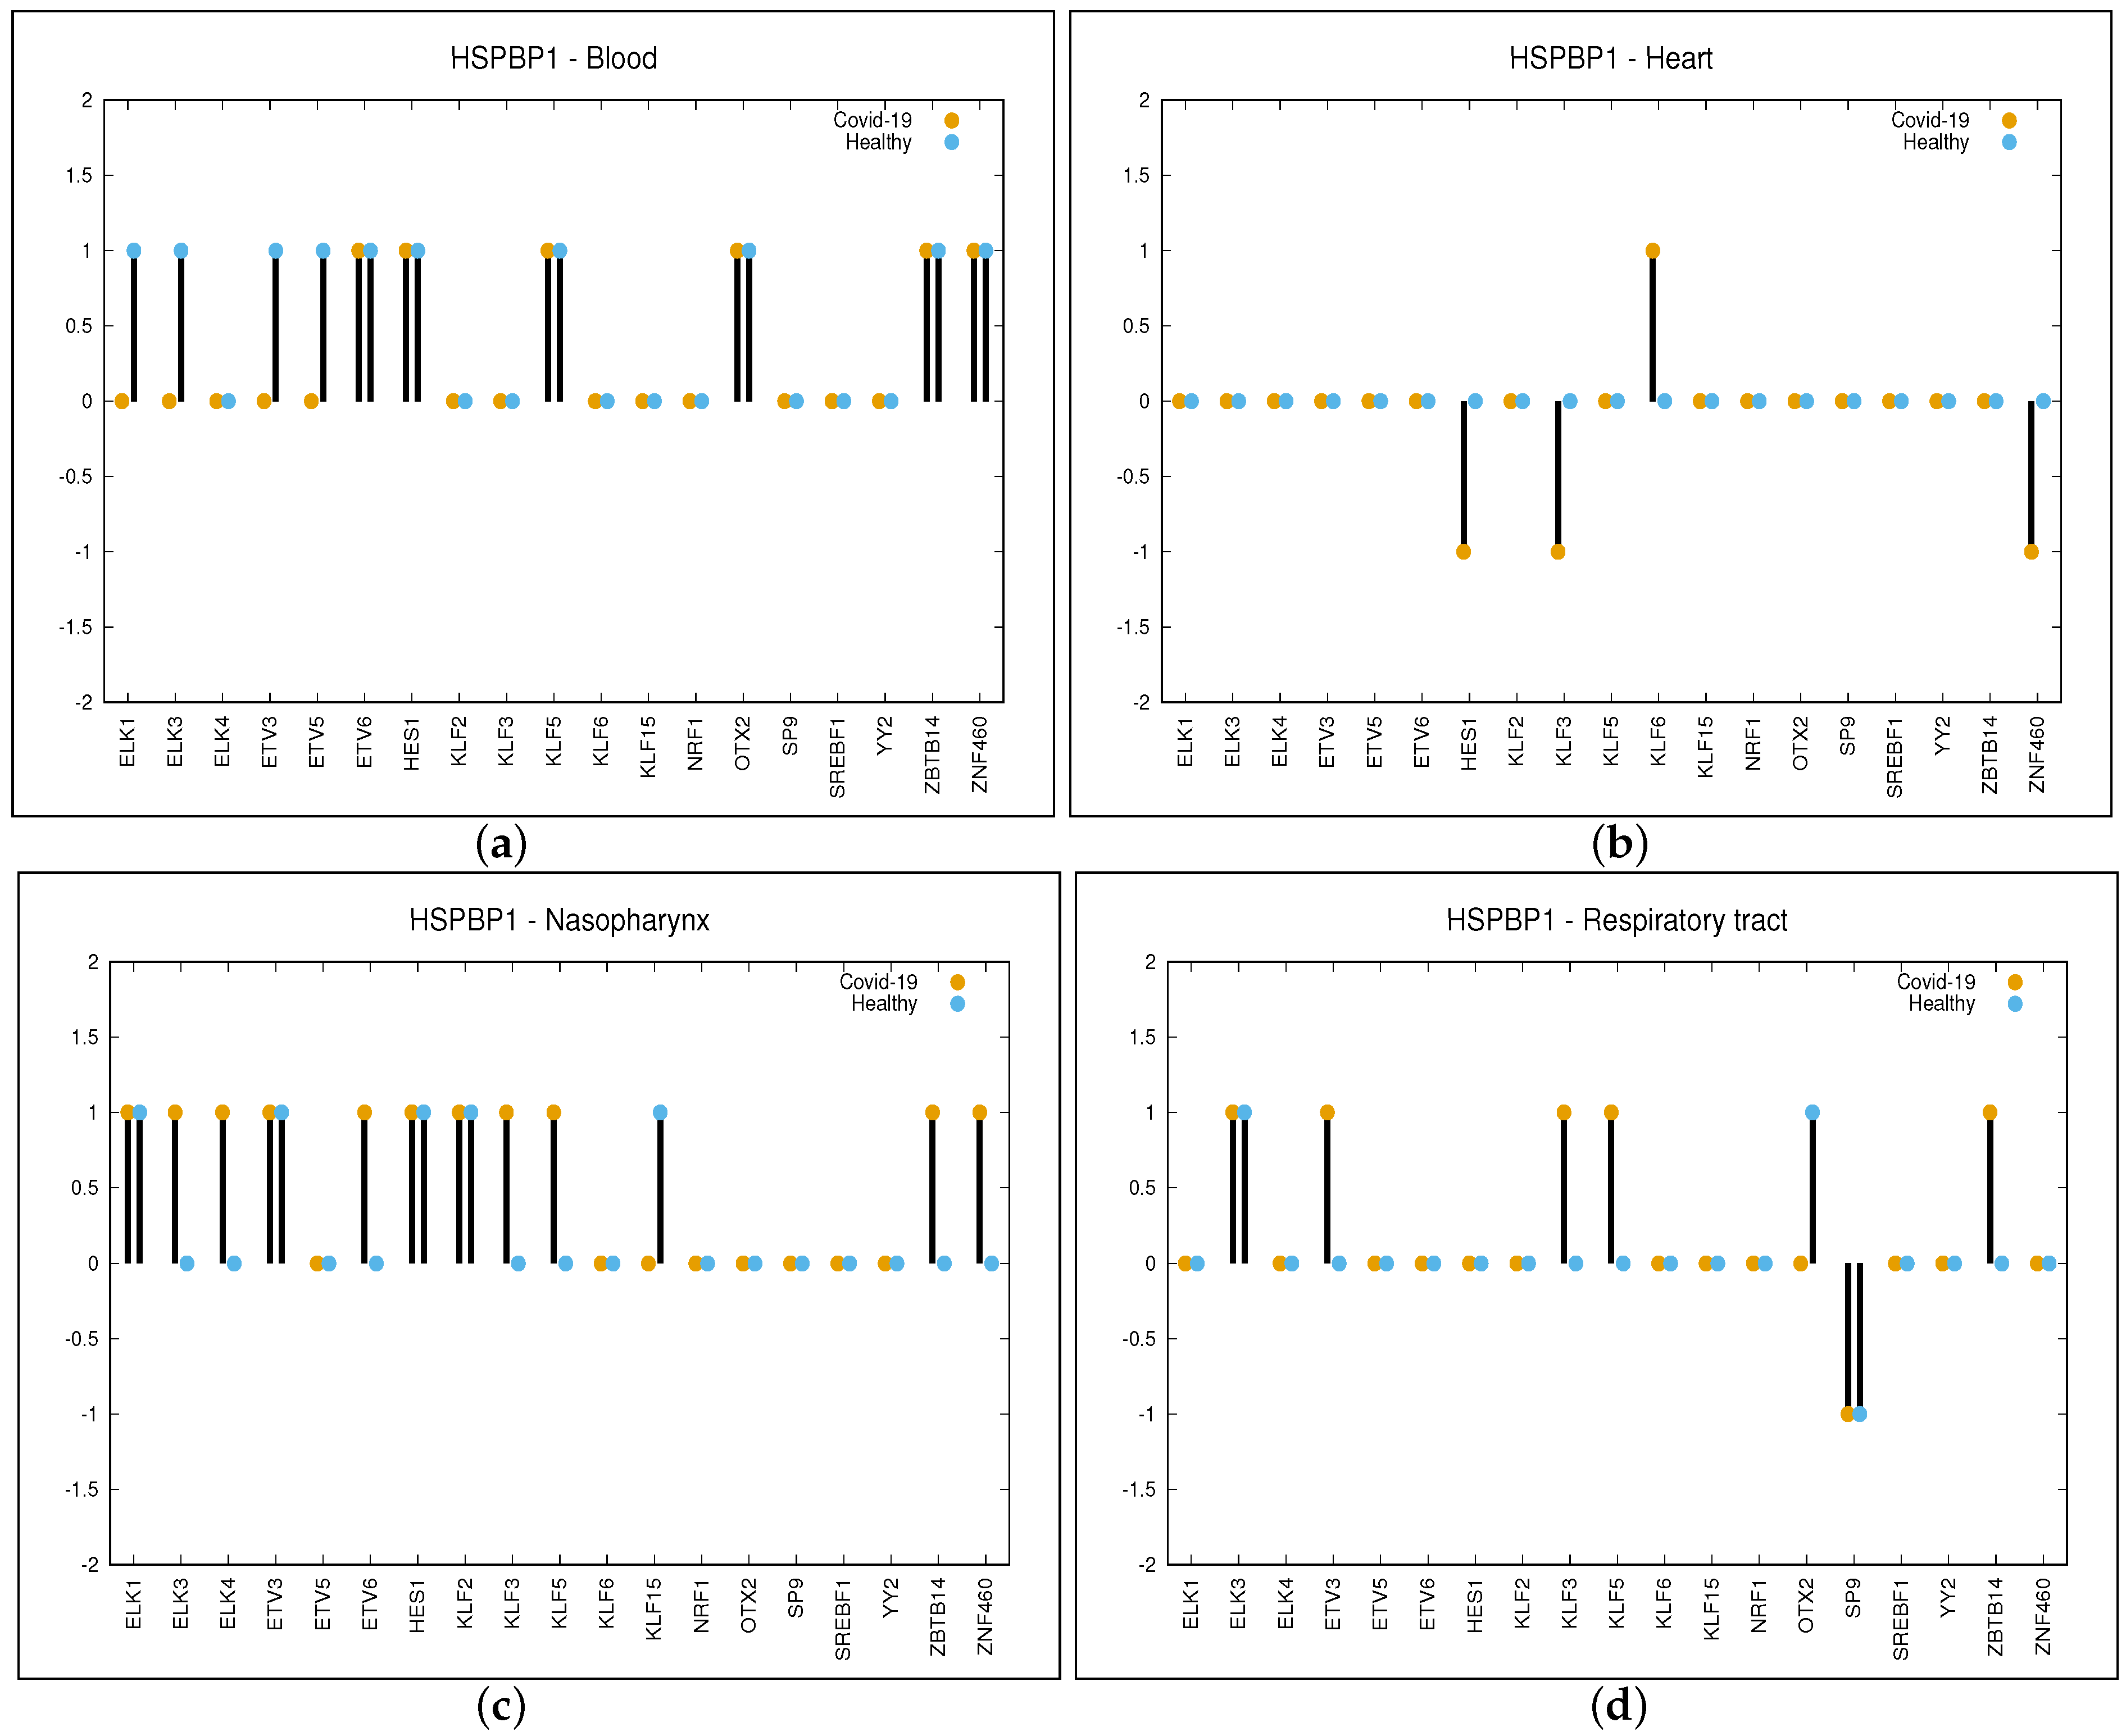
2.2.2. Gene—TF Correlations between COVID-19 Patients and Healthy Individuals

mRNA expression data are used to compute Pearson correlation between each selected TF and its target genes (those genes showing at least one predicted TFBS for the given TF) for both COVID-19 patients and healthy individuals for all the 13 considered organs to analyse differential regulation (Step 4 of Figure 1). A significant positive (negative) Pearson correlation between the expression of a given TF and a target gene leads us to hypothesise the potential enhancer (repressive) role that a TF may play in the expression of the considered target gene. We separately evaluate the significance of couples TF—target gene for COVID-19 patients and healthy individuals using the two available datasets. We are mainly interested in those TFs that show different behaviour for COVID-19 and healthy samples. Thus, those couples showing different significant correlation values in the two sample sets are selected. In other words, if a given TF shows a positive correlation with a given gene in a healthy dataset, while it does not in the COVID-19 dataset, it would mean that the regulation process driven by this TF is changed and it is involved in a host altered pathway. In order to perform this kind of analysis, we have firstly designed a function C (referred to as Correlation) to evaluate correlation for each organ for the two sample sets separately; we have then designed a second function D C (referred to as Differential Correlation) to evaluate the different roles played by a TF with respect to its target genes in COVID-19 patients and healthy individuals.
The function C (Step 4-A of Figure 1) is designed to measure and assess either positive, negative or no correlation and is formally defined as follows:
C : T F × G × O R G × [ C o v , H e a l ] { 1 , 0 , + 1 } C ( t f , g , o r g , p ) { 1 , 0 , + 1 }
where t f T F is a transcription factor in the list of significant TFs, g G is a gene in the list of COVID-19 associated genes, o r g O R G is one of the 13 considered organs, and p is either of the two conditions: COVID-19 or healthy (as reported in the Section of Data Preparation).
  • C(tf,g,org,p) = −1, if g is a target gene of t f (at least one predicted TFBS associated with t f occurs in the promoter region of g), the Pearson correlation value between expression data of t f and g for the organ o r g for condition p (COVID-19 or healthy) is negative and the associated p-value is smaller than 2 × 10 6 .
  • C(tf,g,org,p) = +1, if g is a target gene of t f (at least one predicted TFBS associated with t f occurs in the promoter region of g), the Pearson correlation value between expression data of t f and g for the organ o r g for condition p (COVID-19 or healthy) is positive and the associated p-value is smaller than 2 × 10 6 .
  • C(tf,g,org,p) = 0, otherwise
The p-value of 2 × 10 6 is due to Bonferroni’s correction on an initial considered p-value of 10 3 . This can be attributed to the fact that for each given organ, we have performed a number of tests in the order of thousands (19—the number of TFs—multiplied by the number of target genes resulting in a value of almost 5000). A sample of C function values computed for the gene HSPBP1 and four different organs (blood, heart, nasopharynx and respiratory tract) is reported in Figure 2. For the rest of the genes, the figures are provided in Supplementary Materials as FIG_S1. In these figures, only the organs are considered for which the genes are significantly regulated by at least four TFs (this is explained later in the manuscript).
In order to identify those genes that are differentially regulated by significant T F s in COVID-19 and healthy samples for each given organ, we have compared the correlation values of the two conditions: COVID-19 and healthy. We have designed the function D C (Step 4-B of Figure 1) formally defined as follows:
D C : T F × G × O R G { 2 , 1 , 0 , + 1 , + 2 } D C ( t f , g , o r g ) = C ( t f , g , o r g , C o v ) C ( t f , g , o r g , H e a l )
where t f , g and o r g are defined as described in Equation (1). For each organ, we have selected as significant the couples { t f , g } whose D C value is either equal to +1 or +2 and the couples { t f , g } whose D C value is either equal to −1 or −2. This can be summarised as follows:
  • A strictly positive value of D C for the couple { t f , g } means that the given TF pushes up expression of gene G in COVID-19 patients while it does not do so in healthy individuals, or that the given TF pushes down expression of G in healthy individuals while it does not do so in COVID-19 patients.
  • On the contrary, a strictly negative value of D C for the couple { t f , g } means that the given TF pushes up expression of gene G in healthy individuals while it does not do so in COVID-19 patients, or that the given TF pushes down expression of G in COVID-19 patients while the inverse is not true.
As can be observed in panel (a) of Figure 2, the D C value for the gene HSPBP1 and organ blood is equal to −1 for the TFs such as ELK1, ELK2, ETV3 and ETV4. This is because for the aforementioned TFs, there is a positive correlation in healthy and no correlation in COVID-19 patients, while the correlation is 0 for the other TFs. When considering the organ heart (panel (b) of Figure 2), D C values are as follows: −1 for the TFs such as HES1, KLF3 and ZNF460 (negative correlation in COVID-19 and no correlation in healthy), +1 for KLF6 (positive correlation in COVID-19 and no correlation in healthy) and 0 for the other TFs. In the same way, we have obtained D C values for nasopharynx and respiratory tract, which are as follows: +1 for ELK3, ELK4, ETV6, KLF3, KLF5, ZBTB14 and ZNF460, −1 for KLF15 in the nasopharynx while +1 for ETV3, KLF3, KLF5 and ZBTB14 and −1 for SP9 in the respiratory tract.
The overall impact of a TF on a given organ can be evaluated based on the number of genes that are differentially regulated between COVID-19 patients and healthy individuals by considering the D C function. In this regard, we have defined the function I T F (Step 4-C of Figure 1) to quantify the impact of a given TF on a given organ, as follows:
I T F : T F × O R G [ 0 , 2 ] I T F ( t f , o r g ) = g G A b s ( D C ( t f , g , o r g ) ) | G |
where t f , g and o r g are defined as shown in Equation (1), A b s ( a ) is the absolute value of a and | G | is the size of set G (for the sake of simplicity, | G | is set to 313, since 4 out of the 317 COVID-19-associated genes have no predicted TFBS for any of the significant TFs).
Similarly, we have defined the function I G (Step 4-C of Figure 1) to evaluate the overall impact of a gene belonging to the COVID-19-associated set.
I G : G × O R G [ 0 , 2 ] I G ( g , o r g ) = t f T F A b s ( D C ( t f , g , o r g ) ) | T F |
As can be observed in panel (a) of Figure 2, the I G value for gene HSPBP1 and organ blood is equal to four (i.e., the sum of the absolute value of D C for ELK1, ELK3, ETV3 and ETV5, while for the other TFs, D C is equal to zero). In panel (b), it can be observed that I G value for gene HSPBP1 is equal to four for the heart, while it is eight for the nasopharynx (panel (c)) and five for the respiratory tract (panel (d)). Table TAB_S1.xls is provided as supplementary material in which 18 different sheets are reported. Here, 13 sheets are related to each organ considered in this study, while the rest of the 5 sheets are related to the five organs we have focused on. They show the same data, but the genes are ordered with respect to the number of TFs that differentially regulate them. This will help the reader to identify the most significant genes for each of the five organs. Each table (sheet) is related to a given organ and reports differential expression values as a number in the range (−2, +2) so that the reader can easily retrieve each significant couple (non-zero value). For each organ and for each TF, the gene differentially regulated by the given TF can be retrieved, as well as the TFs that differentially regulate the given gene. For example, looking at the table of blood organ column O reports differential regulating values for each gene out of the 313 provided by OTX2.

3. Results

CoV infection, as well as any virus infection, significantly alters the gene expression of the host cells, highly impacting the process that regulates transcription and translation processes. In this regard, a central role is played by TFs as one of the main characters involved in regulating gene expression. In this study, a set of TFs significantly associated with COVID-19 infection, as well as the target genes of those TFs showing differential expressions in COVID-19 patients and healthy individuals for each of the 13 considered organs, is identified. The first two subsections correspond to Step 5 in Figure 1, while the third subsection refers to Step 6.

3.1. Transcription Factors Significantly Associated with COVID-19 Infection

Predicted TFBSs of known human transcription factors in the promoter regions of all human genes are collected and analysed. For each TF, the collection of identified TFBSs in COVID-19-associated genes is compared with the expected values derived from the analysis of all genes (as reported in the Materials and Methods Section). Hypergeometric tests are performed to identify the list of 19 TFs showing a significant adjusted p-value ( p < 0.05 ), as reported in Table 2. Many of these TFs play significant roles in COVID-19 progression. As reported in [17], ELK1 can target more than one hub susceptibility gene for COVID-19 in lung adenocarcinoma. According to Melms et al. [18], both AT2 and AT1 cells from COVID-19 lungs showed decreased expression of defining markers. ETV5, which is a transcription factor required for AT2 cell identity, was found to be less expressed in COVID-19 AT2 cells. Reduced ETV5 expression is associated with AT1 cell differentiation, indicating that AT2 cells initiated a regeneration program. KLF2 has been evaluated as a therapeutic target for COVID-19-induced endothelial dysfunction [8]. Lung fibroblasts due to COVID-19 have also been associated with KLF2 [19]. As observed in [20], enrichment of the pathways related to cytokine signalling and inflammation activation in COVID-19 patients is related to KLF6. For the sake of completeness, among the 317 genes interacting with the spike proteins there are 3 TFs (ARNT, CREB3 and STAT1); however, none of them were found to be significant as per the adjusted p-value.

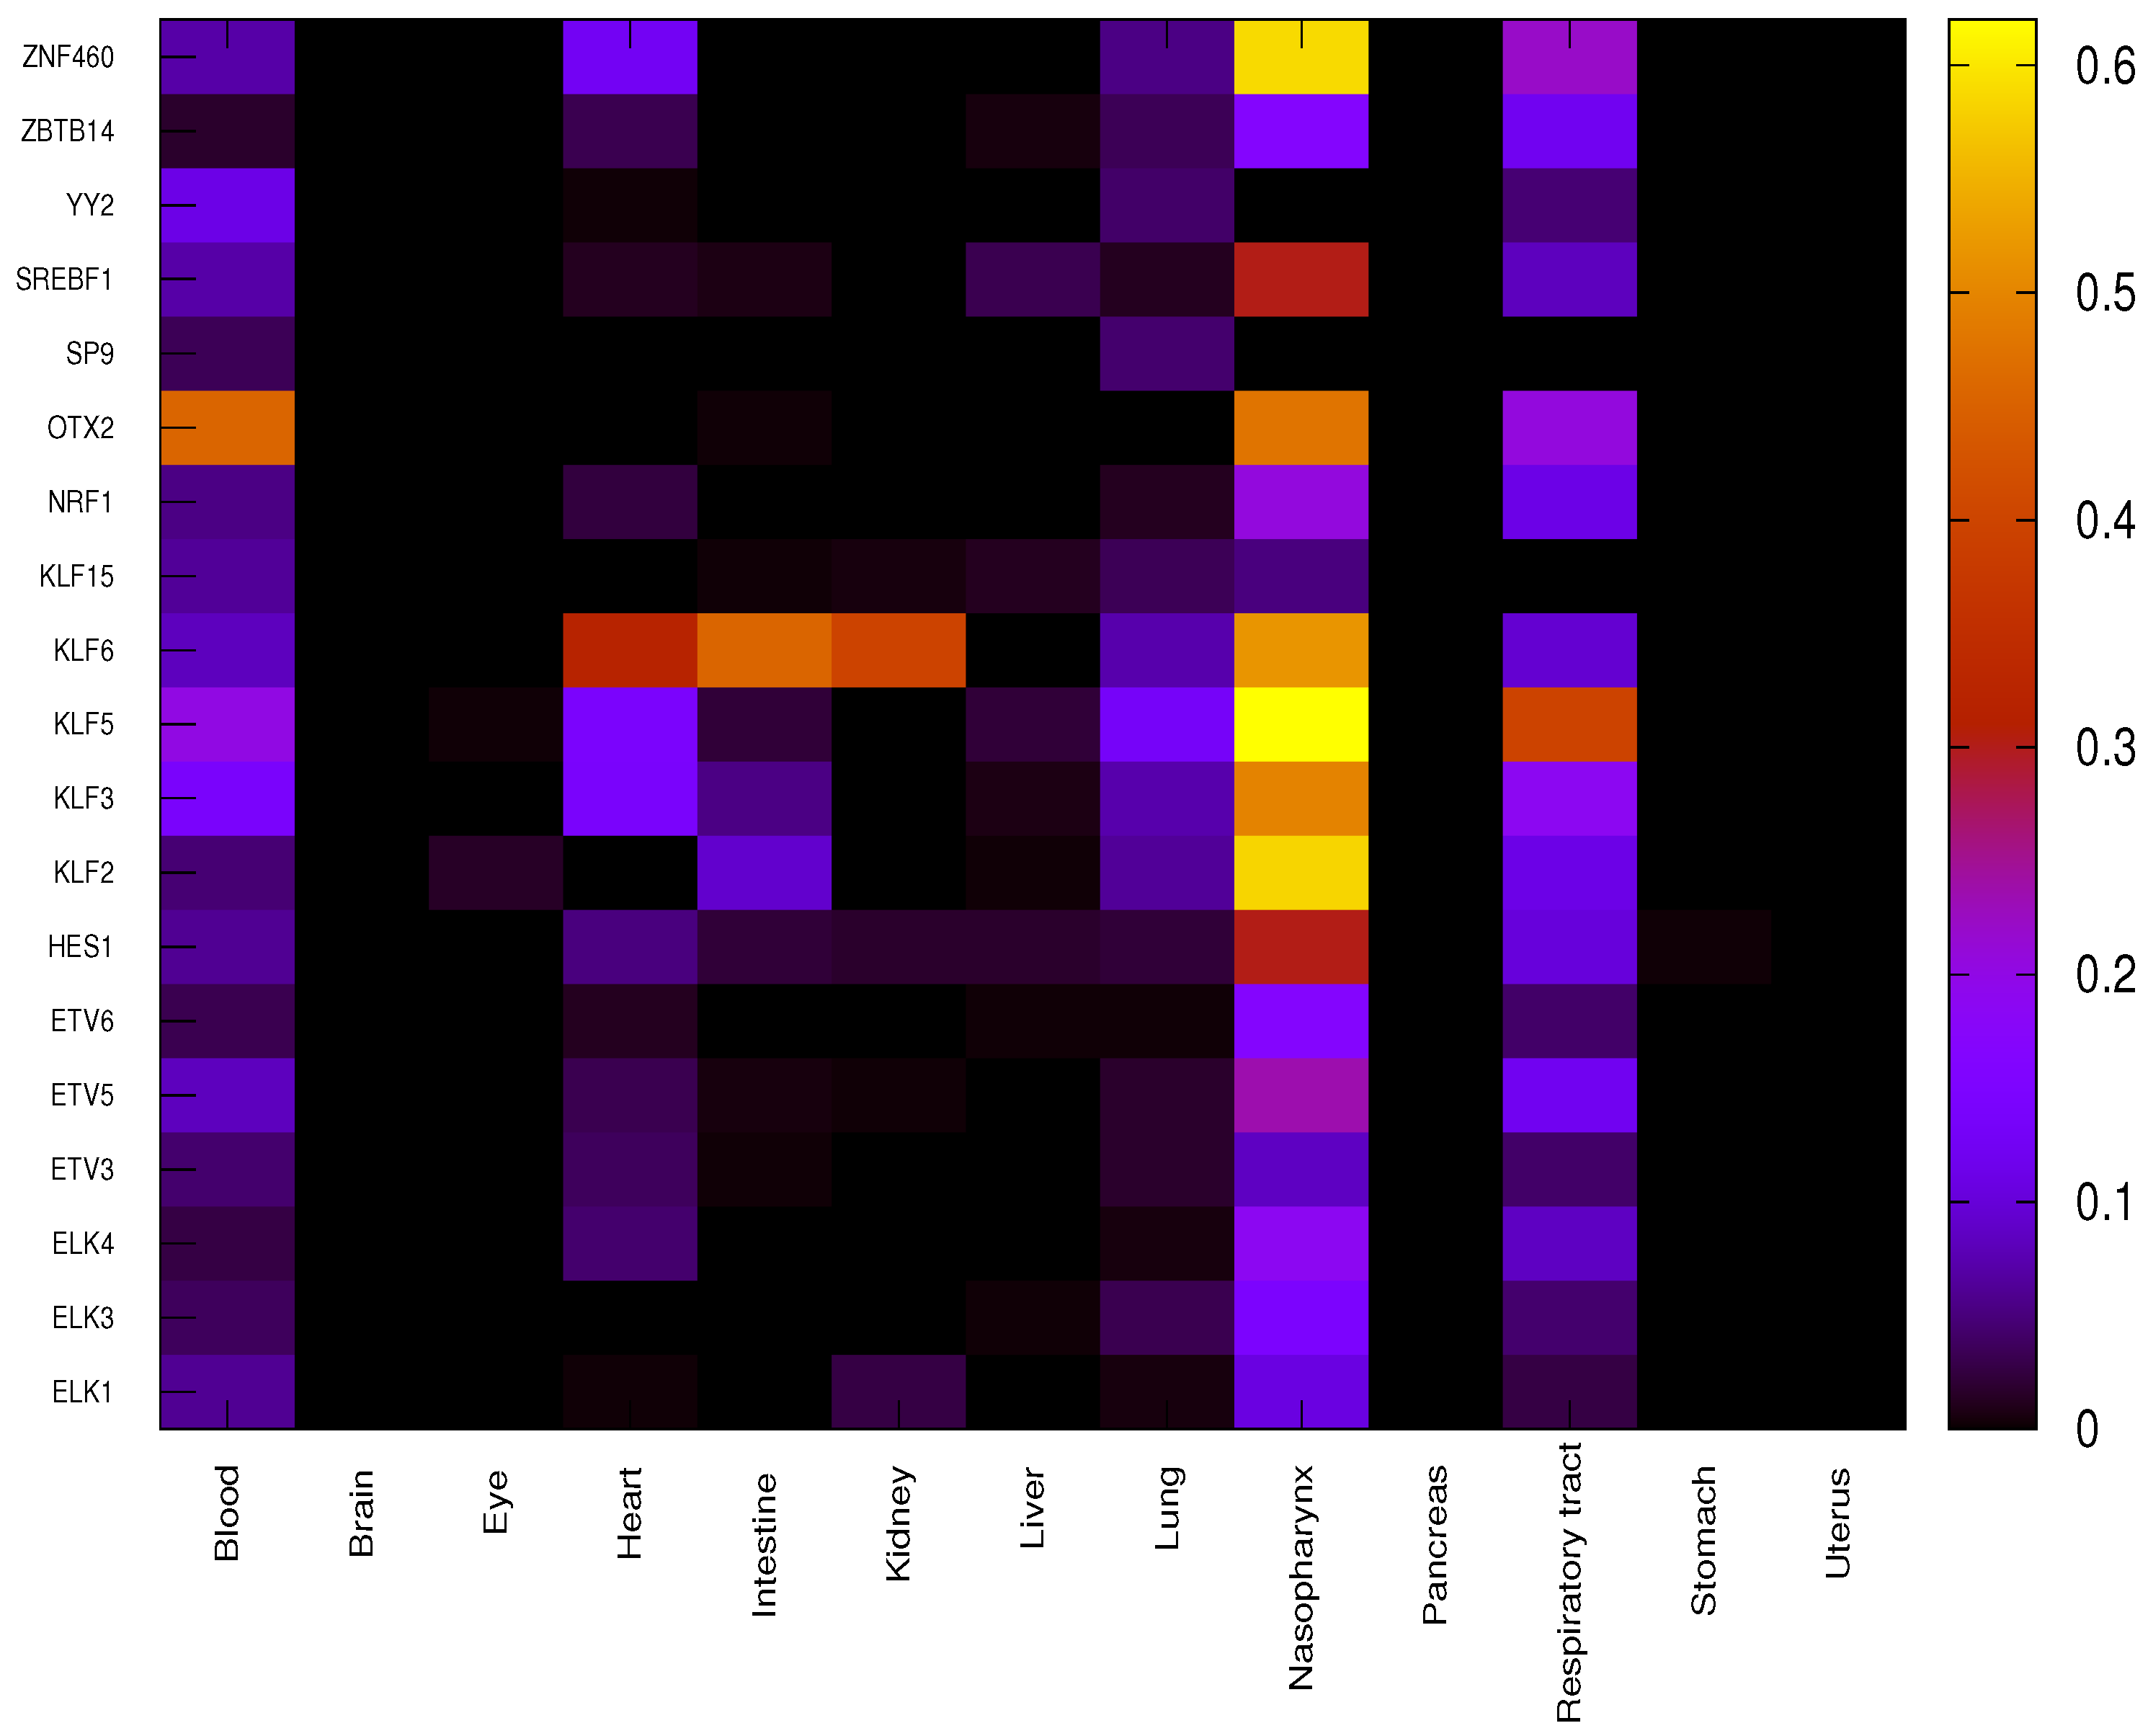
3.2. Transcription Factors Having a Major Impact on Specific Organs

For each given organ, the correlation between each significant TF and the corresponding target genes is evaluated using function C (Equation (1)) for both COVID-19 patients and healthy individuals, providing a score equal to −1 (negative correlation), 0 (no correlation) or +1 (positive correlation). Differential correlation between COVID-19 patients and healthy individuals for each couple { t f , g } is assessed through the function D C (Equation (2)). The overall impact of each TF on a given organ is finally evaluated through the function I T F (Equation (3)) as reported in Figure 3.
It is worth noting that due to the very strict p-value threshold, the small number of samples available for some organs makes it very unlikely to find significant correlation. Thus, only a few organs, such as the blood, heart, lung, nasopharynx and respiratory tract, out of the total 13 show significant differential regulation due to specific TFs. OTX2 shows the highest impact in blood, differentially regulating 142 genes out of 313 between COVID-19 and healthy samples. Almost all the concerned genes (139 out of 142) show a D F value equal to −1 leading to hypothesise a suppression of repressive role in COVID-19 patients that was active in healthy individuals. In heart, TF KLF6 shows the highest impact on differential regulation, affecting 100 genes out of 313, with 34 genes showing a value of D F equal to +1 and 66 equal to −1. In lung, the impact values of TFs are much smaller than in other organs, only some TFs belonging to the family KLF (KLF2, KLF3 KLF5 and KLF6) show higher values (20, 23, 42 and 23 out of 313, respectively). It is to be noted that the numbers in () denote the number of genes. Henceforth, this notation will be used throughout.
The nasopharynx shows several very high impact values such as for KLF2 (182 out of 313), KLF3 (155), KLF5 (194), KLF6 (162), OTX2 (149) and ZNF460 (149). Almost all differentially expressed genes show a value of D F equal to +1 so the role of activation of TFs is significantly enhanced in COVID-19 patients with respect to healthy individuals. In respiratory tract, the highest impact value is observed for KLF5 (124 out of 313, with 123 genes showing a D F value equal to +1).

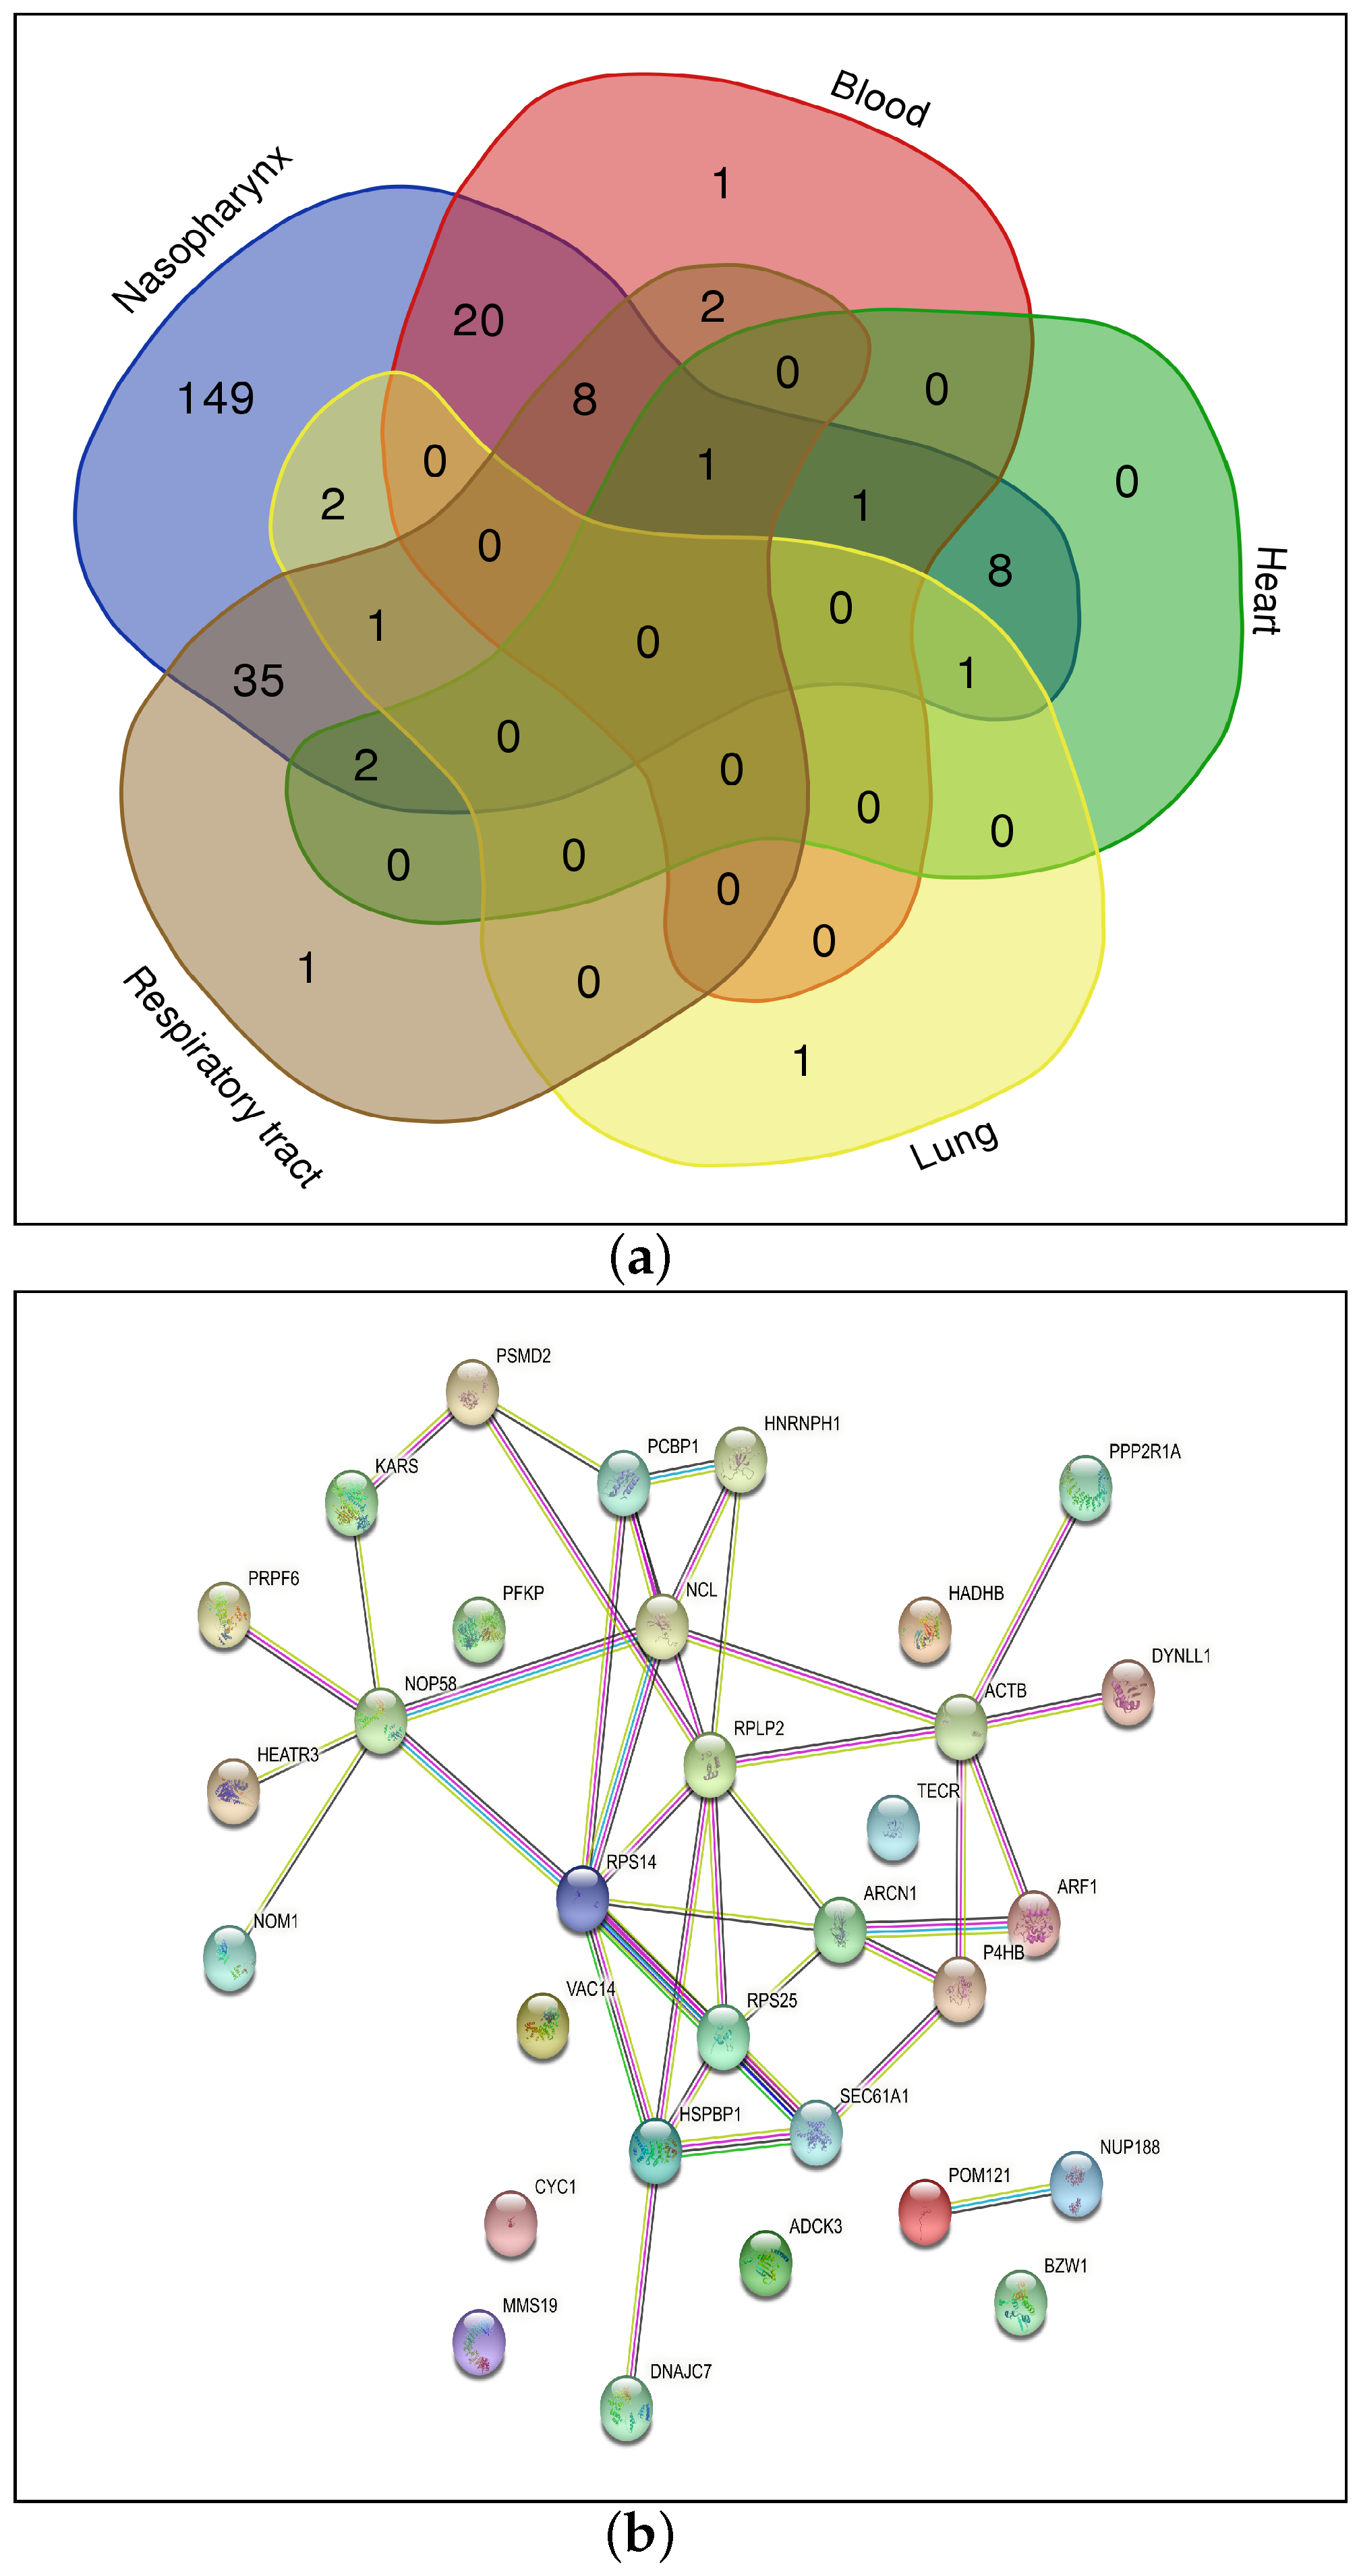
3.3. Differentially Regulated Genes in Specific Organs
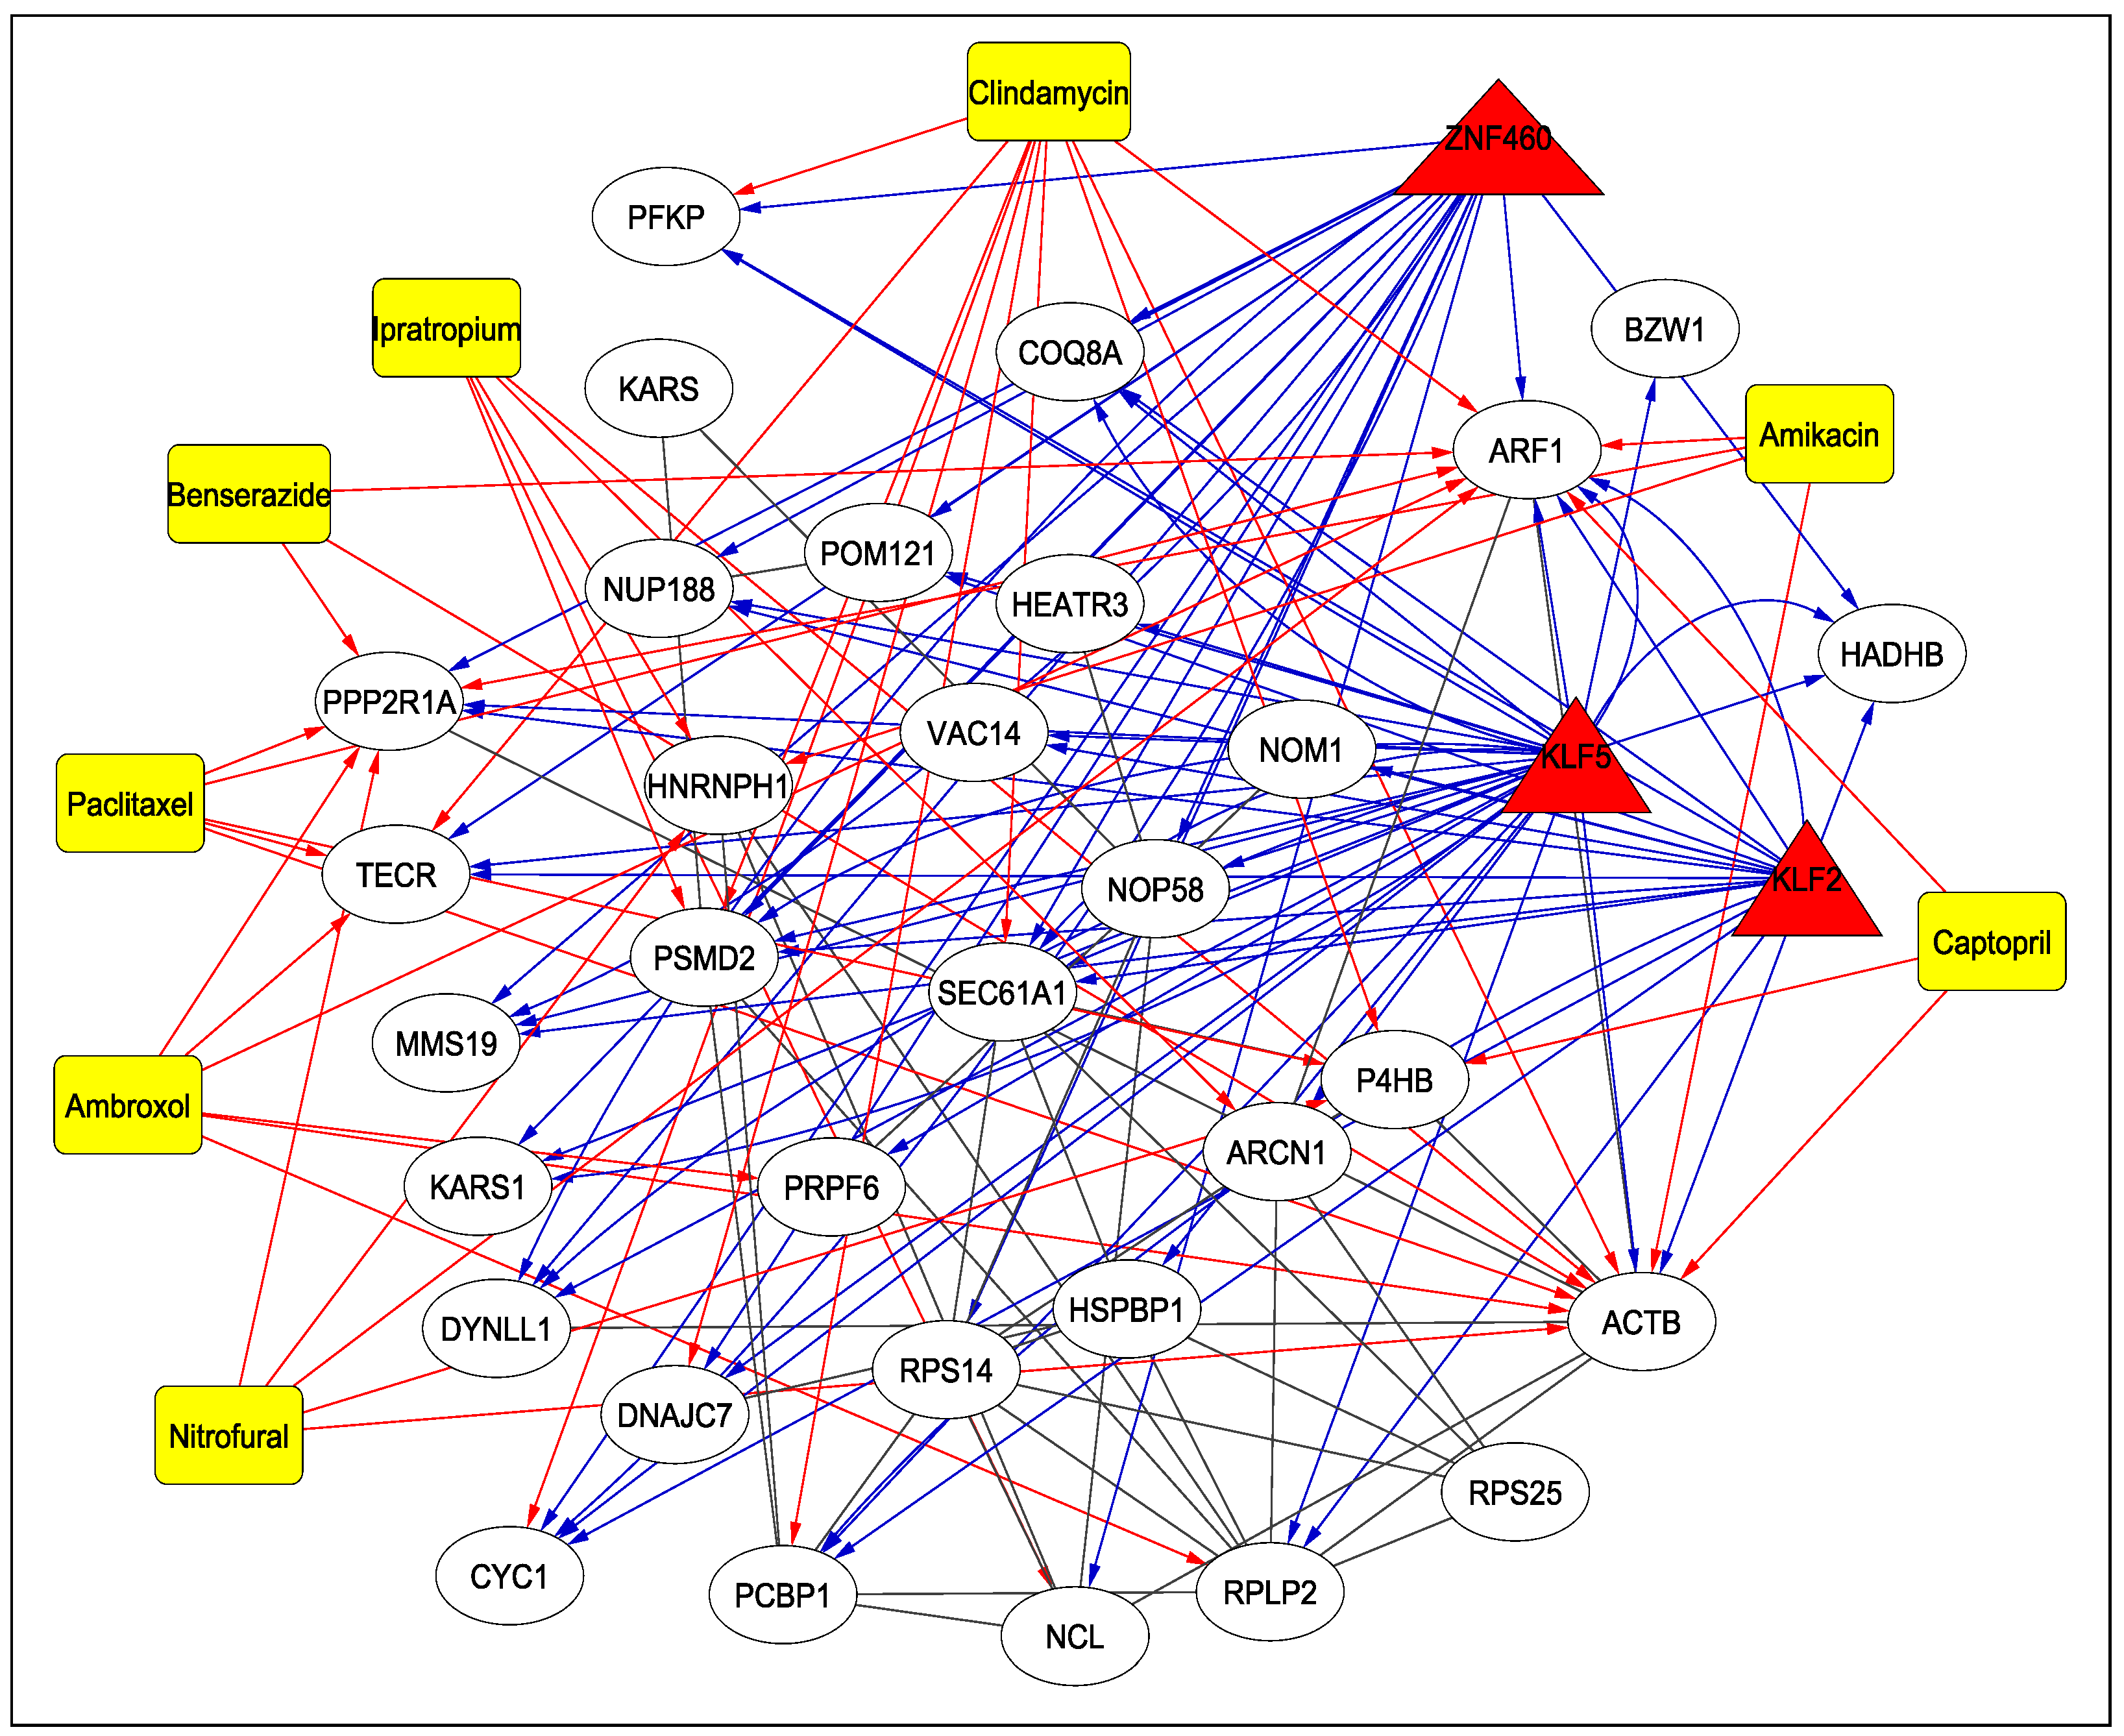
For each considered organ, genes showing a significant differential regulation due to the role played by TFs are identified through the function I G (Equation (4)). The genes showing a I G value higher than 3 (genes that are differentially regulated in COVID-19 and healthy samples by at least four TFs) are selected: blood (33), heart (13), lung (5), nasopharynx (228) and respiratory tract (50).
Figure 4a reports the common genes among five organs: the blood, heart, lung, nasopharynx and respiratory tract. The total number of common genes is 31. Table 3 shows these 31 significant genes by considering the ranking method; for example, a designation of 4* indicates that the gene HSPBP1 is common among four organs such as the blood, heart, nasopharynx and respiratory tract, while 3* indicates that genes such as ARCN1 and PRPF6 are common among organs such as the heart, lung and nasopharynx and so forth.
There are already several vaccines in the market and drugs such as Remdesivir, Paxlovid, molnupiravir and the repurposed rheumatoid arthritis drug baricitinib [21] are also approved by the FDA to combat COVID-19. Thus, drug repurposing can be considered as a good alternative to new drug identification (Step 7-D of Figure 1). However, all the approved drugs target the human proteins directly interacting with Spike protein of SARS-CoV-2. In this work, the focus is on those human proteins that are modulated by the TFs that in turn target the human genes interacting with Spike glycoprotein.

3.4. Drugs

Table 4 reports the drugs targeting the 31 human proteins as identified earlier, along with their adjusted p-values and DrugBank IDs (https://go.drugbank.com/drugs, accessed on 10 May 2023) (Step 7-C of Figure 1). As can be seen from the table, several drugs such as nitrofural, clindamycin, ipratropium, ambroxol, pacilataxel, benserazisde, amikacin and captopril are used for the treatment of different types of cancer, for Parkinson’s disease and for antibiotic and antibacterial applications in some instances. Among these drugs, Amikacin has been found to be the best aminoglycosides as a potential inhibitor of SARS-CoV-2 [22]. As reported in [23], a 66-year-old man infected with COVID-19 was given Ipratropium Bromide solution, among other drugs, to dilate bronchioles. Another drug, Captopril, is under investigation as a potential drug for COVID-19 [24]. The TF–Protein–Drug interaction network for 3 significant TFs, KLF2, KLF5, ZNF460 and 31 proteins is shown in Figure 5. For example, as can be seen from the figure, KLF2, KLF5 and ZNF460 target ARF1, which is also targeted by drugs such as Nitrofural, Clindamycin, Ambroxol, Paclitaxel, Benserazide, Amikacin and Captopril. All the treatments mentioned in Table 4 have been cited from Drug Bank.

4. Discussion

4.1. Protein–Protein Interaction Network and KEGG Pathway Analysis

The protein–protein interaction network for the 31 genes as identified and reported in this work is shown in Figure 4b (Step 7-A of Figure 1). Some important pathways corresponding to these genes are shown in Supplementary Figure S1a (Step 7-B of Figure 1). These KEGG pathways are collected from Enrichr tool (https://maayanlab.cloud/Enrichr/, accessed on 10 May 2023). Please note that bar graph rankings are based on p-value ranking, q-value ranking, odds ratio ranking and combined score ranking. The bar graph represents high significance based on color and length. The longer and lighter the bar, the more significant the term [25].
As can be seen from the figure, the genes are enriched in pathways which include Vibrio cholerae infection (SEC61A1, ARF1, ACTB), Amyotrophic lateral sclerosis (POM121, NUP188, PSMD2, CYC1, ACTB), Pathogenic Escherichia coli infection (ARF1, NCL, ACTB), Coronavirus disease (RPS14, RPS25, RPLP2), Salmonella infection (ARF1, DYNLL1, ACTB), AMPK signaling pathway (PPP2R1A, PFKP) and Thyroid hormone signalling pathway (ACTB, PFKP). The genes enriched in the pathway for Coronavirus disease are present in the blood, nasopharynx and respiratory tract. It is surprising that some pathways associated with bacterial infection are more significant. At the same time, it is very interesting and this concept deserves more attention and further studies. It can be hypothesised that some common mechanisms which regulate gene expression through TFs are triggered by both COVID-19 and the above-mentioned bacteria. For example, it is known that both COVID-19 and those bacteria are responsible for neurological disorders or alterations in functionality in the mitochondria. Interestingly, two of the genes that are responsible for the enrichment of bacterial infection (Salmonella, Vibrio cholerae and Escherichia coli) pathways are ACTB and ARF1. Both of them are involved in Reactive Oxygen Species (ROS) associated to mitochondria dysfunction [26,27]. This kind of dysfunction was observed in bacterial infections (Salmonella, Escherichia coli and Vibrio cholerae, among others) and also in SARS-CoV2 infection [28,29]. This hypothesis can be the subject of a further study as it is out of the scope of this work.

4.2. Gene Ontology (GO) Enrichment Analysis

The significance of the different proteins in biological activities can be shown using GO enrichment analysis (Step 7-C of Figure 1). Similar to KEGG pathways, GO enrichment analysis results for the 31 genes are collected from the Enrichr tool as well. The corresponding results for the biological processes are shown in Supplementary Figure S1b, while the detailed analysis for all the GO pathways (biological, molecular and cellular) are provided on the Supplementary website. Some significant biological pathways are ribosome biogenesis (GO:0042254) (RPS14, NOM1, RPS25, NOP58, HEATR3, RPLP2), gene expression (GO:0010467) (RPS14, RPS25, POM121, NUP188, HNRNPH1, RPLP2, MMS19), SRP-dependent cotranslational protein targeting to membrane (GO:0006614) (RPS14, SEC61A1, RPS25, RPLP2) and cotranslational protein targeting to membrane (GO:0006613) (RPS14, SEC61A1, RPS25, RPLP2).

5. Conclusions

For more than two years, COVID-19 has been a major reason for deaths worldwide. To provide a further insight into this deadly disease, in this work, we have identified 19 TFs which target human proteins interacting with SARS-CoV-2 Spike protein. Among the identified TFs, according to the literature, KLF2 has been evaluated as a therapeutic target for COVID-19-induced endothelial dysfunction. Subsequently, mRNA expression data of these 19 TFs and the targeted human genes are considered for both COVID-19-afflicted patients and healthy individuals, focusing on 13 organs. Thereafter, the correlation between the TFs and the genes is carried out to identify the most important TFs, as well as the most affected organs such as the blood, heart, lung, nasopharynx and respiratory tract. Subsequently, 31 common genes are identified whose protein–protein interactions, KEGG pathways as well as GO enrichment are reported. In this work, the focus is on those human proteins that are modulated by the TFs that, in turn, target the human genes interacting with Spike glycoprotein. In this regard, potential repurposable drugs such as Amikacin, Ipratropium Bromide, Captopril, etc., are identified which target the 31 genes. Among these drugs, Captopril is under investigation as a potential drug for COVID-19. We hope that the findings of this work will help the scientific community in the ongoing battle against COVID-19. As a future research direction, this work can be verified by wet-lab experiments as well.

Supplementary Materials

The following supporting information can be downloaded at: https://www.mdpi.com/article/10.3390/v15051188/s1, Figure S1: FIG_S1 (Differential Correlation of Genes with respect to the 19 TFs); Table S1: TAB_S1 (Significant Genes for 5 organs).

Author Contributions

Conceptualization, D.S.; methodology, D.S.; software, D.S., N.G. and C.D.; validation, D.S., N.G. and I.S.; formal analysis, D.S. and N.G.; investigation, D.S. and I.S.; resources, D.S. and N.G.; data curation, N.G., C.D. and I.S.; writing—original draft preparation, D.S.; writing—review and editing, D.S., N.G. and I.S.; visualization, D.S. and N.G.; supervision, D.S. and I.S.; project administration, D.S. and I.S.; funding acquisition, D.S. and N.G. All authors have read and agreed to the published version of the manuscript.

Funding

This work was carried out during the tenure of an ERCIM ‘Alain Bensoussan’ Fellowship Program awarded to Nimisha Ghosh. This work has also been partially supported by the CRG short-term research grant on COVID-19 (CVD/2020/000991) from the Science and Engineering Research Board (SERB), Department of Science and Technology, Govt. of India. This work is also funded by “BIOSYS2—Optimization, Models and Algorithms for Bioinformatics and System Biology” project (DIT.AD021.128) of the Institute for System Analysis and Computer Science “Antonio Ruberti”—National Research Council of Italy.

Institutional Review Board Statement

Not applicable.

Informed Consent Statement

Not applicable.

Data Availability Statement

The supplementary materials for this work are available at http://www.nitttrkol.ac.in/indrajit/projects/COVID-TF/.

Conflicts of Interest

The authors declare no conflict of interest. The funders had no role in the design of the study; in the collection, analyses, or interpretation of data; in the writing of the manuscript; or in the decision to publish the results.

Abbreviations

The following abbreviations are used in this manuscript:
TFTranscription Factors
TFBSTranscription Factor Binding Site
CCorrelation
DCDifferential Correlation
PWMPosition Weight Matrix
KEGGKyoto Encyclopedia of Genes and Genomes
GOGene Ontology

References

  1. Enjuanes, L.; Almazan, F.; Sola, I.; Zuniga, S. Biochemical Aspects of Coronavirus Replication and Virus-Host Interaction. Annu. Rev. Microbiol. 2006, 60, 211–230. [Google Scholar] [CrossRef] [PubMed]
  2. van Hemert, M.J.; van den Worm, S.H.E.; Knoops, K.; Mommaas, A.M.; Gorbalenya, A.E.; Snijder, E.J. SARS-Coronavirus Replication/Transcription Complexes Are Membrane-Protected and Need a Host Factor for Activity In Vitro. PLoS Pathog. 2008, 4, e1000054. [Google Scholar] [CrossRef] [PubMed]
  3. Vkovski, P.; Gerber, M.; Kelly, J.; Pfaender, S.; Ebert, N.; Braga, L.S.; Simillion, C.; Portmann, J.; Stalder, H.; Gaschen, V. Determination of host proteins composing the microenvironment of coronavirus replicase complexes by proximity-labeling. eLife 2019, 8, e42037. [Google Scholar] [CrossRef]
  4. di Bari, I.; Franzin, R.; Picerno, A.; Stasi, A.; Cimmarusti, M.T.; Di Chiano, M.; Curci, C.; Pontrelli, P.; Chironna, M.; Castellano, G.; et al. Severe acute respiratory syndrome coronavirus 2 may exploit human transcription factors involved in retinoic acid and interferon-mediated response: A hypothesis supported by an in silico analysis. New Microbes New Infect. 2021, 41, 100853. [Google Scholar] [CrossRef] [PubMed]
  5. Mosharaf, M.P.; Reza, M.S.; Kibria, M.K.; Ahmed, F.F.; Kabir, M.H.; Hasan, S.; Mollah, M.N.H. Computational identification of host genomic biomarkers highlighting their functions, pathways and regulators that influence SARS-CoV-2 infections and drug repurposing. Sci. Rep. 2022, 12, 4279. [Google Scholar] [CrossRef] [PubMed]
  6. Sardar, R.; Satish, D.; Gupta, D. Identification of Novel SARS-CoV-2 Drug Targets by Host MicroRNAs and Transcription Factors Co-regulatory Interaction Network Analysis. Front. Genet. 2020, 11, 1105. [Google Scholar] [CrossRef] [PubMed]
  7. Chen, L.; Marishta, A.; Ellison, C.; Verzi, M.P. Identification of Transcription Factors Regulating SARS-CoV-2 Entry Genes in the Intestine. Cell. Mol. Gastroenterol. Hepatol. 2021, 11, 181–184. [Google Scholar] [CrossRef]
  8. Xu, S.; Liu, Y.; Ding, Y.; Luo, S.; Zheng, X.; Wu, X.; Liu, Z.; Ilyas, I.; Chen, S.; Han, S.; et al. The zinc finger transcription factor, KLF2, protects against COVID-19 associated endothelial dysfunction. Signal Transduct. Target. Ther. 2021, 6, 266. [Google Scholar] [CrossRef]
  9. Chapola, H.; de Bastiani, M.A.; Duarte, M.M.; Freitas, M.B.; Schuster, J.S.; de Vargas, D.M.; Klamt, F. A comparative study of COVID-19 transcriptional signatures between clinical samples and preclinical cell models in the search for disease master regulators and drug repositioning candidates. Virus Res. 2023, 326, 199053. [Google Scholar] [CrossRef]
  10. Ghosh, N.; Saha, I.; Sharma, N. Interactome of human and SARS-CoV-2 proteins to identify human hub proteins associated with comorbidities. Comput. Biol. Med. 2021, 138, 104889. [Google Scholar] [CrossRef]
  11. Chen, E.; Tan, C.; Kou, Y.; Duan, Q.; Wang, Z.; Meirelles, G.V.; Clark, N.R.; Ma’ayan, A. Enrichr: Interactive and collaborative HTML5 gene list enrichment analysis tool. BMC Bioinform. 2013, 14, 128. [Google Scholar] [CrossRef] [PubMed]
  12. Kuleshov, M.; Jones, M.; Rouillard, A.; Fernandez, N.F.; Duan, Q.; Wang, Z.; Koplev, S.; Jenkins, S.L.; Jagodnik, K.M.; Lachmann, A.; et al. Enrichr: A comprehensive gene set enrichment analysis web server 2016 update. Nucleic Acids Res. 2016, 44, W90–W97. [Google Scholar] [CrossRef]
  13. Derelitto, C.; Santoni, D. TRANSPARENT: A Python tool for designing transcription factor regulatory networks. Soft Comput. 2023, 27, 1–6. [Google Scholar] [CrossRef]
  14. Zhang, W.; Zhang, Y.; Min, Z.; Mo, J.; Ju, Z.; Guan, W.; Zeng, B.; Liu, Y.; Chen, J.; Zhang, Q.; et al. COVID19db: A comprehensive database platform to discover potential drugs and targets of COVID-19 at whole transcriptomic scale. Nucleic Acids Res. 2021, 50, D747–D757. [Google Scholar] [CrossRef] [PubMed]
  15. Cumbo, F.; Vergni, D.; Santoni, D. Investigating transcription factor synergism in humans. DNA Res. 2017, 25, 103–112. [Google Scholar] [CrossRef]
  16. Fornes, O.; Castro-Mondragon, J.A.; Khan, A.; Van der Lee, R.; Zhang, X.; Richmond, P.A.; Modi, B.P.; Correard, S.; Gheorghe, M.; Baranašić, D.; et al. JASPAR 2020: Update of the open-access database of transcription factor binding profiles. Nucleic Acids Res. 2019, 48, D87–D92. [Google Scholar] [CrossRef]
  17. Gao, L.; Li, G.S.; Li, J.D.; He, J.; Zhang, Y.; Zhou, H.F.; Kong, J.L.; Chen, G. Identification of the susceptibility genes for COVID-19 in lung adenocarcinoma with global data and biological computation methods. Comput. Struct. Biotechnol. J. 2021, 19, 6229–6239. [Google Scholar] [CrossRef]
  18. Melms, J.C.; Biermann, J.; Huang, H.; Wang, Y.; Nair, A.; Tagore, S.; Katsyv, I.; Rendeiro, A.F.; Amin, A.D.; Schapiro, D.; et al. A molecular single-cell lung atlas of lethal COVID-19. Nature 2021, 595, 114–119. [Google Scholar] [CrossRef]
  19. Chrysanthopoulou, A.; Antoniadou, C.; Natsi, A.M.; Gavriilidis, E.; Papadopoulos, V.; Xingi, E.; Didaskalou, S.; Mikroulis, D.; Tsironidou, V.; Kambas, K.; et al. Down-regulation of KLF2 in lung fibroblasts is linked with COVID-19 immunofibrosis and restored by combined inhibition of NETs, JAK-1/2 and IL-6 signaling. Clin. Immunol. 2023, 247, 109240. [Google Scholar] [CrossRef]
  20. Wen, W.; Su, W.; Tang, H.; Le, W.; Zhang, X.; Zheng, Y.; Liu, X.; Xie, L.; Li, J.; Ye, J.; et al. Immune cell profiling of COVID-19 patients in the recovery stage by single-cell sequencing. Cell Discov. 2020, 6, 31. [Google Scholar] [CrossRef]
  21. Hillary, V.E.; Ceasar, S.A. An update on COVID-19: SARS-CoV-2 variants, antiviral drugs, and vaccines. Heliyon 2023, 9, e13952. [Google Scholar] [CrossRef] [PubMed]
  22. Ahmed, M.Z.; Zia, Q.; Haque, A.; Alqahtani, A.S.; Almarfadi, O.M.; Banawas, S.; Alqahtani, M.S.; Ameta, K.L.; Haque, S. Aminoglycosides as potential inhibitors of SARS-CoV-2 main protease: An in silico drug repurposing study on FDA-approved antiviral and anti-infection agents. J. Infect. Public Health 2021, 14, 611–619. [Google Scholar] [CrossRef] [PubMed]
  23. Chen, X.; Zhang, G.; Tang, Y.; Peng, Z.; Pan, H. The coronavirus diseases 2019 (COVID-19) pneumonia with spontaneous pneumothorax: A case report. BMC Infect. Dis. 2020, 20, 662. [Google Scholar] [CrossRef] [PubMed]
  24. Lin, M.; Dong, H.Y.; Xie, H.Z.; Li, Y.M.; Jia, L. Why do we lack a specific magic anti-COVID-19 drug? Analyses and solutions. Drug Discov. Today 2021, 26, 631–636. [Google Scholar] [CrossRef]
  25. Xie, Z.; Bailey, A.; Kuleshov, M.V.; Clarke, D.J.; Evangelista, J.E.; Jenkins, S.L.; Lachmann, A.; Wojciechowicz, M.L.; Kropiwnicki, E.; Jagodnik, K.M.; et al. Gene Set Knowledge Discovery with Enrichr. Curr. Protoc. 2021, 1, e90. [Google Scholar] [CrossRef]
  26. Li, J.; Li, Q.; Xie, C.; Zhou, H.; Wang, Y.; Zhang, N.; Shao, H.; Chan, S.C.; Peng, X.; Lin, S.; et al. Beta-actin is required for mitochondria clustering and ROS generation in TNF-induced, caspase-independent cell death. J. Cell Sci. 2004, 117, 4673–4680. [Google Scholar] [CrossRef]
  27. Zhang, B.; Yu, Q.; Huo, D.; Li, J.; Liang, C.; Li, H.; Yi, X.; Xiao, C.; Zhang, D.; Li, M. Arf1 regulates the ER-mitochondria encounter structure (ERMES) in a reactive oxygen species-dependent manner. J. Cell Sci. 2018, 285, 2004–2018. [Google Scholar] [CrossRef]
  28. Brokatzky, D.; Hacker, G. Mitochondria: Intracellular sentinels of infections. Med. Microbiol. Immunol. 2022, 211, 161–172. [Google Scholar] [CrossRef]
  29. Lee, J.; Song, C. Effect of Reactive Oxygen Species on the Endoplasmic Reticulum and Mitochondria during Intracellular Pathogen Infection of Mammalian Cells. Antioxidants 2021, 10, 872. [Google Scholar] [CrossRef]
Figure 1. Pipeline of the work.
Viruses 15 01188 g001
Figure 2. Differential regulation in COVID-19 and Healthy samples of HSPBP1 gene driven by the 19 significant TFs. Values of function C are shown: +1 positive correlation, 0 no correlation and −1 negative correlation. Panel (a) is related to Blood, panel (b) to Heart, panel (c) to Nasopharynx and panel (d) to Respiratory tract.
Viruses 15 01188 g002
Figure 3. Overall impact of significant TFs in each organ through I T F function. Each cell of the heatmap reports I T F value for a given organ in a color scale.
Viruses 15 01188 g003
Figure 4. (a) Common genes among the 5 organs showing significant differential regulation and (b) Protein–Protein Interaction Network.
Viruses 15 01188 g004
Figure 5. TF–Protein–Drug Interaction Network. The TFs are represented by triangles and are red in colour, the drugs are shown using rectangles and are yellow in colour while the proteins are white in colour and represented by circles. The blue and red arrows show the interaction between TFs and proteins and drugs and proteins, respectively.
Viruses 15 01188 g005
Table 1. Statistics for COVID-19 dataset.
GEOIDOrganNumber of GenesCOVID-19Healthy
GSE163151Blood21,952145113
GSE164332Brain57,99697
GSE164073Eye25,22299
GSE162736Heart23,1942424
GSE159201Intestine33,5501212
GSE173707Kidney24,97599
GSE151803Liver22,316129
GSE147507Lung20,7482129
GSE152075Nasopharynx19,74443054
GSE165890Pancreas22,05766
GSE156063Respiratory tract15,81193141
GSE153684Stomach26,50199
GSE171995Uterus19,71553
Table 2. Identified significant TFs are reported with corresponding PWM matrix ID, p-value and Adjusted p-value.
TFMatrix ID–PWMp-ValueAdjusted p-Value
KLF2MA1515.1 4.60 × 10 12 2.95 × 10 9
KLF3MA1516.1 8.17 × 10 10 5.19 × 10 7
KLF15MA1513.1 1.58 × 10 9 1.00 × 10 6
KLF6MA1517.1 1.14 × 10 8 7.27 × 10 6
NRF1MA0506.1 2.52 × 10 7 0.00016
SP9MA1564.1 4.28 × 10 7 0.00027
ZNF460MA1596.1 9.56 × 10 7 0.00061
ELK3MA0759.1 1.38 × 10 6 0.00088
HES1MA1099.2 5.99 × 10 6 0.00381
ZBTB14MA1650.1 6.58 × 10 6 0.00418
YY2MA0748.2 1.33 × 10 5 0.00845
ETV3MA0763.1 2.03 × 10 5 0.01290
ELK1MA0028.2 2.35 × 10 5 0.01493
OTX2MA0712.2 2.51 × 10 5 0.01594
ETV5MA0765.2 5.00 × 10 5 0.03179
ETV6MA0645.1 5.68 × 10 5 0.03611
KLF5MA0599.1 6.04 × 10 5 0.03843
SREBF1MA0829.2 6.12 × 10 5 0.03895
ELK4MA0076.2 6.44 × 10 5 0.04098
Table 3. Final set of 31 Genes and the related organs.
DesignationOrgansGenes
4*Blood, Heart, Nasopharynx, Respiratory tractHSPBP1
3*Blood, Nasopharynx, Respiratory tractP4HB
Blood, Nasopharynx, Respiratory tractRPS14
Heart, Lung, NasopharynxARCN1
Heart, Nasopharynx, Respiratory tractPRPF6
Lung, Nasopharynx, Respiratory tractBZW1
Blood, Nasopharynx, Respiratory tractRPS25
Blood, Nasopharynx, Respiratory tractNCL
Blood, Nasopharynx, Respiratory tractHEATR3
Blood, Heart, NasopharynxHNRNPH1
Blood, Nasopharynx, Respiratory tractNOP58
2*Nasopharynx, Respiratory tractARF1
Heart, NasopharynxPOM121
Nasopharynx, Respiratory tractCOQ8A
Nasopharynx, Respiratory tractPCBP1
Nasopharynx, Respiratory tractDYNLL1
Blood, NasopharynxTECR
Nasopharynx, Respiratory tractACTB
Nasopharynx, Respiratory tractMMS19
Heart, NasopharynxPFKP
Blood, NasopharynxHADHB
1*NasopharynxPPP2R1A
NasopharynxRPLP2
NasopharynxNUP188
NasopharynxVAC14
NasopharynxNOM1
NasopharynxCYC1
NasopharynxSEC61A1
NasopharynxPSMD2
NasopharynxDNAJC7
NasopharynxKARS1
Table 4. Possible Drugs and their corresponding details.
Human GenesDrugsAdjusted p-ValueDrug Bank IDTreatment
ARF1, PPP2R1A, HNRNPH1, P4HB, ACTBNitrofural0.0052DB00336Topical antibacterial for the prevention and treatment of bacterial infections of the skin
SEC61A1, ARF1, DNAJC7, PCBP1, PSMD2, TECR, CYC1, P4HB, ACTB, PFKPClindamycin0.0077DB01190Antibiotic used to treat serious infections caused by susceptible anaerobic, streptococcal, staphylococcal and pneumococcal bacteria
HNRNPH1, PSMD2, NCL, ACTB, ARCN1Ipratropium Bromide0.0101DB00332Used in the control of symptoms related to bronchospasm in chronic obstructive pulmonary disease (COPD)
ARF1, PRPF6, PPP2R1A, TECR, RPLP2, ACTBAmbroxol0.0130DB06742Airway secretion clearance therapy
ARF1, PPP2R1A, TECR, P4HB, ACTBPaclitaxel0.0133DB01229Treatment of advanced carcinoma of the ovary, and other various cancers including breast and lung cancer
ARF1, PPP2R1A, ACTBBenserazide0.0236DB12783Treat Parkinson’s disease, Parkinsonism, and restless leg syndrome
ARF1, PPP2R1A, HNRNPH1, ACTBAmikacin0.0351DB00479An aminoglycoside used to treat infections caused by more resistant strains of Gram-negative bacteria and some Gram-positive bacteria
ARF1, P4HB, ACTBCaptopril0.0420DB01197An ACE inhibitor used for the management of essential or renovascular hypertension, congestive heart failure, left ventricular dysfunction following myocardial infarction and nephropathy
Disclaimer/Publisher’s Note: The statements, opinions and data contained in all publications are solely those of the individual author(s) and contributor(s) and not of MDPI and/or the editor(s). MDPI and/or the editor(s) disclaim responsibility for any injury to people or property resulting from any ideas, methods, instructions or products referred to in the content.

