Article

Differential Expression of Genes between a Tolerant and a Susceptible Maize Line in Response to a Sugarcane Mosaic Virus Infection

by
Gustavo Rodríguez-Gómez
,
Pablo Vargas-Mejía
and
Laura Silva-Rosales
*
Laboratorio de Interacciones Planta-Virus, Departamento de Ingeniería Genética, Centro de Investigación y de Estudios Avanzados del IPN (Cinvestav), Unidad Irapuato Libramiento Norte Carretera Irapuato-León, Irapuato 36824, Mexico
*
Author to whom correspondence should be addressed.
Viruses 2022, 14(8), 1803; https://doi.org/10.3390/v14081803
Submission received: 20 July 2022 / Revised: 9 August 2022 / Accepted: 15 August 2022 / Published: 17 August 2022
(This article belongs to the Topic Plant Virus)

Abstract

:
To uncover novel genes associated with the Sugarcane mosaic virus (SCMV) response, we used RNA-Seq data to analyze differentially expressed genes (DEGs) and transcript expression pattern clusters between a tolerant/resistant (CI-RL1) and a susceptible (B73) line, in addition to the F1 progeny (CI-RL1xB73). A Gene Ontology (GO) enrichment of DEGs led us to propose three genes possibly associated with the CI-RL1 response: a heat shock 90-2 protein and two ABC transporters. Through a clustering analysis of the transcript expression patterns (CTEPs), we identified two genes putatively involved in viral systemic spread: the maize homologs to the PIEZO channel (ZmPiezo) and to the Potyvirus VPg Interacting Protein 1 (ZmPVIP1). We also observed the complex behavior of the maize eukaryotic factors ZmeIF4E and Zm-elfa (involved in translation), homologs to eIF4E and eEF1α in A. thaliana. Together, the DEG and CTEPs results lead us to suggest that the tolerant/resistant CI-RL1 response to the SCMV encompasses the action of diverse genes and, for the first time, that maize translation factors are associated with viral interaction.

Graphical Abstract

1. Introduction

Maize is one of the most important foods and staple crops around the world. However, it is affected by a variety of pathogens, such as the Sugarcane mosaic virus (SCMV), an ssRNA virus member of the Potyviridae family that causes leaf mosaics, chlorosis, and stunting [1]. Additionally, the SCMV has been shown to establish synergistic infections, together with viruses from the Machlomovirus genus (Tombusviridae family), causing maize lethal necrosis (MLN), with devastating effects, resulting in losses of up to 90% in China and Africa [2,3]. The best strategy to cope with such viral infections is the use of resistant maize lines such as FAP1360A [4,5], Siyi [6], and TR42 [7]. The resistance of FAP1360A has been attributed to the presence of the Scmv1 and Scmv2 loci on chromosomes 3 and 6, respectively. Scmv1 is an atypical thioredoxin h (Trx h) [8], whereas Scmv2 is an auxin-binding protein (ABP) [8,9,10]. Another maize line named CI-RL1 was identified in inbred evaluations for resistance to potyviruses at CIMMYT [11]. Negative viral RNA strands of the SCMV isolate Veracruz 1 (SCMV-Ver 1) virus were found in the inoculated leaves of the CI-RL1 line but were absent in distal leaves [11]. Those observations led us to consider CI-RL1 as a resistant line, but it remains unclear whether it uses a ZmTrx h-based defense mechanism.
Plants defend against pathogens by relying on the innate immunity of each plant cell and on the systemic signals produced at the infected sites [12,13,14,15]. Plant innate immunity is activated after the recognition of microbial- or pathogen-associated molecular patterns (PAMPs and MAMPs) by transmembrane recognition receptors (PRRs) [14,15]. PAMP-triggered immunity (PTI) is general and non-specific, characterized by the activation of early responses such as the production of reactive oxygen species (ROS), signaling cascade inducers (i.e., mitogen-activated protein kinases, MAPKs), and the accumulation of callose [14,16]. Pathogens can synthesize molecules that interfere with the activation of PTI called effectors [17]. Plants can specifically recognize effectors if they possess resistant (R) genes, proteins with nucleotide-binding sites (NBSs), and leucine-rich repeat (LRR) domains [18], resulting in effector-triggered immunity (ETI) [15] and leading to the activation of ROS, MAPKs, and phytohormone signaling routes [19,20,21,22]. In addition, ETI also activates the production of defense proteins associated with cell death in an antiviral process called the hypersensitive response (HR) [23,24]. ETI relies on intracellular R genes to recognize avirulence (AVR) proteins derived from the RNA virus and triggers an HR or programed cell death (PCD) in resistant hosts [25,26]. On the other hand, the PTI response is regarded as RNA silencing [27,28], a mechanism triggered by the detection of double-stranded RNA (dsRNA). Upon detection, the dsRNA is cleaved by Dicer-like proteins (DCLs) into small interfering 21–25 ribonucleotides (sRNAs). One of the dsRNA strands is loaded in the RNA-induced silencing complex (RISC) by the Argonaute (AGO) proteins; the RNA strand is then used as a guide to direct RNA degradation [27]. Recent evidence suggests that the triggering of a classical PTI response by virus-derived nucleic acids is a PRR-recognized PAMP [26,29].
RNA viruses rely on interactions with specific host proteins to complete their replication cycle [30]. Mutations in these proteins lead to a resistant phenotype in the host. As these mutations are inherited recessively and the presence of the wild-type alleles results in susceptibility, these genes are called susceptibility factors [31]. Some of these host proteins are diverted and used for the translation of the viral genome or are recruited to enhance replication or to participate in virus movement [32]. Most of the susceptibility factors that yield potyvirus resistance correspond to alleles of the eukaryotic initiation factor 4E (eIF4E) [33]. The importance of eIF4E relies on its interaction with the potyvirus VPg protein, which is a key factor in the translation of the potyviral genome [34]. Another susceptibility factor is heat shock protein 70 (Hsp70), a chaperone interacting with the CP of Potato virus A (PVA), necessary for viral gene expression and replication [35]. Two heat shock proteins, Hsp40 and Hsp90, are involved in the innate immunity of the plant [36,37,38,39]. Another susceptibility factor, plasma membrane-associated cation-binding protein 1 (PCap1), has been shown to be related to Potato virus Y (PVY) accumulation and cell-to-cell movement [40]. Concerning virus movement, the Potyvirus VPg-interacting protein (PVIP1) from Pysum sativum is associated with the long-distance movement of the Pysum sativum mosaic virus (PsMV) [41]. A homologous PVIP mutant in Arabidopsis thaliana (L.) Heynh. does not allow VPg interaction and restricts the long-distance movement of the Turnip mosaic virus (TuMV), thus granting resistance. The role of these genes in maize resistance to the SCMV has not been explored.
Plants also cope with pathogen infection by using another mechanism called tolerance. While resistance limits pathogen multiplication [42,43,44], tolerance reduces the effect of the infection on the host’s fitness, regardless of the level of pathogen multiplication [44,45,46]. Both mechanisms—resistance and tolerance—coexist, and there is no evidence that tolerance necessarily implies an increase in pathogen multiplication [44].
To better understand the CI-RL1 response to the SCMV, we analyzed differentially expressed genes among a tolerant line (CI-RL1), a susceptible line (B73), and the F1 progeny derived from both lines. We used two main approaches with transcriptomic analyses. The first involved the identification of the differentially expressed genes (DEGs) in the functional enrichment network of biological processes (BPs) and cellular components (CCs), whereas the second involved an analysis of the clustering of transcript expression patterns (CTEPs) to allocate previously reported candidate genes. Through our analyses of DEGs and the Gene Ontology (GO) enrichment of BPs and CCs, three candidates stood out: heat shock protein 90-2 and two ABC transporters. CTEPs provided additional evidence for the diverse (and hence complex) behavior of the eIF4E homologs in maize—particularly the eEF1α factors. CTEP analysis also allowed the identification of two genes implied in long-distance movement: the maize homologs to the PIEZO channel (ZmPiezo) and to the Potyvirus VPg Interacting Protein 1 (ZmPVIP1).

2. Materials and Methods

2.1. Virus and Plant Materials

A previously characterized SCMV isolate, SCMV-Ver1, was used as the viral inoculum and was kept at −70 °C. The inoculum was reactivated by inoculating B73 susceptible plants with a mixture of approximately 500 mg of frozen ground infected tissue, 1 mL of PBS 1X buffer (Gibco, Life Technologies, Grand Island, NY, USA), and a small amount of carborundum. Inoculated leaves showing classic mosaic symptoms were then ground and used to further inoculate healthy maize plants at the third true leaf stage.
Three maize lines were used in this study. Two of them, CI-RL1 and B73, were obtained and donated by the Centro Internacional de Mejoramiento de Maíz y Trigo (CIMMYT). Additionally, an F1 line (CI-RL1 × B73) was generated in the state of Jalisco (Vallarta), Mexico using CI-RL1 as the female and B73 as the pollen donor. The potyvirus resistance donor for CI-RL1 was derived from a diverse background unrelated to line B73.

2.2. Experimental Design and Sequencing

We grew four plants of each line (B73, F1, and CI-RL1) in a greenhouse until they reached the third true leaf stage. All of the fully developed leaves were inoculated with the SCMV-Ver1 isolate. The plants were observed daily and at 7 dpi, the SCMV Coat Protein (SCMV-CP) cistron was detected around the ligule zone in the inoculated leaves but not in the asymptomatic portions or in the young systemic leaves of the susceptible plants. At 17 dpi, when SCMV-CP cistrons and symptoms appeared in the youngest leaves of the susceptible B73 line, the leaves from all lines were collected and stored in an ultra-freezer at −70 °C. The total RNA was extracted from 100 mg of frozen tissue using TRIzol reagent (Thermo Fisher, Waltham, MA, USA) according to the manufacturer’s instructions. The concentration of the resulting total RNA was determined with a Nanodrop 2000 spectrophotometer (Thermo Fisher Scientific, Wilmington, DE, USA). To confirm viral infection in the inoculated plants, we extracted RNA to amplify the SCMV-CP cistron through RT-PCRs (Figure 1C). We prepared a duplicate of each sample from the mix of RNA of four plants with the same RNA concentration. The mRNA was purified from the RNA pools using Dynabeads (Invitrogen, Waltham, MA, USA) according to the manufacturer’s instructions. A total of 24 paired-end (2 × 150) RNA-Seq libraries (six treatments from inoculated and non-inoculated B73, CI-RL1, and F1) were prepared and sequenced at the Beijing Genomics Institute facility, using DNBSEQTM technology (BGI, CHN). The raw data are publicly available from the National Center for Biotechnology Information (NCBI), under BioProject accession number PRJNA846583.

2.3. Mapping and Differential Expression Analysis

The trimming of the adaptors and the cleaning of low-quality reads were conducted as described previously [47]. Mapping and expression quantification were conducted with Kallisto v.0.46.1, as described by Vargas-Mejia [48]. Reads that failed to map to the reference B73 transcriptome retrieved from PLAZA 4.5 monocots (https://bioinformatics.psb.ugent.be/plaza/versions/plaza_v4_5_monocots (accessed on 4 June 2021)) were assembled de novo with Trinity v.2.11.0 under standard parameters [49]. Non-mapped reads were re-mapped to the de novo assembled transcripts and quantified as described earlier. The differential expression analysis was performed with Sleuth v.0.30.0, as reported before [50], comparing each infected maize line with its mock treatment. Genes with p-values of ≤0.05 were considered differentially expressed genes (DEGs).

2.4. Construction of CTEPs

The raw data of all the lines were mapped and quantified using Kallisto v.0.46.1 as described by Vargas-Mejia [48]. Then, the crude data were inserted in the Clust v.1.7.0 software where it was processed under standard parameters with TPM normalization [51]. Five CTEPs (C0 to C4) were obtained according to the basal expression level (BEL) of transcripts in the cluster: C0, low for B73 and F1 while high for CI-RL1; C1, intermediate for F1, low for B73, and high for CI-RL1; C2, low for B73 and high for F1 and CI-RL1; C3, low for RL and high for B73 and F1; C4, low for F1 and CI-RL1 and high for B73 (Figure 2A). Then, the clusters were grouped according only to their BELs for CI-RL1: high in Group 1 (C0, C1, and C2), and low in Group 2 (C3 and C4).

2.5. Functional Enrichment

Gene annotation data for reference B73 transcripts were downloaded from PLAZA 4.5 monocots (https://bioinformatics.psb.ugent.be/plaza/versions/plaza_v4_5_monocots (accessed on 4 June 2021)). For the de novo assembled transcripts, annotation was carried out using the Trinotate pipeline [52]. Then, a functional enrichment analysis was performed using PANTHER v17.0 with Fisher’s exact test, considering a false discovery rate of ≤0.05. Enrichment results were summarized with REVIGO (http://revigo.irb.hr/ (accessed 17 March 2022)), with a small similarity of 0.5 and SimRel as the semantic similarity score [53].

2.6. Gene Expression Validation

To validate the bioinformatic results of gene expression, we carried out an RT-qPCR analysis of 10 candidate genes (Supplementary Figure S1), using the same source of RNA for sequencing. Additionally, 6 genes were evaluated at 2, 7, 12, and 17 dpi in three pools of leaves from two plants of each line. The cDNA synthesis was carried out with the RevertAid minus H enzyme (Thermo Scientific, Vilnius, Lithuania). RT-qPCR analyses were performed in a CFX96 Real-time system (BioRad, Hercules, CA, USA) with Maxima SYBR Green qPCR/ROX qPCR Master Mix (2X) (Thermo Scientific, Vilnius, Lithuania). The relative expression was calculated using the 2 (−ΔΔCt) method and was normalized with β-tubulin as the housekeeping gene.

3. Results

3.1. Symptom Development in B73, CI-RL 1, and F1 Progeny

We observed the plants daily for the presence of mosaic symptoms after inoculation with the SCMV-Ver 1 isolate. The susceptible B73 plants showed mosaic symptoms on the ligule zone as soon as 7 dpi, with a strong chlorotic mosaic in the first- and second-youngest leaves. Symptoms in the CI-RL1 and F1 progeny (F1) plants were not detected at this time. After 17 dpi, the CI-RL1 plants were asymptomatic and almost identical to the non-infected controls. Meanwhile, in the F1 leaves, a slight mosaic was observed alongside the central vein and in the basal region (Figure 1B). The F1 plants were taller, which could possibly be attributed to a heterosis effect. The presence of the SCMV-CP cistron was absent from the CI-RL1 samples but was found in all eight plants of the B73 and F1 samples (Figure 1C). Furthermore, the average expression levels of SCMV-CP measured in three pools of two plants for each line at 2, 7, 12, and 17 dpi showed increasingly high levels in the B73 line, increased and decreased levels in the F1 progeny, and decreasingly low levels in CI-RL1 (Table 1). At 30 dpi, we noticed continuously increasing levels in all the lines, but CI-RL1 showed viral levels that were 100 and 50 times lower than those of B73 and F1, respectively (Table 1).

3.2. Gene Expression Profiling Is Similar between Susceptible B73 and F1 Progeny

To analyze the global host response to the SCMV infection, we obtained the transcriptomes of the B73, F1, and CI-RL1 maize lines at 17 dpi and their respective sets of mock-inoculated plants. A total of 24 libraries were paired-end sequenced (PE 2 × 100), each one producing at least 10 million reads. After the differential expression analysis, genes with p-values of ≤0.05 were considered DEGs. We found a total of 5424 DEGs in all the maize lines; 2604 corresponded to B73, 1553 to F1, and 2406 to CI-RL1. For B73, we found 1793 to be upregulated and 811 to be downregulated. For F1, 959 and 594 were up- and downregulated, respectively, and 1048 were upregulated and 1358 were downregulated in the CI-RL1 line. Only 92 genes were differentially expressed in all three lines, corresponding to 1.69% of the total DEGs (Figure 3A). The susceptible B73 line and the F1 line were more similar, sharing 450 and 157 of the respective up- and downregulated genes (Figure 3B,C). The CI-RL1 line shared only 32 and 22 of the upregulated and 23 and 49 of the downregulated DEGs with F1 and B73, respectively. These results indicate a higher transcriptome similarity between the B73 and the F1 lines than with CI-RL.

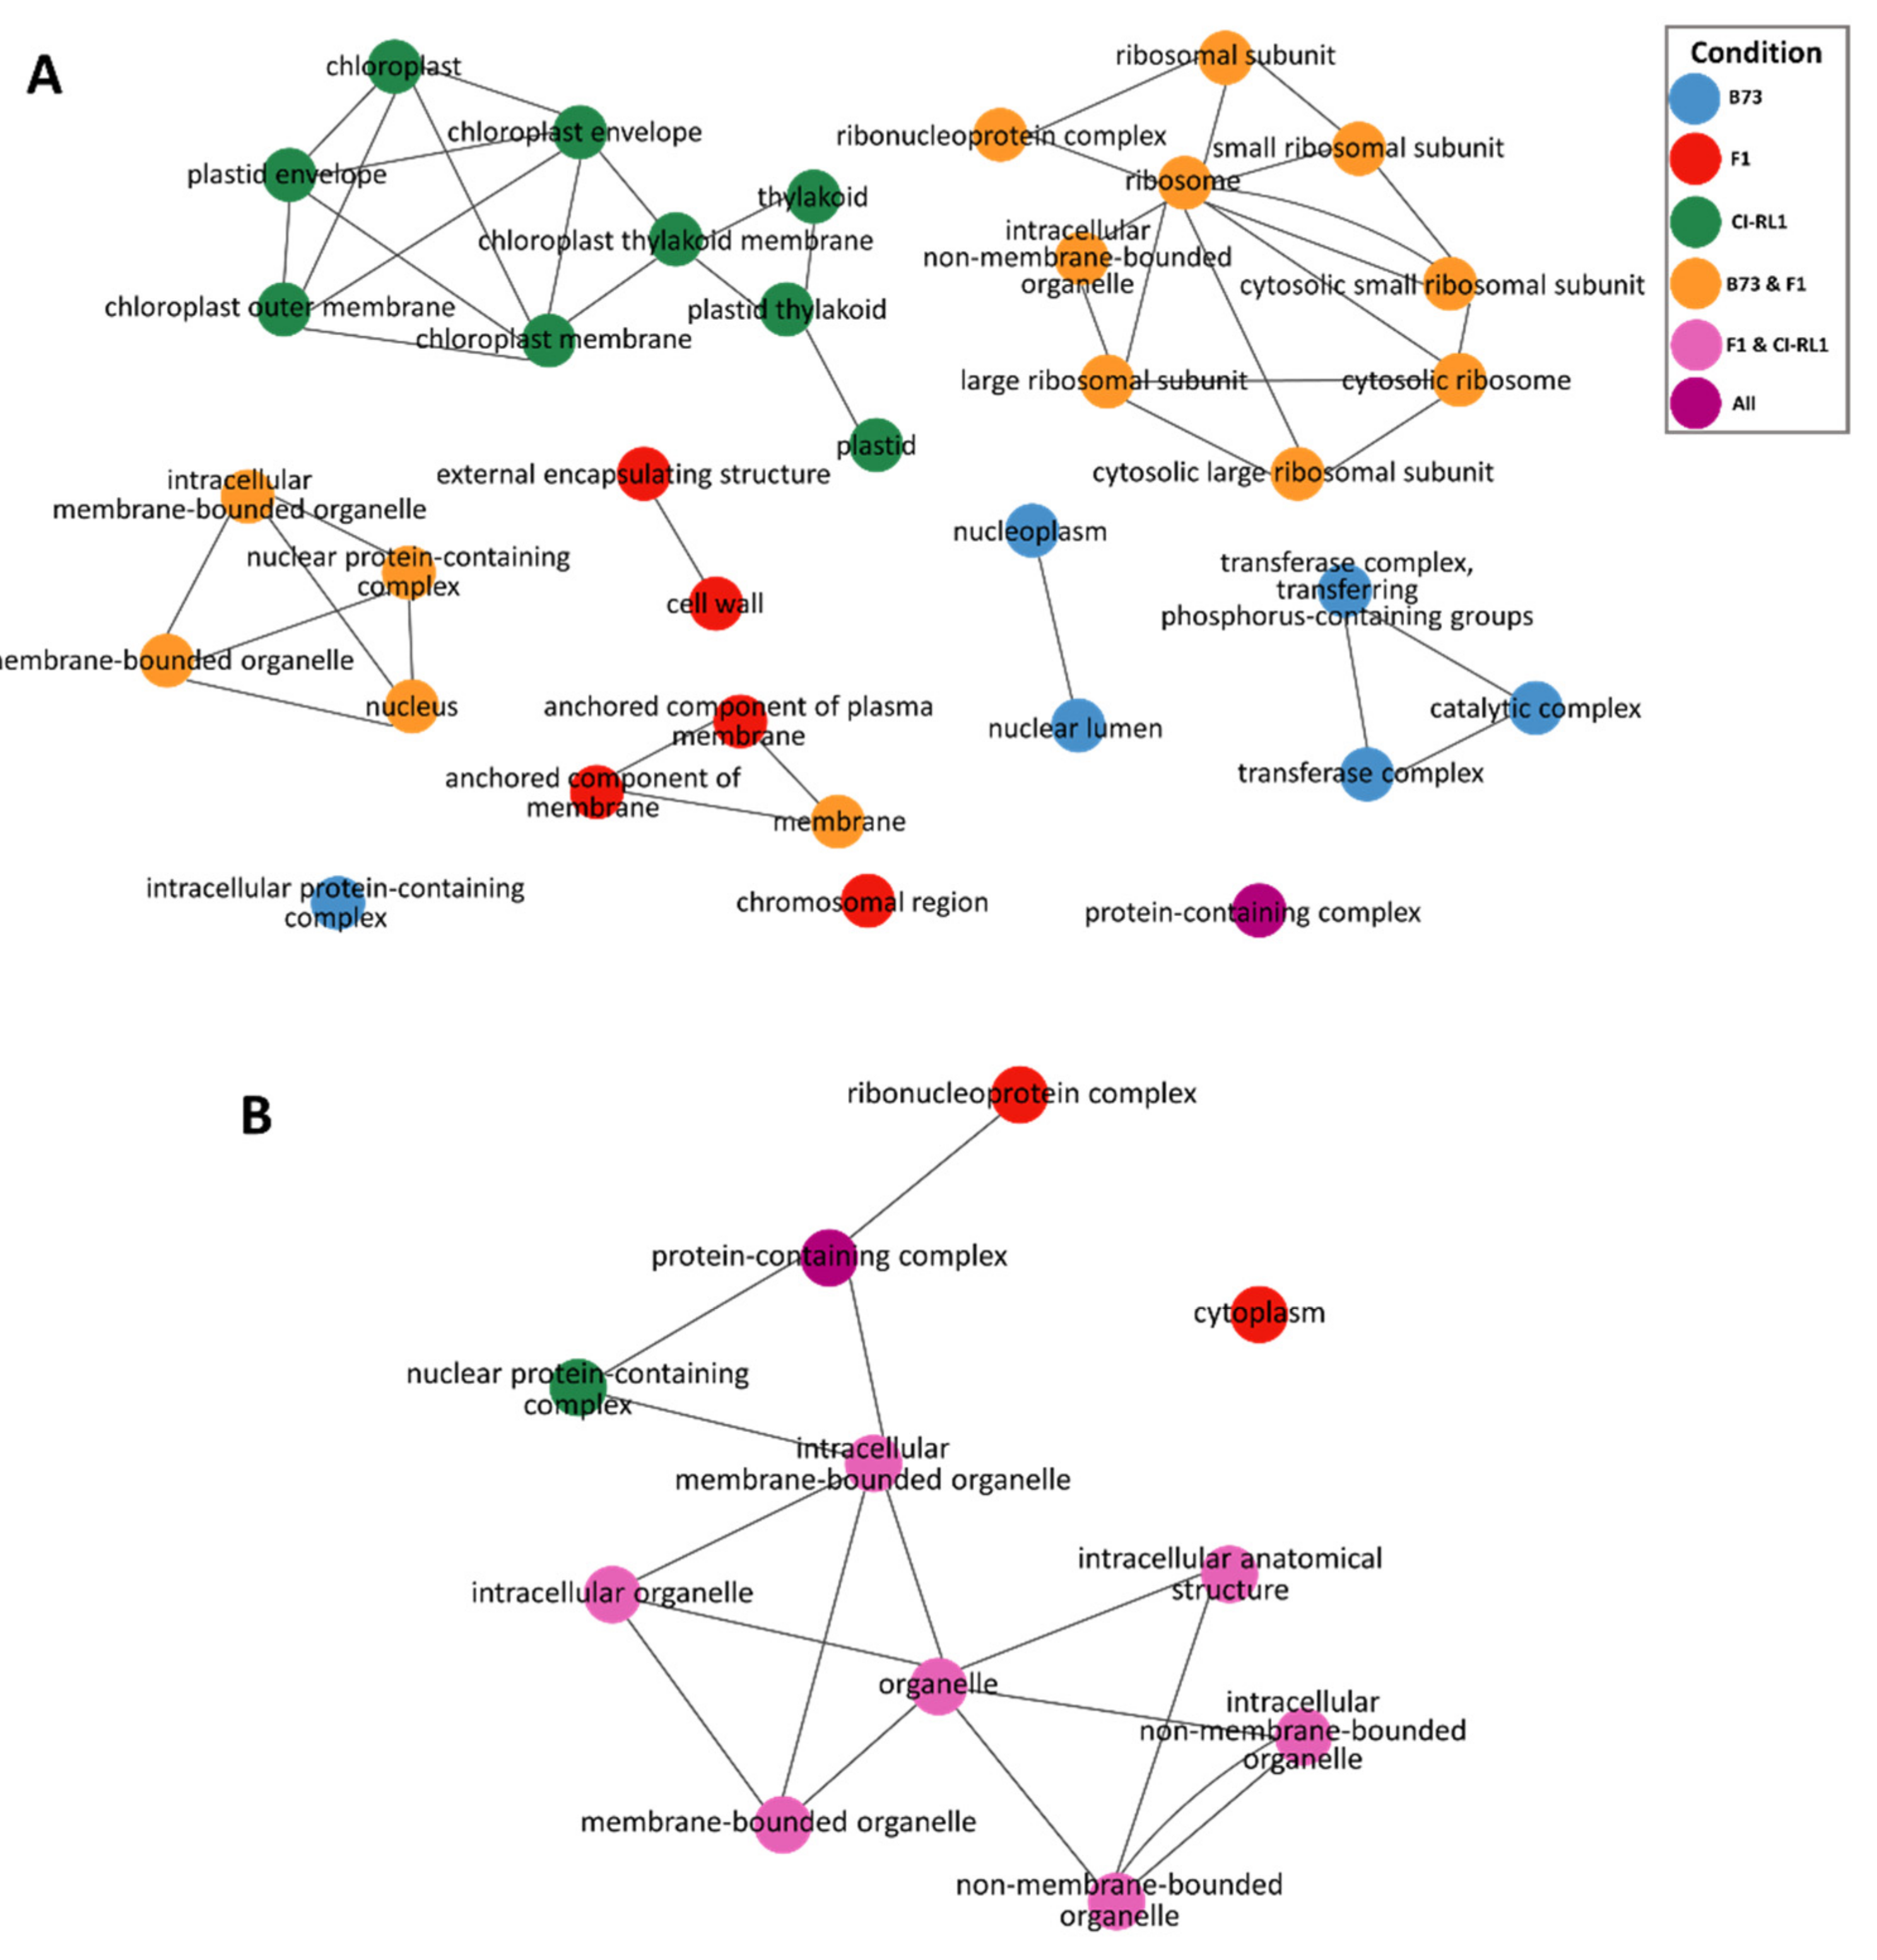
3.3. Up- and Downregulation of Enriched Cellular Components after SCMV Infection

We performed a functional enrichment analysis to estimate the transcriptomic responses of our three different maize lines after the SCMV-Ver1 infection. We detected 34 upregulated and 11 downregulated enriched CCs in three main clusters (Figure 4). For the upregulated components, seven groups shared connections and three were individual CCs (GO terms: “intracellular protein-containing complex”, “chromosomal region”, and “protein containing-complex”). For B73 alone, six enriched CCs formed two groups: one contained three related to “catalytic and transferase complexes” and the other contained two, namely, “nucleoplasm” and “nuclear lumen” (Figure 3A, blue). For CI-RL1 alone, we found only one group containing nine CCs (GO terms: “chloroplast”, “chloroplast envelope”, “plastid envelope”, “chloroplast membrane”, “chloroplast outer membrane”, “chloroplast thylakoid membrane”, “thylakoid”, “plastid thylakoid”, and “plastid”) (Figure 4A, green). For the B73 + F1 combination (Figure 4A, orange), 14 GO terms were enriched and separated into three groups. The first contained nine CCs associated with the ribosome, the second included four related to the “nucleus and organelle membranes”, and the third was a mix of one for B73 + F1 (GO term “membrane”) and two “anchored components of membrane” for F1 (Figure 4A, red). The last group included only two CCs enriched in F1 alone, namely, the “external encapsulating structure” and “cell wall”.
Of the 11 downregulated transcripts in the CCs (Figure 4B), we observed one connected group and one isolated CC (GO term: “cytoplasm”). For the F1 line alone, the “ribonucleotide complex” (Figure 4B, red) interacted with the “protein-containing complex” CC (Figure 4B, purple), which was enriched in all lines. For CI-RL1 alone, only the “nuclear protein-containing complex” was present in the group (Figure 4B, green). The rest of the group members were enriched for CI-RL1 + F1 and these were related to “organelle” GO terms (Figure 4B, pink).

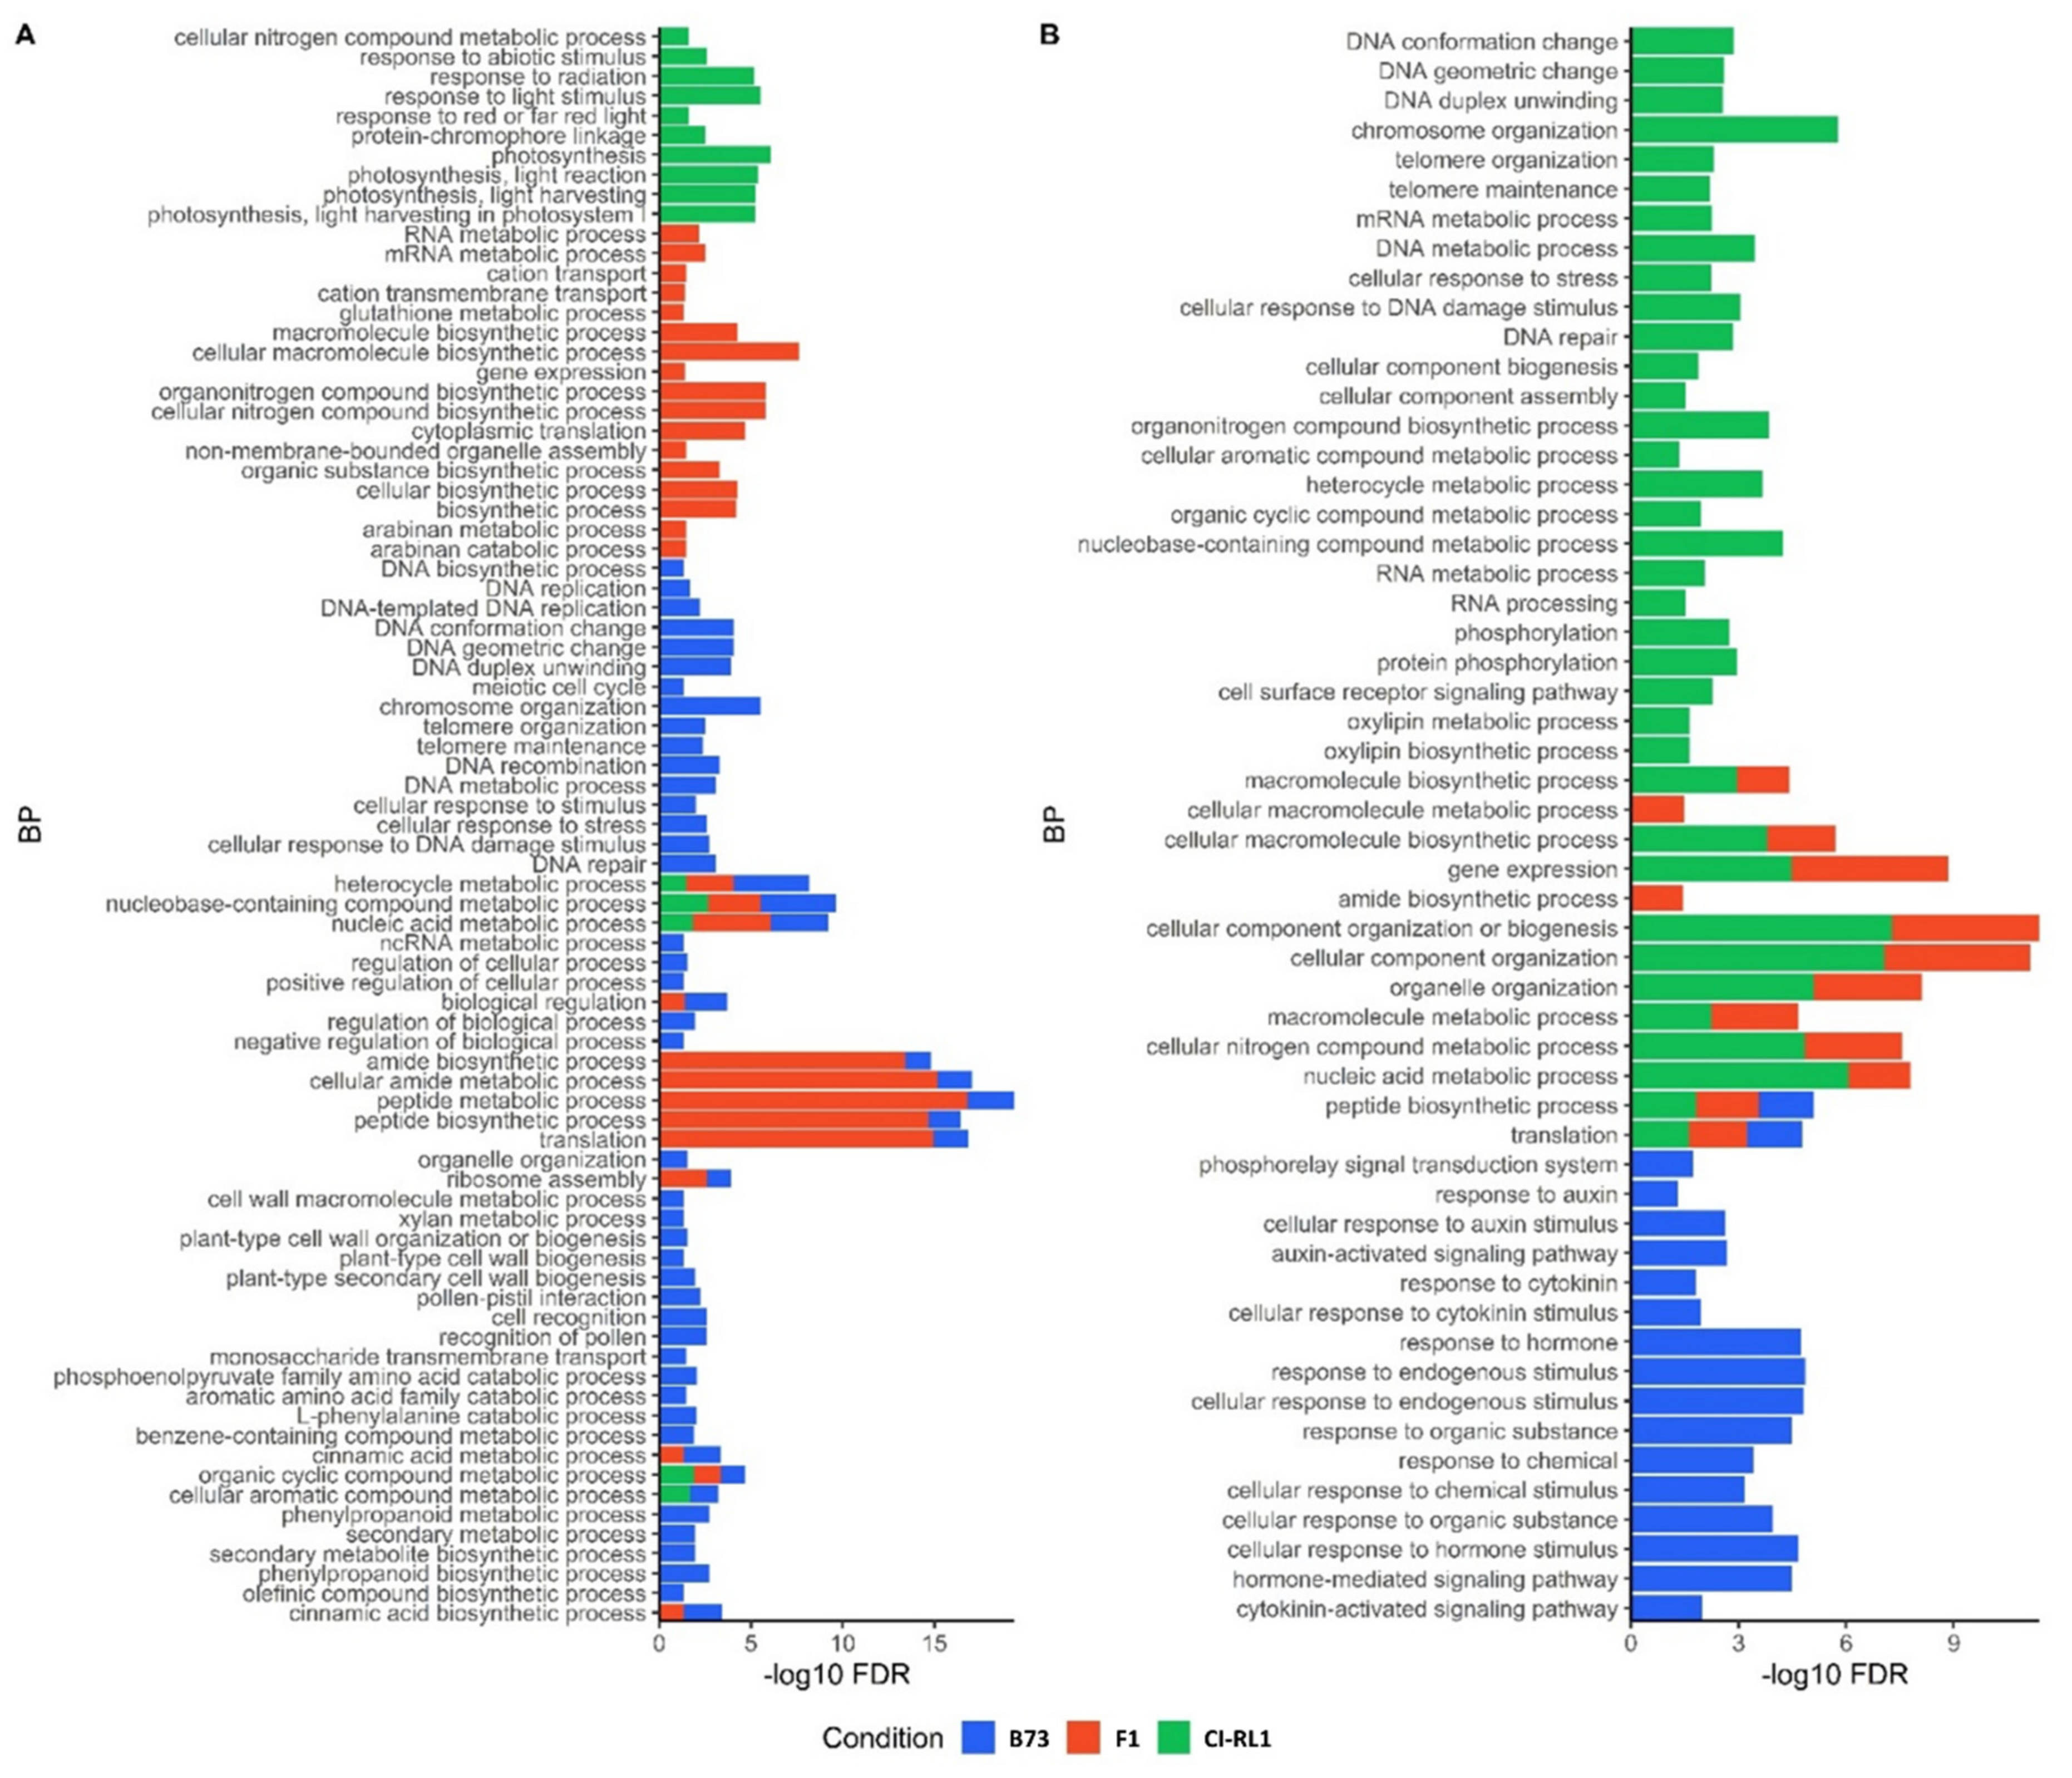
3.4. Enriched Biological Process Shows the Predominance of Downregulated CI-RL1 Transcripts

We found 98 upregulated and 67 downregulated BPs. Most of the upregulated BPs were in the B73 line, followed by F1 and RL. The BPs of B73 (Figure 5A, blue) showed enrichment in the processes related to DNA organization, DNA damage response, and DNA metabolism; the regulation of the metabolic process; cell wall biogenesis; and the production of secondary metabolites. The tallest bars were found in the F1 line and these were related to protein and amide biosynthesis (Figure 5A, red). For CI-RL1, the upregulated enriched BPs were related to photosynthesis and the responses to radiation, light stimuli, and abiotic stimuli (Figure 5A, green). In contrast, the BPs of the downregulated transcripts were mainly enriched in CI-RL1. For B73, the downregulated BPs were related to phytohormones and their signaling (Figure 5B, blue), whereas those enriched in CI-RL1 were related to DNA and RNA organization, metabolic processing, cellular response to stimuli, and the production of secondary metabolism. The F1 progeny shared most of its downregulated enriched processes with CI-RL1 (Figure 5B, green and red bars). The only two exclusively enriched BPs for F1 were related to the cellular macromolecule metabolic process and the amide biosynthetic process.

3.5. Candidate Genes Associated with the CI-RL 1 Tolerance/Resistance Response to SCMV Were Selected with Different Criteria

We used three criteria to select candidate genes associated with tolerance. First, we selected the most upregulated transcripts of the CI-RL1 line; second, we selected the CI-RL1 upregulated transcripts derived from the BP and CC enrichment study; and third, we made selections based on the expression levels of the transcripts between the three lines. For the first criterion, we chose the transcripts with log2 FC > 2.9. We then used the Monocots PLAZA 4.5 database to assign a V3 identifier that could be associated with a gene model, as well as a description indicating the possible function determined by gene homology. We chose 175 transcripts, of which 62 (35.4%) had no assigned V3 identifier, 17 (9.7%) had a V3 identifier without a description, and 31 (17.7%) did not have any identifier or description. The most highly upregulated transcript for the CI-RL1 line corresponded to the Zm00001d035392 transcript, with a log2 FC of 5.9, described as a “cycloartenol synthase” but without a V3 identifier. The lack of information for the transcripts led us to search according to the second criterion. In Table 2, we list thirty-two of the candidates with a putative relationship with tolerance. These candidates include eukaryotic translation initiation factor 6 (Zm00001d008223), heat shock protein 90-2 (Zm00001d031332), argonaute 1 (Zm00001d011096), and some ABC transporters. These candidates were up- or downregulated in only one or two of the lines. To search for genes with differential levels of expression between the three lines, the complete list of the DEGs for the B73 and F1 downregulated genes was compared with the full list of the upregulated genes for CI-RL1. We chose the genes present in the three lines, and the 19 with the highest expression for CI-RL1 are listed in Table 3. We also listed 19 genes with a higher expression for B73 after comparing the B73 and F1 upregulated genes with the downregulated genes of CI-RL1 (Table 3). In this set of data, we highlight the AP2-EREBP transcription factor (Zm00001d021205), CBF3-like protein (Zm00001d006169), and a catalase (Zm00001d027511). On the other hand, pathogenesis-related protein 5 (PR5; Zm00001d031158) and leucoanthocyanidin dioxygenase (Zm00001d030548) were strongly upregulated in B73 and downregulated in CI-RL1 (Table 3).

3.6. Thirteen Selected Candidate Genes Have High Basal Expression in CI-RL1

An analysis of the DEGs highlighted genes with possible roles in SCMV tolerance, for instance, argonaute and Hsp90-2. However, this approach may have excluded recessive resistance genes or susceptibility factors with unchanged expression levels. In order to detect these types of genes, we grouped five clusters of the transcripts’ expression patterns (CTEPs) according to the basal expression levels (BELs) for CI-RL1 (Figure 2A). Group 1 had a high BEL for CI-RL1 and included clusters C0, C1, and C2. Group 2 had a low BEL for CI-RL1 and contained clusters C3 and C4. After reviewing the current knowledge pertaining to the resistance genes of maize to the SCMV and other potyviruses, we generated a list of 57 candidate genes [54,55] and found 43 of them in our CTEPs. There were 13 in Group 1; 27 in both Groups 1 and 2, which were discarded (because they had high and low BELs for CI-RL1); and only 3 were found exclusively in Group 2 (Inositol-requiring protein-1 B (IRE1B), Plasmodesmata-located protein (PDLP) in C4, and Poly (A)-binding protein 8 (PBAP8) in C3); see Figure 2B. Of the 13 candidates in Group 1, 2 of them were associated with long-distance movement (ZmPVIP1 and ZmPiezo), 3 with cell-to-cell movement (β-1,3-glucanase (BG3), PCap1, and myosin), and 7 with the initiation or enhancement of viral replication (Essential for poteXvirus Accumulation 1 (EXA1), Sm motif protein (LSM1), Prunus persica DEAD-box RNA helicase-like (PpDDXL), Inositol-requiring protein-1 A (IRE1A), Rice dwarf virus multiplication 1 (RIM1), Chloroplast phosphoglycerate kinase (Chl-PGK), and Re initiation supporting protein (RISP)). One of the listed genes (S-adenosyl-L-methionine synthetase (OsSAMS1)) does not participate in the virus infection cycle. In Group 2, two candidates were involved in virus replication (IRE1B and PBAP8) and one in cell-to-cell movement (PDLP).

3.7. Differences in Translation and Elongation Factor Coding Transcripts in the CI-RL1 Line

The interaction of the potyvirus VPg protein with the translation initiation factor eIF4E and/or its isoforms plays a central role in the virus infectious cycle [56]. A search in the maizeGDB database revealed that maize has six genes annotated as eukaryotic initiation factors (Supplementary Table S2). The maize eIF4E homolog was found in the C4 cluster annotated as eif6 with low BELs in CI-RL1 and F1, although maintaining high BELs in B73. Furthermore, two more eIFs were identified in cluster C3: one corresponding to the gene model GRMZM2G022019 and annotated as eif-7, and other corresponding to the gene model GRMZM2G113096 without annotation and assigned as ZmeIF4E.
Additionally, the eukaryotic elongation factors (eEFs), which also participate in protein synthesis, were present in all clusters (C0-C4). Furthermore, as observed in the CTEPs analysis, different gene models and transcripts of the eEFs were found depending on their genetic backgrounds (Table 4). A search in the MaizeGDB database showed 11 genes annotated as eEFs (Supplementary Table S1). Thus, the results of the response to the SCMV could be an effect of the variety of the kinds of transcripts favored in each line.
As eEF1α was not detected in the list of DEGs, homologs were searched in the set of genes not surpassing the threshold established (>1 or −1 for up- and downregulated genes, respectively). Four homologs of eEF1α (Table 3, gray rows) with differential expression levels were found: the first was Zm00001d037873, corresponding to GRMZM2G154218, annotated as elfa3, and upregulated in B73 and F1; the second was Zm00001d036904, corresponding to GRMZM2G343543, annotated as elfa10, and upregulated in B73; the third was Zm00001d037877, corresponding to GRMZM2G001327, annotated as elfa12, and upregulated in B73 and F1 but downregulated in CI-RL1; and the fourth was Zm00001d025100, corresponding to GRMZM2G060842, without annotation but designated as Zm-elfa, and downregulated in CI-RL1.

4. Discussion

4.1. Resistance or Tolerance of the CI-RL1 Line

Using RNAseq analysis, we explored the possible role of a set of selected genes associated with the CI-RL1 response to the SCMV through analyses of DEGs and derived CTEPs. Maize resistance to the SCMV was reported more than 30 years ago [57], and only two genes proposed for resistance have been recently discovered: thioredoxin, corresponding to the locus Scmv1, and nABP corresponding to Scmv2. We have previously shown that the long-distance movement of SCMV-Ver1 is impaired in CI-RL1 [11]. The CI-RL1 line was originally deemed virus resistant due to the lack of SCMV symptoms and the absence of CP (cistron and protein) signals in distal leaves [11]. However, the finding of SCMV-Ver1 transcripts in systemic leaves via RNAseq and qRT-PCR analyses, in addition to genes in the CTEP analysis associated with the viral cycle, suggests that CI-RL is more of a virus-tolerant than a virus-resistant line.

4.2. DEG Analysis Pinpoints Multi-Genic Tolerance

After the analysis of the DEGs, seventy-four genes were selected: thirty-five derived from the enrichment of the BPs and CCs, one from the most highly upregulated genes for CI-RL 1, and thirty-eight for the DEGs between lines. The analysis of the enrichment of the CI-RL1 BPs and CCs highlighted genes related to photosynthesis, chloroplasts, and thylakoid membranes. During potyviral infection, the formation of vesicles, such as viral replication complexes (VRCs), is essential. Inside these vesicles, host cellular components are recruited and used for virus replication [58,59]. Some potyviruses use the chloroplast and ER membranes [60,61] to produce VRCs with concomitant chlorophyll breakdown and leaf yellowing during severe chlorosis [62,63,64]. As CI-RL1 tolerates the SCMV, the increase in photosynthesis and chloroplast-related transcripts could be a response aiming to alleviate the effects of the formation of VRCs. Such effects include the SCMV’s characteristic chlorosis (absent in CI-RL1) and an increase in ROS species. We also observed an increase in genes involved in the detoxification of ROS in B73. The liberation of fragments or the content of some organelles could act in signaling under the attack of a pathogen in the so-called damage-associated molecular pattern (DAMP), generating an ROS burst response [65,66,67,68]. The over-accumulation of ROS species (also called oxidative stress) can damage and disrupt the functioning of cellular components [69,70]. An effect on the enzymes involved in ROS detoxification has been reported in Phaseolus vulgaris plants treated with hormones and infected with a non-lesion-forming isolate of the White clover mosaic potexvirus (WClMV) [71]. The catalase, glutathione reductase, and superoxide dismutase activities of P. vulgaris were reduced, whereas peroxidase activity was increased [71]. In our case, eleven peroxidases were upregulated and only three were downregulated in the B73 line (Table 2). Additionally, a catalase corresponding to the gene model GRMZM2G090568 was downregulated in the B73 line, emulating the observations regarding P. vulgaris. Thus, the upregulation of peroxidases and the downregulation of catalases appear to be the responses of susceptible lines to infection. Here, CI-RL1 did not show the upregulation of peroxidase transcripts, but the catalase codified by the GRMZM2G090568 gene model was upregulated. Although the evidence is limited, it is tempting to speculate an effective and transient response to preventing cellular damage through ROS detoxification. This appears to be a strategy for CI-RL1 tolerance to the SCMV as a consequence of an early response to infection.
Among the thirty-five candidates from the BPs and CCs, the chaperone heat shock protein 90-2 (Hsp90-2) and ABC transporters were especially noteworthy. The chaperones enable mis-folded or aggregated proteins to correctly fold [72,73] and are also involved in targeting proteins for degradation [74]. They are also activated in response to biotic and abiotic stresses. Chaperone-mediated protein folding was up- and downregulated in the B73 line (Figure 5B). Potyviruses recruit the Hsp70 chaperone in the formation of replication complexes [35,75]. Another pair of Hsps—Hsp40 and Hsp90—appear to be involved in viral infections [36,37,38]. Hsp90 activates various cytosolic R proteins, such as the N tobacco protein, helping in the pathogen defense response [39]. The silencing of Hsp90 by means of a virus-induced gene silencing (VIGS) strategy in N. benthamiana caused the loss of resistance to P. syringae, the Tobacco mosaic virus (TMV), and the Potato X virus (PVX), confirming the key role of Hsp90 against pathogens [76]. The increase in the expression levels of Hsp90-2, corroborated by the qRT-PCR analysis (Figure S1), suggests a possible association with the observed tolerance response in the CI-RL1 line.
A diversity of ATP-binding cassette (ABC) transporters was detected in the BPs’ DEG data. The ABC transporters move diverse, structurally unrelated components across the membrane and intervene in plant–pathogen interactions [77,78,79,80]. These transporters have at least two transmembrane domains (TMD) and two ABCs or nucleotide binding domains (NBDs) [81]. Based on TMD and NBD sequence homology, the mammalian ABC transporters are grouped into seven subfamilies (ABC A to ABC G) [82,83,84,85]. In addition to transport, a defense-related function has been described in plants. A wheat ABC transporter (lr34 gene) has been reported as a multi-disease resistance gene (MDR) against fungal pathogens [86,87]. Furthermore, maize plants expressing the Lr34 wheat gene showed resistance against two fungal pathogens [88]. The protein codified by the maize gene model GRMZM2G014282 was identified as the best homolog to the Lr34 protein. The GCN-type ABC transporter from Lilium regale E.H. Wilson has been shown to be involved not only in defense against fungi but also against viruses [80]. This pathogen resistance is not due simply to the presence of the ABC transporter, as discussed by Sun et al. (2016) [80], but rather a more complicated network of genes in which the transporter plays a pivotal role appears to be involved. In our data, seven transcripts (Zm00001d050259, Zm00001d043762, Zm00001d004442, Zm00001d008178, Zm00001d048329, Zm00001d024497, and Zm00001d025043)—of which only six have a V3 identifier (GRMZM2G091478, GRMZM5G808836, GRMZM2G167658, GRMZM2G085111, GRMZM2G361256, and GRMZM2G165757)—were found (Table 2). Only two transcripts, corresponding to GRMZM2G167658 and GRMZM2G085111, were upregulated in the CI-RL1 line. The other transcripts were downregulated in CI-RL1 and upregulated in the B73 line or downregulated in B73 (Table 2). It is tempting to speculate that the high levels of expression of GRMZM2G085111 and GRMZM2G167658 imply their role in the SCMV tolerance response. However, our data are not sufficient to completely support such a hypothesis. Overall, GRMZM2G085111, GRMZM2G167658, and the rest of the ABC transporters deserve further research.
We found CAS (cycloartenol synthase; Zm00001d035392) to be the most highly expressed gene for the CI-RL1 line without a V3 identifier, and therefore a gene model could not be assigned. We found two more CASs to be upregulated in CI-RL1, corresponding to transcripts Zm00001d008671 and Zm00001d035389, with log2 FC values of 4.5 and 3.5, respectively. The latter had the V3 gene model identifier GRMZM2G390429. CAS is responsible for phytosterol biosynthesis, using oxidosqualene as a substrate [89]. Phytosterols are key compounds involved in maintaining membranous structures [89,90]. Although a role for CAS in virus resistance has not been reported, two CAS1-like genes were found in the region of the Scmv2 locus [91]. Its closeness to the resistance gene for Scmv2, in addition to its expression level in CI-RL1, makes CAS a promising candidate that requires further experimental work. The lack of information available for the Zm00001d035392 and Zm00001d008671 transcripts makes it difficult to determine whether they are homologs or different transcripts of the same gene model.

4.3. PR5 and LDOX: Two Putative Susceptibility Factors in B73?

From the thirty-eight candidates obtained after the DEG comparison between the lines (Table 3), two were especially notable in B73 due to their contrasting expression levels: the Zm00001d031158 and Zm00001d030548 transcripts. The former has the V3 identifier GRMZM2G402631 and is described as a PR5 gene, playing a key role in SAR as one of the PR proteins. PR5 is one of the thaumatin-like proteins (TLPs) [87]. They accumulate in response to biotic or abiotic stress, have antifungal properties in some plants, and function together with some resistance genes [92,93]. In tobacco, an increase in the expression of a thaumatin homologous to that in plants infected with the TMV was observed [94]. An extremely high level (log2 FC = 7) of expression was found for PR5 in B73 and was negatively regulated for CI-RL1 (Table 3). This leads us to formulate two hypotheses about PR5: (i) it interacts with the SCMV in the viral cycle and (ii) it is part of the tolerance response and becomes downregulated. We discarded the second hypothesis based on our qRT-PCR data (Figure S1), which showed that PR5 expression increased exclusively in B73. The second candidate gene, leucoanthocyanidin dioxygenase (LDOX), corresponds to GRMZM2G162158, an enzyme catalyzing the conversion of leucoanthocyanidins into anthocyanidins in the anthocyanin pathway [95]. The production of anthocyanins is induced under stress conditions or pathogen attack, presumably protecting the plant against oxidative stress [96]. The production of anthocyanins in B73 might be a response to virus infection, hence explaining the high expression level of the involved gene. As with PR5, the response of LDOX appears to be exclusive to B73 and negatively regulated in the CI-RL1 line. Both could be considered susceptibility factors in maize viral infections.

4.4. Genes Involved in Virus Replication Found in CTEP Analyses

We found two candidates associated with virus replication (in Group 2, Figure 2): PABP8 and IRE1B. Three (PABP2, PABP4, and PABP8) out of the eight isoforms reported in Arabidopsis showed increased protein and mRNA levels during TuMV infection, in addition to the interaction of PABP2 with the VPg and RdRp of TuMV. Furthermore, in pabp2pabp4 and pabp2pabp8 double mutants, a reduction in TuMV mRNA levels was observed [97]. Although homologs for the three AtPABPs were searched for, only PABP8 was detected in Group 2 of the C3 cluster (Table in Figure 2B). As PABP8 is possibly implicated in virus accumulation, its participation in tolerance was discarded.
IRE1B and IRE1A homologs in Arabidopsis function redundantly in the splicing of bZIP60 during the response to biotic and abiotic stresses, resulting in the activation of stress-related proteins. The infection of A. thaliana with TuMV promotes the splicing of bZIP60. The ire1aire1b double mutant inoculated with TuMV showed delayed symptoms and low virus accumulation [98]. Thus, both IRE1 genes appear to be susceptibility factors in Arabidopsis. In maize, IRE1A was found in Group 1, whereas IRE1B was found in Group 2. In maize, IRE1A and IRE1B might positively affect viral infection and would not contribute to CI-RL1 tolerance.
The candidate genes EXA1, LSM1, PpDDXL, RIM1, Chl-PGK, and RISP (Table S2), with high BELs in the CI-RL1 line (Group 1), play roles in viral replication [55] and were therefore not considered to be associated with the CI-RL1 response to the SCMV.

4.5. Cell-to-Cell Movement-Related Genes

Viruses move from cell to cell via plasmodesmata (PD), which regulate the size exclusion limit (SEL) with callose accumulation and the participation of viral movement proteins (MPs). Potyviruses, not having a specialized MP, rely on the CI, CP, HC-Pro, and VPg proteins for cell-to-cell movement. These proteins induce the formation and movement of VRCs in association with CI, towards and through the PD via the cytoskeleton [99]. Therefore, proteins that modify or interact with the PD can be considered important candidates in cell-to-cell movement. We found three candidates in Group 1 (BG3, PCap1, and myosin) and PDLP in Group 2 (Table in Figure 2B). BG3 encodes an enzyme that degrades callose deposited in the plasmodesmata [100]. Callose deposition and its degradation are controlled by two enzymes: callose synthase (CalS) and BG3. It has been proposed that callose deposition restricts the spread of pathogens [101,102,103]. We speculate that the oxidative stress imposed upon viral infection could lead to callose accumulation in the PD [104]. This accumulation requires the activation of BG3 for its degradation; experimental support should confirm such an association.
The expression level of the second candidate, PCap1, in Capsicum annum L. has been related to PVY accumulation and cell-to-cell movement [40]. Furthermore, protoplasts with a pcap1 loss-of-function mutation in A. thaliana accumulated high levels of TuMV, discounting its participation in virus replication [105]. Additionally, the interaction between PCap1 and the P3N-PIPO from TuMV appears to be involved in the localization of the CI complex at the PD [99,105]. As PCap1 favors a possible increase in cell-to-cell transport, its involvement in SCMV tolerance appears unlikely.
The third candidate was myosin, a motor protein involved in a variety of mobility processes. As such, the silencing of myosin XI-2 from Nicotiana benthamiana Domin has been shown to inhibit the movement of the TMV, but not that of PVX or the Tomato bushy stunt virus (TBSV) [106]. Apparently, as plants possess different genes that code for myosin, viruses interact selectively with them. This myosin maize homolog was found to have a high expression level in the CI-RL1 line, which could favor the SCMV accumulation and movement, thus not being involved in host tolerance.
The only candidate in Group 2 associated with cell-to-cell movement was a PDLP belonging to a family of type-I membrane proteins. These proteins travel along the secretory pathway to reach the plasma membrane inside the PD [107,108]. PDLPs interact with viral movement proteins (MPs), which are capable of assembling as tubules within the PD [107]. As potyviruses do not belong to the tubule-forming group of viruses, the role of PDLPs in SCMV infection remains uncertain.

4.6. Long-Distance Movement-Related Genes

Only two candidates related to long-distance movement were found (Group 1, Figure 2): the Piezo and PVIP homologs. The ZmPiezo gene was chosen from the maize genome as an ortholog to the ESC1 gene from Arabidopsis. ESC1 codes for an ion channel, PIEZO, that responds to mechanical stimuli [109]. The esc1 mutant showed alteration in the long-distance movement of TuMV in A. thaliana [110]. The ESC1 gene, also called AtPiezo, was transcriptionally induced by viral infection [110]. The ZmPiezo gene was found to have a high BEL in the CI-RL1 line. Not much is known about ZmPiezo in maize, making it difficult to associate its high BEL with SCMV tolerance.
Concerning PVIP1, the pvip1 loss-of-function mutant in A. thaliana inoculated with TuMV resulted in a lack of viral symptoms in planta [41]. This could be interpreted as indicating a need for PVIP1 to ensure viral infection. Here, not only did the CI-RL1 line have this gene, but it was found at high BELs (Table S3), meaning that its role in SCMV tolerance is uncertain.

4.7. The Presence of Diverse Transcripts for eIFs and eEFs Implies the Complex Regulation of Translation in SCMV Interaction with Maize Transcripts in Resistance

Of paramount importance in this work is the role that translation seems to play in CI-RL1 tolerance. This was not surprising, as several of these translation initiation factors have been well documented during the past decades, although not in maize viral infection. However, little is known regarding the role of elongation factors in viral infection. It appears that the expression level of eIF4E is important for the establishment and maintenance of viral infection. Plants that transiently overexpress a modified eIF4E showed increase resistance to PVY and a decrease in the expression level of the host gene [111].
The ortholog of eIF4E from Arabidopsis (AT4G18040) corresponds to the maize eif-6 transcript (Zm00001d041682), one of the six genes annotated as eukaryotic initiation factors in the maizeGDB database (Table S1). Transcript eif-6, within cluster C4 (Table 3 and Figure 2A), had low BELs in the CI-RL1 line and the F1 progeny. On the other hand, eif-7 and ZmeIF4E had low BELs only in the CI-RL1 line. The best match in the Arabidopsis genome for the eif-7 genes corresponds to the isoform of the eIF4E factor. The use of eIF4E or its isoform depends completely on the interaction of the host and the infecting virus. Both eif-7 and ZmeIF4E are newly described alleles in maize associated with tolerance, for instance, restricting viral movement in the CI-RL1 line, as has been described for the Tobacco etch virus (TEV) in A. thaliana [112]. Both B73 and CI-RL1 exhibited different BELs of ZmeIF4E (Table 4), suggesting either differences in their coding or promoter regions.
The eukaryotic elongation factors (eEFs) are encoded by genes playing a central role in the elongation step of translation [113]. One of them, namely, eukaryotic elongation factor 1α (eEF1α), is a cytoplasmatic protein that delivers aminoacylated tRNAs to ribosomes during polypeptide elongation when bound to GTP [114,115] and plays a role in nuclear export, proteolysis, and apoptosis [116]. In human viral infections, eEF1α interacts with the Gag1 polyprotein of human immunodeficiency virus type 1 (HIV-1) [117], with the 3′ stem-loop region of the West Nile virus (WNV) [118], and with the nucleocapsid protein of the paramyxovirus respiratory syncytial virus [119]. In plants, eEF1α binds tRNA-like structures (TLSs) in the 3′ region of the Turnip yellow mosaic virus (TYMV), the TMV, and the Brome mosaic virus (BMV) [120,121]. The aminoacylation of the TLSs enhances virus protein translation and facilitates virus RNA encapsidation [122,123,124]. The interaction between the ER-localized P3 from the Soybean mosaic virus (SMV) and eEF1α is essential for virulence in the susceptible host [115]. Furthermore, eEF1A from N. benthamiana is a pro-viral factor required for the Tomato spotted wilt virus disease (TSWV) [125]. Maize possesses at least eleven eEFs, and nine are annotated in the MaizeGDB database as “elongation factor α (elfα)” (Supplementary Table S1). A variety of functional transcripts are associated with each of them; for example, elfa1 has 15 transcripts associated with this gene model. Although the expression levels of the elfa homologs were below the selection criteria, they could help us to understand the CI-RL1 response to the SCMV. We speculate that the high expression levels of elfa10, eIfa12, and elfa3 in the B73 and F1 progeny plants (Table 2, gray cells) suggest that these factors interact with the SCMV in a yet-unforeseen manner. In contrast, CI-RL1 showed downregulation in elfa12 and Zm-elfa (Table 2, gray cells). It is possible that eIfa3, elfa10, and eIfa12 interact more efficiently with the SCMV. Maintaining the low expression of elfa12 and Zm-elfa in CI-RL1 aids in the tolerance response. Additionally, according to the data obtained in the CTEP analysis, different transcripts of the same gene model with high or low BELs could be found in the clusters (Table 4), suggesting the intricate regulation of these factors in maize during SCMV infection. It will be necessary to dissect the interaction of elfa10, elfa3, elfa12, and Zm-elfa with the SCMV to disentangle the myriad of translation factors involved in this host–virus interaction.
In addition to the large number of possibly important genes for resistance, SNPs also need to be considered for some of the candidate genes discussed here, adding even more complexity than anticipated in maize–SCMV interactions. Finding key SNPs will contribute to the development of breeding programs against devastating viral diseases in monocots. Furthermore, increasing maize genome annotations will enrich our understanding of tolerance/resistance in maize.

5. Conclusions

We performed an RNAseq analysis of a CI-RL1 line initially classified as resistant, a susceptible line B73, and the F1 progeny of both lines. The CI-RL1 line was originally designated as resistant due to the absence of SCMV symptoms and the lack of detection of the CP cistron and protein in distal leaves. However, the RNAseq analyses presented in this work led us to consider CI-RL1 as a tolerant line. A GO enrichment analysis of the CCs and BPs led to the identification of two ABC transporters and Hsp90-2 as possible candidates in virus tolerance. We also found two genes implicated in virus long-distance movement—ZmPiezo and ZmPVIP—in maize. Additionally, CAS was identified using a different selection criterion (mostly expressed in CI-RL1 and DEGs between lines). This candidate appears to have a role in tolerance to the SCMV. PR5 and LDOX seem to be susceptibility factors for the SCMV.
Using CTEP analysis, we observed complex behavior by the eIF4E homologs in maize, particularly the eEF1α factors. Furthermore, two new maize gene models—ZmeIF4E and Zm-elfa—were identified as possibly being involved in the SCMV interaction. The validity of CTEPs as a tool for uncovering susceptibility factors needs to be proved by sequencing and detecting SNPs for selected candidate genes.
More work is needed to understand how the genes identified in this work—ZmeIF4E, Zm-elfa, ZmPiezo, PR5, CAS, LDOX, ZmPVIP, Hsp90-2, and ABC transporters—are involved in maize potyvirus tolerance/resistance.

Supplementary Materials

The following are available online at https://www.mdpi.com/article/10.3390/v14081803/s1, Figure S1: Relative expression levels of 10 genes obtained from BPs and 6 from the comparison of different criteria. Figure S2: Principal components analysis of the libraries generated in this work. Libraries were analyzed by condition or by line. Table S1: eIFs and eEFs annotated in the MaizeGDB database. Table S2: List of the total of resistance candidate genes searched for in the expression pattern clusters. Table S3: Candidate genes found in Group 1 and Group 2 of the expression pattern clusters. Table S4. List of primers used in this work. Table S5. Candidate Genes Full Table.

Author Contributions

Conceptualization, G.R.-G., P.V.-M., and L.S.-R.; methodology, G.R.-G.; software, P.V.-M.; validation, G.R.-G.; formal analysis, P.V.-M.; resources, L.S.-R.; data curation, P.V.-M.; writing—original draft preparation, G.R.-G., P.V.-M., and L.S.-R.; writing—review and editing, G.R.-G., P.V.-M., and L.S.-R.; visualization, G.R.-G. and P.V.-M.; supervision, L.S.-R.; project administration, L.S.-R.; funding acquisition, L.S.-R. All authors have read and agreed to the published version of the manuscript.

Funding

G.R. and P.V. were supported by the Consejo Nacional de Ciencia y Tecnología postgraduate scholarships (CVUs 420714 and 1024179). This research was funded through PlanTecc (IP-240 and IP-231) and Cinvestav funds, in addition to personal funding by L.S.-R.

Institutional Review Board Statement

Ethical review and approval are waived as they do not apply in this study.

Informed Consent Statement

Not applicable.

Data Availability Statement

The raw data are publicly available from the National Center for Biotechnology Information (NCBI), under BioProject accession number PRJNA846583. The data presented in this study are openly available in zenodo.org at https://doi.org/10.5281/zenodo.6864346 (accessed 19 July 2022). A preprint of this work was published on the “Preprint.org” website at https://doi.org/10.20944/preprints202201.0464.v1 (accessed on 7 July 2022).

Acknowledgments

The authors wish to thank J. Natzul Santoyo Villa for technical help, as well as CYMMIT for the B73 seeds under request numbers S2018_400684999 and S2020_623050816.

Conflicts of Interest

The authors declare no conflict of interest.

References

  1. Silva-Rosales, L.; Alcalá-Briseño, R.I.; Espejel, F. Sugarcane Mosaic. In Virus Diseases of Tropical and Subtropical Crops; Tennant, P., Fermin, G., Eds.; CABI: Wallingford, UK, 2015; pp. 131–143. ISBN 978-1-78064-426-4. [Google Scholar]
  2. Xie, L.; Zhang, J.; Wang, Q.; Meng, C.; Hong, J.; Zhou, X. Characterization of Maize Chlorotic Mottle Virus Associated with Maize Lethal Necrosis Disease in China. J. Phytopathol. 2011, 159, 191–193. [Google Scholar] [CrossRef]
  3. Fatma, H.K.; Tileye, F.; Patrick, A.N. Insights of Maize Lethal Necrotic Disease: A Major Constraint to Maize Production in East Africa. Afr. J. Microbiol. Res. 2016, 10, 271–279. [Google Scholar] [CrossRef]
  4. Melchinger, A.E.; Kuntze, L.; Gumber, R.K.; Lübberstedt, T.; Fuchs, E. Genetic Basis of Resistance to Sugarcane Mosaic Virus in European Maize Germplasm. Theor. Appl. Genet. 1998, 96, 1151–1161. [Google Scholar] [CrossRef]
  5. Lubberstedt, T.; Ingvardsen, C.; Melchinger, A.E.; Xing, Y.; Salomon, R.; Redinbaugh, M.G. Two Chromosome Segments Confer Multiple Potyvirus Resistance in Maize. Plant Breed. 2006, 125, 352–356. [Google Scholar] [CrossRef]
  6. Wu, J.; Ding, J.; Du, Y.; Xu, Y.; Zhang, X. Genetic Analysis and Molecular Mapping of Two Dominant Complementary Genes Determining Resistance to Sugarcane Mosaic Virus in Maize. Euphytica 2007, 156, 355–364. [Google Scholar] [CrossRef]
  7. Pokorný, R.; Porubová, M. Movement of Sugarcane Mosaic Virus in Plants of Resistant and Susceptible Maize Lines. Cereal Res. Commun. 2006, 34, 1109–1116. [Google Scholar] [CrossRef]
  8. Liu, Q.; Liu, H.; Gong, Y.; Tao, Y.; Jiang, L.; Zuo, W.; Yang, Q.; Ye, J.; Lai, J.; Wu, J.; et al. An Atypical Thioredoxin Imparts Early Resistance to Sugarcane Mosaic Virus in Maize. Mol. Plant 2017, 10, 483–497. [Google Scholar] [CrossRef] [PubMed]
  9. Dos Santos, C.V.; Rey, P. Plant Thioredoxins Are Key Actors in the Oxidative Stress Response. Trends Plant Sci. 2006, 11, 329–334. [Google Scholar] [CrossRef] [PubMed]
  10. Hisabori, T.; Motohashi, K.; Hosoya-Matsuda, N.; Ueoka-Nakanishi, H.; Romano, P.G.N. Towards a Functional Dissection of Thioredoxin Networks in Plant Cells. Photochem. Photobiol. 2006, 83, 145–151. [Google Scholar] [CrossRef]
  11. Chaves-Bedoya, G.; Espejel, F.; Alcalá-Briseño, R.I.; Hernández-Vela, J.; Silva-Rosales, L. Short Distance Movement of Genomic Negative Strands in a Host and Nonhost for Sugarcane Mosaic Virus (SCMV). Virol. J. 2011, 8, 15. [Google Scholar] [CrossRef] [PubMed]
  12. Dangl, J.L.; Jones, J.D.G. Plant Pathogens and Integrated Defence Responses to Infection. Nature 2001, 411, 826–833. [Google Scholar] [CrossRef]
  13. Ausubel, F.M. Are Innate Immune Signaling Pathways in Plants and Animals Conserved? Nat. Immunol. 2005, 6, 973–979. [Google Scholar] [CrossRef]
  14. Chisholm, S.T.; Coaker, G.; Day, B.; Staskawicz, B.J. Host-Microbe Interactions: Shaping the Evolution of the Plant Immune Response. Cell 2006, 124, 803–814. [Google Scholar] [CrossRef]
  15. Jones, J.D.G.; Dangl, J.L. The Plant Immune System. Nature 2006, 444, 323–329. [Google Scholar] [CrossRef]
  16. Nurnberger, T.; Brunner, F.; Kemmerling, B.; Piater, L. Innate Immunity in Plants and Animals: Striking Similarities and Obvious Differences. Immunol. Rev. 2004, 198, 249–266. [Google Scholar] [CrossRef]
  17. Bigeard, J.; Colcombet, J.; Hirt, H. Signaling Mechanisms in Pattern-Triggered Immunity (PTI). Mol. Plant 2015, 8, 521–539. [Google Scholar] [CrossRef]
  18. DeYoung, B.J.; Innes, R.W. Plant NBS-LRR Proteins in Pathogen Sensing and Host Defense. Nat. Immunol. 2006, 7, 1243–1249. [Google Scholar] [CrossRef]
  19. Boller, T.; Felix, G. A Renaissance of Elicitors: Perception of Microbe-Associated Molecular Patterns and Danger Signals by Pattern-Recognition Receptors. Annu. Rev. Plant Biol. 2009, 60, 379–406. [Google Scholar] [CrossRef]
  20. Liu, L.; Sonbol, F.-M.; Huot, B.; Gu, Y.; Withers, J.; Mwimba, M.; Yao, J.; He, S.Y.; Dong, X. Salicylic Acid Receptors Activate Jasmonic Acid Signalling through a Non-Canonical Pathway to Promote Effector-Triggered Immunity. Nat. Commun. 2016, 7, 13099. [Google Scholar] [CrossRef]
  21. Velásquez, A.C.; Castroverde, C.D.M.; He, S.Y. Plant–Pathogen Warfare under Changing Climate Conditions. Curr. Biol. 2018, 28, R619–R634. [Google Scholar] [CrossRef]
  22. Saleem, M.; Fariduddin, Q.; Castroverde, C.D.M. Salicylic Acid: A Key Regulator of Redox Signalling and Plant Immunity. Plant Physiol. Biochem. 2021, 168, 381–397. [Google Scholar] [CrossRef]
  23. Thomma, B.P.H.J.; Nürnberger, T.; Joosten, M.H.A.J. Of PAMPs and Effectors: The Blurred PTI-ETI Dichotomy. Plant Cell 2011, 23, 4–15. [Google Scholar] [CrossRef]
  24. Nejat, N.; Mantri, N. Plant Immune System: Crosstalk Between Responses to Biotic and Abiotic Stresses the Missing Link in Understanding Plant Defence. Curr. Issues Mol. Biol. 2017, 23, 1–16. [Google Scholar] [CrossRef]
  25. Zvereva, A.; Pooggin, M. Silencing and Innate Immunity in Plant Defense Against Viral and Non-Viral Pathogens. Viruses 2012, 4, 2578–2597. [Google Scholar] [CrossRef]
  26. Teixeira, R.M.; Ferreira, M.A.; Raimundo, G.A.S.; Loriato, V.A.P.; Reis, P.A.B.; Fontes, E.P.B. Virus Perception at the Cell Surface: Revisiting the Roles of Receptor-like Kinases as Viral Pattern Recognition Receptors. Mol. Plant Pathol. 2019, 20, 1196–1202. [Google Scholar] [CrossRef]
  27. Wang, M.-B.; Masuta, C.; Smith, N.A.; Shimura, H. RNA Silencing and Plant Viral Diseases. Mol. Plant-Microbe Interact. 2012, 25, 1275–1285. [Google Scholar] [CrossRef]
  28. Waterhouse, P.M.; Wang, M.-B.; Lough, T. Gene Silencing as an Adaptive Defence against Viruses. Nature 2001, 411, 834–842. [Google Scholar] [CrossRef] [PubMed]
  29. Gouveia, B.C.; Calil, I.P.; Machado, J.P.B.; Santos, A.A.; Fontes, E.P.B. Immune Receptors and Co-Receptors in Antiviral Innate Immunity in Plants. Front. Microbiol. 2017, 7, 2139. [Google Scholar] [CrossRef] [PubMed]
  30. Heinlein, M. Plant Virus Replication and Movement. Virology 2015, 479–480, 657–671. [Google Scholar] [CrossRef] [PubMed]
  31. Mäkinen, K. Plant Susceptibility Genes as a Source for Potyvirus Resistance. Ann. Appl. Biol. 2020, 176, 122–129. [Google Scholar] [CrossRef]
  32. Wang, A. Dissecting the Molecular Network of Virus-Plant Interactions: The Complex Roles of Host Factors. Annu. Rev. Phytopathol. 2015, 53, 45–66. [Google Scholar] [CrossRef]
  33. Bastet, A.; Robaglia, C.; Gallois, J.-L. EIF4E Resistance: Natural Variation Should Guide Gene Editing. Trends Plant Sci. 2017, 22, 411–419. [Google Scholar] [CrossRef]
  34. Nicaise, V.; Gallois, J.-L.; Chafiai, F.; Allen, L.M.; Schurdi-Levraud, V.; Browning, K.S.; Candresse, T.; Caranta, C.; Le Gall, O.; German-Retana, S. Coordinated and Selective Recruitment of EIF4E and EIF4G Factors for Potyvirus Infection in Arabidopsis thaliana. FEBS Lett. 2007, 581, 1041–1046. [Google Scholar] [CrossRef]
  35. Hafrén, A.; Hofius, D.; Rönnholm, G.; Sonnewald, U.; Mäkinen, K. HSP70 and Its Cochaperone CPIP Promote Potyvirus Infection in Nicotiana benthamiana by Regulating Viral Coat Protein Functions. Plant Cell 2010, 22, 523–535. [Google Scholar] [CrossRef]
  36. Lubkowska, A.; Pluta, W.; Strońska, A.; Lalko, A. Role of Heat Shock Proteins (HSP70 and HSP90) in Viral Infection. Int. J. Mol. Sci. 2021, 22, 9366. [Google Scholar] [CrossRef]
  37. Gorovits, R.; Czosnek, H. The Involvement of Heat Shock Proteins in the Establishment of Tomato Yellow Leaf Curl Virus Infection. Front. Plant Sci. 2017, 8, 355. [Google Scholar] [CrossRef]
  38. Sullivan, C.S.; Pipas, J.M. The Virus–Chaperone Connection. Virology 2001, 287, 1–8. [Google Scholar] [CrossRef]
  39. Park, C.-J.; Seo, Y.-S. Heat Shock Proteins: A Review of the Molecular Chaperones for Plant Immunity. Plant Pathol. J. 2015, 31, 323–333. [Google Scholar] [CrossRef]
  40. Beris, D.; Kotsaridis, K.; Vakirlis, N.; Termentzi, A.; Theologidis, I.; Moury, B.; Vassilakos, N. The Plasma Membrane Cation Binding Protein 1 Affects Accumulation of Potato Virus Y in Pepper Both at the Systemic Level and in Protoplasts. Virus Res. 2020, 280, 197899. [Google Scholar] [CrossRef]
  41. Dunoyer, P.; Thomas, C.; Harrison, S.; Revers, F.; Maule, A. A Cysteine-Rich Plant Protein Potentiates Potyvirus Movement through an Interaction with the Virus Genome-Linked Protein VPg. J. Virol. 2004, 78, 2301–2309. [Google Scholar] [CrossRef]
  42. Clarke, D. Tolerance of Parasites and Disease in Plants and Its Significance in Host-Parasite Interactions. Adv. Plant Pathol. 1986, 5, 161–197. [Google Scholar]
  43. Strauss, S.Y.; Agrawal, A.A. The Ecology and Evolution of Plant Tolerance to Herbivory. Trends Ecol. Evol. 1999, 14, 179–185. [Google Scholar] [CrossRef]
  44. Pagán, I.; García-Arenal, F. Tolerance to Plant Pathogens: Theory and Experimental Evidence. Int. J. Mol. Sci. 2018, 19, 810. [Google Scholar] [CrossRef]
  45. Little, T.J.; Shuker, D.M.; Colegrave, N.; Day, T.; Graham, A.L. The Coevolution of Virulence: Tolerance in Perspective. PLoS Pathog. 2010, 6, e1001006. [Google Scholar] [CrossRef]
  46. Råberg, L. How to Live with the Enemy: Understanding Tolerance to Parasites. PLoS Biol. 2014, 12, e1001989. [Google Scholar] [CrossRef] [PubMed]
  47. Del Fabbro, C.; Scalabrin, S.; Morgante, M.; Giorgi, F. An Extensive Evaluation of Read Trimming Effects on Illumina NGS Data Analysis. PLoS ONE 2013, 8, e85024. [Google Scholar] [CrossRef]
  48. Vargas-Mejía, P.; Vega-Arreguín, J.; Chávez-Calvillo, G.; Ibarra-Laclette, E.; Silva-Rosales, L. Differential Accumulation of Innate- and Adaptive-Immune-Response-Derived Transcripts during Antagonism between Papaya Ringspot Virus and Papaya Mosaic Virus. Viruses 2020, 12, 230. [Google Scholar] [CrossRef] [PubMed]
  49. Haas, B.J.; Papanicolaou, A.; Yassour, M.; Grabherr, M.; Blood, P.D.; Bowden, J.; Couger, M.B.; Eccles, D.; Li, B.; Lieber, M.; et al. De Novo Transcript Sequence Reconstruction from RNA-Seq Using the Trinity Platform for Reference Generation and Analysis. Nat. Protoc. 2013, 8, 1494–1512. [Google Scholar] [CrossRef] [PubMed]
  50. Yi, L.; Pimentel, H.; Bray, N.L.; Pachter, L. Gene-Level Differential Analysis at Transcript-Level Resolution. Genome Biol. 2018, 19, 53. [Google Scholar] [CrossRef] [PubMed]
  51. Abu-Jamous, B.; Kelly, S. Clust: Automatic Extraction of Optimal Co-Expressed Gene Clusters from Gene Expression Data. Genome Biol. 2018, 19, 172. [Google Scholar] [CrossRef] [PubMed]
  52. Bryant, D.M.; Johnson, K.; DiTommaso, T.; Tickle, T.; Couger, M.B.; Payzin-Dogru, D.; Lee, T.J.; Leigh, N.D.; Kuo, T.-H.; Davis, F.G.; et al. A Tissue-Mapped Axolotl De Novo Transcriptome Enables Identification of Limb Regeneration Factors. Cell Rep. 2017, 18, 762–776. [Google Scholar] [CrossRef] [PubMed]
  53. Supek, F.; Bošnjak, M.; Škunca, N.; Šmuc, T. REVIGO Summarizes and Visualizes Long Lists of Gene Ontology Terms. PLoS ONE 2011, 6, e21800. [Google Scholar] [CrossRef]
  54. Kang, B.-C.; Yeam, I.; Jahn, M.M. Genetics of Plant Virus Resistance. Annu. Rev. Phytopathol. 2005, 43, 581–621. [Google Scholar] [CrossRef]
  55. Garcia-Ruiz, H. Susceptibility Genes to Plant Viruses. Viruses 2018, 10, 484. [Google Scholar] [CrossRef]
  56. Lellis, A.D.; Kasschau, K.D.; Whitham, S.A.; Carrington, J.C. Loss-of-Susceptibility Mutants of Arabidopsis thaliana Reveal an Essential Role for EIF(Iso)4E during Potyvirus Infection. Curr. Biol. 2002, 12, 1046–1051. [Google Scholar] [CrossRef]
  57. Lei, J.D. Mechanisms of Resistance in Corn to Maize Dwarf Mosaic Virus. Phytopathology 1986, 76, 1034. [Google Scholar] [CrossRef]
  58. Nagy, P.D.; Pogany, J. The Dependence of Viral RNA Replication on Co-Opted Host Factors. Nat. Rev. Microbiol. 2012, 10, 137–149. [Google Scholar] [CrossRef]
  59. Mäkinen, K.; Hafrén, A. Intracellular Coordination of Potyviral RNA Functions in Infection. Front. Plant Sci. 2014, 5, 110. [Google Scholar] [CrossRef]
  60. Wei, T.; Huang, T.-S.; McNeil, J.; Laliberté, J.-F.; Hong, J.; Nelson, R.S.; Wang, A. Sequential Recruitment of the Endoplasmic Reticulum and Chloroplasts for Plant Potyvirus Replication. J. Virol. 2010, 84, 799–809. [Google Scholar] [CrossRef]
  61. Schaad, M.C.; Jensen, P.E.; Carrington, J.C. Formation of Plant RNA Virus Replication Complexes on Membranes: Role of an Endoplasmic Reticulum-Targeted Viral Protein. EMBO J. 1997, 16, 4049–4059. [Google Scholar] [CrossRef]
  62. Kräutler, B. Breakdown of Chlorophyll in Higher Plants—Phyllobilins as Abundant, Yet Hardly Visible Signs of Ripening, Senescence, and Cell Death. Angew. Chem. Int. Ed. 2016, 55, 4882–4907. [Google Scholar] [CrossRef] [PubMed]
  63. Hörtensteiner, S. Chlorophyll Degradation During Senescence. Annu. Rev. Plant Biol. 2006, 57, 55–77. [Google Scholar] [CrossRef] [PubMed]
  64. Tamary, E.; Nevo, R.; Naveh, L.; Levin-Zaidman, S.; Kiss, V.; Savidor, A.; Levin, Y.; Eyal, Y.; Reich, Z.; Adam, Z. Chlorophyll Catabolism Precedes Changes in Chloroplast Structure and Proteome during Leaf Senescence. Plant Direct 2019, 3, e00127. [Google Scholar] [CrossRef]
  65. Bianchi, M.E. DAMPs, PAMPs and Alarmins: All We Need to Know about Danger. J. Leukoc. Biol. 2007, 81, 1–5. [Google Scholar] [CrossRef]
  66. Choi, H.W.; Klessig, D.F. DAMPs, MAMPs, and NAMPs in Plant Innate Immunity. BMC Plant Biol. 2016, 16, 232. [Google Scholar] [CrossRef]
  67. Tang, D.; Kang, R.; Coyne, C.B.; Zeh, H.J.; Lotze, M.T. PAMPs and DAMPs: Signal 0s That Spur Autophagy and Immunity. Immunol. Rev. 2012, 249, 158–175. [Google Scholar] [CrossRef]
  68. Kadota, Y.; Sklenar, J.; Derbyshire, P.; Stransfeld, L.; Asai, S.; Ntoukakis, V.; Jones, J.D.; Shirasu, K.; Menke, F.; Jones, A.; et al. Direct Regulation of the NADPH Oxidase RBOHD by the PRR-Associated Kinase BIK1 during Plant Immunity. Mol. Cell 2014, 54, 43–55. [Google Scholar] [CrossRef]
  69. Apel, K.; Hirt, H. REACTIVE OXYGEN SPECIES: Metabolism, Oxidative Stress, and Signal Transduction. Annu. Rev. Plant Biol. 2004, 55, 373–399. [Google Scholar] [CrossRef]
  70. Demidchik, V. Mechanisms of Oxidative Stress in Plants: From Classical Chemistry to Cell Biology. Environ. Exp. Bot. 2015, 109, 212–228. [Google Scholar] [CrossRef]
  71. Clarke, S.F.; Guy, P.L.; Burritt, D.J.; Jameson, P.E. Changes in the Activities of Antioxidant Enzymes in Response to Virus Infection and Hormone Treatment. Physiol. Plant. 2002, 114, 157–164. [Google Scholar] [CrossRef]
  72. Ellis, J. Proteins as Molecular Chaperones. Nature 1987, 328, 378–379. [Google Scholar] [CrossRef]
  73. Tyedmers, J.; Mogk, A.; Bukau, B. Cellular Strategies for Controlling Protein Aggregation. Nat. Rev. Mol. Cell Biol. 2010, 11, 777–788. [Google Scholar] [CrossRef]
  74. Bukau, B.; Weissman, J.; Horwich, A. Molecular Chaperones and Protein Quality Control. Cell 2006, 125, 443–451. [Google Scholar] [CrossRef]
  75. Verchot, J. Cellular Chaperones and Folding Enzymes Are Vital Contributors to Membrane Bound Replication and Movement Complexes during Plant RNA Virus Infection. Front. Plant Sci. 2012, 3, 275. [Google Scholar] [CrossRef]
  76. Lu, R.; Malcuit, I.; Moffett, P.; Ruiz, M.T.; Peart, J.; Wu, A.-J.; Rathjen, J.P.; Bendahmane, A.; Day, L.; Baulcombe, D.C. High Throughput Virus-Induced Gene Silencing Implicates Heat Shock Protein 90 in Plant Disease Resistance. EMBO J. 2003, 22, 5690–5699. [Google Scholar] [CrossRef]
  77. Higgins, C.F. ABC Transporters: From Microorganisms to Man. Annu. Rev. Cell Biol. 1992, 8, 67–113. [Google Scholar] [CrossRef]
  78. Moons, A. Ospdr9, Which Encodes a PDR-Type ABC Transporter, Is Induced by Heavy Metals, Hypoxic Stress and Redox Perturbations in Rice Roots. FEBS Lett. 2003, 553, 370–376. [Google Scholar] [CrossRef]
  79. Stukkens, Y.; Bultreys, A.; Grec, S.; Trombik, T.; Vanham, D.; Boutry, M. NpPDR1, a Pleiotropic Drug Resistance-Type ATP-Binding Cassette Transporter from Nicotiana plumbaginifolia, Plays a Major Role in Plant Pathogen Defense. Plant Physiol. 2005, 139, 341–352. [Google Scholar] [CrossRef]
  80. Sun, D.; Zhang, X.; Li, S.; Jiang, C.-Z.; Zhang, Y.; Niu, L. LrABCF1, a GCN-Type ATP-Binding Cassette Transporter from Lilium Regale, Is Involved in Defense Responses against Viral and Fungal Pathogens. Planta 2016, 244, 1185–1199. [Google Scholar] [CrossRef]
  81. Rees, D.C.; Johnson, E.; Lewinson, O. ABC Transporters: The Power to Change. Nat. Rev. Mol. Cell Biol. 2009, 10, 218–227. [Google Scholar] [CrossRef]
  82. Dean, M.; Hamon, Y.; Chimini, G. The Human ATP-Binding Cassette (ABC) Transporter Superfamily. J. Lipid Res. 2001, 42, 1007–1017. [Google Scholar] [CrossRef]
  83. Klein, I.; Sarkadi, B.; Váradi, A. An Inventory of the Human ABC Proteins. Biochim. Biophys. Acta-Biomembr. 1999, 1461, 237–262. [Google Scholar] [CrossRef]
  84. Tusnády, G.E.; Sarkadi, B.; Simon, I.; Váradi, A. Membrane Topology of Human ABC Proteins. FEBS Lett. 2006, 580, 1017–1022. [Google Scholar] [CrossRef] [PubMed]
  85. Thomas, C.; Aller, S.G.; Beis, K.; Carpenter, E.P.; Chang, G.; Chen, L.; Dassa, E.; Dean, M.; Van Hoa, F.D.; Ekiert, D.; et al. Structural and Functional Diversity Calls for a New Classification of ABC Transporters. FEBS Lett. 2020, 594, 3767–3775. [Google Scholar] [CrossRef]
  86. Ellis, J.G.; Lagudah, E.S.; Spielmeyer, W.; Dodds, P.N. The Past, Present and Future of Breeding Rust Resistant Wheat. Front. Plant Sci. 2014, 5, 641. [Google Scholar] [CrossRef]
  87. Krattinger, S.G.; Kang, J.; Bräunlich, S.; Boni, R.; Chauhan, H.; Selter, L.L.; Robinson, M.D.; Schmid, M.W.; Wiederhold, E.; Hensel, G.; et al. Abscisic Acid Is a Substrate of the ABC Transporter Encoded by the Durable Wheat Disease Resistance Gene Lr34. New Phytol. 2019, 223, 853–866. [Google Scholar] [CrossRef]
  88. Sucher, J.; Boni, R.; Yang, P.; Rogowsky, P.; Büchner, H.; Kastner, C.; Kumlehn, J.; Krattinger, S.G.; Keller, B. The Durable Wheat Disease Resistance Gene Lr34 Confers Common Rust and Northern Corn Leaf Blight Resistance in Maize. Plant Biotechnol. J. 2017, 15, 489–496. [Google Scholar] [CrossRef]
  89. Gas-Pascual, E.; Simonovik, B.; Schaller, H.; Bach, T.J. Inhibition of Cycloartenol Synthase (CAS) Function in Tobacco BY-2 Cells. Lipids 2015, 50, 761–772. [Google Scholar] [CrossRef]
  90. Hartmann, M. Plant Sterols and the Membrane Environment. Trends Plant Sci. 1998, 3, 170–175. [Google Scholar] [CrossRef]
  91. Tao, Y.; Jiang, L.; Liu, Q.; Zhang, Y.; Zhang, R.; Ingvardsen, C.R.; Frei, U.K.; Wang, B.; Lai, J.; Lübberstedt, T.; et al. Combined Linkage and Association Mapping Reveals Candidates for Scmv1, a Major Locus Involved in Resistance to Sugarcane Mosaic Virus (SCMV) in Maize. BMC Plant Biol. 2013, 13, 162. [Google Scholar] [CrossRef]
  92. Cao, J.; Lv, Y.; Hou, Z.; Li, X.; Ding, L. Expansion and Evolution of Thaumatin-like Protein (TLP) Gene Family in Six Plants. Plant Growth Regul. 2016, 79, 299–307. [Google Scholar] [CrossRef]
  93. Zhang, J.; Wang, F.; Liang, F.; Zhang, Y.; Ma, L.; Wang, H.; Liu, D. Functional Analysis of a Pathogenesis-Related Thaumatin-like Protein Gene TaLr35PR5 from Wheat Induced by Leaf Rust Fungus. BMC Plant Biol. 2018, 18, 76. [Google Scholar] [CrossRef]
  94. Cornelissen, B.J.C.; Van Huijsduijnen, R.A.M.H.; Bol, J.F. A Tobacco Mosaic Virus-Induced Tobacco Protein Is Homologous to the Sweet-Tasting Protein Thaumatin. Nature 1986, 321, 531–532. [Google Scholar] [CrossRef]
  95. Gollop, R.; Farhi, S.; Perl, A. Regulation of the Leucoanthocyanidin Dioxygenase Gene Expression in Vitis Vinifera. Plant Sci. 2001, 161, 579–588. [Google Scholar] [CrossRef]
  96. Zhang, Y.; Butelli, E.; Martin, C. Engineering Anthocyanin Biosynthesis in Plants. Curr. Opin. Plant Biol. 2014, 19, 81–90. [Google Scholar] [CrossRef]
  97. Dufresne, P.J.; Ubalijoro, E.; Fortin, M.G.; Laliberté, J.-F. Arabidopsis thaliana Class II Poly(A)-Binding Proteins Are Required for Efficient Multiplication of Turnip Mosaic Virus. J. Gen. Virol. 2008, 89, 2339–2348. [Google Scholar] [CrossRef]
  98. Zhang, L.; Chen, H.; Brandizzi, F.; Verchot, J.; Wang, A. The UPR Branch IRE1-BZIP60 in Plants Plays an Essential Role in Viral Infection and Is Complementary to the Only UPR Pathway in Yeast. PLoS Genet. 2015, 11, e1005164. [Google Scholar] [CrossRef]
  99. Reagan, B.C.; Burch-Smith, T.M. Viruses Reveal the Secrets of Plasmodesmal Cell Biology. Mol. Plant-Microbe Interact. 2020, 33, 26–39. [Google Scholar] [CrossRef]
  100. Anjanappa, R.B.; Mehta, D.; Okoniewski, M.J.; Szabelska-Berȩsewicz, A.; Gruissem, W.; Vanderschuren, H. Molecular Insights into Cassava Brown Streak Virus Susceptibility and Resistance by Profiling of the Early Host Response. Mol. Plant Pathol. 2018, 19, 476–489. [Google Scholar] [CrossRef]
  101. Kauss, H. Callose Biosynthesis as a Ca2+-Regulated Process and Possible Relations to the Induction of Other Metabolic Changes. J. Cell Sci. 1985, 1985, 89–103. [Google Scholar] [CrossRef]
  102. Zavaliev, R.; Ueki, S.; Epel, B.L.; Citovsky, V. Biology of Callose (β-1,3-Glucan) Turnover at Plasmodesmata. Protoplasma 2011, 248, 117–130. [Google Scholar] [CrossRef]
  103. Levy, A.; Guenoune-Gelbart, D.; Epel, B.L. β-1,3-Glucanases: Plasmodesmal Gate Keepers for Intercellular Communication. Plant Signal. Behav. 2007, 2, 404–407. [Google Scholar] [CrossRef]
  104. Pastor, V.; Luna, E.; Ton, J.; Cerezo, M.; García-Agustín, P.; Flors, V. Fine Tuning of Reactive Oxygen Species Homeostasis Regulates Primed Immune Responses in Arabidopsis. Mol. Plant-Microbe Interact. 2013, 26, 1334–1344. [Google Scholar] [CrossRef]
  105. Vijayapalani, P.; Maeshima, M.; Nagasaki-Takekuchi, N.; Miller, W.A. Interaction of the Trans-Frame Potyvirus Protein P3N-PIPO with Host Protein PCaP1 Facilitates Potyvirus Movement. PLoS Pathog. 2012, 8, e1002639. [Google Scholar] [CrossRef]
  106. Harries, P.A.; Park, J.-W.; Sasaki, N.; Ballard, K.D.; Maule, A.J.; Nelson, R.S. Differing Requirements for Actin and Myosin by Plant Viruses for Sustained Intercellular Movement. Proc. Natl. Acad. Sci. USA 2009, 106, 17594–17599. [Google Scholar] [CrossRef]
  107. Amari, K.; Boutant, E.; Hofmann, C.; Schmitt-Keichinger, C.; Fernandez-Calvino, L.; Didier, P.; Lerich, A.; Mutterer, J.; Thomas, C.L.; Heinlein, M.; et al. A Family of Plasmodesmal Proteins with Receptor-Like Properties for Plant Viral Movement Proteins. PLoS Pathog. 2010, 6, e1001119. [Google Scholar] [CrossRef]
  108. Thomas, C.L.; Bayer, E.M.; Ritzenthaler, C.; Fernandez-Calvino, L.; Maule, A.J. Specific Targeting of a Plasmodesmal Protein Affecting Cell-to-Cell Communication. PLoS Biol. 2008, 6, e7. [Google Scholar] [CrossRef]
  109. Ridone, P.; Vassalli, M.; Martinac, B. Piezo1 Mechanosensitive Channels: What Are They and Why Are They Important. Biophys. Rev. 2019, 11, 795–805. [Google Scholar] [CrossRef]
  110. Zhang, Z.; Tong, X.; Liu, S.-Y.; Chai, L.-X.; Zhu, F.-F.; Zhang, X.-P.; Zou, J.-Z.; Wang, X.-B. Genetic Analysis of a Piezo-like Protein Suppressing Systemic Movement of Plant Viruses in Arabidopsis thaliana. Sci. Rep. 2019, 9, 3187. [Google Scholar] [CrossRef] [PubMed]
  111. Gutierrez Sanchez, P.A.; Babujee, L.; Jaramillo Mesa, H.; Arcibal, E.; Gannon, M.; Halterman, D.; Jahn, M.; Jiang, J.; Rakotondrafara, A.M. Overexpression of a Modified EIF4E Regulates Potato Virus Y Resistance at the Transcriptional Level in Potato. BMC Genom. 2020, 21, 18. [Google Scholar] [CrossRef]
  112. Contreras-Paredes, C.A.; Silva-Rosales, L.; Daròs, J.-A.; Alejandri-Ramírez, N.D.; Dinkova, T.D. The Absence of Eukaryotic Initiation Factor EIF(Iso)4E Affects the Systemic Spread of a Tobacco Etch Virus Isolate in Arabidopsis thaliana. Mol. Plant-Microbe Interact. 2013, 26, 461–470. [Google Scholar] [CrossRef] [PubMed]
  113. Cristiano, L. The Pseudogenes of Eukaryotic Translation Elongation Factors (EEFs): Role in Cancer and Other Human Diseases. Genes Dis. 2021, 9, 941–958. [Google Scholar] [CrossRef] [PubMed]
  114. Mateyak, M.K.; Kinzy, T.G. EEF1A: Thinking Outside the Ribosome. J. Biol. Chem. 2010, 285, 21209–21213. [Google Scholar] [CrossRef] [PubMed]
  115. Luan, H.; Shine, M.B.; Cui, X.; Chen, X.; Ma, N.; Kachroo, P.; Zhi, H.; Kachroo, A. The Potyviral P3 Protein Targets Eukaryotic Elongation Factor 1A to Promote the Unfolded Protein Response and Viral Pathogenesis. Plant Physiol. 2016, 172, 221–234. [Google Scholar] [CrossRef]
  116. Sasikumar, A.N.; Perez, W.B.; Kinzy, T.G. The Many Roles of the Eukaryotic Elongation Factor 1 Complex. Wiley Interdiscip. Rev. RNA 2012, 3, 543–555. [Google Scholar] [CrossRef]
  117. Cimarelli, A.; Luban, J. Translation Elongation Factor 1-Alpha Interacts Specifically with the Human Immunodeficiency Virus Type 1 Gag Polyprotein. J. Virol. 1999, 73, 5388–5401. [Google Scholar] [CrossRef]
  118. Blackwell, J.L.; Brinton, M.A. Translation Elongation Factor-1 Alpha Interacts with the 3′ Stem-Loop Region of West Nile Virus Genomic RNA. J. Virol. 1997, 71, 6433–6444. [Google Scholar] [CrossRef]
  119. Wei, T.; Li, D.; Marcial, D.; Khan, M.; Lin, M.-H.; Snape, N.; Ghildyal, R.; Harrich, D.; Spann, K. The Eukaryotic Elongation Factor 1A Is Critical for Genome Replication of the Paramyxovirus Respiratory Syncytial Virus. PLoS ONE 2014, 9, e114447. [Google Scholar] [CrossRef]
  120. Dreher, T.W. Role of TRNA-like Structures in Controlling Plant Virus Replication. Virus Res. 2009, 139, 217–229. [Google Scholar] [CrossRef]
  121. Li, D.; Wei, T.; Abbott, C.M.; Harrich, D. The Unexpected Roles of Eukaryotic Translation Elongation Factors in RNA Virus Replication and Pathogenesis. Microbiol. Mol. Biol. Rev. 2013, 77, 253–266. [Google Scholar] [CrossRef]
  122. Matsuda, D.; Dreher, T.W. The TRNA-like Structure of Turnip Yellow Mosaic Virus RNA Is a 3′-Translational Enhancer. Virology 2004, 321, 36–46. [Google Scholar] [CrossRef]
  123. Choi, Y.G.; Dreher, T.W.; Rao, A.L.N. TRNA Elements Mediate the Assembly of an Icosahedral RNA Virus. Proc. Natl. Acad. Sci. USA 2002, 99, 655–660. [Google Scholar] [CrossRef]
  124. Annamalai, P.; Rao, A.L.N. In Vivo Packaging of Brome Mosaic Virus RNA3, but Not RNAs 1 and 2, Is Dependent on a cis-Acting 3′ TRNA-Like Structure. J. Virol. 2007, 81, 173–181. [Google Scholar] [CrossRef]
  125. Helderman, T.A.; Deurhof, L.; Bertran, A.; Boeren, S.; Fokkens, L.; Kormelink, R.; Joosten, M.H.A.J.; Prins, M.; van den Burg, H.A. An Isoform of the Eukaryotic Translation Elongation Factor 1A (EEF1a) Acts as a Pro-Viral Factor Required for Tomato Spotted Wilt Virus Disease in Nicotiana benthamiana. Viruses 2021, 13, 2190. [Google Scholar] [CrossRef]
Figure 1. Symptom development and Sugarcane mosaic virus (SCMV) detection in three maize lines inoculated with SCMV isolated Veracruz 1 (SCMV-Ver1) in leaves at the same phenological stage: (A) B73 susceptible-symptomatic line, with chlorotic mosaic symptoms, and CI-RL1 and F1, without evident symptoms; (B) SCMV-Ver1-infected plants (CI-RL1, F1, and B73 from left to right). (C) Presence of the SCMV Coat Protein (CP)-cistron in three plants randomly selected from each line.
Viruses 14 01803 g001
Figure 2. Cluster groups of transcript expression patterns (non-DEGs) in three maize lines: B73, F1 (B73 × CI-RL), and CI-RL1. (A) Group 1, with C0 to C2 clusters having high expression levels for CI-RL1; Group 2, including C3 and C4 clusters with low expression levels for CI-RL1. (B) Venn diagram of 43 selected candidate genes present in one or more expression pattern clusters. * Set of sixteen candidate genes found in only one group (Group 1 or 2).
Viruses 14 01803 g002
Figure 3. Venn diagrams of differentially expressed genes (DEGs), showing B73 susceptible (blue), F1 progeny (red), and CI-RL1 tolerant lines (green). (A) All DEGs (p-values ≤ 0.01); (B) upregulated and (C) downregulated DEGs.
Viruses 14 01803 g003
Figure 4. Functional enrichment network of cellular components (CCs) of differentially expressed genes (DEGs) in B73, CI-RL1, and F1 progeny. (A) Enrichment network of upregulated (B) and downregulated genes. Nodes represent an enriched CC ontology term, and edges represent the relationships between these ontologies. CC shared terms correspond to the following: B73 alone (blue); shared between B73 and F1 (orange); shared between all lines (purple); shared between CI-RL1 and F1 (pink); and those corresponding to CI-RL1 alone (green).
Viruses 14 01803 g004
Figure 5. Bar plot of functionally up- (A) and downregulated (B) genes of the enriched biological processes (BPs) for B73 susceptible (blue), F1 progeny, (red), and CI-RL1 (in green) lines. (A) The x-axis represents the percentage of background annotated genes for each BP term.
Viruses 14 01803 g005
Table 1. Relative expression levels of SCMV Coat Protein (SCMV-CP) in the three different lines at 2, 7, 12, 17, and 30 dpi measured via qRT-PCR.
Line2 dpi7 dpi12 dpi17 dpi30 dpi
B732.234.37090.543,588.793,975.7
F15.00.957.50.232,616.9
CI-RL11.81.50.80.872.8
Table 2. Thirty-two candidate genes selected using different criteria. Down- (in blue) and upregulated (in red) genes, maize transcript IDs, V3 identifiers, fold-change expression levels (log2), and descriptions as reported in the Monocots PLAZA 4.5 database are presented. The candidates with a gray background were below the selection criteria threshold for DEGs.
Go TermIDV3 Identifierlog2 FCDescription
B73F1CI-RL1
Nucleic acid metabolic processZm00001d008223GRMZM2G304121 −1.23.4Eukaryotic translation initiation factor 6
Zm00001d035823GRMZM2G036525 2.9Tetratricopeptide repeat (TPR)-like superfamily protein
Zm00001d004415GRMZM2G327247 1.6RNA-dependent RNA polymerase
Zm00001d026398GRMZM2G445575−1.3 1.4Transcription factor TGA4
Response to abiotic stimulusZm00001d031332GRMZM2G024668 2.0Heat shock protein 90-2
Zm00001d027511GRMZM2G090568−1.3−1.22.0Catalase/Catalase isozyme 2
Zm00001d031325GRMZM2G080724 1.925.3 kDa heat shock protein chloroplastic
TranslationZm00001d034776GRMZM2G0403692.51.4 Elongation factor 2
Regulation of biological processZm00001d044242GRMZM2G0818162.11.6 Transcription factor bHLH87
Negative regulation of biological processZm00001d011096GRMZM2G1625251.71.4 Argonaute1
Zm00001d050259GRMZM2G0914783.7 −1.5ABC transporter A family member 7
Zm00001d043762GRMZM5G8088361.91.3−2.8ABC transporter B family member 9
Zm00001d004442GRMZM2G167658−2.1 1.7ABC transporter B family member 19
Zm00001d008178GRMZM2G085111 1.0ABC transporter B family member 21
Zm00001d048329GRMZM2G3612561.8 −1.7ABC transporter C family member 3
Zm00001d025043 1.5 −1.2ABC transporter C family member 4
Zm00001d024497GRMZM2G165757−2.5 ABC transporter G family member 14
Cellular response to stressZm00001d053554GRMZM2G1177064.3 Peroxidase/Peroxidase 52
Zm00001d052335 2.8 Peroxidase/Peroxidase 67
Zm00001d040705GRMZM2G1072282.6 −2.2Peroxidase/Peroxidase 64
Zm00001d008173GRMZM2G1228531.8 Peroxidase/Peroxidase 2
Zm00001d042022GRMZM2G1033421.6 −1.8Peroxidase/Peroxidase 12
Zm00001d014341GRMZM2G1508931.51.1 Peroxidase/Peroxidase 53
Zm00001d040364GRMZM2G0899821.3 Peroxidase/Peroxidase 72
Zm00001d007161GRMZM2G4507171.3 Peroxidase/Peroxidase 52
Zm00001d038599GRMZM2G0898951.2 Peroxidase/Peroxidase 1
Zm00001d029604GRMZM2G0205231.2 Peroxidase/Peroxidase 2
Response to light stimulusZm00001d027511GRMZM2G090568−1.3−1.22.0Catalase/Catalase isozyme 2
Response to chemicalZm00001d037894GRMZM2G079440−4.8−4.3 RAB17 protein/Dehydrin DHN1
Hormone-mediated signaling pathwayZm00001d023659GRMZM2G006042−1.1 Auxin response factor 2
Zm00001d018178GRMZM2G479760−1.0 ABSCISIC ACID-INSENSITIVE 5-like protein 5
Cellular nitrogen compound metabolic processZm00001d031953GRMZM5G882446 −1.2Glutathione S-transferase
Response to hormoneZm00001d014606GRMZM2G133434−1.2 Peroxidase/Peroxidase 45
Zm00001d020808GRMZM5G843748−1.1−1.6 Peroxidase/Peroxidase 17
Zm00001d009373GRMZM2G023840−1.5 Peroxidase/Peroxidase 72
Zm00001d037873GRMZM2G1542180.80.9 Elongation factor 1-alpha (elfa3)
Zm00001d036904GRMZM2G343543 0.6 Elongation factor 1-alpha (elfa10)
Zm00001d037877GRMZM2G0013270.70.7−0.5Elongation factor 1-alpha (elfa12)
Zm00001d025100GRMZM5G801457 −0.7Translation elongation factor EF1A (Zm-elfa)
Table 3. Candidate genes selected after differentially expressed genes (DEGs) analysis. Down- (in blue) and upregulated (in red) genes, maize transcript IDs, fold-change expression levels (log2), and the information for V3 identifiers and descriptions are shown.
IDV3 Identifierlog2 FCDescription
B73F1CI-RL1
Zm00001d021205GRMZM2G069082−2.0−0.92.7AP2-EREBP transcription factor/Dehydration-responsive element-binding protein 1B
Zm00001d006169GRMZM2G124037−3.0−1.22.2CBF3-like protein; CRT/DRE binding factor; DREB-like protein
Zm00001d021208GRMZM2G069146−2.0−0.82.0AP2-EREBP transcription factor/Dehydration-responsive element-binding protein 1B
Zm00001d027511GRMZM2G090568−1.3−1.22.0Catalase/Catalase isozyme 2
Zm00001d031745GRMZM2G142962−1.5−0.61.5Homeobox-leucine zipper protein HAT3
Zm00001d016361GRMZM2G031983−1.30.91.5C2C2-GATA transcription factor/Putative GATA transcription factor 22
Zm00001d038850GRMZM2G111017−1.1−0.71.3Probable ADPATP carrier protein
Zm00001d053911GRMZM2G042664−1.2−0.41.3expressed protein
Zm00001d043060GRMZM2G059562−1.7−1.11.3Probable WRKY transcription factor 30
Zm00001d044117GRMZM2G150260−1.11.91.2DNA binding protein
Zm00001d043505GRMZM2G039246−1.5−1.41.2Histidine-containing phosphotransfer protein 4
Zm00001d033510GRMZM2G146616−1.5−0.51.2expressed protein
Zm00001d018107AC220927.3_FG007−1.3−0.91.2Protein EXORDIUM
Zm00001d033786GRMZM2G155767−1.7−0.81.2histidine kinase4
Zm00001d016982GRMZM2G176253−1.4−1.21.2Protein NRT1/PTR FAMILY 6.4
Zm00001d025470GRMZM2G158097−1.2−0.51.2expressed protein
Zm00001d010490GRMZM2G084489−1.3−0.61.1CW-type Zinc Finger
Zm00001d002256GRMZM5G897776−1.5−0.61.0Starch synthase 3 chloroplastic/amyloplastic
Zm00001d019217GRMZM2G031780−1.0−0.71.0ABC2 homolog 13
Zm00001d031158GRMZM2G4026317.04.0−2.7Pathogenesis-related protein5
Zm00001d030548GRMZM2G1621586.02.8−2.0Leucoanthocyanidin dioxygenase
Zm00001d002707GRMZM2G1200164.85.2−3.6Glycosyltransferase/Cis-zeatin O-glucosyltransferase 1
Zm00001d052690AC233883.1_FG0063.82.2−3.4UPF0481 protein
Zm00001d049632GRMZM2G0075873.71.6−1.4Kelch motif family protein isoform 1\F-box/kelch-repeat protein
Zm00001d044904GRMZM2G0172443.62.5−1.5Transcription factor EMB1444
Zm00001d002436GRMZM2G1256693.22.8−3.6Ubiquinol oxidase/alternative oxidase2
Zm00001d048683GRMZM2G1063773.21.6−2.1Putative RING zinc finger domain superfamily protein
Zm00001d052989GRMZM2G1303893.11.4−1.1Cysteine-rich receptor-like protein kinase 6
Zm00001d024963GRMZM2G3306352.92.1−1.7Glutathione S-transferase GSTU6
Zm00001d032869GRMZM5G8965402.81.1−2.0L-type lectin-domain containing receptor kinase V.9
Zm00001d039077GRMZM5G8460572.80.9−2.5AP2-EREBP transcription factor/Ethylene-responsive transcription factor ERF061
Zm00001d005028GRMZM2G0184362.71.1−2.0NAC domain-containing protein 77
Zm00001d040743GRMZM2G0910882.71.1−1.0Os01g23380-like protein
Zm00001d044874GRMZM2G1359602.61.4−4.023.6 kDa heat shock protein mitochondrial
Zm00001d048949GRMZM2G1179712.6−2.6−1.9Hevein-like preproprotein
Zm00001d015623GRMZM2G4179452.51.1−1.8Glycosyltransferase/Limonoid UDP-glucosyltransferase
Zm00001d034501GRMZM2G1373212.51.1−2.7AAA-ATPase ASD mitochondrial
Zm00001d038451GRMZM2G1699662.41.0−2.7Putative WRKY DNA-binding domain superfamily protein
Table 4. Transcripts coding for translation/elongation factors found in clustering of transcript expression patterns (CTEPs) C0 to C4 (see Figure 2A).
C0C1C2C3C4
GeneTranscript IDGeneTranscript IDGeneTranscript IDGeneTranscript IDGeneTranscript ID
elfa1Zm00001d009868_T004elfa1Zm00001d009868_T009elfa1Zm00001d009868_T003ZmeIF4EZm00001d041973_T001eif-6Zm00001d041682_T001
elfa2Zm00001d037875_T005elfa2Zm00001d037875_T008elfa1Zm00001d009868_T012eif-7Zm00001d014065_T001elfa2Zm00001d037875_T006
elfa3Zm00001d037873_T011elfa3Zm00001d037873_T009elfa2Zm00001d037875_T003elfa1Zm00001d009868_T002elfa3Zm00001d037873_T001
elfa9Zm00001d046449_T004elfa10Zm00001d036904_T002elfa11Zm00001d037905_T003elfa12Zm00001d037877_T005elfa7Zm00001d009870_T013
elfa11Zm00001d037905_T002elfa10Zm00001d036904_T005elfa12Zm00001d037877_T008
Publisher’s Note: MDPI stays neutral with regard to jurisdictional claims in published maps and institutional affiliations.

