
Influence of Physicochemical Factors on Adsorption of Ten Shigella flexneri Phages

Abstract
:
1. Introduction
2. Materials and Methods
2.1. Bacterial Strains and Phages
2.2. One Step Growth Curve
2.3. Adsorption Studies
2.3.1. Adsorption Rate
2.3.2. Influence of Physicochemical Factors
2.3.3. Adsorption in Meat
2.4. Statistical Analysis
3. Results
3.1. One Step Growth Curve Experiment
3.2. Adsorption Studies
3.2.1. Adsorption Rate
3.2.2. Influence of Temperature
3.2.3. Influence of Cations
3.2.4. Influence of pH
3.2.5. Influence of Sucrose
3.2.6. Influence of Glycerol
3.2.7. Adsorption in Meat
4. Discussion
5. Conclusions
Supplementary Materials
Author Contributions
Funding
Institutional Review Board Statement
Informed Consent Statement
Data Availability Statement
Acknowledgments
Conflicts of Interest
References
- Allison, G.E.; Verma, N.K. Serotype-converting bacteriophages and O-antigen modification in Shigella flexneri. Trends Microbiol. 2000, 8, 17–23. [Google Scholar] [CrossRef] [PubMed]
- Connor, T.R.; Barker, C.R.; Baker, K.S.; Weill, F.X.; Talukder, K.A.; Smith, A.M.; Baker, S.; Gouali, M.; Pham Thanh, D.; Jahan Azmi, I.; et al. Species-wide whole genome sequencing reveals historical global spread and recent local persistence in Shigella flexneri. eLife 2015, 4, e07335. [Google Scholar] [CrossRef] [PubMed]
- Zafar, A.; Sabir, N.; Bhutta, Z.A. Frequency of isolation of Shigella serogroups/serotypes and their antimicrobial susceptibility pattern in children from slum areas in Karachi. J. Pak. Med. Assoc. 2005, 55, 184–188. [Google Scholar]
- Torrez Lamberti, M.F.; Lopez, F.E.; Valdez, P.; Bianchi, A.; Barrionuevo Medina, E.; Pescaretti, M.L.M.; Delgado, M.A. Epidemiological study of prevalent pathogens in the Northwest region of Argentina (NWA). PLoS ONE 2020, 15, e0240404. [Google Scholar] [CrossRef] [PubMed]
- Niyogi, S.K. Shigellosis. J. Microbiol. 2005, 43, 133–143. [Google Scholar] [PubMed]
- Rubinstein, A.; Aruachan, D.; Burgos, M.; Angeleri, P.I. Dirección Nacional de Epidemiologia y Análisis de la Situación de Salud Ministerio de Salud de la Nación Argentina. Boletín Integr. Vigil. 2018, 417, 1–40. [Google Scholar]
- Pichel, M.; Brengi, S.P.; Cooper, K.L.F.; Ribot, E.; Al-Busaidy, S.; Araya, P.; Fernández, J.; Vaz, T.; Kam, K.; Morcos, M.; et al. Standardization and international multicenter validation of a PulseNet pulsedfield gel electrophoresis protocol for subtyping Shigella flexneri isolates. Foodborne Pathog. Dis. 2012, 9, 418–424. [Google Scholar] [CrossRef] [Green Version]
- Jamal, M.; Chaudhry, W.N.; Hussain, T.; Das, C.R.; Andleeb, S. Characterization of new Myoviridae bacteriophage WZ1 against multi-drug resistant (MDR) Shigella dysenteriae. J. Basic Microbiol. 2015, 55, 420–431. [Google Scholar] [CrossRef]
- Gu, B.; Cao, Y.; Pan, S.; Zhuang, L.; Yu, R.; Peng, Z.; Qian, H.; Wei, Y.; Zhao, L.; Liu, G.; et al. Comparison of the prevalence and changing resistance to nalidixic acid and ciprofloxacin of Shigella between Europe-America and Asia-Africa from 1998 to 2009. Int. J. Antimicrob. Agents. 2012, 40, 9–17. [Google Scholar] [CrossRef]
- World Health Organization. Guidelines for the Control of Shigellosis, Including Epidemics Due to Shigella dysenteriae Type 1; WHO Document Production Services; World Health Organization: Geneva, Switzerland, 2005. [Google Scholar]
- World Health Organization. Global Priority List of Antibiotic Resistant Bacteria to Guide Research, Discovery, and Development of New Antibiotics; World Health Organization: Geneva, Switzerland, 2017. [Google Scholar]
- Ge, H.; Hua, M.; Zhaoa, G.; Du, Y.; Xu, N.; Chen, X.; Jiao, X. The “fighting wisdom and bravery” of tailed phage and host in the process of adsorption. Microbiol. Res. 2020, 230, 126344. [Google Scholar] [CrossRef]
- Doore, S.; Schrad, J.R.; Dean, W.F.; Dover, J.A.; Parenta, K.N. Shigella Phages Isolated during a Dysentery Outbreak Reveal Uncommon Structures and Broad Species Diversity. J. Virol. 2018, 92, e02117-17. [Google Scholar] [CrossRef] [PubMed] [Green Version]
- Tomat, D.; Gonzales, A.; Aquili, V.; Casabonne, C.; Quiberoni, A. Characterization of ten newly isolated phages against the foodborne pathogen Shigella flexneri. J. Food Process. Preserv. 2022, 46, e15676. [Google Scholar] [CrossRef]
- Tomat, D.; Mercanti, D.; Balague, C.; Quiberoni, A. Phage biocontrol of enteropathogenic and Shiga toxin-producing Escherichia coli during milk fermentation. Lett. Appl. Microbiol. 2013, 57, 3–10. [Google Scholar] [CrossRef] [PubMed]
- Wang, I.N. Lysis timing and bacteriophage fitness. Genetics 2006, 172, 17–26. [Google Scholar] [CrossRef] [PubMed] [Green Version]
- Kropinski, A. Measurement of the Rate of Attachment of Bacteriophage to Cells. In Bacteriophages: Methods and Protocols; En Clokie, M., Kropinski, A., Eds.; Humana Press: London, UK, 2009; pp. 151–155. [Google Scholar] [CrossRef]
- Shahin, K.; Bouzari, M. Bacteriophage application for biocontrolling Shigella flexneri in contaminated foods. J. Food Sci. Technol. 2018, 55, 550–559. [Google Scholar] [CrossRef] [PubMed]
- Jun, J.W.; Kim, H.J.; Yun, S.K.; Chai, J.Y.; Lee, B.C.; Park, S.C. Isolation and comparative genomic analysis of T1-Like Shigella bacteriophage pSf-2. Curr. Microbiol. 2015, 72, 235–241. [Google Scholar] [CrossRef] [PubMed]
- Kumar, P.; Meghvansi, M.K.; Kamboj, D.V. Isolation, phenotypic characterization and comparative genomic analysis of 2019SD1, a polyvalent enterobacteria phage. Sci. Rep. 2021, 11, 22197. [Google Scholar] [CrossRef]
- Shen, G.H.; Wang, J.L.; Wen, F.S.; Chang, K.M.; Kuo, C.F.; Lin, C.H.; Luo, H.R.; Hung, C.H. Isolation and characterization of ukm18p, a novel lytic phage with therapeutic potential against extensively drug resistant Acinetobacter baumannii. PLoS ONE 2012, 7, e46537. [Google Scholar] [CrossRef] [Green Version]
- Xu, J.; Zhang, R.; Yu, X.; Zhang, X.; Liu, G.; Liu, X. Molecular Characteristics of Novel Phage vB_ShiP-A7 Infecting Multidrug-Resistant Shigella flexneri and Escherichia coli, and Its Bactericidal Effect in vitro and in vivo. Front. Microbiol. 2021, 12, 698962. [Google Scholar] [CrossRef]
- Ahamed, S.K.T.; Roy, B.; Basu, U.; Dutta, S.; Ghosh, A.N.; Bandyopadhyay, B.; Giri, N. Genomic and Proteomic Characterizations of Sfin-1, a Novel Lytic Phage Infecting Multidrug-Resistant Shigella spp. and Escherichia coli C. Front. Microbiol. 2019, 10, 1876. [Google Scholar] [CrossRef] [Green Version]
- Shahin, K.; Bao, H.; Komijani, M.; Barazandeh, M.; Bouzaric, M.; Hedayatkhahd, A.; Zhang, L.; Zhao, H.; He, T.; Pang, M.; et al. Isolation, characterization, and PCR-based molecular identification of a siphoviridae phage infecting Shigella dysenteriae. Microb. Pathog. 2019, 131, 175–180. [Google Scholar] [CrossRef] [PubMed]
- Lu, H.; Yan, P.; Xiong, W.; Wang, J.; Liu, W. Genomic characterization of a novel virulent phage infecting Shigella flexneri and isolated from sewage. Virus Res. 2020, 283, 197983. [Google Scholar] [CrossRef] [PubMed]
- Kasman, L.M.; Kasman, A.; Westwater, C.; Dolan, J.; Schmidt, M.G.; Norris, J.S. Overcoming the phage replication threshold: A mathematical model with implications for phage therapy. J. Virol. 2002, 76, 5557–5564. [Google Scholar] [CrossRef] [PubMed] [Green Version]
- Chhibber, S.; Kaur, T.; Kaur, S. Essential role of calcium in the infection process of broad-spectrum methicillin-resistant Staphylococcus aureus bacteriophage. J. Basic Microbiol. 2014, 54, 775–780. [Google Scholar] [CrossRef]
- Jun, J.W.; Giri, S.S.; Kim, H.J.; Yun, S.K.; Chi, C.; Chai, J.C.; Lee, B.C.; Park, S.C. Bacteriophage application to control the contaminated water with Shigella. Sci. Rep. 2016, 6, 22636. [Google Scholar] [CrossRef] [Green Version]
- Wang, W.L.L.; Dunlop, S.G.; Maunson, P.S. Survival of Shigella in Sewage II. Effect of Glycerol on Shigella flexneri and Shigella Bacteriophage. Appl. Microbiol. 1964, 12, 188–194. [Google Scholar] [CrossRef]
- Soffer, N.; Woolston, J.; Li, M.; Das, C.; Sulakvelidze, A. Bacteriophage preparation lytic for Shigella significantly reduces Shigella sonnei contamination in various foods. PLoS ONE 2017, 12, e0175256. [Google Scholar] [CrossRef]

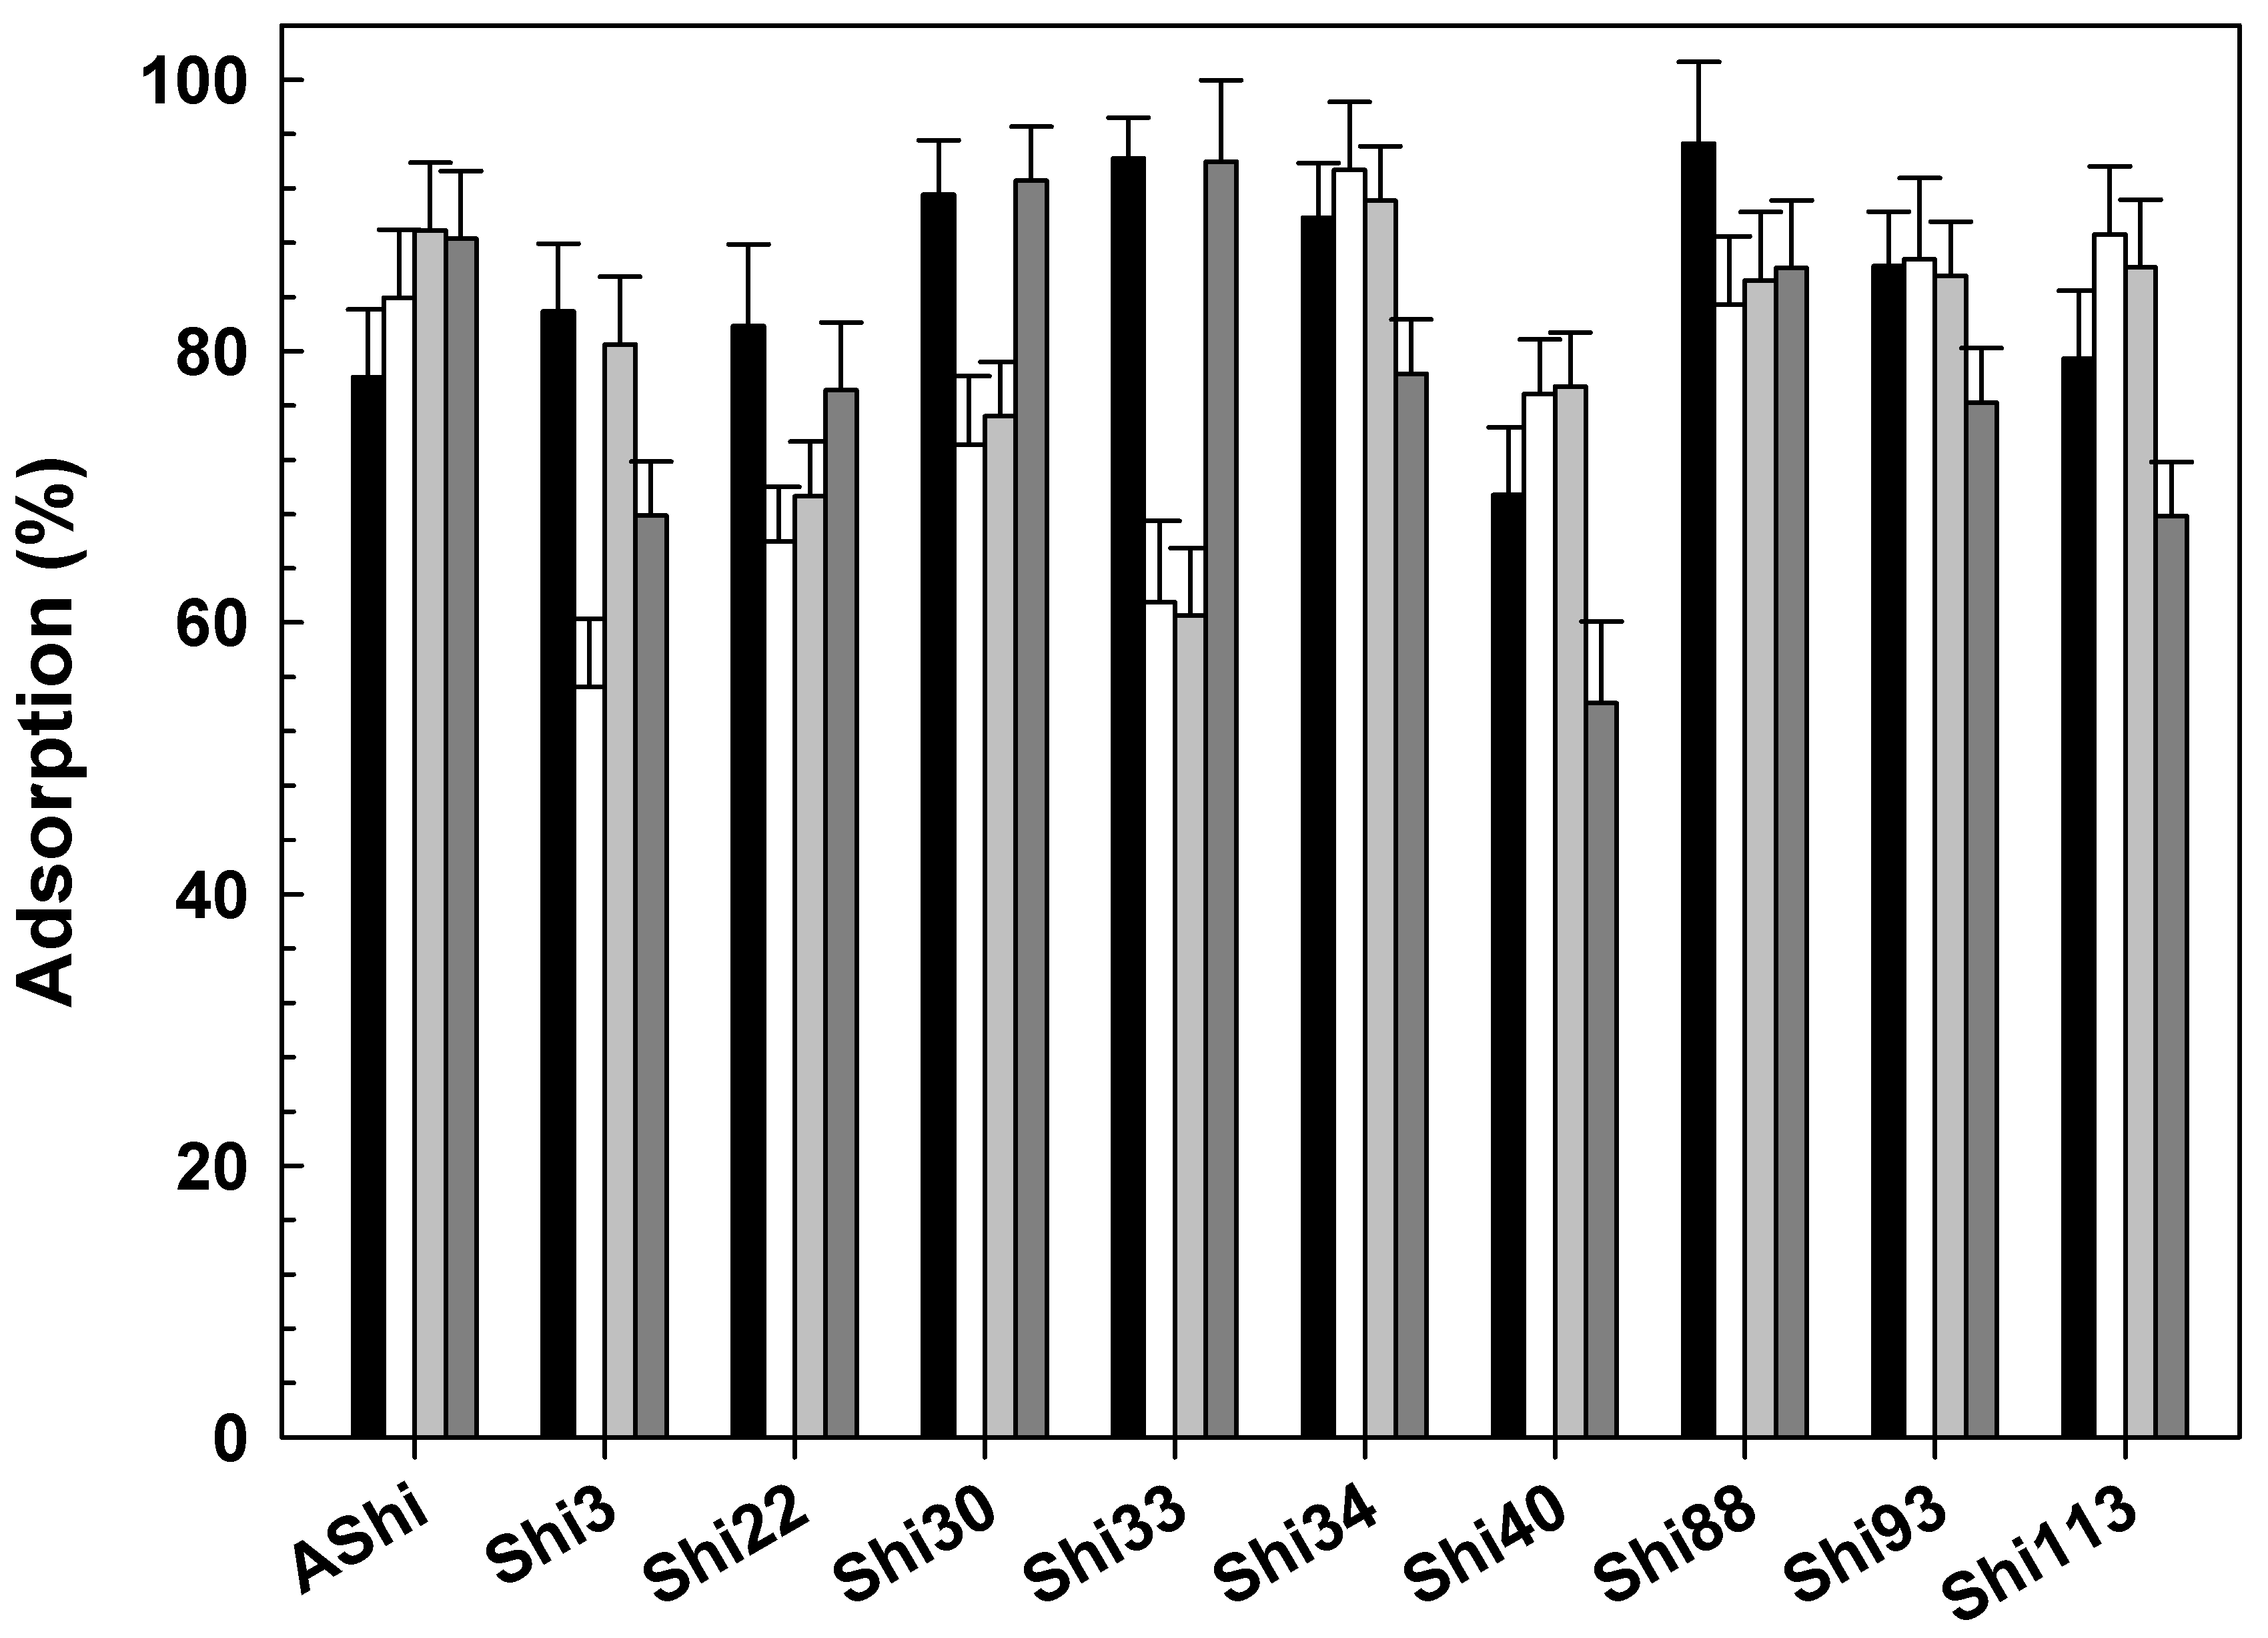
 ), 25 °C (☐; control), 37 °C (
 ) and 50 °C (
 ) on ATCC12022 viable cells. Values are the mean ± standard deviation (error bars) of three determinations.
), 25 °C (☐; control), 37 °C () and 50 °C () on ATCC12022 viable cells. Values are the mean ± standard deviation (error bars) of three determinations.
) on ATCC12022 viable cells. Values are the mean ± standard deviation (error bars) of three determinations.
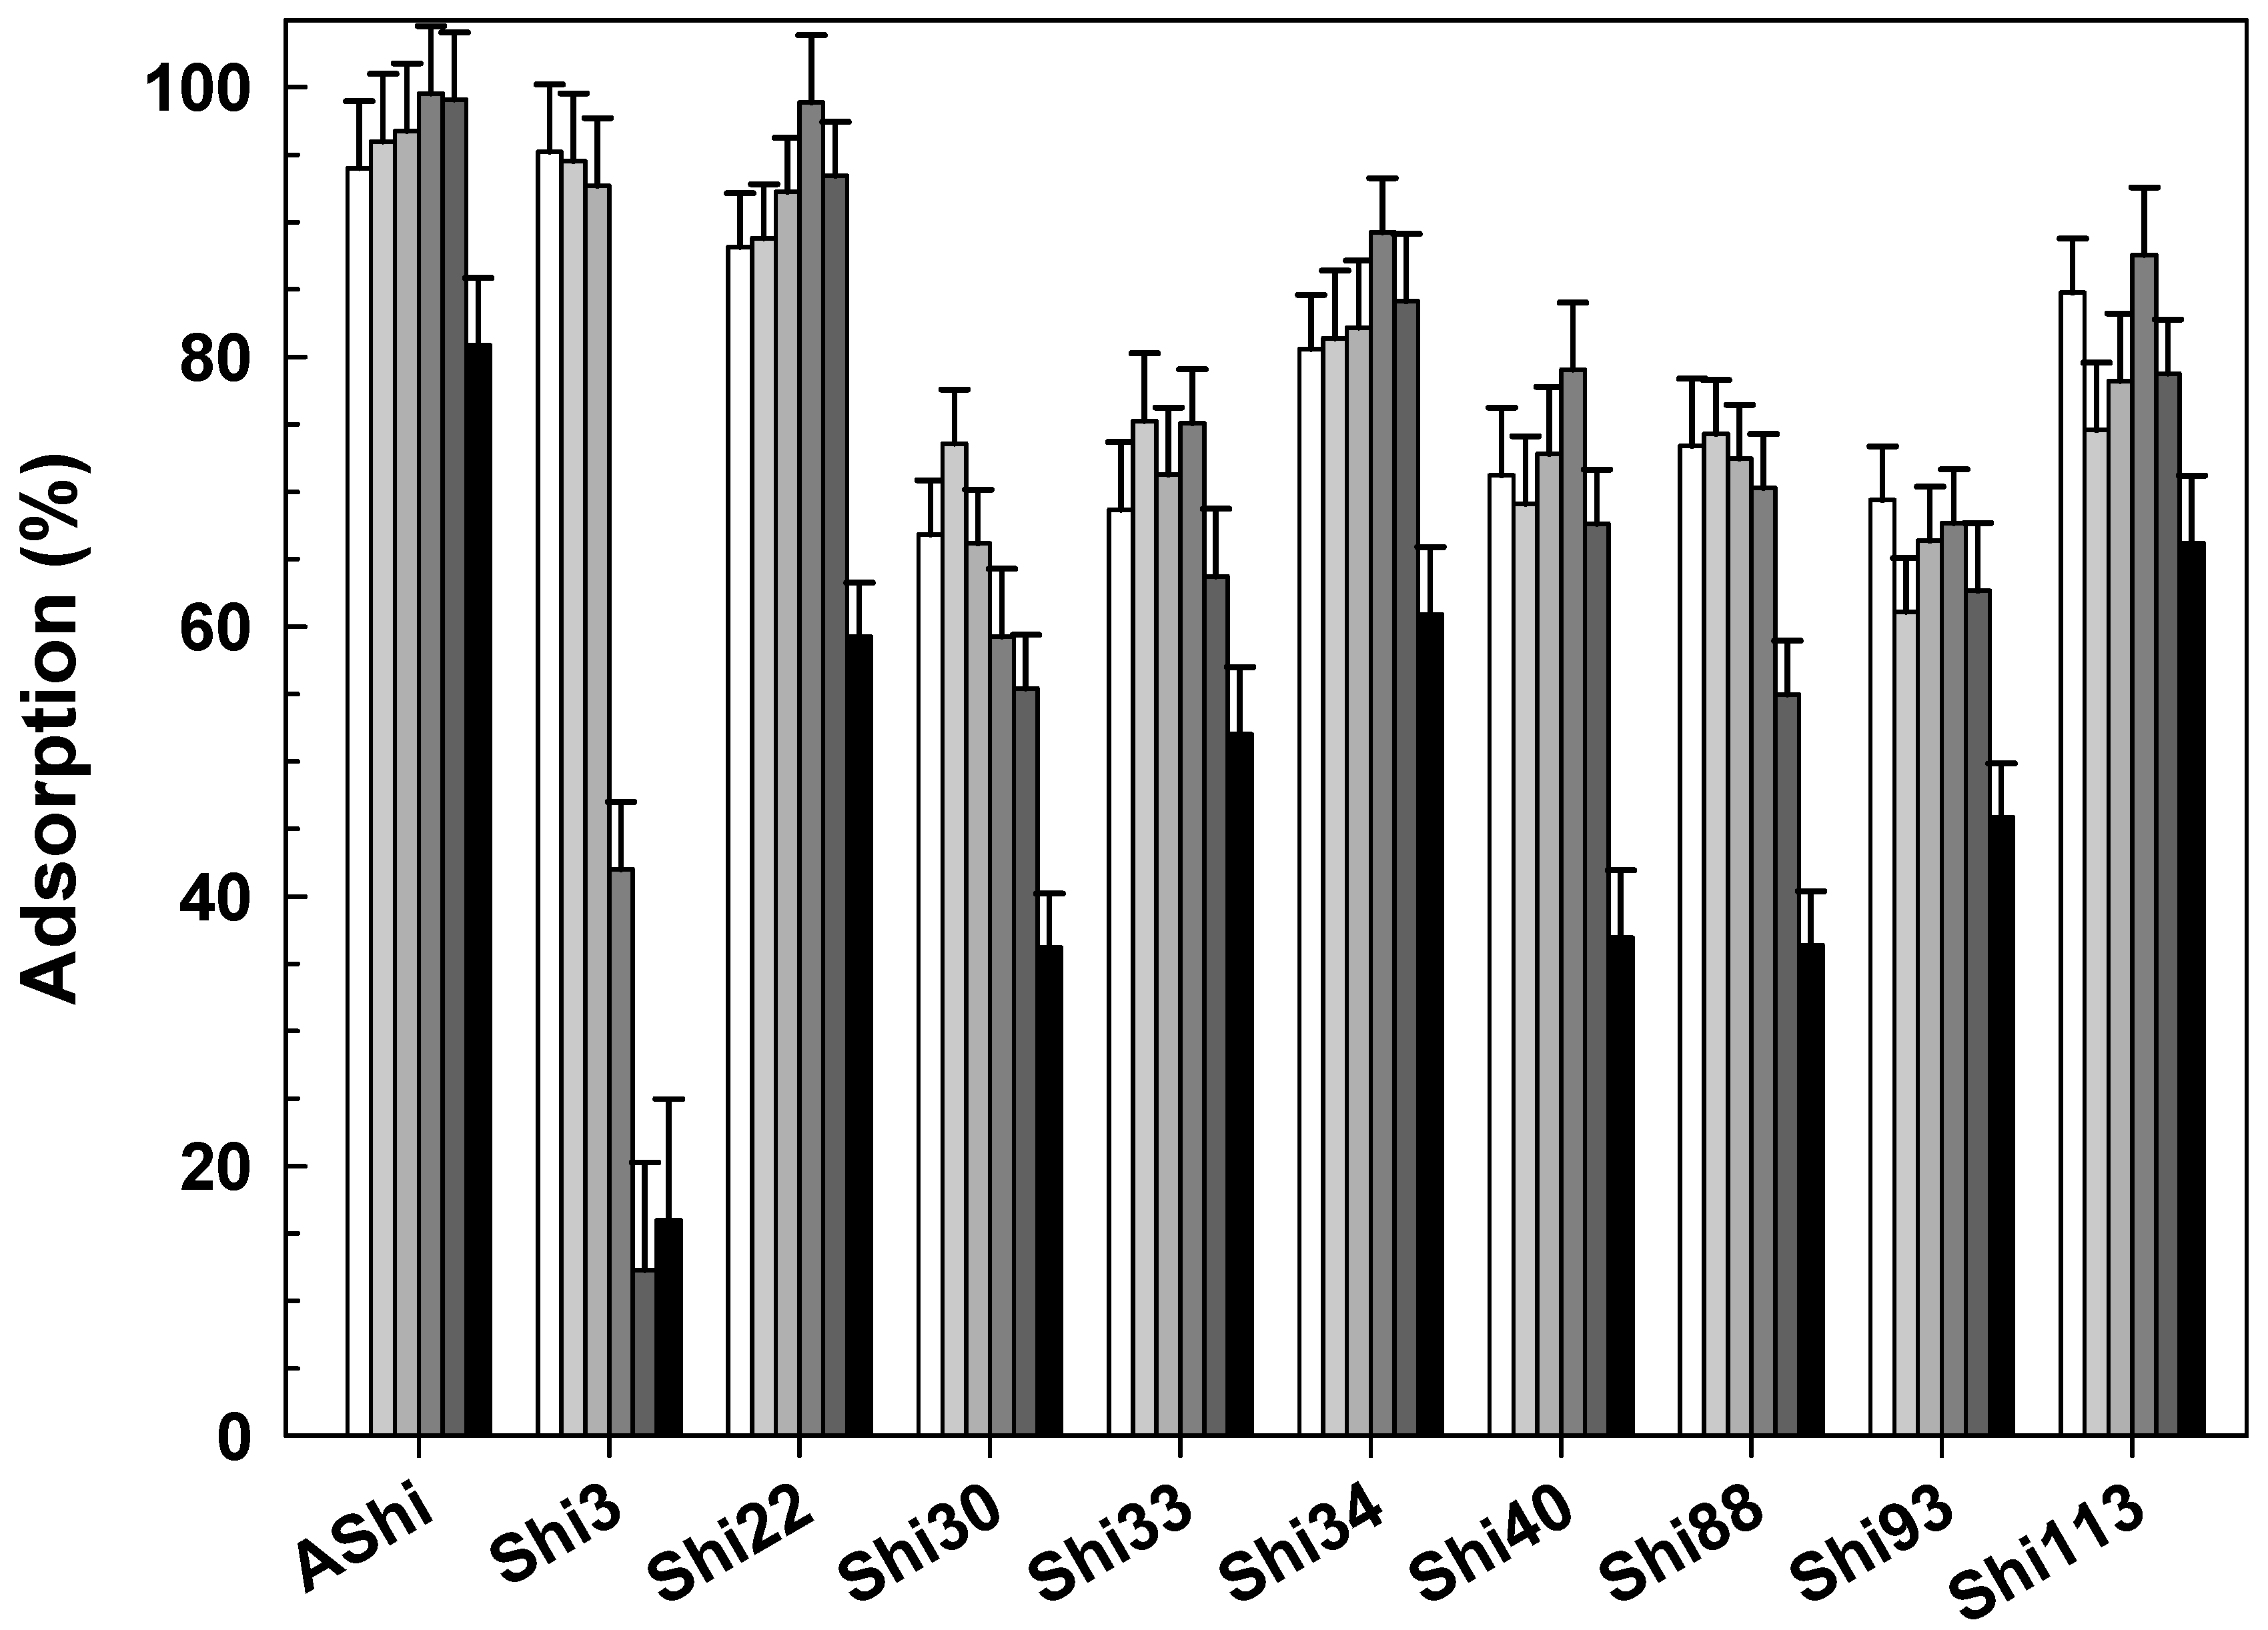
), 25 °C (☐; control), 37 °C () and 50 °C () on ATCC12022 viable cells. Values are the mean ± standard deviation (error bars) of three determinations. ), 2 g dL−1 (
 ), 4 g dL−1 (), 10 g dL−1 (
 ) and 20 g dL−1 () of Na+ on ATCC12022 viable cells. Values are the mean ± standard deviation (error bars) of three determinations.
), 2 g dL−1 (), 4 g dL−1 (), 10 g dL−1 () and 20 g dL−1 () of Na+ on ATCC12022 viable cells. Values are the mean ± standard deviation (error bars) of three determinations.
) and 20 g dL−1 () of Na+ on ATCC12022 viable cells. Values are the mean ± standard deviation (error bars) of three determinations.
), 2 g dL−1 (), 4 g dL−1 (), 10 g dL−1 () and 20 g dL−1 () of Na+ on ATCC12022 viable cells. Values are the mean ± standard deviation (error bars) of three determinations. ; control), 4.0 () and 10.0 (☐) on ATCC12022 viable cells. Values are the mean ± standard deviation (error bars) of three determinations.
; control), 4.0 () and 10.0 (☐) on ATCC12022 viable cells. Values are the mean ± standard deviation (error bars) of three determinations.
; control), 4.0 () and 10.0 (☐) on ATCC12022 viable cells. Values are the mean ± standard deviation (error bars) of three determinations. ), 10 g dL−1 () and 20 g dL−1 () of sucrose on ATCC12022 viable cells. Values are the mean ± standard deviation (error bars) of three determinations.
), 10 g dL−1 () and 20 g dL−1 () of sucrose on ATCC12022 viable cells. Values are the mean ± standard deviation (error bars) of three determinations.
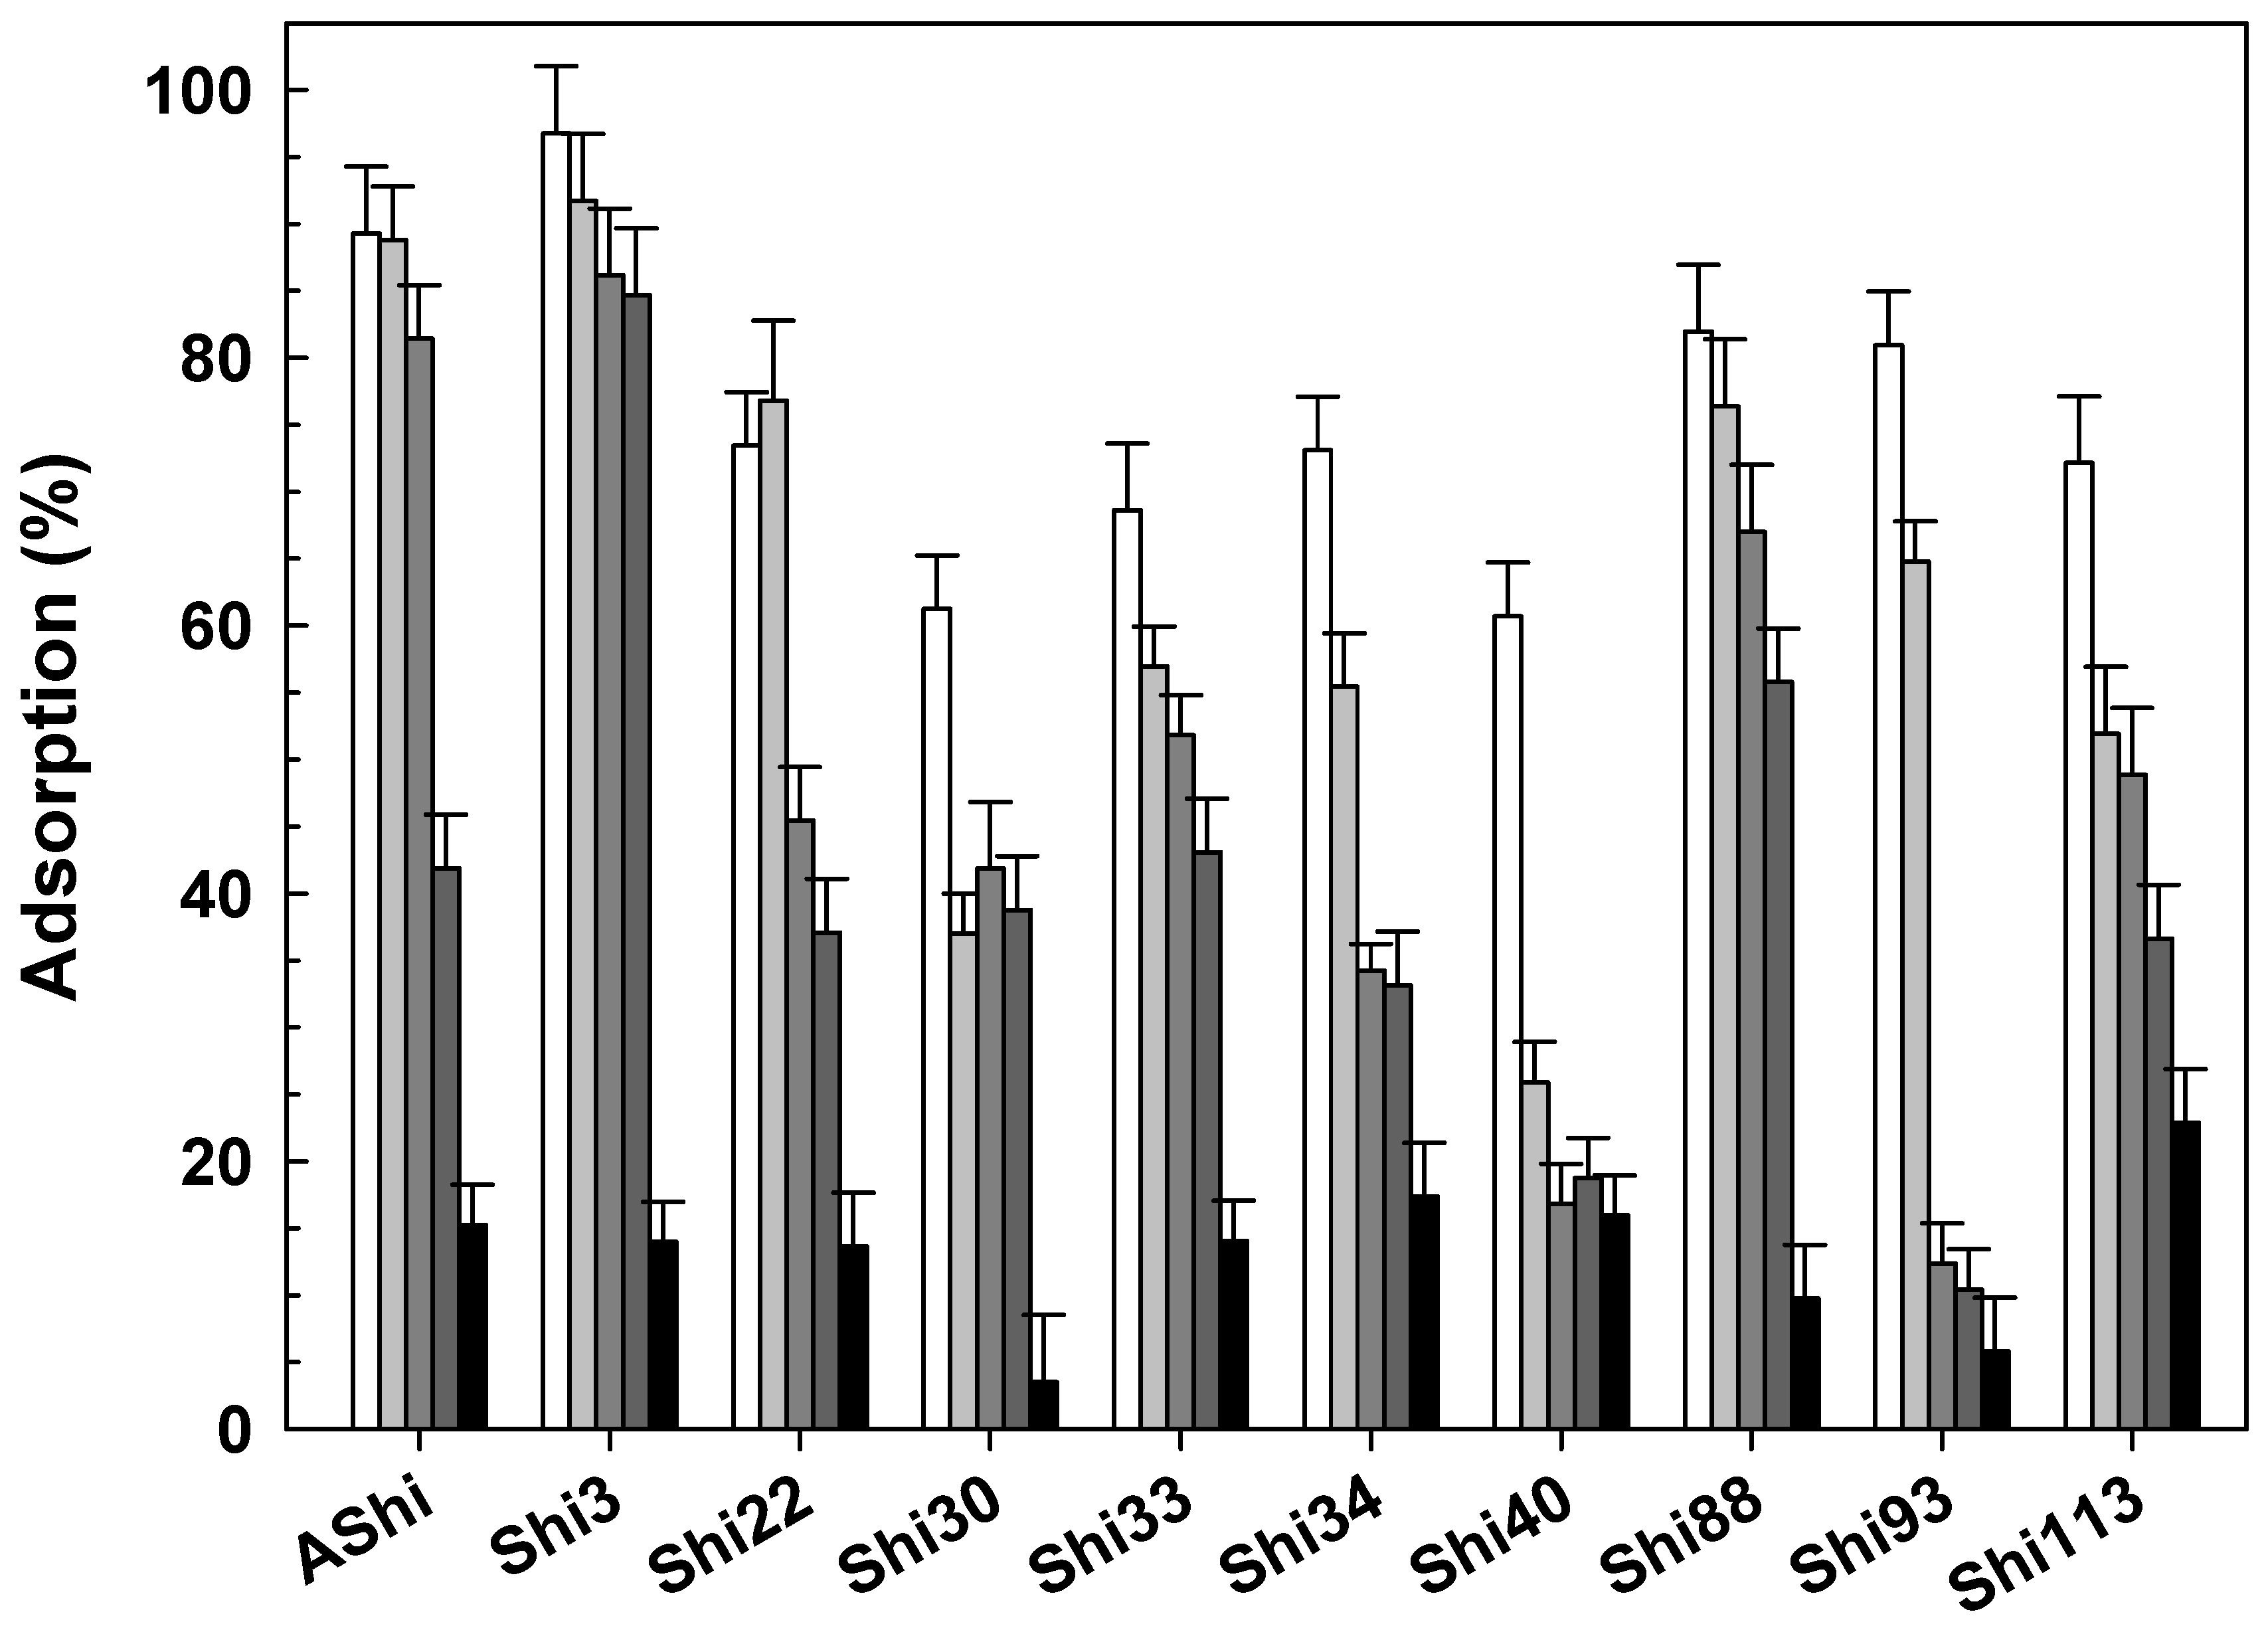
), 10 g dL−1 () and 20 g dL−1 () of sucrose on ATCC12022 viable cells. Values are the mean ± standard deviation (error bars) of three determinations. ), 10 g dL−1 (), 20 g dL−1 () and 30 g dL−1 () of glycerol on ATCC12022 viable cells. Values are the mean ± standard deviation (error bars) of three determinations.
), 10 g dL−1 (), 20 g dL−1 () and 30 g dL−1 () of glycerol on ATCC12022 viable cells. Values are the mean ± standard deviation (error bars) of three determinations.
), 10 g dL−1 (), 20 g dL−1 () and 30 g dL−1 () of glycerol on ATCC12022 viable cells. Values are the mean ± standard deviation (error bars) of three determinations.


| Phage | Burst Size (PFU Cell−1) | Latent Period (min) | Adsorption at 5 min (%) | Adsorption at the End (%) | Adsorption Constant (k) (mL min−1) |
|---|---|---|---|---|---|
| AShi | 16 | 20 | 87 ± 9 | 99 ± 9 | 4.11 × 10⁻⁹ |
| Shi3 | 17 | 15 | 70 ± 7 | 78 ± 8 | 2.43 × 10⁻⁹ |
| Shi22 | 67 | 25 | 88 ± 8 | 96 ± 8 | 4.16 × 10⁻⁹ |
| Shi30 | 64 | 30 | 56 ± 6 | 70 ± 7 | 1.66 × 10⁻⁹ |
| Shi33 | 17 | 25 | 46 ± 5 | 56 ± 6 | 1.22 × 10⁻⁹ |
| Shi34 | 14 | 20 | 49 ± 5 | 85 ± 8 | 1.35 × 10⁻⁹ |
| Shi40 | 16 | 20 | 21 ± 3 | 64 ± 6 | 4.64 × 10⁻¹⁰ |
| Shi88 | 15 | 25 | 45 ± 5 | 54 ± 5 | 1.19 × 10⁻⁹ |
| Shi93 | 17 | 15 | 45 ± 5 | 60 ± 6 | 1.20 × 10⁻⁹ |
| Shi113 | 15 | 15 | 76 ± 8 | 73 ± 7 | 2.85 × 10⁻⁹ |
Publisher’s Note: MDPI stays neutral with regard to jurisdictional claims in published maps and institutional affiliations. |
© 2022 by the authors. Licensee MDPI, Basel, Switzerland. This article is an open access article distributed under the terms and conditions of the Creative Commons Attribution (CC BY) license (https://creativecommons.org/licenses/by/4.0/).
Share and Cite
Tomat, D.; Aquili, V.; Casabonne, C.; Quiberoni, A. Influence of Physicochemical Factors on Adsorption of Ten Shigella flexneri Phages. Viruses 2022, 14, 2815. https://doi.org/10.3390/v14122815
Tomat D, Aquili V, Casabonne C, Quiberoni A. Influence of Physicochemical Factors on Adsorption of Ten Shigella flexneri Phages. Viruses. 2022; 14(12):2815. https://doi.org/10.3390/v14122815
Chicago/Turabian StyleTomat, David, Virginia Aquili, Cecilia Casabonne, and Andrea Quiberoni. 2022. "Influence of Physicochemical Factors on Adsorption of Ten Shigella flexneri Phages" Viruses 14, no. 12: 2815. https://doi.org/10.3390/v14122815