
Reactive Oxygen Species (ROS) Are Not a Key Determinant for Zika Virus-Induced Apoptosis in SH-SY5Y Neuroblastoma Cells

 ,
,  and
and 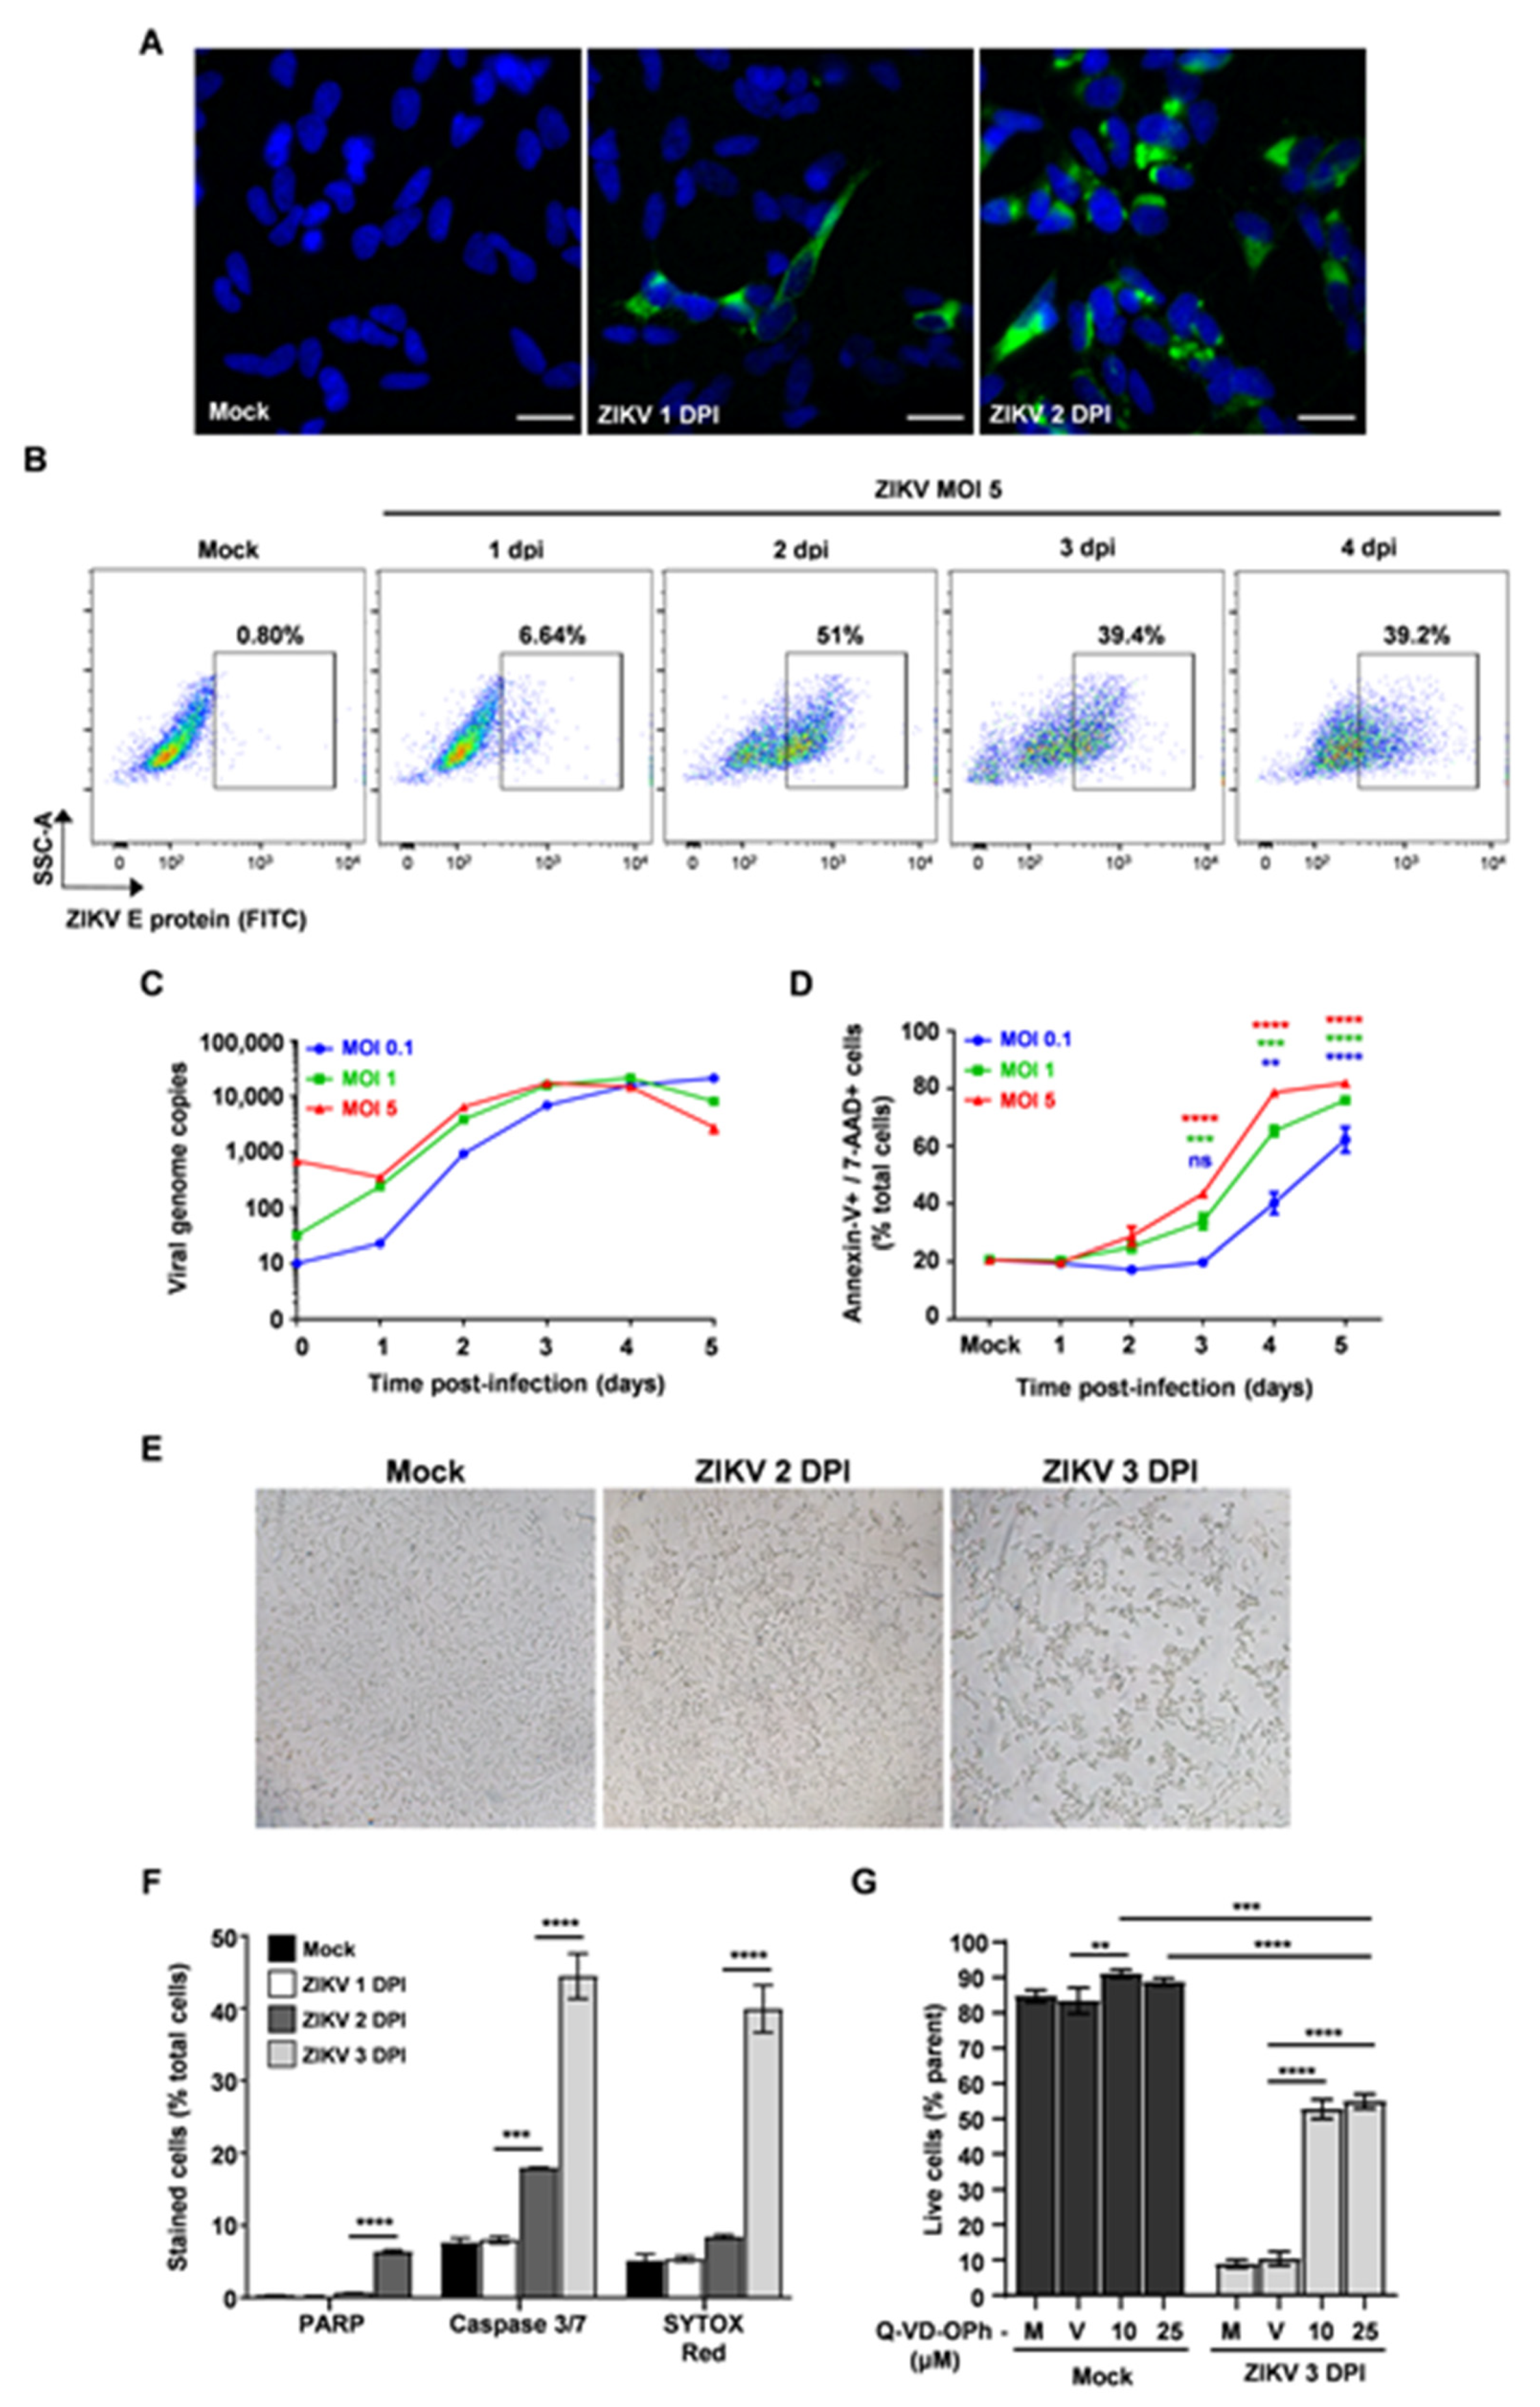
Abstract
:1. Introduction
2. Materials and Methods
2.1. Cell Culture and Viral Infection
2.2. ZIKV Titration in SH-SY5Y Cells by Plaque Assay
2.3. ZIKV Replication Kinetics by Real-Time PCR
2.4. Analysis of Cell Death Markers by Flow Cytometry (FCM)
2.5. Intracellular Cytokine Staining and FCM Analysis
2.6. ZIKV E Protein Labeling and FCM Analysis
2.7. Immunofluorescence Reaction and Confocal and Epifluorescence Microscopy Assays
2.8. Pharmacological Inhibition Assays
2.9. SDS-PAGE and Immunoblot
2.10. Gene Expression Analysis by qRT-PCR
2.11. Reactive Oxygen Species (ROS) Detection Assay
2.12. Statistical Analysis
3. Results
3.1. ZIKV-Induced Apoptosis Is Partially Dependent on Caspase Activation in SH-SY5Y Cells
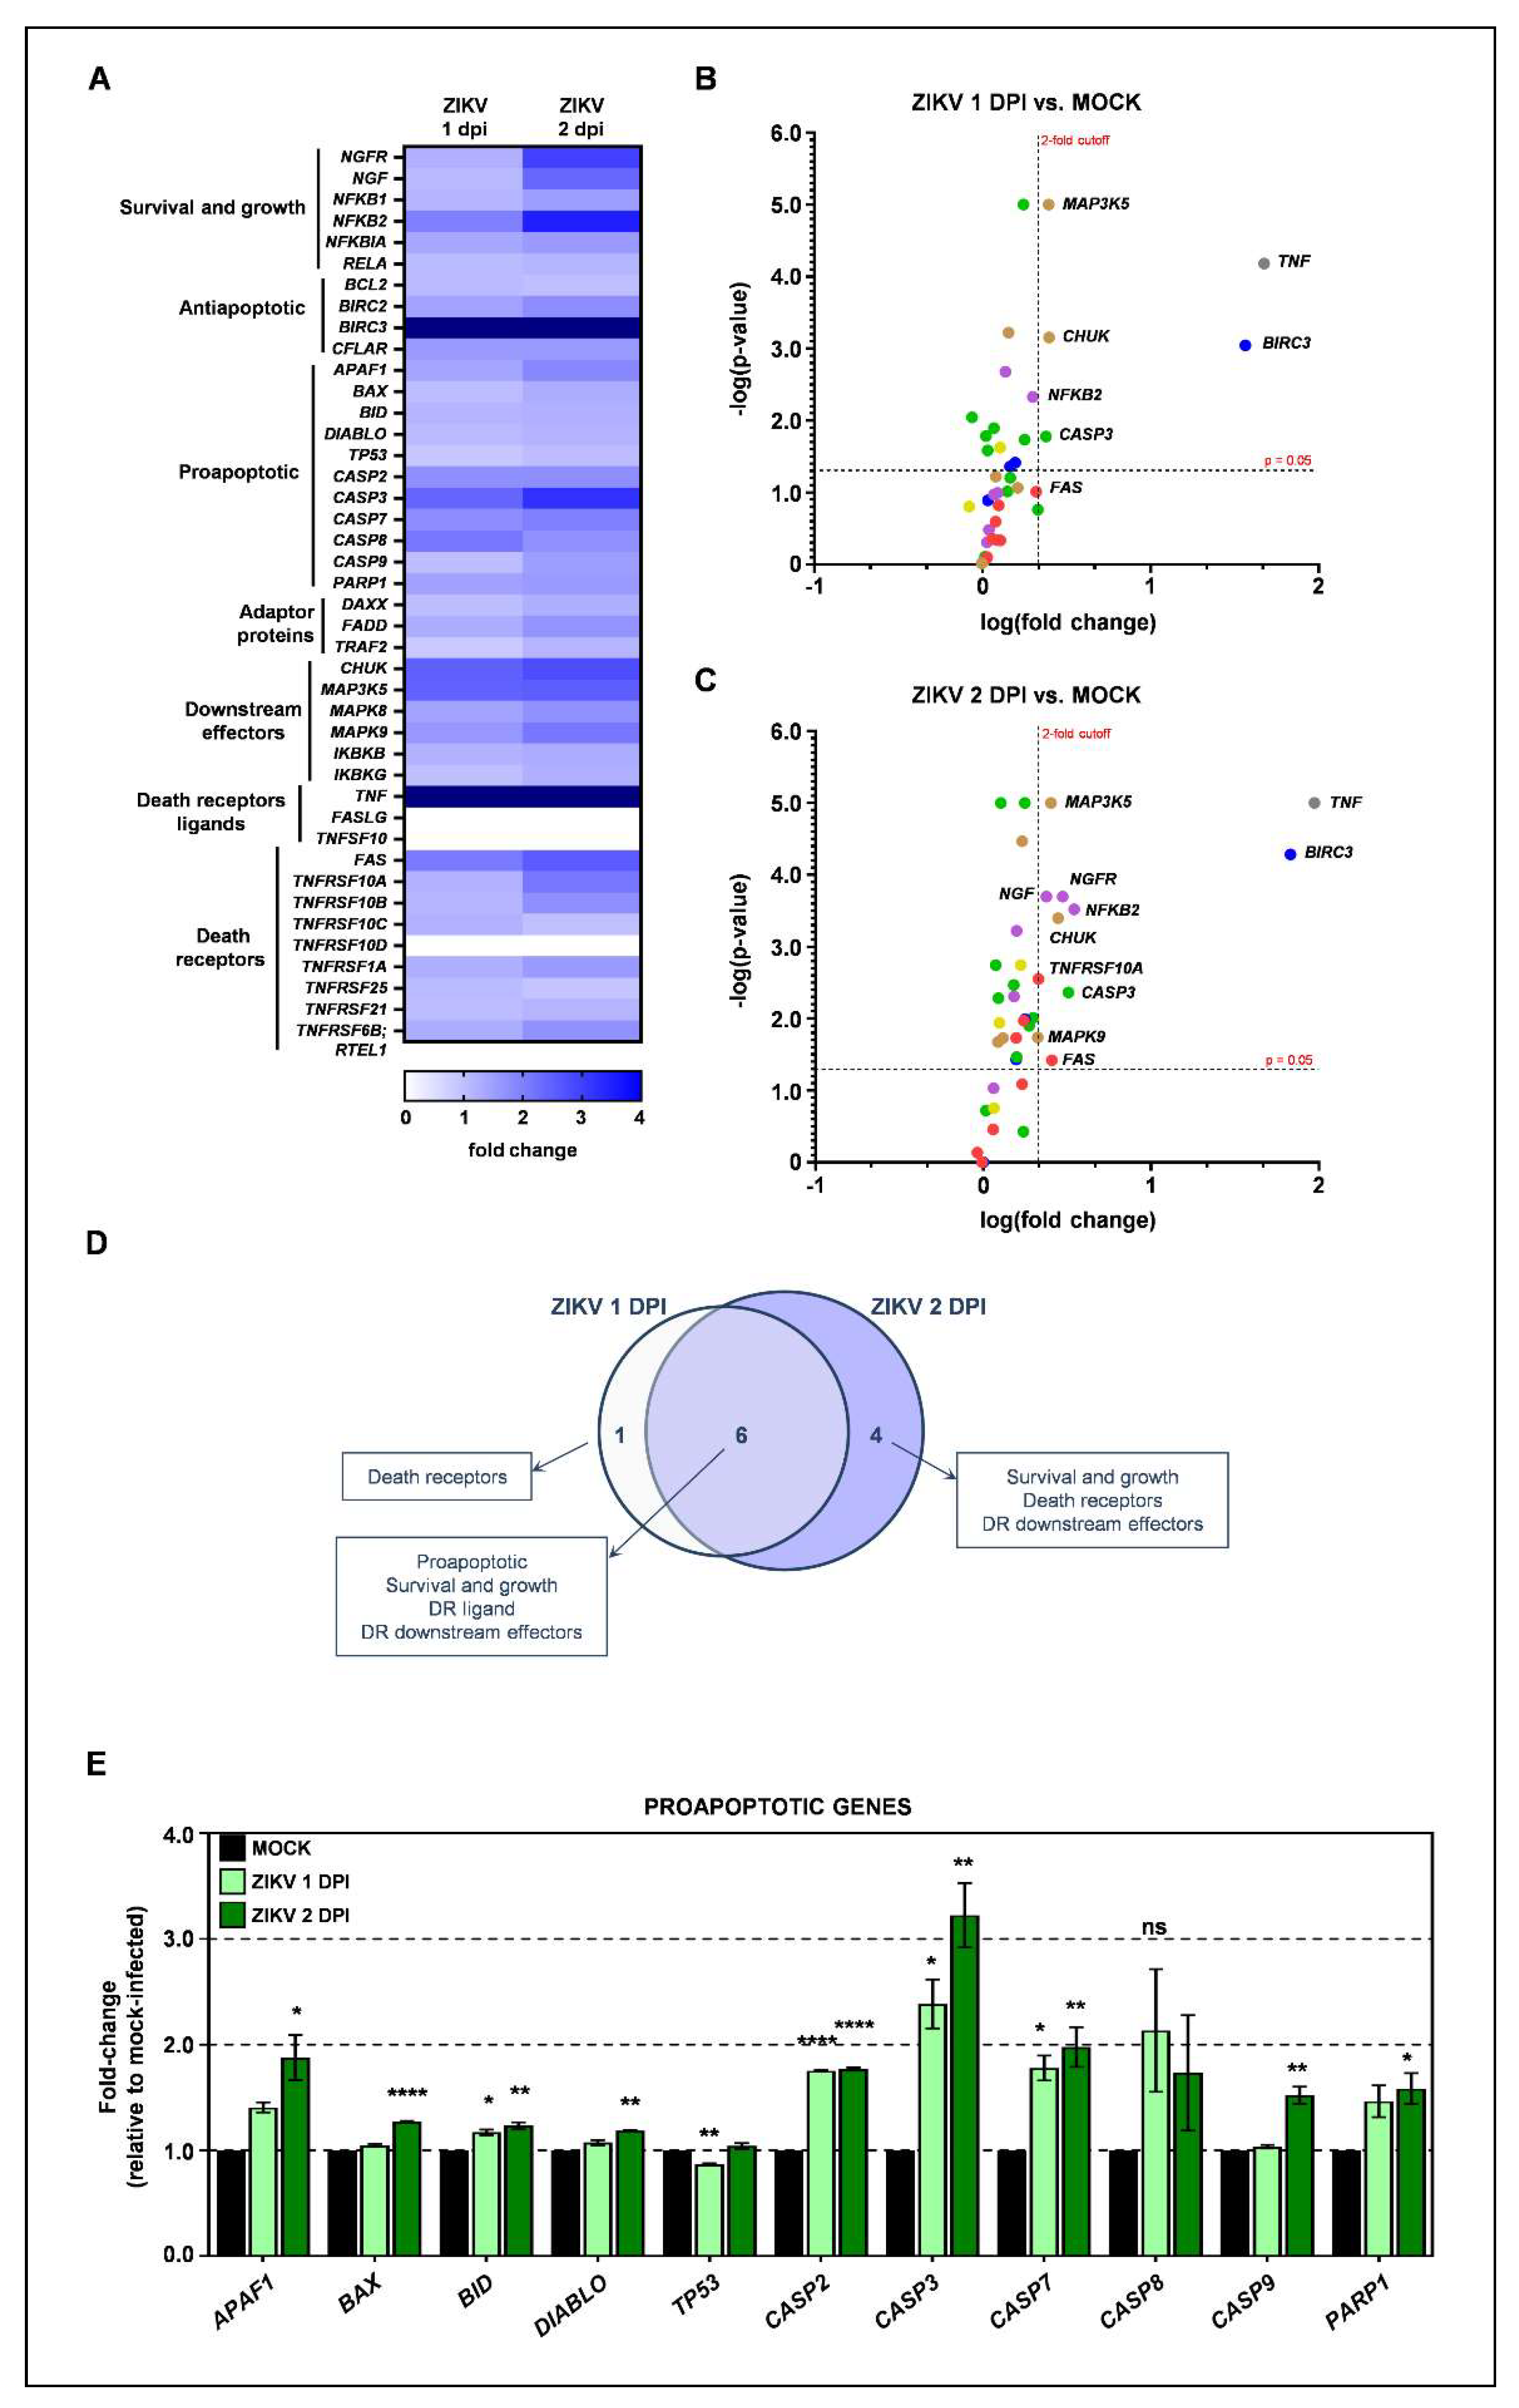
3.2. ZIKV Infection Triggers Intrinsic Apoptotic Pathway
3.3. NAC Treatment Is Not Able to Reverse Cell Death in SH-SY5Y Cells Infected with ZIKV
4. Discussion
Supplementary Materials
Author Contributions
Funding
Institutional Review Board Statement
Informed Consent Statement
Data Availability Statement
Acknowledgments
Conflicts of Interest
References
- Pierson, T.C.; Diamond, M.S. The Emergence of Zika Virus and Its New Clinical Syndromes. Nature 2018, 560, 573–581. [Google Scholar] [CrossRef]
- Liu, J.; Li, Q.; Li, X.; Qiu, Z.; Li, A.; Liang, W.; Chen, H.; Cai, X.; Chen, X.; Duan, X.; et al. Zika Virus Envelope Protein Induces G2/M Cell Cycle Arrest and Apoptosis via an Intrinsic Cell Death Signaling Pathway in Neuroendocrine PC12 Cells. Int. J. Biol. Sci. 2018, 14, 1099–1108. [Google Scholar] [CrossRef]
- Gabriel, E.; Ramani, A.; Karow, U.; Gottardo, M.; Natarajan, K.; Gooi, L.M.; Goranci-Buzhala, G.; Krut, O.; Peters, F.; Nikolic, M.; et al. Recent Zika Virus Isolates Induce Premature Differentiation of Neural Progenitors in Human Brain Organoids. Cell Stem Cell 2017, 20, 397–406. [Google Scholar] [CrossRef] [Green Version]
- Rosa-Fernandes, L.; Cugola, F.R.; Russo, F.B.; Kawahara, R.; de Melo Freire, C.C.; Leite, P.E.C.; Bassi Stern, A.C.; Angeli, C.B.; de Oliveira, D.B.L.; Melo, S.R.; et al. Zika Virus Impairs Neurogenesis and Synaptogenesis Pathways in Human Neural Stem Cells and Neurons. Front. Cell. Neurosci. 2019, 13, 64. [Google Scholar] [CrossRef]
- Russo, F.B.; Jungmann, P.; Beltrao-Braga, P.C.B. Zika Infection and the Development of Neurological Defects. Cell. Microbiol. 2017, 19, e12744. [Google Scholar] [CrossRef] [PubMed] [Green Version]
- D’Arcy, M.S. Cell Death: A Review of the Major Forms of Apoptosis, Necrosis and Autophagy. Cell Biol. Int. 2019, 43, 582–592. [Google Scholar] [CrossRef] [PubMed]
- Elmore, S. Apoptosis: A Review of Programmed Cell Death. Toxicol. Pathol. 2007, 35, 495–516. [Google Scholar] [CrossRef] [PubMed]
- Galluzzi, L.; Vitale, I.; Abrams, J.M.; Alnemri, E.S.; Baehrecke, E.H.; Blagosklonny, M.V.; Dawson, T.M.; Dawson, V.L.; El-Deiry, W.S.; Fulda, S.; et al. Molecular Definitions of Cell Death Subroutines: Recommendations of the Nomenclature Committee on Cell Death 2012. Cell Death Differ. 2012, 19, 107–120. [Google Scholar] [CrossRef]
- Bras, M.; Queenan, B.; Susin, S.A. Programmed Cell Death via Mitochondria: Different Modes of Dying. Biochem. Biokhimiia 2005, 70, 231–239. [Google Scholar] [CrossRef] [PubMed]
- Han, X.; Wang, J.; Yang, Y.; Qu, S.; Wan, F.; Zhang, Z.; Wang, R.; Li, G.; Cong, H. Zika Virus Infection Induced Apoptosis by Modulating the Recruitment and Activation of Proapoptotic Protein Bax. J. Virol. 2021, 95, e01445-20. [Google Scholar] [CrossRef]
- Di Meo, S.; Reed, T.T.; Venditti, P.; Victor, V.M. Role of ROS and RNS Sources in Physiological and Pathological Conditions. Oxidative Med. Cell. Longev. 2016, 2016, 1245049. [Google Scholar] [CrossRef]
- Srivastava, R.; Kalita, J.; Khan, M.Y.; Misra, U.K. Free Radical Generation by Neurons in Rat Model of Japanese Encephalitis. Neurochem. Res. 2009, 34, 2141–2146. [Google Scholar] [CrossRef] [PubMed]
- Olagnier, D.; Peri, S.; Steel, C.; van Montfoort, N.; Chiang, C.; Beljanski, V.; Slifker, M.; He, Z.; Nichols, C.N.; Lin, R.; et al. Cellular Oxidative Stress Response Controls the Antiviral and Apoptotic Programs in Dengue Virus-Infected Dendritic Cells. PLoS Pathog. 2014, 10, e1004566. [Google Scholar] [CrossRef] [PubMed]
- Diteepeng, T.; Khongwichit, S.; Paemanee, A.; Roytrakul, S.; Smith, D.R. Proteomic Analysis of Monkey Kidney LLC-MK2 Cells Infected with a Thai Strain Zika Virus. Arch. Virol. 2019, 164, 725–737. [Google Scholar] [CrossRef]
- Ledur, P.F.; Karmirian, K.; Pedrosa, C.S.G.; Souza, L.R.Q.; Assis-de-Lemos, G.; Martins, T.M.; Ferreira, J.D.C.C.G.; Reis, G.F.D.A.; Silva, E.S.; Silva, D.; et al. Zika Virus Infection Leads to Mitochondrial Failure, Oxidative Stress and DNA Damage in Human IPSC-Derived Astrocytes. Sci. Rep. 2020, 10, 1218. [Google Scholar] [CrossRef] [PubMed] [Green Version]
- Kovalevich, J.; Langford, D. Considerations for the Use of SH-SY5Y Neuroblastoma Cells in Neurobiology. In Neuronal Cell Culture: Methods and Protocols; Amini, S., White, M.K., Eds.; Humana Press: Totowa, NJ, USA, 2013; Volume 1078, pp. 9–21. [Google Scholar] [CrossRef] [Green Version]
- Donald, C.L.; Brennan, B.; Cumberworth, S.L.; Rezelj, V.V.; Clark, J.J.; Cordeiro, M.T.; Freitas de Oliveira França, R.; Pena, L.J.; Wilkie, G.S.; Da Silva Filipe, A.; et al. Full Genome Sequence and SfRNA Interferon Antagonist Activity of Zika Virus from Recife, Brazil. PLoS Negl. Trop. Dis. 2016, 10, 1–20. [Google Scholar] [CrossRef]
- Lanciotti, R.S.; Kosoy, O.L.; Laven, J.J.; Velez, J.O.; Lambert, A.J.; Johnson, A.J.; Stanfield, S.M.; Duffy, M.R. Genetic and Serologic Properties of Zika Virus Associated with an Epidemic, Yap State, Micronesia. Emerg. Infect. Dis. 2007, 14, 1232–1239. [Google Scholar] [CrossRef]
- Ferraris, P.; Cochet, M.; Hamel, R.; Gladwyn-Ng, I.; Alfano, C.; Diop, F.; Garcia, D.; Talignani, L.; Montero-Menei, C.N.; Nougairède, A.; et al. Zika Virus Differentially Infects Human Neural Progenitor Cells According to Their State of Differentiation and Dysregulates Neurogenesis through the Notch Pathway. Emerg. Microbes Infect. 2019, 8, 1003–1016. [Google Scholar] [CrossRef]
- Li, C.; Xu, D.; Ye, Q.; Hong, S.; Jiang, Y.; Liu, X.; Zhang, N.; Shi, L.; Qin, C.-F.; Xu, Z. Zika Virus Disrupts Neural Progenitor Development and Leads to Microcephaly in Mice. Cell Stem Cell 2016, 19, 120–126. [Google Scholar] [CrossRef] [Green Version]
- Tang, H.; Hammack, C.; Ogden, S.C.; Wen, Z.; Qian, X.; Li, Y.; Yao, B.; Shin, J.; Zhang, F.; Lee, E.M.; et al. Zika Virus Infects Human Cortical Neural Progenitors and Attenuates Their Growth. Cell Stem Cell 2016, 18, 587–590. [Google Scholar] [CrossRef] [Green Version]
- Deree, J.; Martins, J.O.; Melbostad, H.; Loomis, W.H.; Coimbra, R. Insights into the Regulation of TNF-Alpha Production in Human Mononuclear Cells: The Effects of Non-Specific Phosphodiesterase Inhibition. Clinics 2008, 63, 321–328. [Google Scholar] [CrossRef] [PubMed] [Green Version]
- Muchhala, S.K.; Benzeroual, K.E. Pentoxifylline Suppressed LPS-Induced Inflammatory and Apoptotic Signaling in Neuronal Cells. Adv. Biosci. Biotechnol. 2012, 3, 731–739. [Google Scholar] [CrossRef] [Green Version]
- Gupta, K.J.; Igamberdiev, A.U. Reactive Nitrogen Species in Mitochondria and Their Implications in Plant Energy Status and Hypoxic Stress Tolerance. Front. Plant Sci. 2016, 7, 369. [Google Scholar] [CrossRef] [PubMed] [Green Version]
- Newsholme, P.; Haber, E.P.; Hirabara, S.M.; Rebelato, E.L.O.; Procopio, J.; Morgan, D.; Oliveira-Emilio, H.C.; Carpinelli, A.; Curi, R. Diabetes Associated Cell Stress and Dysfunction: Role of Mitochondrial and Non-Mitochondrial ROS Production and Activity. J. Physiol. 2007, 583, 9–24. [Google Scholar] [CrossRef]
- Hastings, A.K.; Hastings, K.; Uraki, R.; Hwang, J.; Gaitsch, H.; Dhaliwal, K.; Williamson, E.; Fikrig, E. Loss of the TAM Receptor Axl Ameliorates Severe Zika Virus Pathogenesis and Reduces Apoptosis in Microglia. iScience 2019, 13, 339–350. [Google Scholar] [CrossRef] [Green Version]
- Monel, B.; Compton, A.A.; Bruel, T.; Amraoui, S.; Burlaud-Gaillard, J.; Roy, N.; Guivel-Benhassine, F.; Porrot, F.; Génin, P.; Meertens, L.; et al. Zika Virus Induces Massive Cytoplasmic Vacuolization and Paraptosis-like Death in Infected Cells. EMBO J. 2017, 36, 1653–1668. [Google Scholar] [CrossRef]
- Souza, B.S.F.; Sampaio, G.L.A.; Pereira, C.S.; Campos, G.S.; Sardi, S.I.; Freitas, L.A.R.; Figueira, C.P.; Paredes, B.D.; Nonaka, C.K.V.; Azevedo, C.M.; et al. Zika Virus Infection Induces Mitosis Abnormalities and Apoptotic Cell Death of Human Neural Progenitor Cells. Sci. Rep. 2016, 6, 39775. [Google Scholar] [CrossRef]
- Zhang, F.; Hammack, C.; Ogden, S.C.; Cheng, Y.; Lee, E.M.; Wen, Z.; Qian, X.; Nguyen, H.N.; Li, Y.; Yao, B.; et al. Molecular Signatures Associated with ZIKV Exposure in Human Cortical Neural Progenitors. Nucleic Acids Res. 2016, 44, 8610–8620. [Google Scholar] [CrossRef]
- Chatel-Chaix, L.; Cortese, M.; Romero-Brey, I.; Bender, S.; Neufeldt, C.J.; Fischl, W.; Scaturro, P.; Schieber, N.; Schwab, Y.; Fischer, B.; et al. Dengue Virus Perturbs Mitochondrial Morphodynamics to Dampen Innate Immune Responses. Cell Host Microbe 2016, 20, 342–356. [Google Scholar] [CrossRef] [Green Version]
- Waterhouse, N.J.; Goldstein, J.C.; von Ahsen, O.; Schuler, M.; Newmeyer, D.D.; Green, D.R. Cytochrome c Maintains Mitochondrial Transmembrane Potential and ATP Generation after Outer Mitochondrial Membrane Permeabilization during the Apoptotic Process. J. Cell Biol. 2001, 153, 319–328. [Google Scholar] [CrossRef]
- Yang, T.-C.; Shiu, S.-L.; Chuang, P.-H.; Lin, Y.-J.; Wan, L.; Lan, Y.-C.; Lin, C.-W. Japanese Encephalitis Virus NS2B-NS3 Protease Induces Caspase 3 Activation and Mitochondria-Mediated Apoptosis in Human Medulloblastoma Cells. Virus Res. 2009, 143, 77–85. [Google Scholar] [CrossRef] [PubMed]
- Jan, J.T.; Chen, B.H.; Ma, S.H.; Liu, C.I.; Tsai, H.P.; Wu, H.C.; Jiang, S.-Y.; Yang, K.-D.; Shaio, M.-F. Potential Dengue Virus-Triggered Apoptotic Pathway in Human Neuroblastoma Cells: Arachidonic Acid, Superoxide Anion, and NF-KappaB Are Sequentially Involved. J. Virol. 2000, 74, 8680–8691. [Google Scholar] [CrossRef] [PubMed] [Green Version]
- Kleinschmidt, M.C.; Michaelis, M.; Ogbomo, H.; Doerr, H.-W.; Cinatl, J. Inhibition of Apoptosis Prevents West Nile Virus Induced Cell Death. BMC Microbiol. 2007, 7, 49. [Google Scholar] [CrossRef] [PubMed] [Green Version]
- Bell, J.H.; Herrera, A.H.; Li, Y.; Walcheck, B. Role of ADAM17 in the Ectodomain Shedding of TNF- and Its Receptors by Neutrophils and Macrophages. J. Leukoc. Biol. 2007, 82, 173–176. [Google Scholar] [CrossRef] [PubMed]
- Clark, A. Post-Transcriptional Regulation of pro-Inflammatory Gene Expression. Arthritis Res. 2000, 2, 8–10. [Google Scholar] [CrossRef] [Green Version]
- Anderson, P. Post-Transcriptional Regulation of Tumour Necrosis Factor α Production. Ann. Rheum. Dis. 2000, 59 (Suppl. 1), 5–7. [Google Scholar] [CrossRef] [PubMed] [Green Version]
- Stamou, P.; Kontoyiannis, D.L. Posttranscriptional Regulation of TNF MRNA: A Paradigm of Signal-Dependent MRNA Utilization and Its Relevance to Pathology. In Current Directions in Autoimmunity; Karger: Basel, Switzerland, 2010; Volume 11, pp. 61–79. [Google Scholar] [CrossRef]
- Crawford, E.K.; Ensor, J.E.; Kalvakolanu, I.; Hasday, J.D. The Role of 3′ Poly(A) Tail Metabolism in Tumor Necrosis Factor-α Regulation. J. Biol. Chem. 1997, 272, 21120–21127. [Google Scholar] [CrossRef] [Green Version]
- Hanners, N.W.; Eitson, J.L.; Usui, N.; Richardson, R.B.; Wexler, E.M.; Konopka, G.; Schoggins, J.W. Western Zika Virus in Human Fetal Neural Progenitors Persists Long Term with Partial Cytopathic and Limited Immunogenic Effects. Cell Rep. 2016, 15, 2315–2322. [Google Scholar] [CrossRef] [PubMed] [Green Version]
- Stefanik, M.; Formanova, P.; Bily, T.; Vancova, M.; Eyer, L.; Palus, M.; Salat, J.; Braconi, C.T.; Zanotto, P.M.d.A.; Gould, E.A.; et al. Characterisation of Zika Virus Infection in Primary Human Astrocytes. BMC Neurosci. 2018, 19, 1–8. [Google Scholar] [CrossRef] [Green Version]
- Olmo, I.G.; Carvalho, T.G.; Costa, V.V.; Alves-Silva, J.; Ferrari, C.Z.; Izidoro-Toledo, T.C.; da Silva, J.F.; Teixeira, A.L.; Souza, D.G.; Marques, J.T.; et al. Zika Virus Promotes Neuronal Cell Death in a Non-Cell Autonomous Manner by Triggering the Release of Neurotoxic Factors. Front. Immunol. 2017, 8, 1016. [Google Scholar] [CrossRef] [Green Version]
- Lima, M.C.; de Mendonca, L.R.; Rezende, A.M.; Carrera, R.M.; Anibal-Silva, C.E.; Demers, M.; D’Aiuto, L.; Wood, J.; Chowdari, K.V.; Griffiths, M.; et al. The Transcriptional and Protein Profile from Human Infected Neuroprogenitor Cells Is Strongly Correlated to Zika Virus Microcephaly Cytokines Phenotype Evidencing a Persistent Inflammation in the CNS. Front. Immunol. 2019, 10, 1928. [Google Scholar] [CrossRef] [Green Version]
- Almeida, L.T.; Ferraz, A.C.; da Silva Caetano, C.C.; da Silva Menegatto, M.B.; dos Santos Pereira Andrade, A.C.; Lima, R.L.S.; Camini, F.C.; Pereira, S.H.; da Silva Pereira, K.Y.; de Mello Silva, B.; et al. Zika Virus Induces Oxidative Stress and Decreases Antioxidant Enzyme Activities in Vitro and in Vivo. Virus Res. 2020, 286, 198084. [Google Scholar] [CrossRef] [PubMed]
- Circu, M.L.; Aw, T.Y. Glutathione and Apoptosis. Free Radic. Res. 2008, 42, 689–706. [Google Scholar] [CrossRef] [PubMed] [Green Version]
- Milkovic, L.; Cipak Gasparovic, A.; Cindric, M.; Mouthuy, P.A.; Zarkovic, N. Short Overview of ROS as Cell Function Regulators and Their Implications in Therapy Concepts. Cells 2019, 8, 793. [Google Scholar] [CrossRef] [PubMed] [Green Version]
- Basu, M.; Courtney, S.C.; Brinton, M.A. Arsenite-Induced Stress Granule Formation Is Inhibited by Elevated Levels of Reduced Glutathione in West Nile Virus-Infected Cells. PLoS Pathog. 2017, 13, e1006240. [Google Scholar] [CrossRef]
- Blázquez, A.B.; Martín-Acebes, M.A.; Poderoso, T.; Saiz, J.C. Relevance of Oxidative Stress in Inhibition of Eif2 Alpha Phosphorylation and Stress Granules Formation during Usutu Virus Infection. PLoS Negl. Trop. Dis. 2021, 15, 1–20. [Google Scholar] [CrossRef]


Publisher’s Note: MDPI stays neutral with regard to jurisdictional claims in published maps and institutional affiliations. |
© 2021 by the authors. Licensee MDPI, Basel, Switzerland. This article is an open access article distributed under the terms and conditions of the Creative Commons Attribution (CC BY) license (https://creativecommons.org/licenses/by/4.0/).
Share and Cite
Mendonça-Vieira, L.R.d.; Aníbal-Silva, C.E.; Menezes-Neto, A.; Azevedo, E.d.A.N.; Zanluqui, N.G.; Peron, J.P.S.; Franca, R.F.d.O. Reactive Oxygen Species (ROS) Are Not a Key Determinant for Zika Virus-Induced Apoptosis in SH-SY5Y Neuroblastoma Cells. Viruses 2021, 13, 2111. https://doi.org/10.3390/v13112111
Mendonça-Vieira LRd, Aníbal-Silva CE, Menezes-Neto A, Azevedo EdAN, Zanluqui NG, Peron JPS, Franca RFdO. Reactive Oxygen Species (ROS) Are Not a Key Determinant for Zika Virus-Induced Apoptosis in SH-SY5Y Neuroblastoma Cells. Viruses. 2021; 13(11):2111. https://doi.org/10.3390/v13112111
Chicago/Turabian StyleMendonça-Vieira, Leila Rodrigues de, Conceição Elidianne Aníbal-Silva, Armando Menezes-Neto, Elisa de Almeida Neves Azevedo, Nágela Ghabdan Zanluqui, Jean Pierre Schatzmann Peron, and Rafael Freitas de Oliveira Franca. 2021. "Reactive Oxygen Species (ROS) Are Not a Key Determinant for Zika Virus-Induced Apoptosis in SH-SY5Y Neuroblastoma Cells" Viruses 13, no. 11: 2111. https://doi.org/10.3390/v13112111