Quantitative FRET-FLIM-BlaM to Assess the Extent of HIV-1 Fusion in Live Cells


Abstract
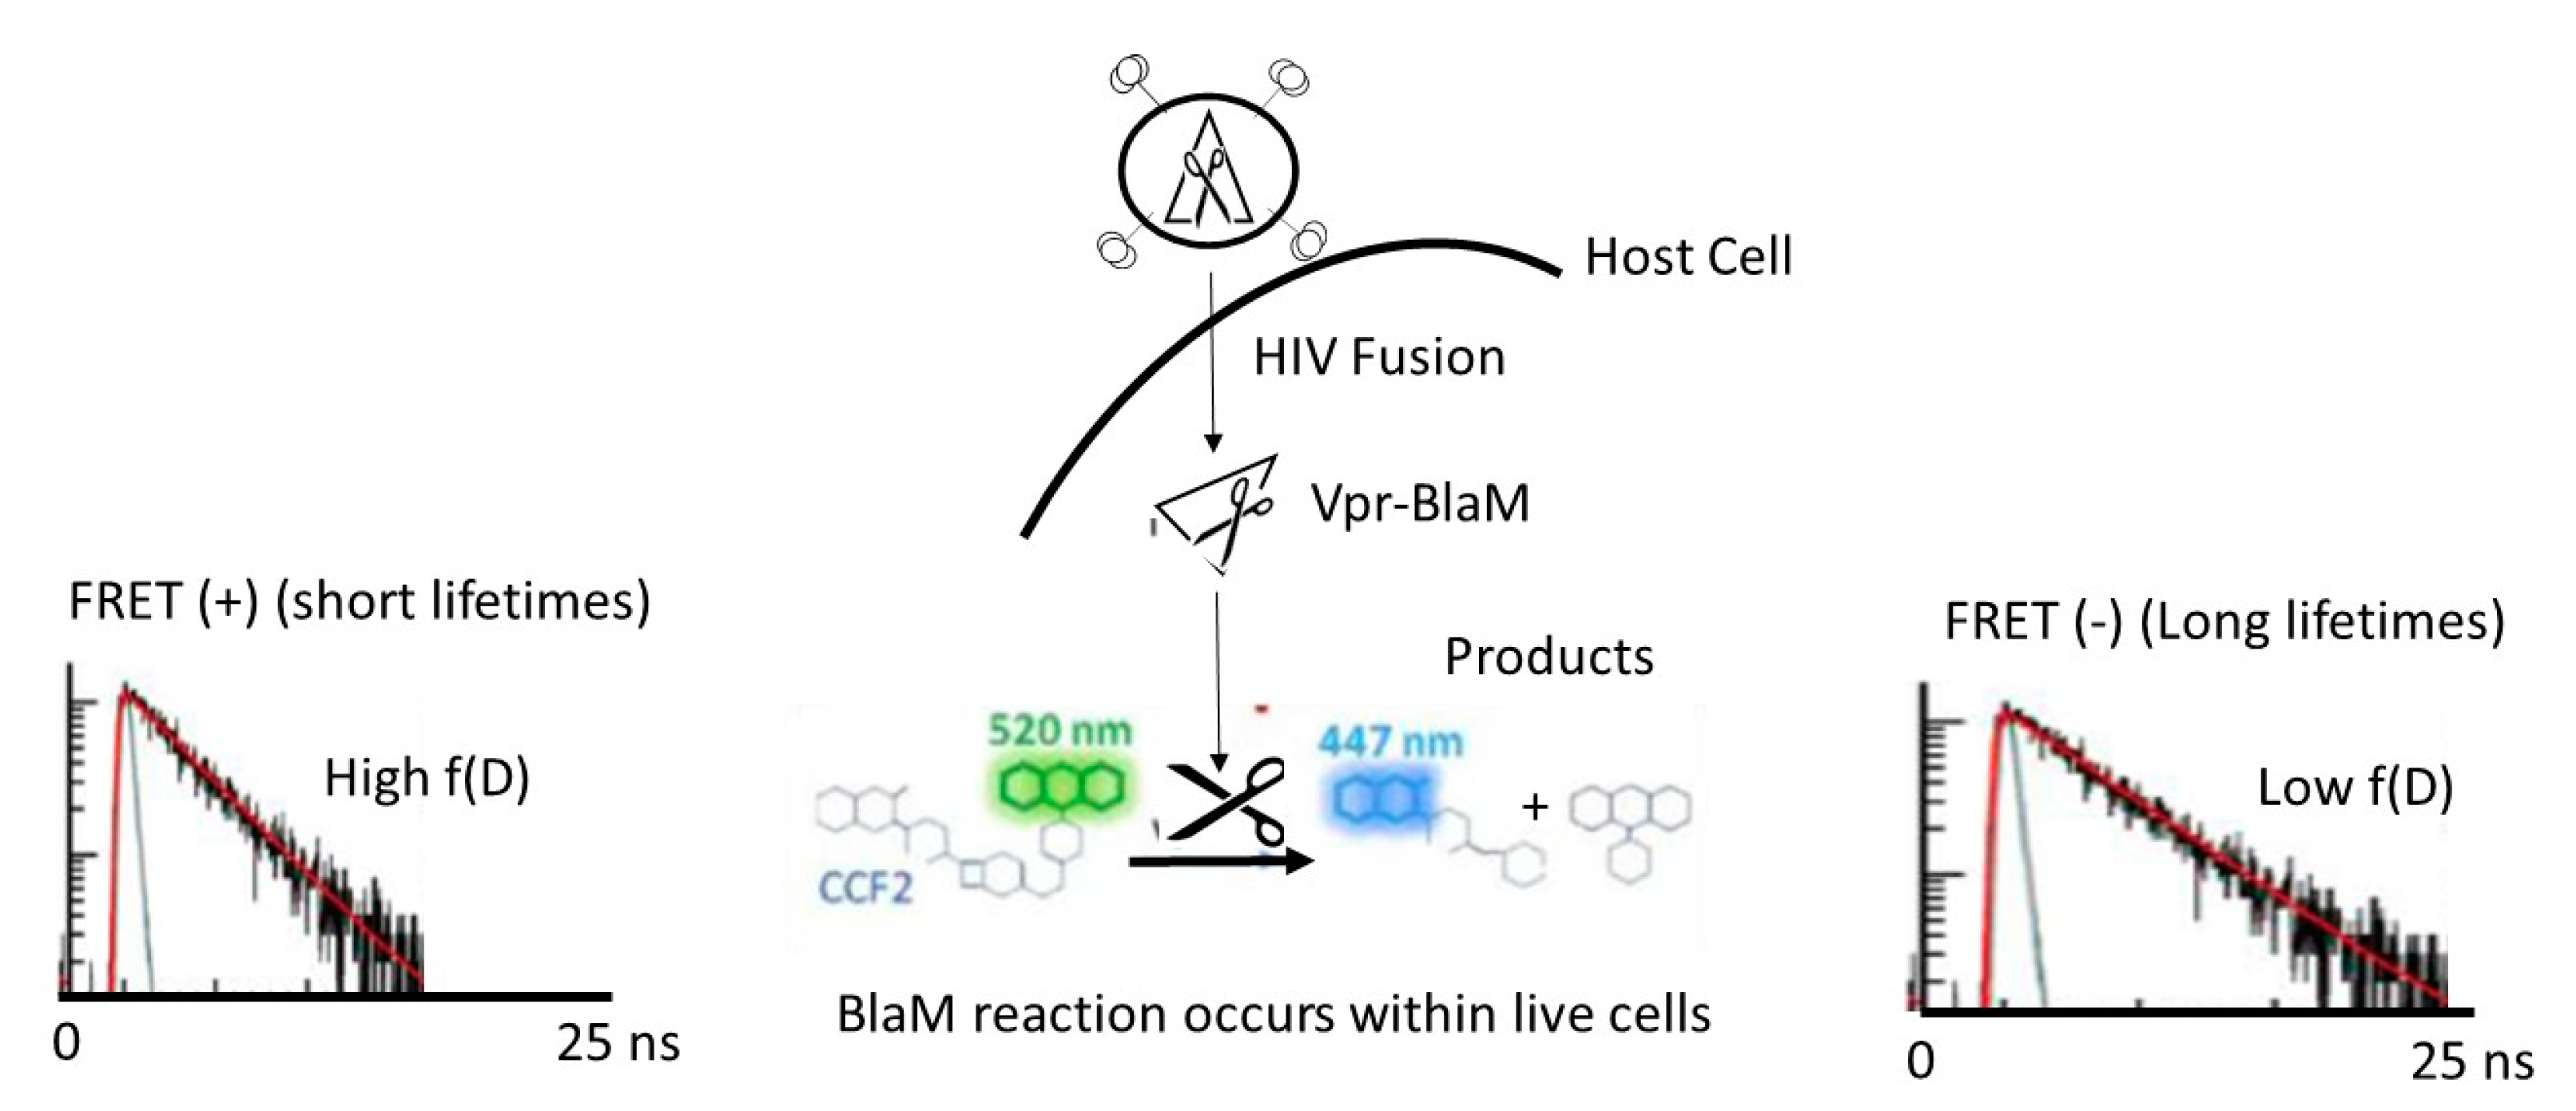
:1. Introduction
2. Materials and Methods
2.1. Cell Culture
2.2. Plasmids
2.3. Virus Production
2.4. Viral Titer
2.5. BlaM Assay
2.6. BlaM Assay Spectral and Fluorescence Lifetime Image Acquisition
2.7. BlaM Assay Spectral and Fluorescence Lifetime Image Analysis
2.8. Statistical Analysis
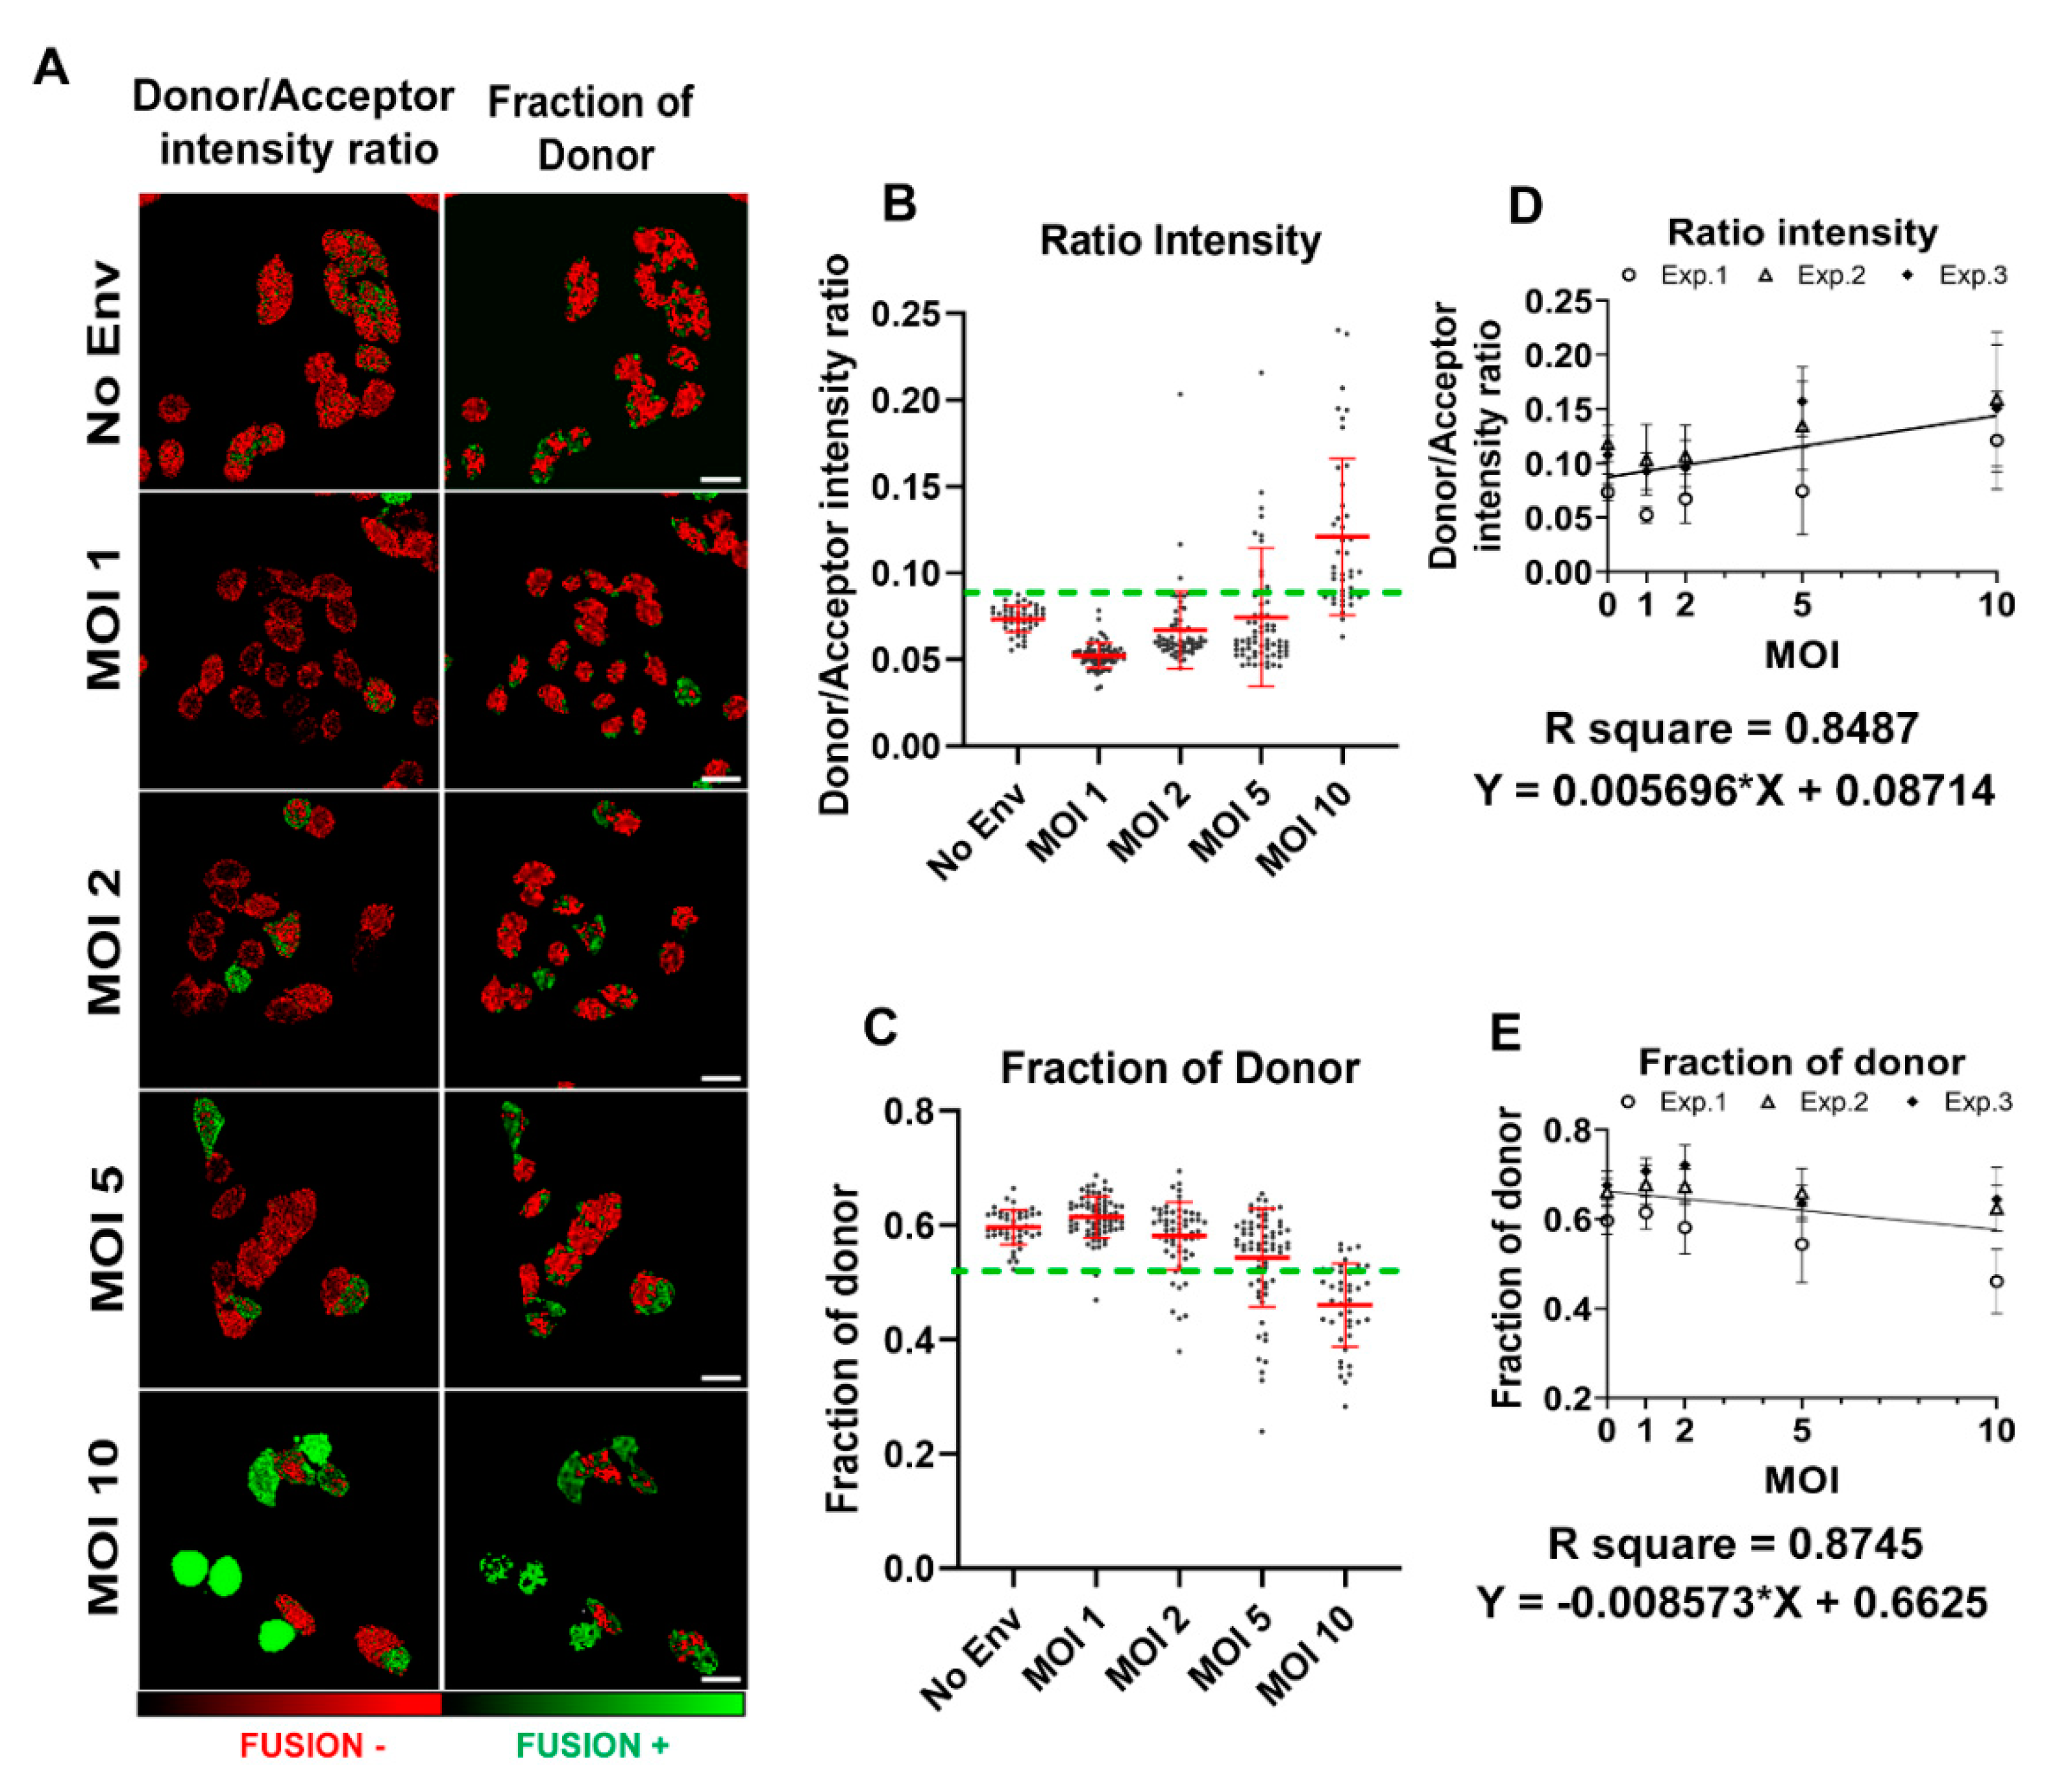
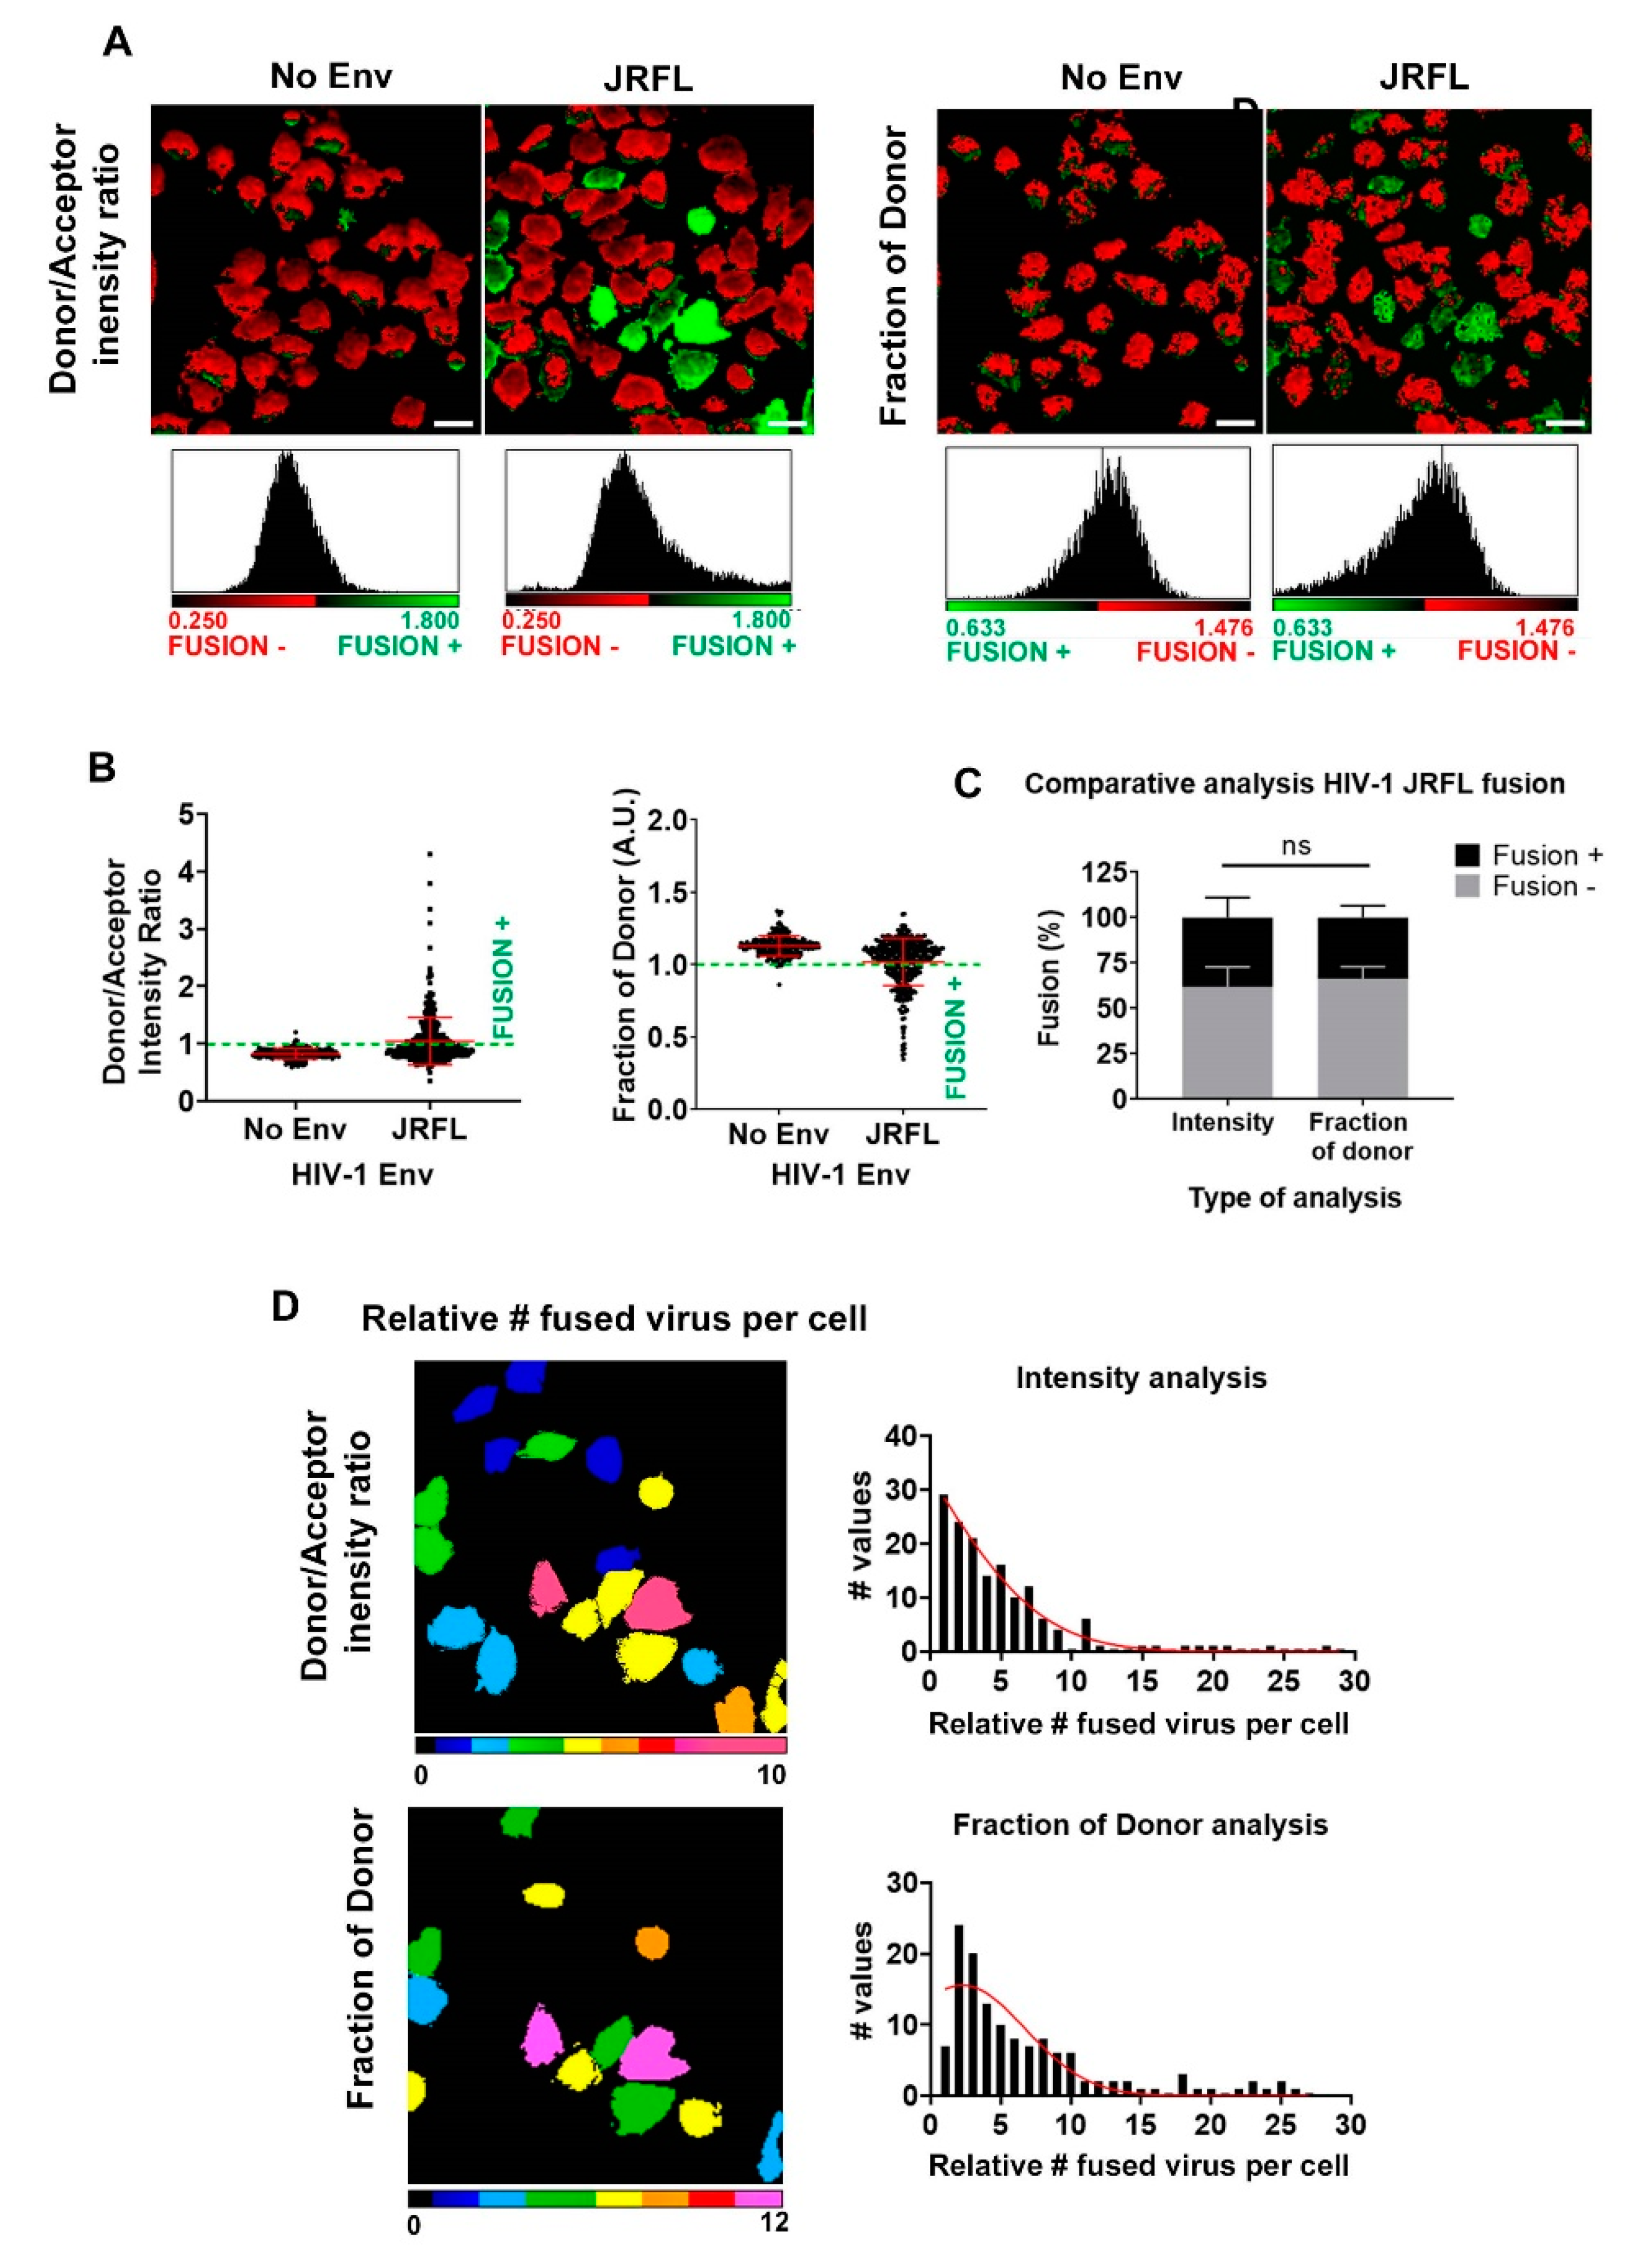
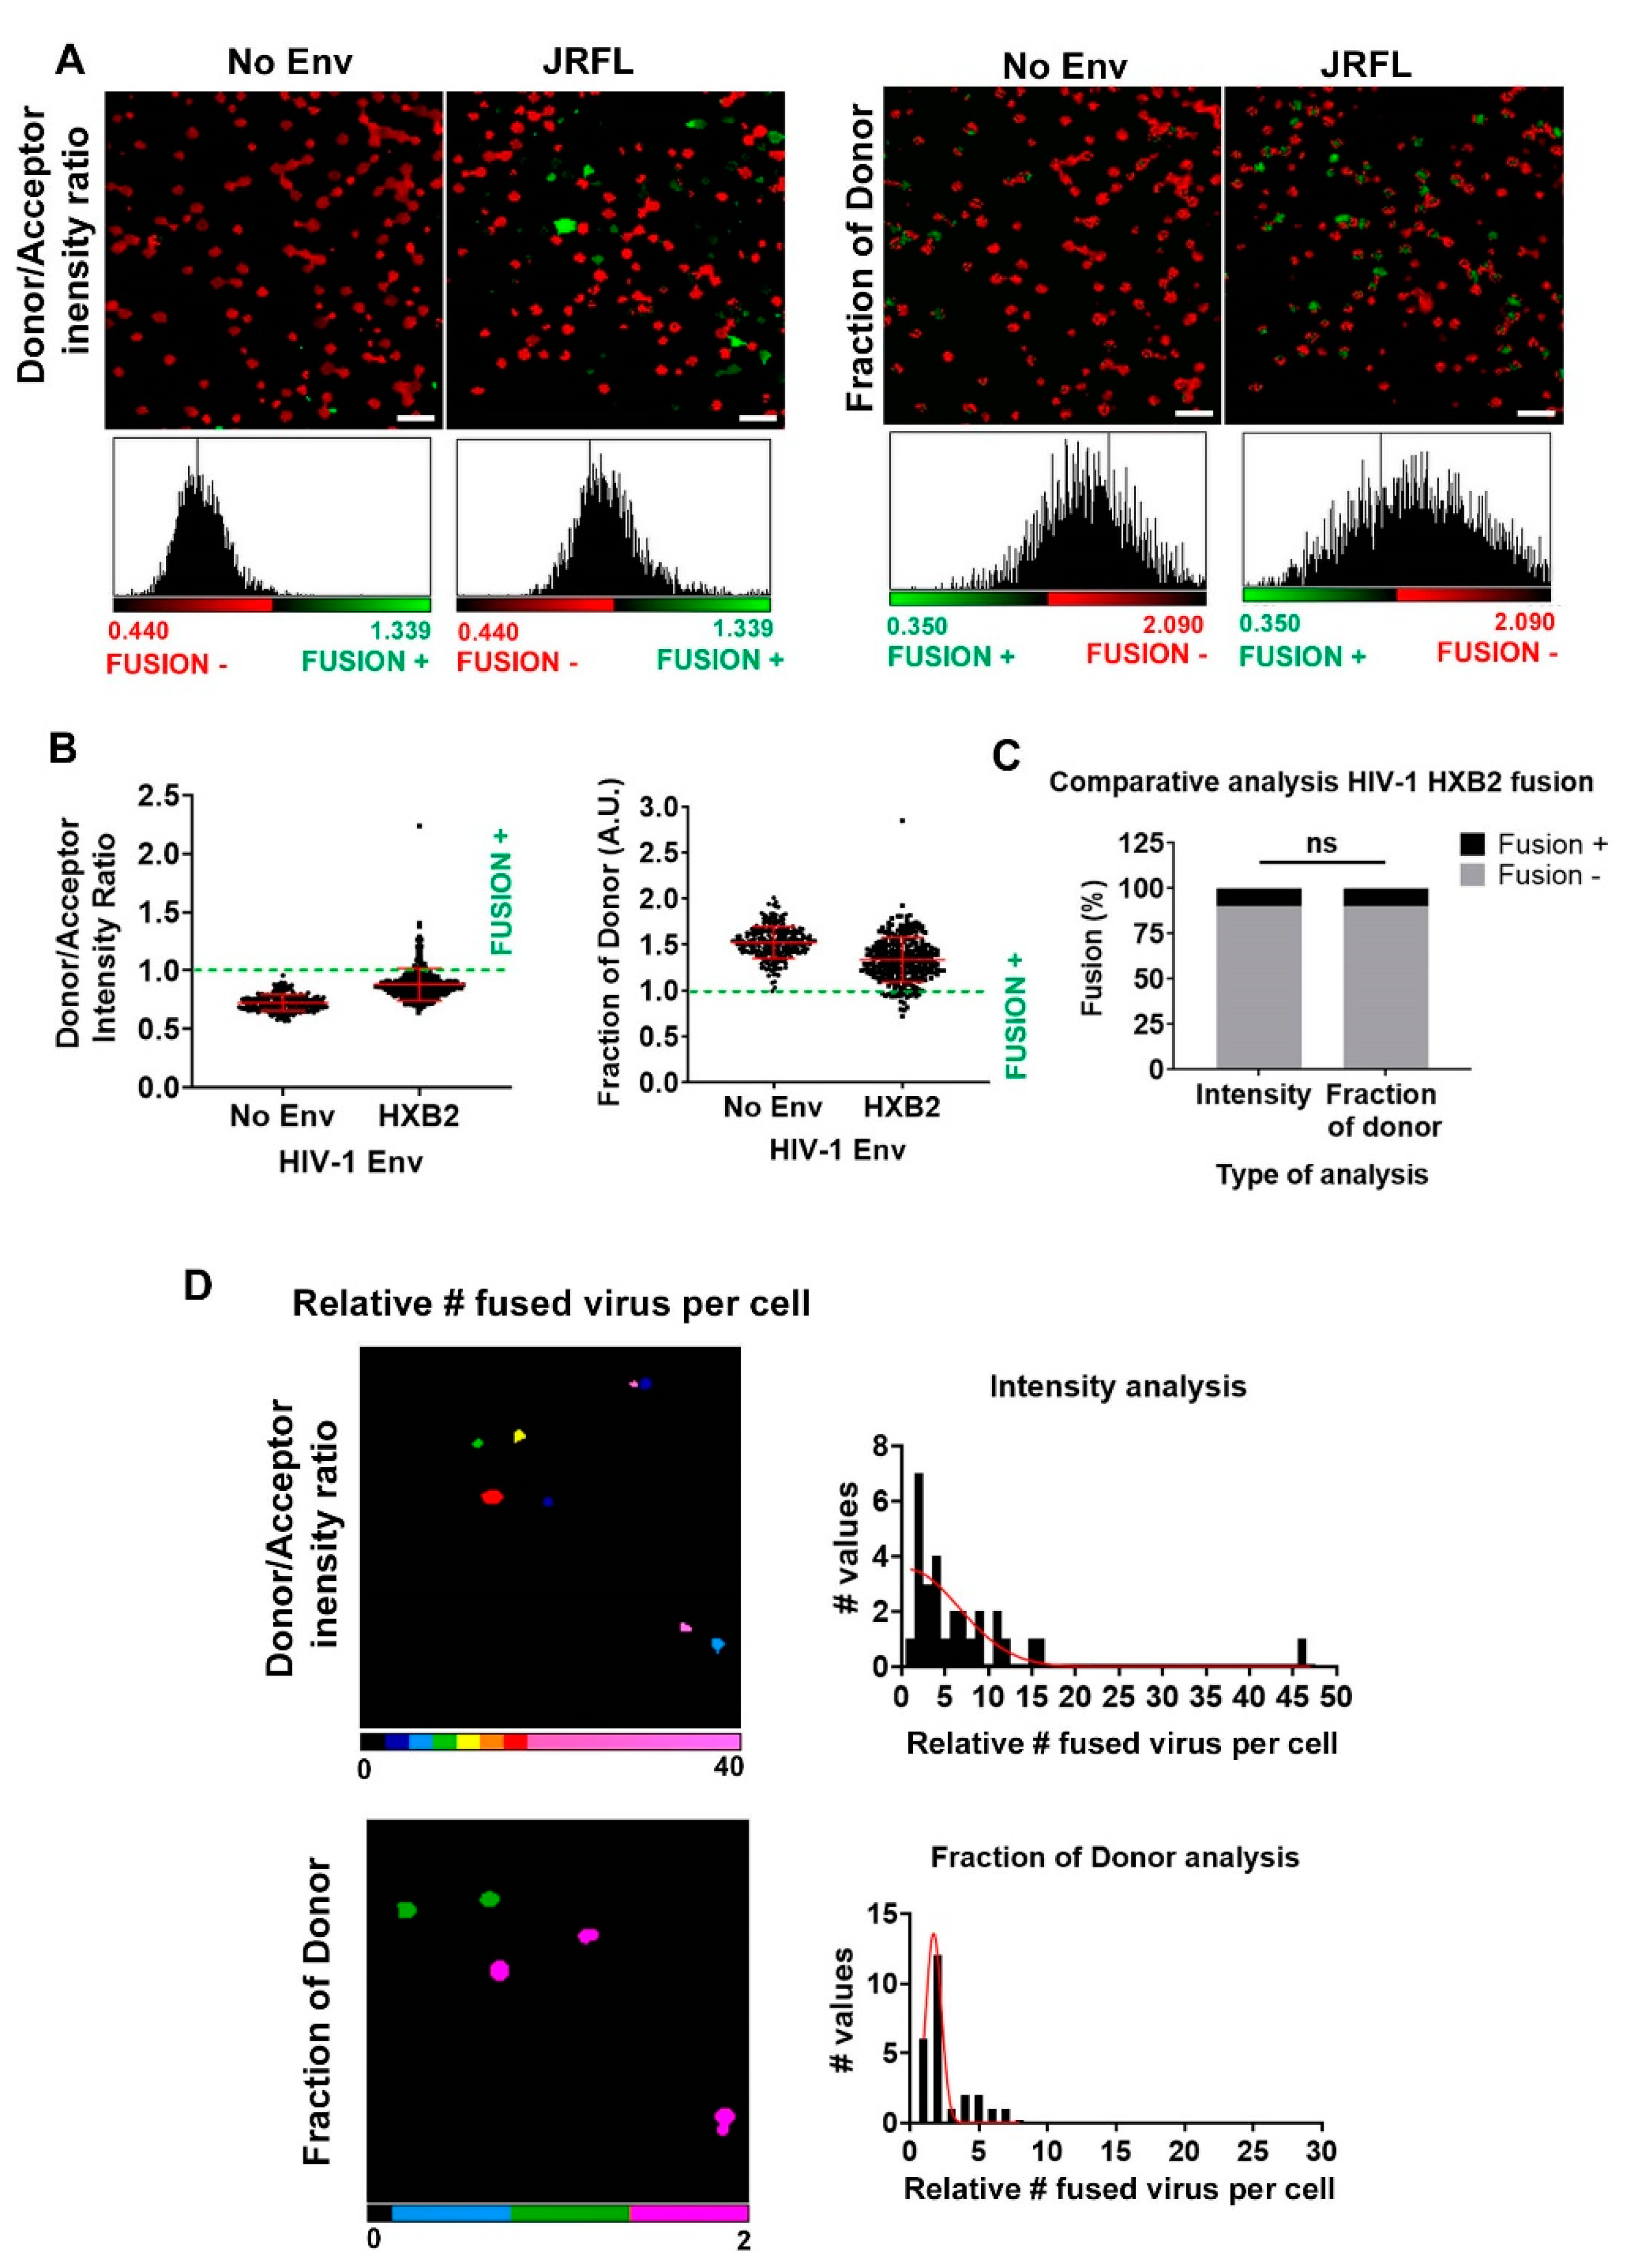
3. Results
3.1. BlaM Calibration Curve
3.2. Single Cell FRET-FLIM-BlaM: Recovering the Relative Number of Fused Virus Per Cell in TZM-bl
3.3. Single Cell FRET-FLIM-BlaM: Recovering the Relative Number of Fused Virus Per Cell in Primary T Cells
4. Conclusions
Author Contributions
Funding
Acknowledgments
Conflicts of Interest
References
- Berger, E.A.; Murphy, P.M.; Farber, J.M. Chemokine receptors as HIV-1 coreceptors: Roles in viral entry, tropism, and disease. Annu. Rev. Immunol. 1999, 17, 657–700. [Google Scholar] [CrossRef] [PubMed]
- Jones, D.M.; Padilla-Parra, S. The β-lactamase assay: Harnessing a FRET biosensor to analyse viral fusion mechanisms. Sensors 2016, 16, 950. [Google Scholar] [CrossRef] [PubMed] [Green Version]
- Padilla-Parra, S.; Marin, M.; Gahlaut, N.; Suter, R.; Kondo, N.; Melikyan, G.B. Fusion of Mature HIV-1 Particles Leads to Complete Release of a Gag-GFP-Based Content Marker and Raises the Intraviral pH. PLoS ONE 2013, 8. [Google Scholar] [CrossRef] [PubMed] [Green Version]
- Jones, D.M.; Padilla-Parra, S. Imaging real-time HIV-1 virion fusion with FRET-based biosensors. Sci. Rep. 2015, 5. [Google Scholar] [CrossRef] [PubMed] [Green Version]
- Padilla-Parra, S.; Matos, P.M.; Kondo, N.; Marin, M.; Santos, N.C.; Melikyan, G.B. Quantitative imaging of endosome acidification and single retrovirus fusion with distinct pools of early endosomes. Proc. Natl. Acad. Sci. USA 2012, 109, 17627–17632. [Google Scholar] [CrossRef] [PubMed] [Green Version]
- Sun, E.; He, J.; Zhuang, X.W. Live cell imaging of viral entry. Curr. Opin. Virol. 2013, 3, 34–43. [Google Scholar] [CrossRef]
- Miyauchi, K.; Kim, Y.; Latinovic, O.; Morozov, V.; Melikyan, G.B. HIV Enters Cells via Endocytosis and Dynamin-Dependent Fusion with Endosomes. Cell 2009, 137, 433–444. [Google Scholar] [CrossRef] [Green Version]
- Cavrois, M.; de Noronha, C.; Greene, W.C. A sensitive and specific enzyme-based assay detecting HIV-1 virion fusion in primary T lymphocytes. Nat. Biotechnol. 2002, 20, 1151–1154. [Google Scholar] [CrossRef]
- Levine, B.L.; Bernstein, W.B.; Connors, M.; Craighead, N.; Lindsten, T.; Thompson, C.B.; June, C.H. Effects of CD28 costimulation on long-term proliferation of CD4(+) T cells in the absence of exogenous feeder cells. J. Immunol. 1997, 159, 5921–5930. [Google Scholar] [PubMed]
- Sodroski, J.; Goh, W.C.; Rosen, C.; Campbell, K.; Haseltine, W.A. Role of the Htlv-III/Lav Envelope in Syncytium Formation and Cytopathicity. Nature 1986, 322, 470–474. [Google Scholar] [CrossRef] [PubMed]
- Zotter, A.; Bauerle, F.; Dey, D.; Kiss, V.; Schreiber, G. Quantifying enzyme activity in living cells. J. Biol. Chem. 2017, 292, 15838–15848. [Google Scholar] [CrossRef] [PubMed] [Green Version]
- Padilla-Parra, S.; Tramier, M. FRET microscopy in the living cell: Different approaches, strengths and weaknesses. Bioessays 2012, 34, 369–376. [Google Scholar] [CrossRef] [PubMed]
- Miyauchi, K.; Kozlov, M.M.; Melikyan, G.B. Early Steps of HIV-1 Fusion Define the Sensitivity to Inhibitory Peptides That Block 6-Helix Bundle Formation. PLoS Pathog. 2009, 5. [Google Scholar] [CrossRef] [PubMed] [Green Version]
- Padilla-Parra, S.; Auduge, N.; Lalucque, H.; Mevel, J.C.; Coppey-Moisan, M.; Tramier, M. Quantitative Comparison of Different Fluorescent Protein Couples for Fast FRET-FLIM Acquisition. Biophys. J. 2009, 97, 2368–2376. [Google Scholar] [CrossRef] [PubMed] [Green Version]
- Russell, R.A.; Chojnacki, J.; Jones, D.M.; Johnson, E.; Do, T.; Eggeling, C.; Padilla-Parra, S.; Sattentau, Q.J. Astrocytes Resist HIV-1 Fusion but Engulf Infected Macrophage Material. Cell Rep. 2017, 18, 1473–1483. [Google Scholar] [CrossRef] [PubMed] [Green Version]
- Wills, Q.F.; Mellado-Gomez, E.; Nolan, R.; Warner, D.; Sharma, E.; Broxholme, J.; Wright, B.; Lockstone, H.; James, W.; Lynch, M.; et al. The nature and nurture of cell heterogeneity: Accounting for macrophage gene-environment interactions with single-cell RNA-Seq. BMC Genom. 2017, 18, 13. [Google Scholar] [CrossRef] [PubMed] [Green Version]
- Iliopoulou, M.; Nolan, R.; Alvarez, L.; Watanabe, Y.; Coomer, C.A.; Jakobsdottir, G.M.; Bowden, T.A.; Padilla-Parra, S. A dynamic three-step mechanism drives the HIV-1 pre-fusion reaction (vol 25, pg 814, 2018). Nat. Struct. Mol. Biol. 2019, 26, 526. [Google Scholar] [CrossRef] [PubMed]


© 2020 by the authors. Licensee MDPI, Basel, Switzerland. This article is an open access article distributed under the terms and conditions of the Creative Commons Attribution (CC BY) license (http://creativecommons.org/licenses/by/4.0/).
Share and Cite
Carlon-Andres, I.; Padilla-Parra, S. Quantitative FRET-FLIM-BlaM to Assess the Extent of HIV-1 Fusion in Live Cells. Viruses 2020, 12, 206. https://doi.org/10.3390/v12020206
Carlon-Andres I, Padilla-Parra S. Quantitative FRET-FLIM-BlaM to Assess the Extent of HIV-1 Fusion in Live Cells. Viruses. 2020; 12(2):206. https://doi.org/10.3390/v12020206
Chicago/Turabian StyleCarlon-Andres, Irene, and Sergi Padilla-Parra. 2020. "Quantitative FRET-FLIM-BlaM to Assess the Extent of HIV-1 Fusion in Live Cells" Viruses 12, no. 2: 206. https://doi.org/10.3390/v12020206