Article

Nutrient Uptake and Utilization by Fragrant Rosewood (Dalbergia odorifera) Seedlings Cultured with Oligosaccharide Addition under Different Lighting Spectra

1
Laboratory of Forestry and Ecology, Zhejiang Institute of Subtropical Crops, Zhejiang Academy of Agricultural Sciences, Wenzhou 325005, China
2
Northeast Institute of Geography and Agroecology, Chinese Academy of Sciences, Changchun 130102, China
*
Authors to whom correspondence should be addressed.
Forests 2018, 9(1), 29; https://doi.org/10.3390/f9010029
Submission received: 15 December 2017 / Revised: 11 January 2018 / Accepted: 11 January 2018 / Published: 13 January 2018
(This article belongs to the Section Forest Ecology and Management)

Abstract

:
Fragrant rosewood (Dalbergia odorifera T.C. Chen) is a highly-valued species suffering from vulnerability due to over-development for wood and medicine. In this study, Fragrant rosewood seedlings were cultured with chitosan oligosaccharide (CO) addition at rates of 0 and 1/800 (v/v) under artificial lightings by 200-W high-pressure sodium (HPS) lamps and 280-W light-emitting diode (LED) panels for a 15 h daily photoperiod and a natural illumination as the control. The LEDs were designed to emit lights in 85% of red (600–700 nm), 15% of green(500–600 nm), and 5% of blue (400–500 nm). The height of artificial lightings was elevated every five to seven days to keep the mean photosynthetic photon flux density (PPFD) of 72–73 µmol m−2 s−1 of artificial lighting at shoot-tips. Seedlings under LED lighting with CO addition had the greatest diameter growth and leaf biomass, as well as the highest nutrient utilization and evaluated quality, while those under HPS lighting had a higher stem sugar concentration but unchanged shoot growth and biomass compared to the control. In conclusion, we recommend Fragrant rosewood seedlings to be cultured with CO addition under LED lighting to efficiently promote synthetic quality and nutrient utilization.

1. Introduction

Mature urban forest trees can improve air quality, reduce storm water run-off, and sequester carbon [1]. Urbanization expansion results in the increases of population, city size, and demand for treed lands. Every year globally millions of public and private funds are invested in city agencies to undertake ambitious projects for urban afforestation [2,3]. In regional urban afforestation efforts, native tree species are generally preferred because they can use available resources most efficiently and are considered more effective than exotic species at supporting the native biodiversity of plants and animals [1]. As the common rule suggests, short-lived native trees with a higher growing rate should dominate initially with slower growing species colonizing and establishing during later successional stages [4]. Some slowly-growing species, however, are heavily preferred to dominate the urban landscape due to their high commercial values [5,6,7,8,9] and contribution to perceived well-being [10,11]. The increasing demand for slow-growing trees has threatened the natural source because the artificial culture usually requires several years, as well as considerable expenses in labor, land, and power. It is necessary to develop a practical approach to advance the culture of slowly growing tree stocks with an acceptable quality.
Since the early 1900s, people have known that plants can perceive the daily photoperiod in terms of the length of day and night [12]. This was thereafter developed as the technique of artificially extending the photoperiod to promote the growth of slowly-growing coniferous tree seedlings [13,14,15,16,17]. High pressure sodium (HPS) lamps are one kind of high intensity discharge illumination devices [18] which supply supplemental lighting for tree crops. Recent studies revealed that supplemental lighting using HPS lamps can effectively promote shoot biomass accumulation in highly valued slowly growing species, such as Buddhist pine (Podocarpus macrophyllus (Thunb.) Sweet) [5,6,8,9], Japanese maple (Acer palmatum Thunb.) [6], and Fragrant rosewood (Dalbergia odorifera T.C. Chen) [7]. Accordingly, nutrient content also increased with the biomass growth under supplemental HPS lighting. However, the positive effect of HPS lighting on biomass in these studies was usually accompanied by height growth, while diameter had very little or even negative responses to the prolonged photoperiod [5,6,7]. In addition, reserved nutrients would be diluted in seedlings under an extended photoperiod unless some higher doses of nutrients were supplied [5] or the supplemental photoperiod was controlled to be less than 6 h [7]. As a result, the seedling quality may not be enhanced with the culture of HPS lighting [7,8,9] in spite of these seedlings obtaining a favorable feature and considerable nutrient uptake [13,14,15,16,17].
Plants can perceive changes in light spectrum quality through several types of photoreceptors [19]. Red (R) (600–700 nm) and blue (B) (400–500 nm) wavebands can be absorbed by chlorophyll and used to drive photosynthesis, while green (G) (500–600 nm) and far-red (FR)(700–800 nm) wavebands fall in the lesser-absorbed regions of the whole spectrum [20]. Lights from HPS lamps have a wide range of wavelengths which appear to be redundant for promoting plant growth [21]. In contrast, light emitting diodes (LEDs) are solid-state semiconductors that produce non-coherent light and which can be adjusted to emit light in very specific parts of thespectrum [22,23]. Bioassay results have shown that several coniferous tree seedlings can respond with better growth to the LED spectrum than the HPS one [20,24,25]. LEDs have also surpassed HPS in terms of the electrical cost per photon and continue to make rapid leaps forward in terms of energy efficiency [24,26]. Therefore, LED may be a candidate to replace HPS as the lighting source in the culture of highly valued slowly-growing tree seedlings during the supplemental photoperiod.
A pilot study indicated that the variation of growth and morphology of tree seedlings modified by the different lighting spectra tended to disappear after out-planting [25]. This suggested that the growth changes driven by different lighting spectra were not sufficient to continuously support seedlings in the open-air condition where the environment was harsher and stress was more apparent. According to knowledge about tree nutrition, we know that nutrient fractions, especially macro-nutrient elements, can be reserved in tree seedlings from the culture period until transplant to help seedlings overcome the transplant shock through nutrient retranslocation [9,27,28]. Nutrient utilization can be defined as the efficiency to produce new growth at a given plant N concentration, which was determined under strong genetic control and highly correlated with growth trait [29]. A seedling that can take up nutrients efficiently and utilize them effectively will show an improved outplanting response and future growth [30]. However, nutritional manipulation has rarely been involved in the studies of the lighting spectra effect on tree seedlings [19,20,24,25]. Thus, the nutrient state in tree seedlings under different light spectra has received little attention [20]. The Nitrogen (N) response was evaluated in terms of the chlorophyll content [19,24], but direct determination for nutrient utilization is completely scarce.
A high-quality seedling should not only have experienced morphological growth at the end of a nursery culture, but should also show robust transplant performance in the field [8,9,13,19,25,27]. Seedling growth quality is the critical parameter that can indicate transplant performance. Height and stem diameter are the two most commonly used parameters for seedling quality because they can indicate growth and survival after transplant, respectively [31,32]. However, harmony among the height, diameter, and shoot-root relationship is also important for a highly-qualified seedling, which can be evaluated by the criteria of sturdiness and shoot-to-root ratio (i.e., biomass of shoot divided by biomass of root) [31]. In tree seedlings, height was mostly responsive to different light spectra with little changes in diameter growth [19,24]. However, the faster growth of height relative to diameter would result in a higher sturdiness, which may be an indicator of the depressed seedling quality [25]. Some spectra from LEDs resulted in high sturdiness, which indicated a risk of transplant failure because seedlings showed an in-coordinated feature with a vimineous but thin stem [20,25]. Therefore, it is necessary to incorporate some growth modifier into the cultural system for tree seedlings to regulate the coordination among morphological parameters to meet a high-quality criterion.
Chitosan is comprised of 2-acetamido-2-deoxy-β-d-glucose (N-acetyl-d-glucosamine) and 2-amino-2-de 2-amino-2-deoxy-β-d-glucan (d-glucosamine) attached via β-(1,4) linkages [33]. Chitosan oligosaccharide (CO) is the enzymatic-hydrolyzed product of chitosan and can be used as a plant growth modifier. A recent study reported that the addition of CO to Buddhist pine seedlings during the cultural period can promote the biomass and length of newly-grown leaves after transplant through enhancing nutrient utilization [33]. Another study on current-season Buddhist pine and Northeast yew (Taxus cuspidata Siebold & Zucc.) seedlings revealed that CO addition tended to improve nutrient utilization through counting shoot phosphorus (P) dilution [34]. These results suggested that the addition of CO may be an available approach to be used as a modifier to regulate growth and biomass partition of highly-valued slowly growing seedlings under different light spectra. However, relevant information is quite limited.
Fragrant rosewood (Dalbergia odorifera T.C. Chen) is a perennial legume tree distributed in sub-tropical and tropical areas of China, but its heartwood is popularly taken as a traditional herbal medicine in North East Asia [7]. Fragrant rosewood was categorized as vulnerable by World Conservation Monitoring Centre (WCMC) [35]. However, recently, the over-development has driven the natural source of this species to be nearly exhausted, which has promoted this species to be classified as a second-grade state-protected tree by the Chinese government [7]. Meanwhile, the demand for high-quality seedlings of Fragrant rosewood in southern areas of China is always increasing for its forest establishment during urbanization. Therefore, it is essentially necessary to develop some available approach to promote the seedling quality of Fragrant rosewood so as to reserve the natural sources and to meet the significant gap of seedling supply. In this study, the effect of LED illumination on the quality of Fragrant rosewood seedlings in comparison with HPS lighting was tested. CO was involved in the experiment as an addition to seedlings with the prospect of modifying seedling growth. We hypothesized that: (i) LED lighting spectrum can surpass the HPS one in promoting the quality of Fragrant rosewood seedlings, whose (ii) nutrient utilization can also be enhanced by the addition of CO.

2. Materials and Methods

2.1. Plant Material and Study Site

Seeds were collected from introduced Fragrant rosewood trees at Jing Mountain (28°8.0′ N, 120°37.9′ E) from Hainan Province. Sterilized seeds were sown in sands with a moisture of 90% on 12 April 2016. One month later, in early May 2016, germinant seedlings were transplanted to the mixture of peat, mushroom-spent-residual, and perlite (v/v/v, 6/3/1; Mushro-Dust® substrate, Zhilunpudao Agric. S&T Ltd., Changchun, China) in column containers fenced with non-woven fabrics (diameter × height, 9 cm × 10 cm). Transplanted seedlings were placed in 1 m × 1 m blocks as four 5 pots × 5 pots sub-plots. All pots were placed on bricks over the ground in the area of 1 m × 1 m for each block (Figure 1). This was used to reduce the possible impact of a low soil temperature on root development at a low cost. The experiment was conducted in an open-sided greenhouse with shading nets over the roof to regulate the inside temperature at the study nursery of the Laboratory of Forestry and Ecology (28°0.1′ N, 120°37.7′ E), Zhejiang Institute of Subtropical Crops, Zhejiang Academy of Agricultural Sciences, Wenzhou, China. The study was located in a region at an elevation of 40–50 m with an annual temperature of 17.9 °C and frost-free days of 243–290 days.

2.2. Experimental Design

The experiment was conducted following a split-block design with the light spectra treatment as the main block and CO addition as the sub-blocks. The main blocks were replicated five times in each light spectra treatment. In each block, two sub-blocks were divided into the treatments with or without CO (+CO and −CO, respectively). Each sub-block included four sub-plots (25 seedlings) and either of the couple sub-plots received the +CO or −CO treatments. In total, there were 100 seedlings in one main block, 500 seedlings in one light spectra treatment, and 1,500 in the whole experiment.

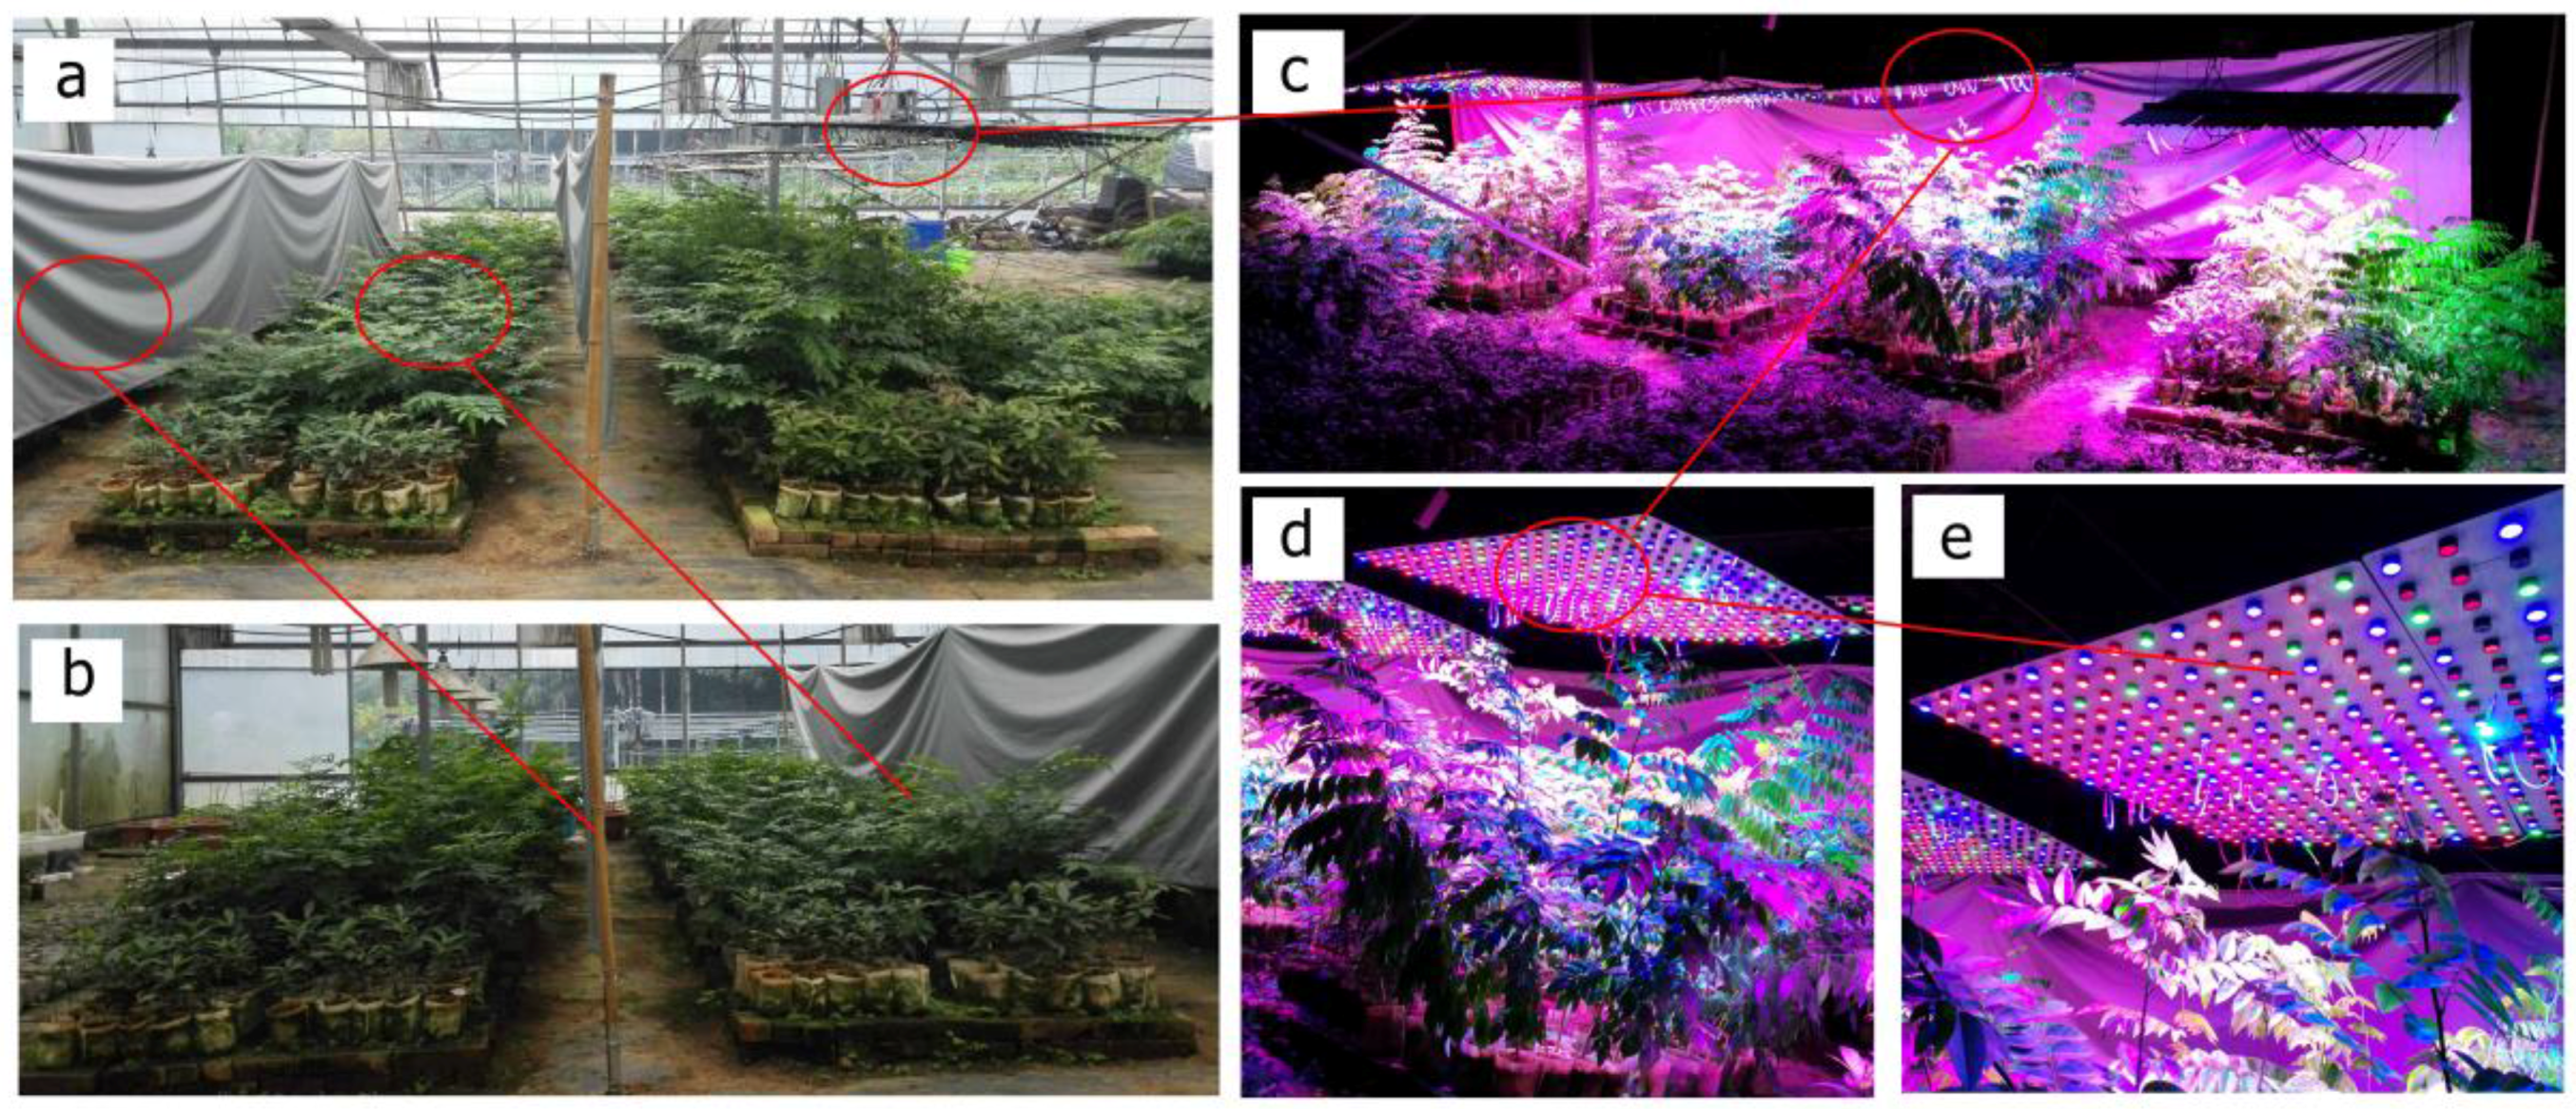
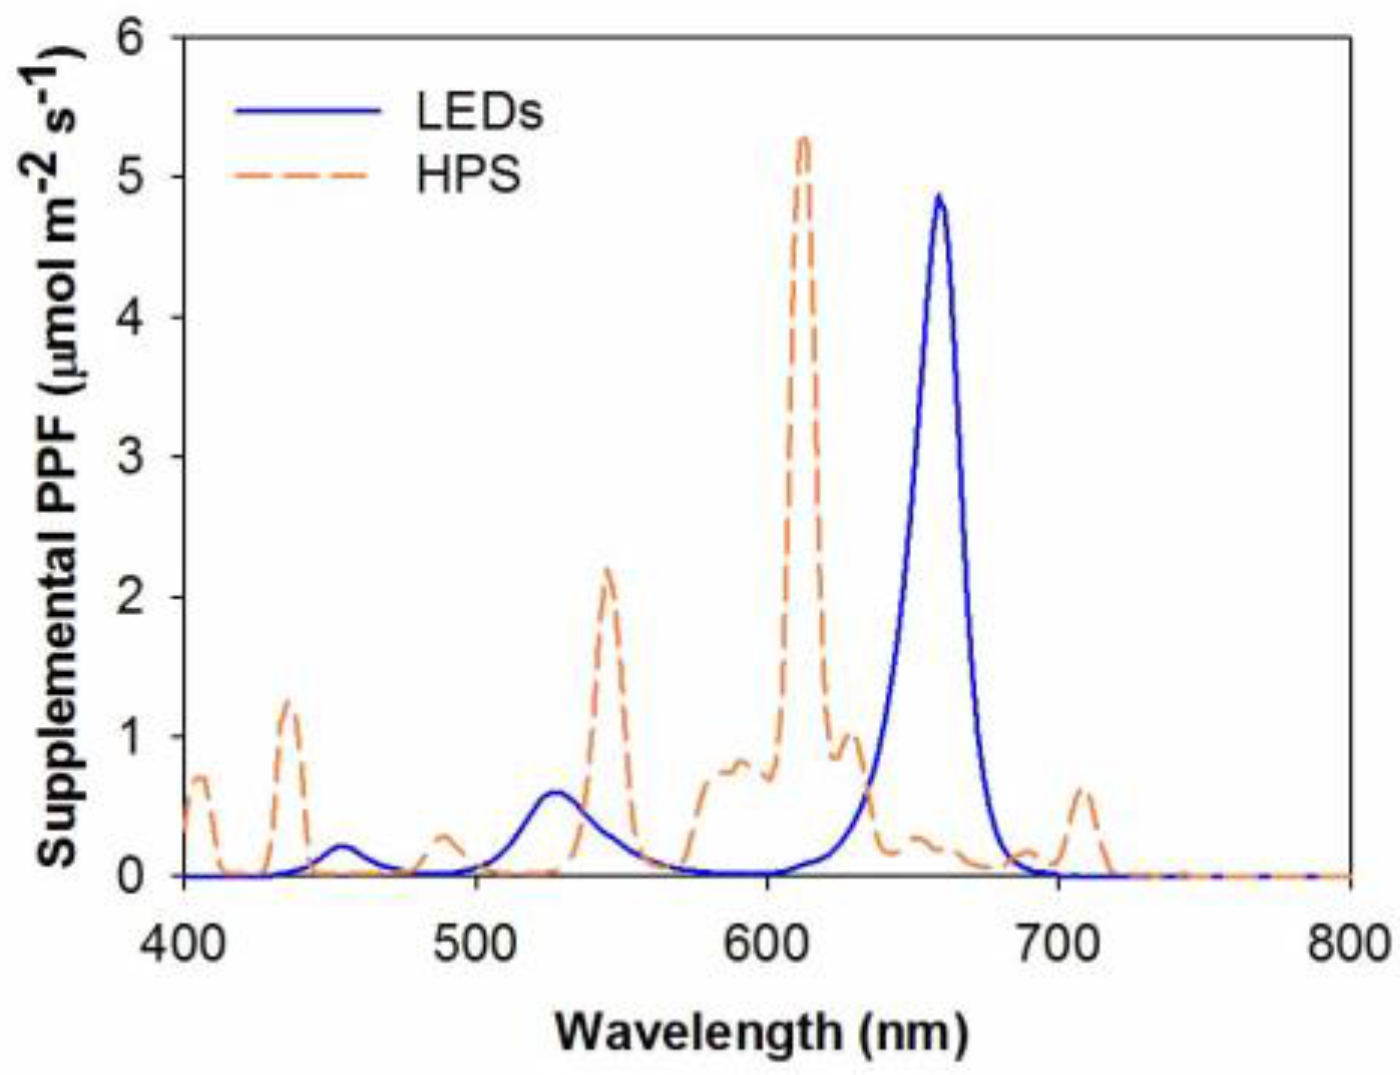
2.3. The lighting Spectra Treatment

In early July 2016, seedlings began to receive light spectra treatments. Every block was treated with one of the illumination regimes of HPS or LED lightings. A natural lighting source was also involved in the experiment as the control. The HPS lamps (Zhilunpudao Agric. S&T Ltd., Changchun, China) emitted light in continuous wavelengths between 380 nm and 830 nm at the electrical power of 200 W (Figure 2). The LED panel consisted of eight lamina-cells (30 cm × 60 cm, width × length) emitting light in the area of 1.2 m × 1.2 m. There were 50 diodes inlaid in one lamia-cell at the electrical power of 0.7 W per diode with a 350 mA electric current, resulting in a total electrical power of 280 W per panel. Diodes were designed to emit light of 85R:10G:5B from the whole panel. The LED panel emitted the light in wavelengths between 400 nm and 800 nm(Figure 2).
Artificial illumination devices were positioned to hang over the seedlings. The device height was elevated every five to seven days throughout the experiment according to the growing rate of seedling height. The height between the artificial lighting surface and the seedling shoot tips was manually kept to be about 40 cm and 20 cm for HPS and LEDs, respectively. These two heights were set to enable all seedlings to receive a mean photosynthetic photon flux density (PPFD) of 72–73 µmol m−2 s−1 at shoot-tips under the two different artificial lightings. Artificial devices were open from 6:00 a.m. to 21:00 p.m., generating a 15 h photoperiod for daily seedling growth. This photoperiod included about three hours of supplemental lighting during night time, which has been proven to favor the growth and nutrient utilization in Fragrant rosewood [7]. The adjacent two main-blocks receiving different light spectra treatments were separated by a black-out cloth fixed at 1.2 m from the ground.

2.4. Chitosan Oligosaccharide Addition and Fertilization Regime

Both CO treatment and fertilizer application began in mid-July 2016. The +CO component was derived from liquid solutions (Qishanbao®, GlycoBio Co., Ltd., Dalian, China), diluted at a concentration of 1:800 (CO:water), applied through foliar-spray with each fertilizer application. In the −CO treatment, water was only added with each fertilizer delivery. Fertilizers were delivered using the solutions (N-P2O5-K2O, 15-9-12, micro-nutrients plus) every 15 d at a total rate of 600 mg N seedling−1 following an exponential fertilization formulation. Briefly, the rates of nutrient deliveries increased in an exponential growth model [5,27,28] (Equation (1)):
N T = ( e r t 1 )
where r is the relative addition rate for the nutrient amount ( N T ) added to a seedling from the initial nutrient reserve ( N S ) through t times of nutrient deliveries to the theoretical nutrient accumulation ( N T + N S ). This fertilizer regime has been proven to promote the growth and nutrient utilization in Fragrant rosewood [7]. All seedlings shared the same fertilization regime. Seedlings were watered every two days according to the temperature and air temperature. Throughout the experiment, the temperature was 24–42 °C and relative humidity was 78–88%.

2.5. Seedling Sampling, Measurement and Chemical Analysis

All treatments and fertilizer applications were terminated in mid-January 2017. One week later, four seedlings were randomly sampled from each sub-plot and bulked as a basal measuring unit. Sampled seedlings were measured for height and root-collar diameter (RCD) and divided into parts of leaves, stem, and root. Separated seedling parts were oven-dried at 70 °C for three days, ground into powders, and screened through a 1-mm sieve. Soluble sugars (glucose, fructose, and sucrose) and starch concentrations were determined by the colorimetric method using a spectrophotometer at 490 nm (UV-Visible 8453, Agilent Technologies Inc., Santa Clara, CA, USA). Briefly, a 0.5 g sample was added to 50 mL of distilled water, steamed by high pressure for two hours, and measured for the concentration of soluble sugars; thereafter, the residual was washed with distilled water, oven-dried, added to hydrochloric acid, extracted in a boiling water bath for eight hours, combined with sodium hydroxide solution, and measured for the starch concentration. N and P concentrations were determined by the method adapted from Li et al. [7]. Briefly, a 0.2 g of sample was digested in 5 mL of hydrogen peroxide-sulfuric acid and diluted to 50 mL until the determination using the Kjeldahl method for N and the ICP-OES method for P.

2.6. Statistical Analysis

The seedling quality was evaluated by the Dickson index model [36] (Equation (2)):
D Q I = T B Height RCD + S B R B
where DQI is the Dickson quality index; and TB, SB, and RB represent the biomass for the whole plant, shoot, and root, respectively. The nutrient utilization index (UI) was calculated according to the model by Hawkins [29] (Equation (3)):
U I = T B % N u t r i e n t L
where UI is the nutrient utilization index which can be for N (NUI) or P (PUI), accordingly with the %Nutrien-L of the leaf nutrient percentage for N or P, respectively. All of the statistics were performed using SAS software (SAS Institute Inc., Cary, NC, USA). The normality was tested and no data transformation was necessary. Our data also passed the Levene’s test by the HOVTEST procedure, indicating the homogeneous variances. The two-way analysis of variance (ANOVA) was conducted by the GLM procedure on each data set about growth, biomass, N and P states, and carbohydrates. When the interaction between the light spectra and CO addition effects was detectable on any parameter, the results were compared and arranged by the one-way ANOVA of combined effects of spectra and CO (n = 5). Otherwise, the results were compared by the main effect of light spectra (n = 10) or CO addition (n = 15). The significance was detected at the P < 0.05 level according to Tukey’s studentized range test. The vector analysis was employed to evaluate the nutritional state of seedlings at the end of the experiment, using the control without CO under the natural illumination as the reference. Vector shifts and the corresponding interpretations were adapted from Salifu and Timmer [37].

3. Results

3.1. Seedling Growth

At the end of the experimental period in mid-January 2017, lighting spectra had a significant effect on height growth (Table 1). Seedlings under the LED lighting had the greatest height of 79.66 ± 9.90 cm, while those under HPS lighting and natural illumination had heights of 63.35 ± 8.04 cm and 49.41 ± 7.31 cm, respectively (Table 2). Treatments of lighting spectra and CO addition had a significant interactive effect on RCD (Table 1). RCD was highest in seedlings receiving CO addition under the LED lighting, which was greater by 22% and 28% than that under the LED and natural lightings, respectively (Table 2).

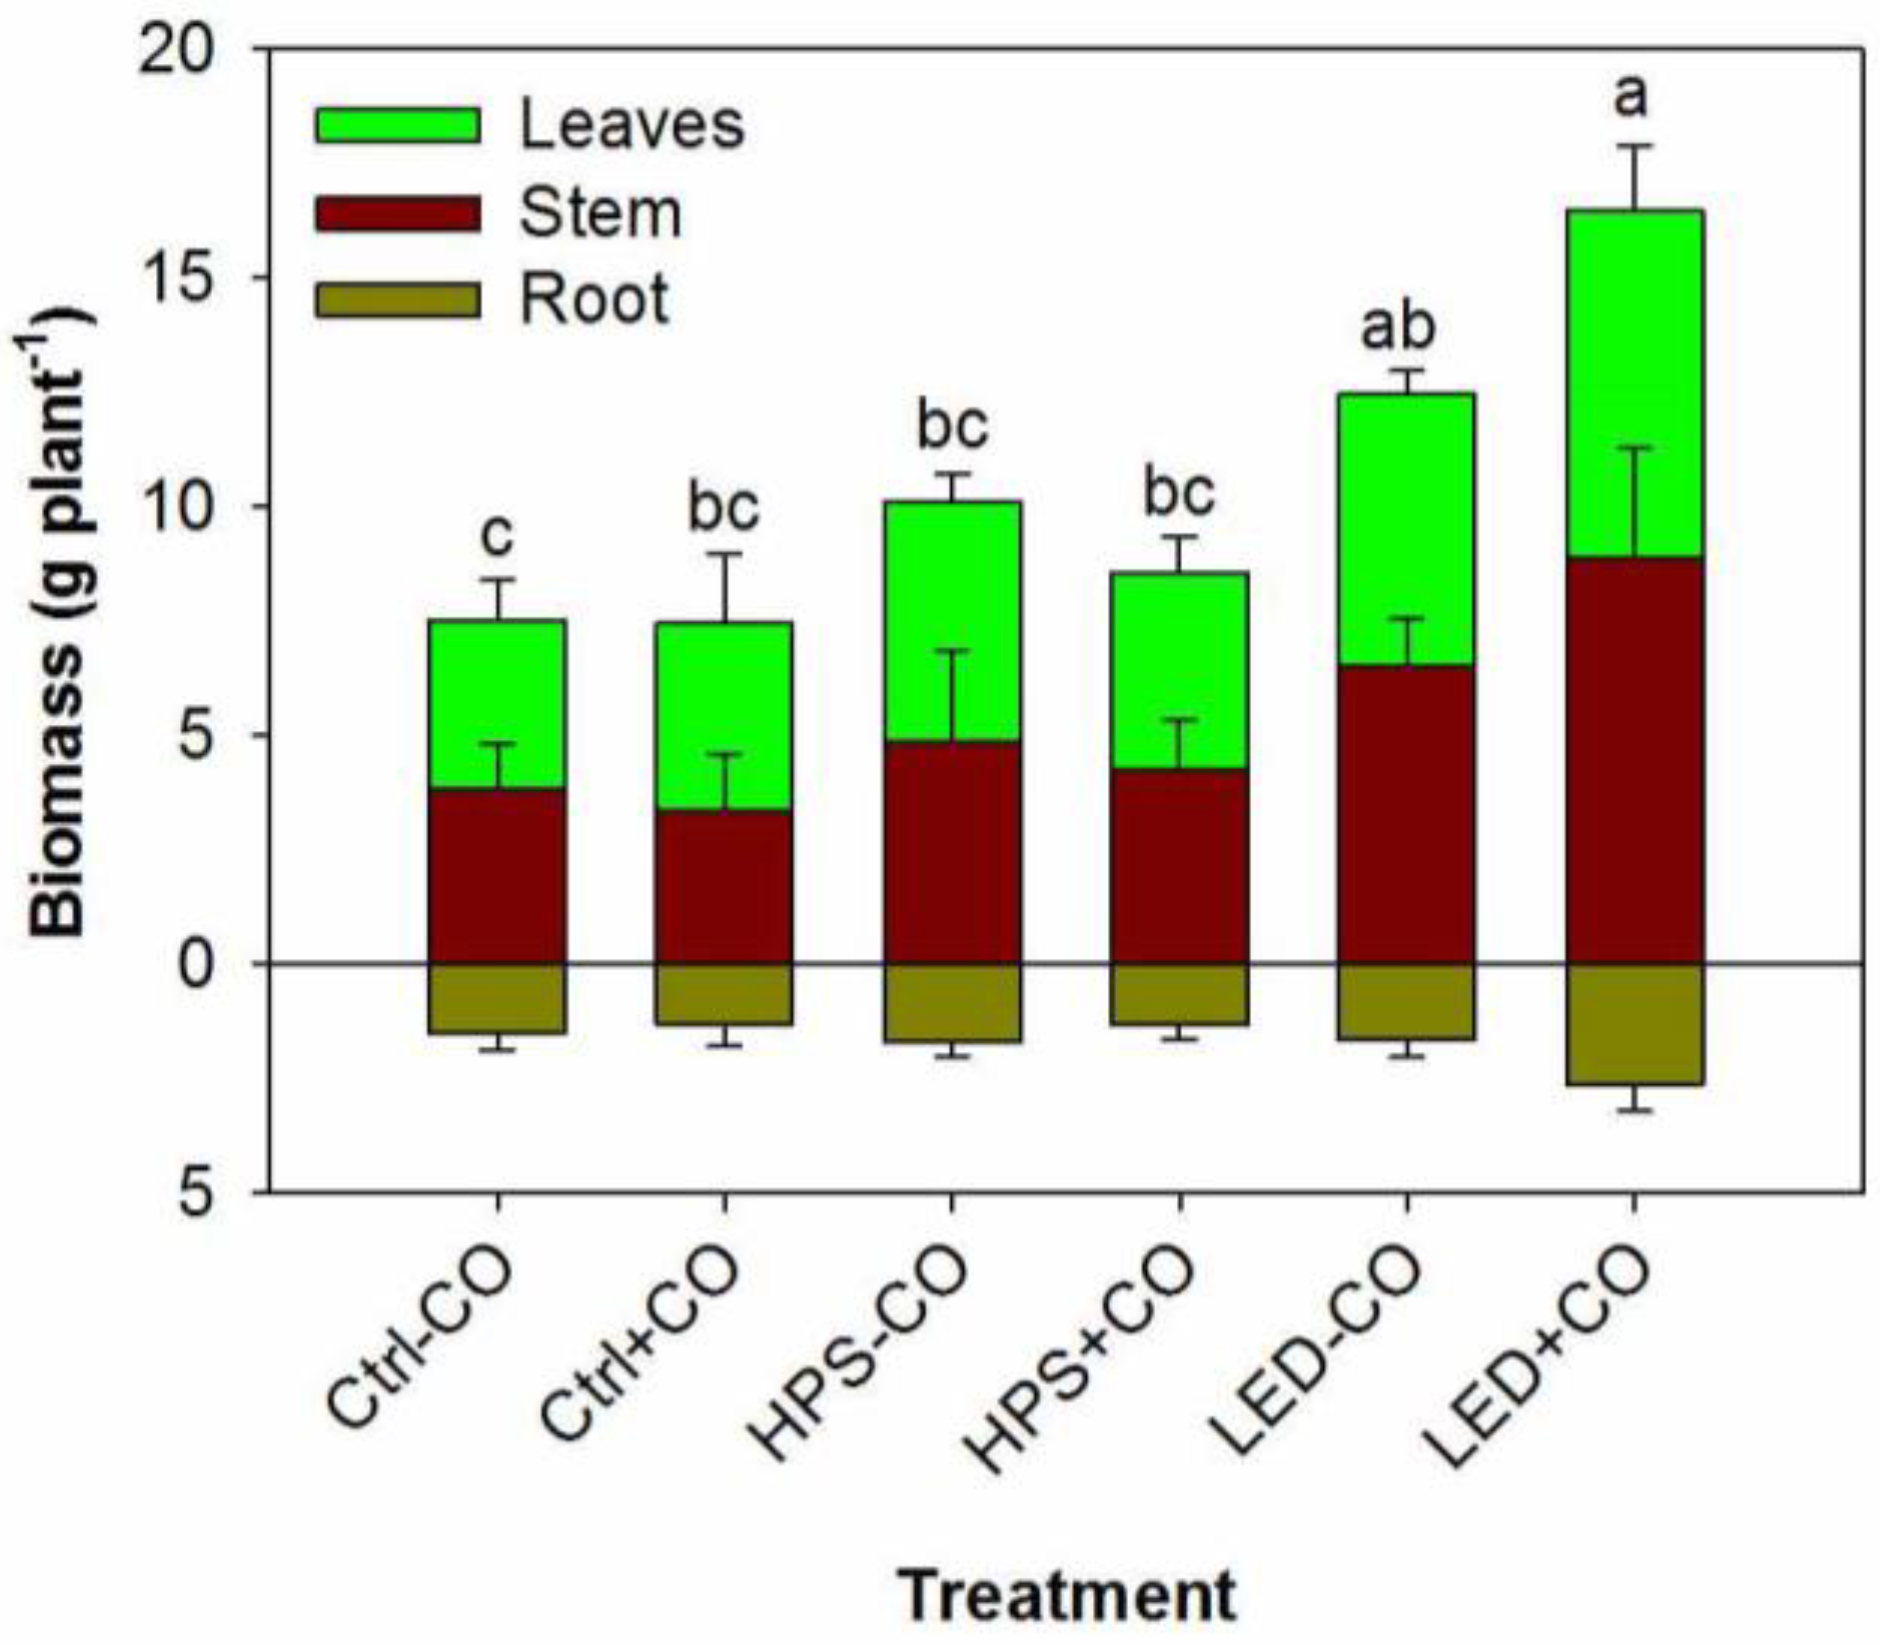
3.2. Biomass Accumulation

Treatments of lighting spectra and CO addition had a significant interactive effect on foliar biomass accumulation (Table 1). The treatment of combined LED lighting and CO addition resulted in the highest level of leaf biomass, which was greater than that in other treatments by 44–106% (Figure 3). The lighting spectra had a significant main effect on stem biomass. Seedlings in the LED lighting treatment had the greatest stem biomass of 7.71 ± 2.00 g, while stem biomass in the HPS lighting treatment (4.54 ± 1.51 g) was not statistically different from that in the control (3.60 ± 1.05 g). Neither the lighting spectra nor the CO addition had a significant effect on the root to shoot biomass ratio (R/S), which ranged between 0.15 ± 0.02 and 0.41 ± 0.71 in response to lighting spectra and between 0.16 ± 0.02 and 0.33 ± 0.56 in response to the CO addition.

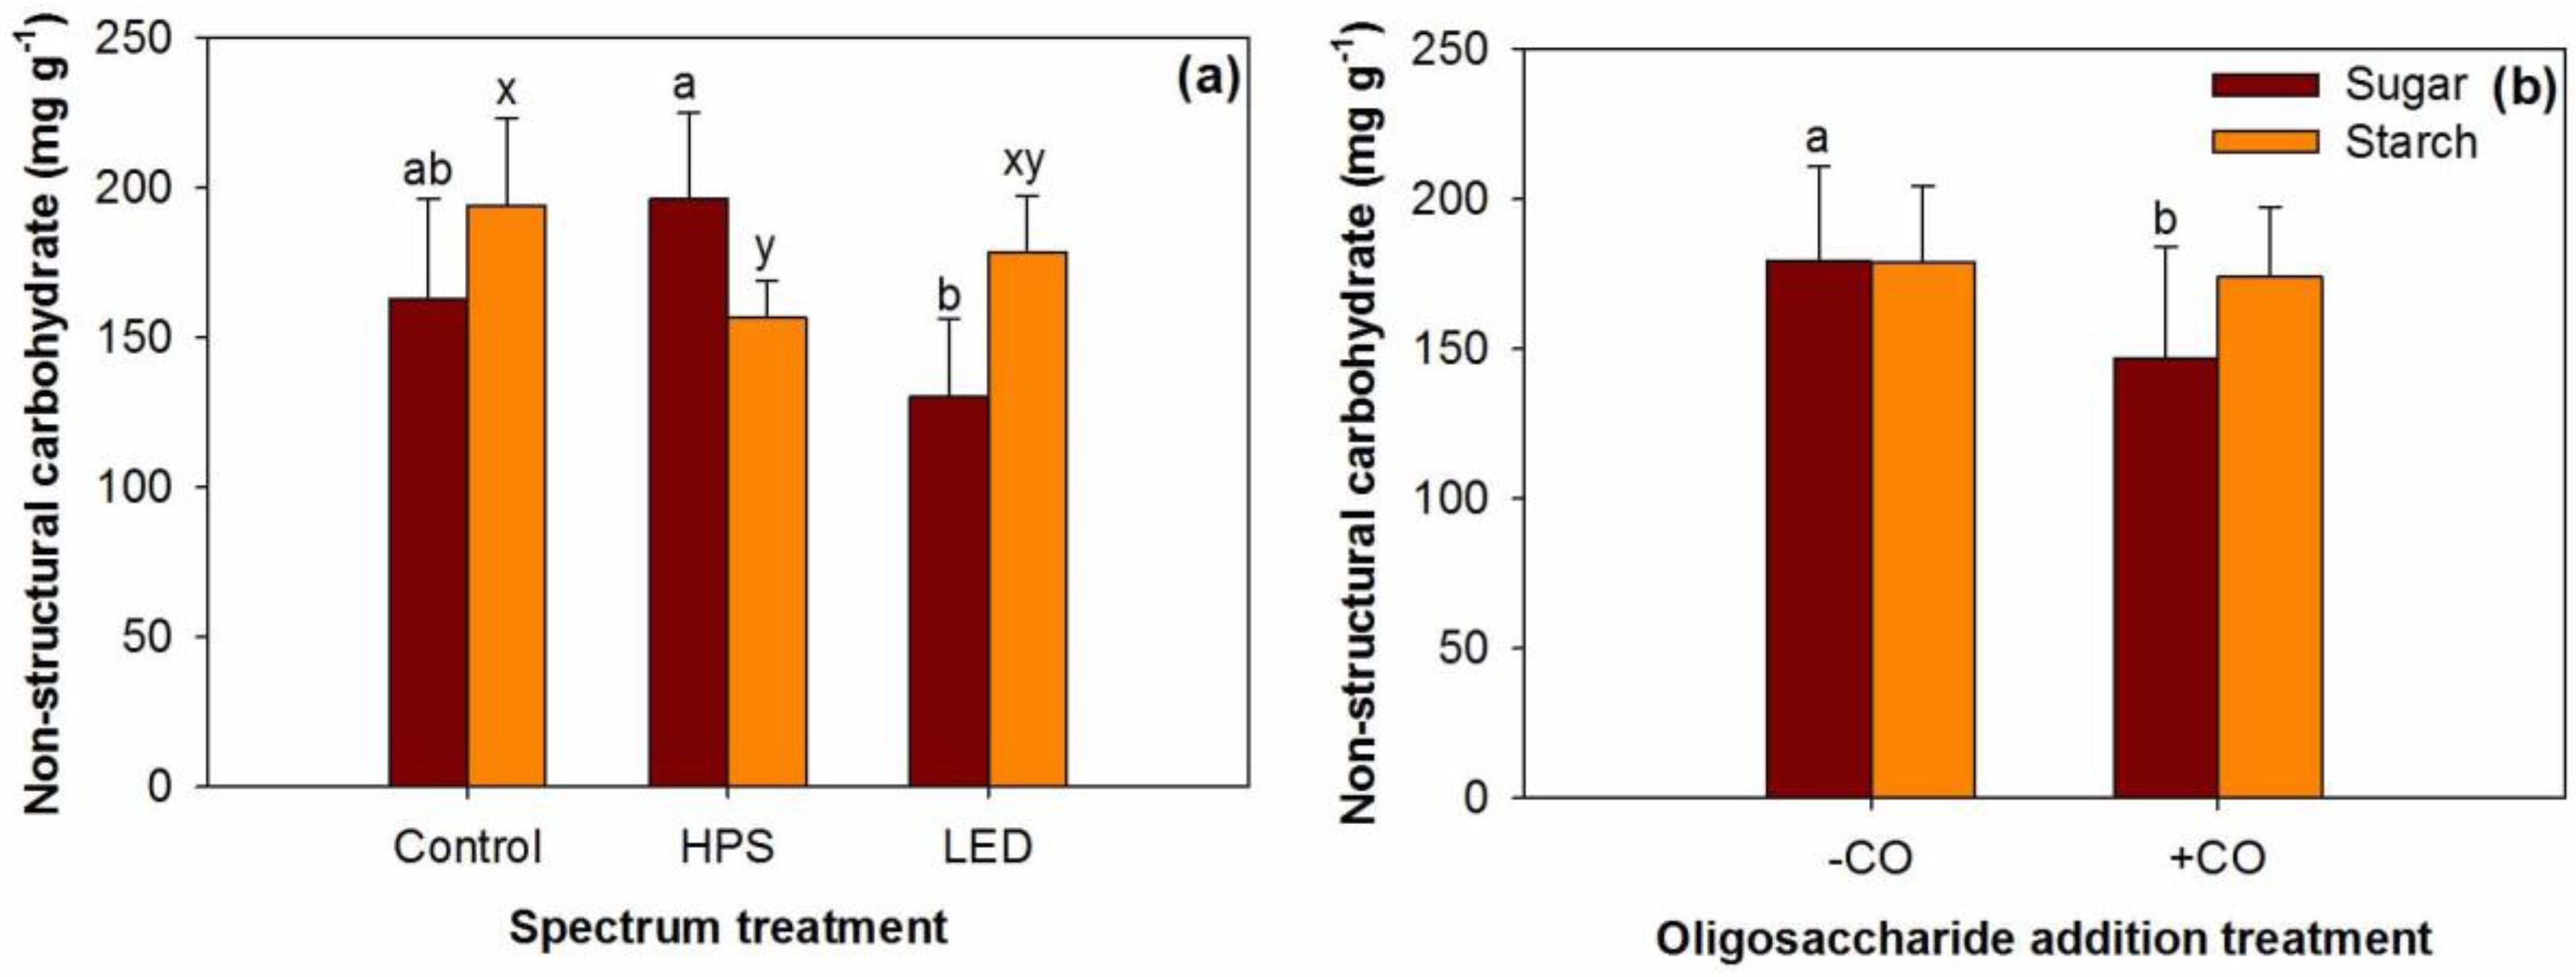
3.3. Carbohydrate Concentration

The treatment of lighting spectra had the significant main effect on concentrations of both soluble sugars and starch in the stem (Table 1). Seedlings under the HPS lighting had the highest concentration of soluble sugars in the stem, which was higher by 51% than those under the LED lighting (Figure 4a). In contrast, the starch concentration in the stem was highest in the control, which was higher by 24% than that in the HPS treatment. The CO addition caused the elevation of the soluble sugar concentration by 22%, but did not affect the starch concentration (Figure 4b).

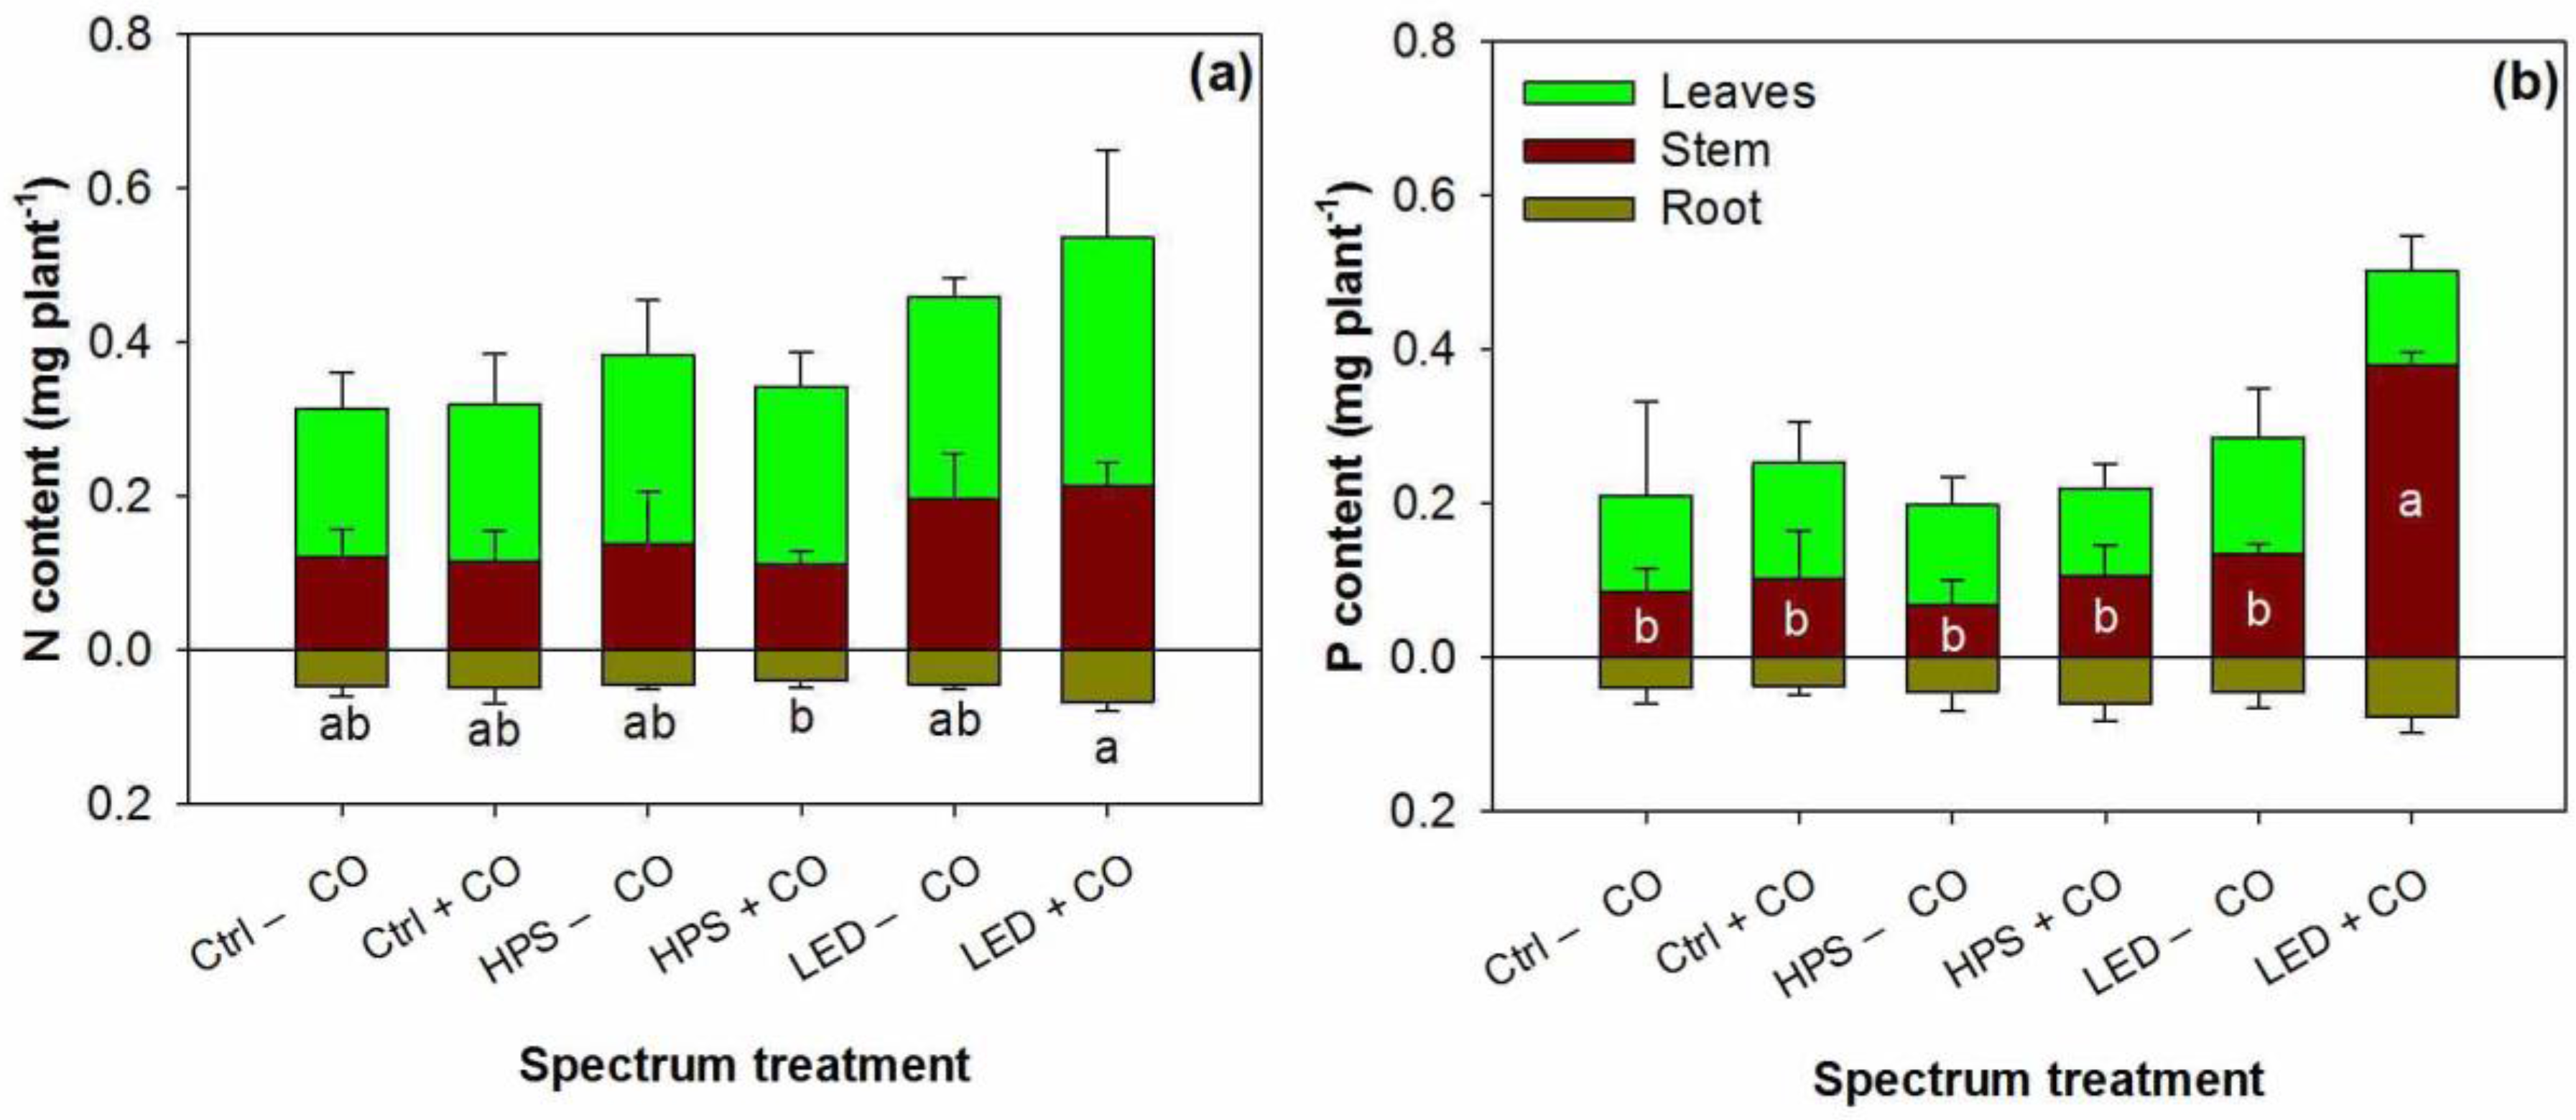
3.4. N and P Concentrations and Contents

Relative to the control, the LED lighting treatment resulted in the decline of N concentration in leaves and roots by 16% and 22%, respectively (Table 3). Meanwhile, the HPS lighting treatment also resulted in the decline of root N concentration by 19% compared to the control. The addition of CO increased P concentration in stem by 70%, but no response was found for P concentration in leaves and roots (Table 3).
The lighting spectra and CO addition treatments had a significantly interactive effect on N content in roots (Table 1). With CO addition, seedlings under the LED lighting had a greater root N content by 76% than those under the HPS lighting (Figure 5a). Compared to the control, the LED lighting treatment increased N content in the leaves (0.20 ± 0.05 g and 0.29 ± 0.08 g, respectively) and stem (0.12 ± 0.03 g and 0.21 ± 0.04 g, respectively) by 47% and 73%, respectively. N content in seedlings under the HPS lighting was not statistically different from that under the LED lighting in leaves (0.24 ± 0.05 g) and stem (0.13 ± 0.05 g). P content was only responsive to the interactive effects of lighting spectra and CO addition in the stem (Table 1). Seedlings with CO addition under the LED lighting had the highest P content in the stem, which was greater than that in other treatments by 1.8–4.6 times (Figure 5b).

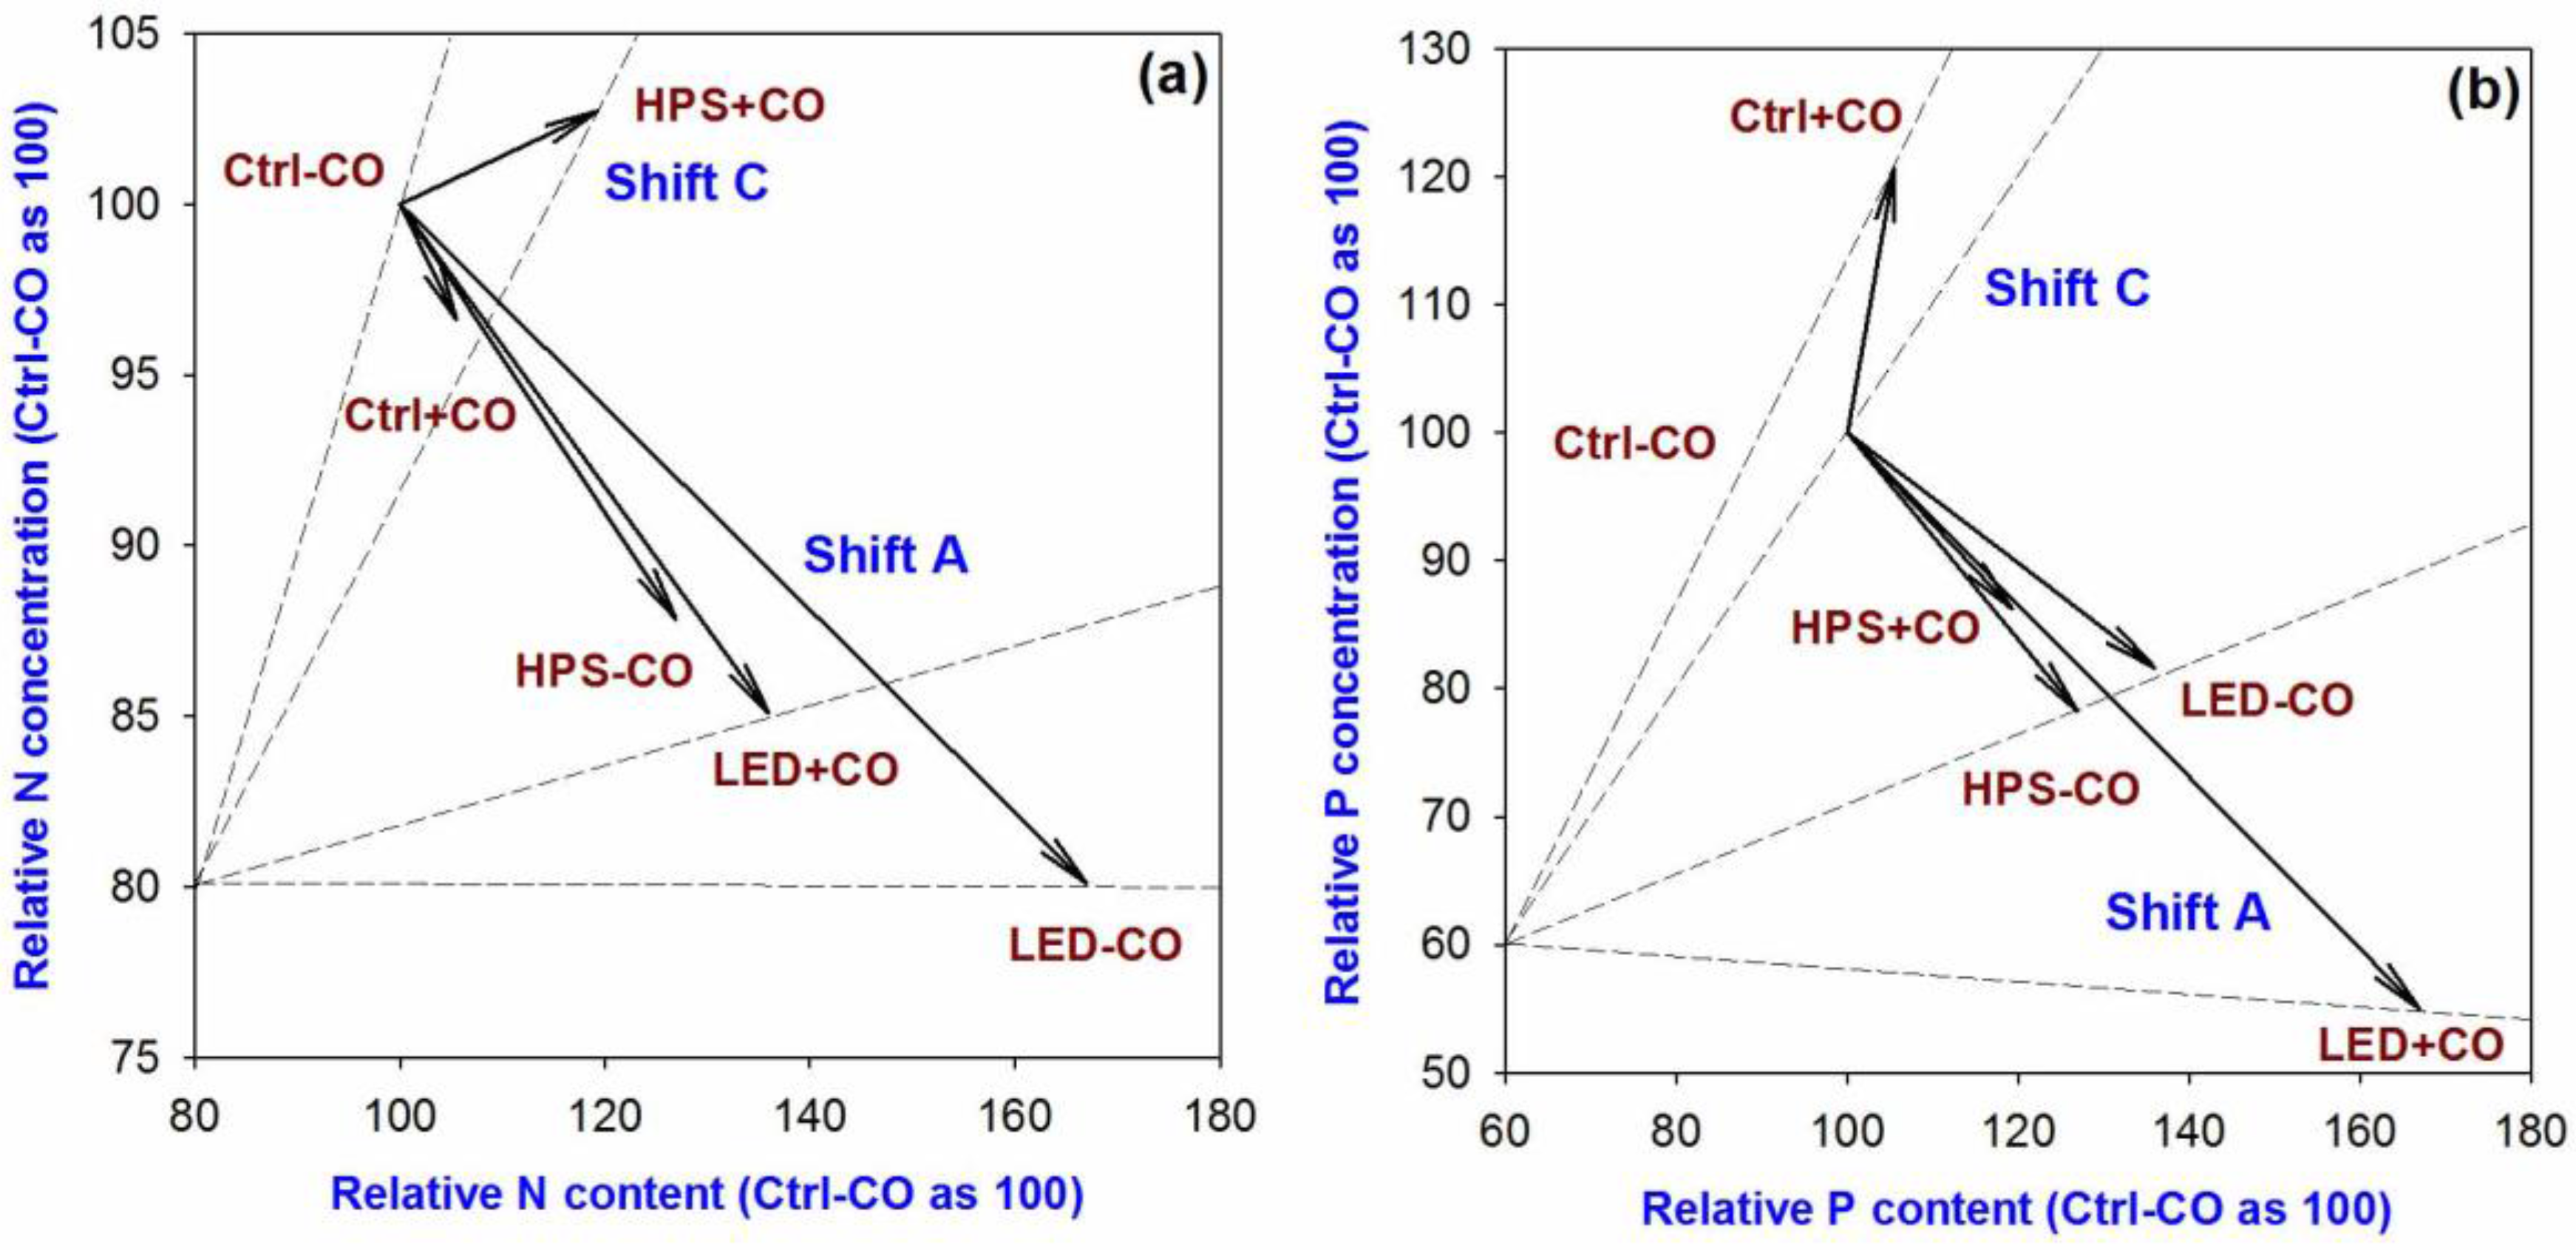
3.5. Vector Analysis

Relative to the seedlings cultured with no CO addition under natural illumination, those with CO addition under HPS lighting had a higher N content, N concentration, and biomass accumulation level. Therefore, the controlled seedlings without CO addition were characterized as having the N deficient state and the addition of CO plus HPS lighting countered the N deficiency (Figure 6a). The other treatments of Control + CO, HPS − CO, LED + CO, and LED − CO all resulted in a higher N content and biomass accumulation level, but lower N concentration relative to controlled seedlings with no CO addition. Seedlings in these treatments were characterized to show the symptom of relative N dilution (Figure 6a). Otherwise, the addition of CO alleviated P deficiency and the other treatments of HPS − CO, HPS + CO, LED − CO, and LED + CO all showed the relative P dilution (Figure 6b).

3.6. Seedling Quality Evaluation and Nutrient Utilization

Seedlings with CO addition under the LED lighting and those without CO addition under the HPS lighting had the highest DQI value, which were about one time higher than those treated with CO addition without LED lighting (Table 4). Seedlings cultured with CO addition under the LED lighting had the highest efficiency of nutrient utilization. These seedlings had higher NUI and PUI values by 67–175% and 180–463%, respectively, than those under the natural and HPS lightings.

4. Discussion

4.1. Seedling Shoot Growth

Our results showed that seedlings under the LED lighting had a greater height than those under the HPS and seedlings under both artificial lighting treatments had a greater height than the control. Height growth appeared to continue to accelerate under the HPS lighting compared to the un-treated natural illumination according to the results found both in our study and in former studies [5,6,7]. However, the response of seedling height to different lighting spectra between LED and HPS lightings seemed to vary to a great extent. For example, Apostol et al. [24] reported that compared to seedlings under the HPS lighting, Douglas-fir (Pseudotsuga menziesii [Mirb.] Franco) seedlings only responded with a greater height from the Idaho source under the LED lighting, where Engelmann spruce (Picea engelmannii Parry ex Engelm.) seedlings from the same source had no response and those from the New Mexico source even showed a decline in height growth. In addition, the LED lighting also had a negative effect on height growth in both Norway spruce (Picea abies (L.) H. Karst.) and Scots pine (Pinus sylvestris L.) seedlings compared to the HPS lighting [20,25]. The effect between fluorescent and LED lightings on the height of Quercus ithaburensis var. macrolepis seedlings was quite hard to determine [19]. Therefore, the perception of height growth in response to lighting spectra might be a species-specific trait.
Most of the current studies did not find any response of RCD to the light spectra between HPS and LED lightings [19,20,24,25]. In studies on highly valued slowly-growing seedlings, there was also a rare RCD response found for the HPS lighting relative to the control [5,6]. In a previous study on Fragrant rosewood seedlings, Li et al. found that the HPS lighting resulted in the decline of RCD compared to the un-treated control [7]. Thus, seedlings in all current studies were cultured by the manipulation of lighting without any addition of CO. In our study, we found that RCD only responded in CO-treated seedlings, whose RCD was higher under the LED lighting than under the HPS lighting and the control. However, the CO addition did not have any main effect on RCD. Our results suggest that the LED lighting can only have a positive effect on RCD growth in Fragrant rosewood seedlings with the presence of CO addition. In contrast, Wang et al. did not find any significant response of RCD in current-season Buddhist pine and Northeast yew seedlings for the interaction between photoperiod and CO addition [34]. However, Wang et al. reported that the interaction between CO addition and extended photoperiod in the past-season can have a continuous effect on RCD in current-season Buddhist pine seedlings after transplant [33]. Also, seedlings receiving CO addition under the natural illumination had a decreased RCD value compared to those under the extended photoperiod by HPS lamps [33]. In addition, our results tended to contradict those by González et al. [38] and Dzung et al. [39], where the CO addition substantially promoted the growth of tree shoots. Together, these results suggest that the LED spectrum can promote the shoot growth of Fragrant rosewood seedlings and the potential for diameter growth needs to be incorporated with the effect of CO addition.

4.2. Biomass Accumulation and Translocation

In our study, Fragrant rosewood seedlings only responded to the interaction between lighting spectra and CO addition in leaves. This was in contrast with Li et al. [7], where leaf biomass in Fragrant rosewood seedlings did not respond to the extended photoperiod by HPS lighting. In other species, leaf biomass was promoted by the LED lighting in Norway spruce seedlings [25] compared to HPS lighting. Leaf biomass was unaffected or negatively impacted by LED lighting relative to the HPS lighting in Scots pine, Douglas-fir, and Engelmann spruce seedlings [20,24]. In our study, neither stem biomass nor root biomass responded to the treatments, indicating that treatments did not drive biomass allocation. This can also be supported by the null response of R/S. In contrast, Norway spruce seedlings were found to have a higher R/S value under some LED lighting spectra than under the HPS lighting [20,25]. Leaf starch and sugar concentrations did not respond to the interactive effects of lighting spectra and CO addition, suggesting that the biomass variation in leaves did not result from non-structural carbohydrate (NSC) metabolism. Therefore, the promotion of leaf biomass in the CO + LED treatment probably resulted from the increase of structural carbohydrates.

4.3. Carbohydrate Metabolism

Carbohydrate concentration changed among lighting spectra in the stem, where the biomass was greatest under the LED lighting. In contrast, the HPS treatment tended to result in the highest sugar concentration and the lowest starch concentration. This suggests a hint that starch was metabolized by hydrolyzing into sugars mostly for elevated respiration to counter stress exerted by improper illumination [40]. In our study, the lighting intensity under HPS and LED lightings was measured to be about 72–73 µmol m−2 s−1, which fell in the range between 70 and 80 µmol m−2 s−1 [24], being sufficient for seedling growth and unlikely to drive stress. Therefore, the increase of sugars and the decrease of starch in the stem under the HPS lighting may have resulted from the spectrum under the lamps. The improper spectrum by HPS lighting may have also driven the decline of stem diameter. We did not find a significant effect of CO addition on biomass in Fragrant rosewood seedlings. In accordance with our study, CO addition also had no effect on Buddhist pine and Northeast yew seedlings [33,34]. However, our results presented that CO addition decreased the stem sugar concentration with no effect on starch (Figure 4b). This suggests that CO may promote sugar utilization without having an impact on starch depletion. With regard to the involvement of CO presence in the promotion of RCD by the LED treatment relative to the control, the depleted sugars in the stem may be used for new cell formation in woody tissues [41]. However, to our knowledge, there is rare evidence to explain the mechanism for the CO-addition effect on carbohydrate metabolism, which needs be studied in future works.

4.4. Nutrition Uptake and Utilization

Compared to the control of natural illumination, the leaf N concentration in our study was decreased under the LED lighting, but the leaf N concentration between the HPS and LED treatments was not statistically different (Table 3). Using HPS lamps, the decline of N concentration by the supplemental lighting has also been found in other studies on slowly-growing highly-valued seedlings [5,7]. This phenomenon appeared to occur when no additional N was added [5]. However, in contrast to our findings, N concentration was found to elevate in Scots pine seedlings by the LED lightings compared to the HPS lighting [20]. Using chlorophyll content (%) as an alternative estimation for foliar N concentration, some coniferous seedlings were also found to have a higher foliar N content under the LED lighting than the HPS lighting [20,24]. In contrast, the LED lighting did not change shoot biomass compared to the HPS lighting. As the integrated results of increased biomass and decreased N concentration, the LED lighting resulted in the symptom of N dilution relative to the control. The greatest N content in roots was shaped by both LED lighting and CO addition. Wang et al. found that the CO addition tended to have a species-specific effect on root N uptake and allocation [34]. It can promote the decline of root N concentration in Northeast yew, but not in Buddhist pine seedlings. However, according to Wang et al., this promotion would alternatively impact root N concentration in the next-year [33]. However, in our study, we did not observe a significant effect of CO addition on root N concentration, which may be partly influenced by the substrate. At the least, in this study, we cannot give the full conclusion that CO addition had no effect on root N concentration.
Unlike N concentration, P concentration did not respond to lighting spectra but was elevated in the stem by the CO addition. Therefore, the P deficiency in the control was alleviated by the addition of CO (Figure 6b). However, the highest P utilization in the interactive treatment of LED lighting and CO addition was formed by the contribution of N utilizations for biomass production in this treatment. In Buddhist pine and Northeast yew seedlings, the decline of P concentration was found to be related to shoot biomass accumulation and the CO addition promoted P utilization [34]. It is still uncertain whether the effect of CO addition on P utilization occurs through biomass promotion or P uptake. It is suggested that future studies test the single effect of CO addition on P utilization in ranges of doses to Fragrant rosewood seedlings.

4.5. Seedling Quality Evaluation and Implication for Practice

Seedling quality is vital to determine transplant survival and after-plant growth, which can be predicted through morphological parameters. The DQI has been employed for seedling quality evaluation several times because this parameter can predict seedling quality after transplant. Ivetić et al. found that DQI was positively correlated with the survival of Austrian pine (P. nigra ssp. nigra var. nigra Arnold) seedlings [42]. Smirnakou et al. found that DQI of Q. ithaburensis var. macrolepis varied in response to artificial lighting spectra and seedlings with a higher DQI also had greater biomass accumulation after transplant [19]. Li et al. reported that supplemental lighting for 3h using HPS lamps can enhance DQI in Fragrant rosewood seedling compared to the control [7]. In our study, seedlings cultured with the CO addition under the LED lighting had a higher DQI than those under the HPS and natural lightings with CO addition (Table 4). These results coincide with those about RCD, where the LED + CO treatment also resulted in greater growth and biomass and higher nutrient utilization than other treatments. Although seedlings without CO addition under the HPS lighting were indicated with a higher DQI, this combined treatment did not result in any significant benefit in growth, biomass, or nutrient utilization. Therefore, we recommend the regime of artificial LED lighting plus CO addition to the culture of Fragrant rosewood seedlings. The HPS lighting is not recommended due to its power consumption and less sufficient effect on seedling quality compared to the LED lighting. The addition of CO is not suggested to be used as a single treatment because its effect on seedling growth and nutrient utilization is still un-determinative.

5. Conclusions

In our study, the LED lighting spectrum was shown to stimulate biomass accumulation with nutrient dilution in Fragrant rosewood seedlings. Hence, the sole use of LED lighting without specific nutritional management may make the seedlings suffer from nutrient deficiency. Otherwise, the sole effect of CO addition could only cause a seedling response in terms of an increased stem P concentration, which concurs with other studies. Only under the illumination of LED lighting can the CO addition promote the synthetic quality and N and P utilizations in Fragrant rosewood seedlings. Although the HPS lamps are widely used as practical artificial lighting devices, their spectrum cannot result in a significant change of growth, biomass accumulation, and nutrient utilization in seedlings relative to the natural-lighted control. Therefore, we recommend that Fragrant rosewood seedlings are cultured with CO addition with top-dressing at the concentration of 1:800 (v/v, CO/water) under LED lighting in the spectrum of 85R:10G:5B for the shoot-tip PPFD of 72–73 µmol m−2 s−1 in 15 h of daily photoperiod.

Acknowledgments

This study was financially supported by Zhejiang Science and Technology Major Program on Agricultural New Variety Breeding (2016C02056-3), the Public Welfare Project for Agriculture in Zhejiang Province (2016C32041), the Scientific Innovation Project for Seeds and Seedlings in Wenzhou (N20150008), the Key S&T Innovation Team Project in Wenzhou (C20150002), the National Key Technologies R&D Program of China (2016YFC0500300), and the National Natural Science Foundation of China (31600496).

Author Contributions

X.-W.L., Q.-X.C., and H.-X.W. conceived and designed the experiments; X.-W.L., Q.-X.C., J.-W.W., and H.-Q.L. performed the experiments; H.-Q.L. and S.Y. collected and determined samples; S.Y. and H.-X.W. analyzed the data; X.-W.L. wrote the paper; Q.-X.C. and H.-X.W. revised the initial edition of the paper.

Conflicts of Interest

The authors declare no conflict of interest.

References

  1. Oldfield, E.E.; Warren, R.J.; Felson, A.J.; Bradford, M.A. Challenges and future directions in urban afforestation. J. Appl. Ecol. 2013, 50, 1169–1177. [Google Scholar] [CrossRef]
  2. Pincetl, S. Implementing municipal tree planting: Los Angeles million-tree initiative. Environ. Manag. 2010, 45, 227–238. [Google Scholar] [CrossRef] [PubMed]
  3. Pataki, D.E.; Carreiro, M.M.; Cherrier, J.; Grulke, N.E.; Jennings, V.; Pincetl, S.; Pouyat, R.V.; Whitlow, T.H.; Zipperer, W.C. Coupling biogeochemical cycles in urban environments: Ecosystem services, green solutions, and misconceptions. Front. Ecol. Environ. 2011, 9, 27–36. [Google Scholar] [CrossRef]
  4. Crawley, M.J. Plant Ecology, 2nd ed.; Blackwell Science Ltd.: Malden, MA, USA, 1997. [Google Scholar]
  5. Wei, H.X.; Ren, J.; Zhou, J.H. Effect of exponential fertilization on growth and nutritional status in Buddhist pine (Podocarpus macrophyllus [Thunb.] D. Don) seedlings cultured in natural and prolonged photoperiods. Soil Sci. Plant Nutr. 2013, 59, 933–941. [Google Scholar] [CrossRef]
  6. Zhu, K.Y.; Liu, H.C.; Wei, H.X.; Zhou, J.H.; Zou, Q.C.; Ma, G.Y.; Zhang, J.Q. Prediction of nutrient leaching from culture of containerized Buddhist pine and Japanese maple seedlings exposed to extended photoperiod. Int. J. Agric. Biol. 2016, 18, 425–434. [Google Scholar] [CrossRef]
  7. Li, X.W.; Gao, Y.; Wei, H.X.; Xia, H.T.; Chen, X.Q. Growth, biomass accumulation and foliar nutrient status in fragrant rosewood (Dalbergia odorifera T.C. Chen) seedlings cultured with conventional and exponential fertilizations under different photoperiod regimes. Soil Sci. Plant Nutr. 2017, 63, 153–162. [Google Scholar] [CrossRef]
  8. Wei, H.X.; Guo, P.; Zheng, H.F.; He, X.Y.; Wang, P.J.; Ren, Z.B.; Zhai, C. Micro-scale heterogeneity in urban forest soils affects fine root foraging by ornamental seedlings of Buddhist pine and Northeast yew. Urban For. Urban Green. 2017, 28, 63–72. [Google Scholar] [CrossRef]
  9. Wei, H.X.; He, X.Y.; Zheng, H.F.; Wang, P.J.; Zhai, C. Effect of urban weed competition on survival and growth of transplanted tree seedlings cultured under different photoperiods. In Urban Forest Sustainability, 1st ed.; Ning, Z.H, Nowak, D.J., Watson, G., Eds.; International Society of Arboriculture: Champaign, IL, USA, 2017; pp. 174–192. [Google Scholar]
  10. Guan, H.M.; Wei, H.X.; He, X.Y.; Ren, Z.B.; An, B.Y. The tree-species-specific effect of forest bathing on perceived anxiety alleviation of young-adults in urban forests. Ann. For. Res. 2017, 60. [Google Scholar] [CrossRef]
  11. Guan, H.M.; Wei, H.X.; He, X.Y.; Ren, Z.B.; Chen, X.; Guo, P. Visitors’ emotional expression in urban forest parks: What can we know about on-line facial images from the Social Networking Services? PeerJ Prepr. 2017. [Google Scholar] [CrossRef]
  12. Garner, W.W. Further studies in photoperiodism, the response of the plant to relative length of day and night. J. Agric. Res. 1923, 23, 871–920. [Google Scholar]
  13. Watt, R.F.; McGregor, W.H.D. Growth of four northern conifers under long and natural photoperiods in Florida and Wisconsin. For. Sci. 1963, 9, 115–128. [Google Scholar]
  14. Wheeler, N. Effect of continuous photoperiod on growth and development of lodgepole pine seedlings and grafts. Can. J. For. Res. 1979, 9, 276–283. [Google Scholar] [CrossRef]
  15. O’Reilly, C.; Arnott, J.T.; Owens, J.N. Effects of photoperiod and moisture availability on shoot growth, seedling morphology, and cuticle and epicuticular wax features of container-grown western hemlock seedlings. Can. J. For. Res. 1989, 19, 122–131. [Google Scholar] [CrossRef]
  16. Puttonen, P.; Arnott, J.T. Influence of photoperiod and temperature on growth, gas exchange, and cold hardiness of yellow cypress stecklings. Can. J. For. Res. 1994, 24, 1608–1616. [Google Scholar] [CrossRef]
  17. Heide, O.M. Interaction of photoperiod and temperature in the control of growth and dormancy of Prunus species. Sci. Hortic. 2008, 115, 309–314. [Google Scholar] [CrossRef]
  18. Rabara, R.C.; Behrman, G.; Timbol, T.; Rushton, P.J. Effect of spectral quality of monochromatic LED lights on the growth of artichoke seedlings. Front. Plant Sci. 2017, 8, 190. [Google Scholar] [CrossRef] [PubMed]
  19. Smirnakou, S.; Ouzounis, T.; Radogloiu, K.M. Continuous spectrum LEDs promote seedling quality traits and performance of Quercus ithaburensis var. macrolepis. Front. Plant Sci. 2017, 8, 188. [Google Scholar] [CrossRef] [PubMed]
  20. Riikonen, J.; Kettunen, N.; Gritsevich, M.; Hakala, T.; Särkkä, L.; Tahvonen, R. Growth and development of Norway spruce and Scots pine seedlings under different light spectra. Environ. Exp. Bot. 2016, 121, 112–120. [Google Scholar] [CrossRef]
  21. Rehman, M.; Ullah, S.; Bao, Y.N.; Wang, B.; Peng, D.X.; Liu, L.J. Light-emitting diodes: Whether an efficient source of light for indoor plants? Environ. Sci. Pollut. Res. 2017, 24, 24743–24752. [Google Scholar] [CrossRef] [PubMed]
  22. Bourget, C.M. An introduction to light-emitting diodes. Hortscience 2008, 43, 1944–1946. [Google Scholar]
  23. Singh, D.; Basu, C.; Meinhardt-Wollweber, M.; Roth, B. LEDs for energy efficient greenhouse lighting. Renew. Sustain. Energy Rev. 2015, 49, 139–147. [Google Scholar] [CrossRef]
  24. Apostol, K.G.; Dumroese, R.K.; Pinto, J.R.; Davis, A.S. Response of conifer species from three latitudinal populations to light spectra generated by light-emitting diodes and high-pressure sodium lamps. Can. J. For. Res. 2015, 45, 1711–1719. [Google Scholar] [CrossRef]
  25. Riikonen, J. Pre-cultivation of Scots pine and Norway spruce transplant seedlings under four different light spectra did not affect their field performance. New For. 2016, 47, 607–619. [Google Scholar] [CrossRef]
  26. Jensen, N.B.; Clasusen, M.R.; Kjaer, K.H. Spectral quality of supplemental LED grow light permanently alters stomatal functioning and chilling tolerance in basil (Ocimum basilicum L.). Sci. Hortic. 2018, 227, 38–47. [Google Scholar] [CrossRef]
  27. Duan, J.; Xu, C.Y.; Jacobs, D.F.; Ma, L.Y.; Wei, H.X.; Jiang, L.N.; Ren, J. Exponential nutrient loading shortens the cultural period of Larix olgensis seedlings. Scand. J. For. Res. 2013, 28, 409–418. [Google Scholar] [CrossRef]
  28. Wei, H.X.; Xu, C.Y.; Ren, J.; Ma, L.Y.; Duan, J.; Jiang, L.N. Newly transplanted Larix olgensis Henry stock with greater root biomass has higher early nitrogen flux rate. Soil Sci. Plant Nutr. 2013, 59, 740–749. [Google Scholar] [CrossRef]
  29. Hawkins, B.J. Family variation in nutritional and growth traits in Douglas-fir seedlings. Tree Physiol. 2007, 27, 911–919. [Google Scholar] [CrossRef] [PubMed]
  30. Miller, B.D.; Hawkins, B.J. Nitrogen uptake and utilization by slow- and fast-growing families of interior spruce under contrasting fertility regimes. Can. J. For. Res. 2003, 33, 959–966. [Google Scholar] [CrossRef]
  31. Landis, T.D.; Dumroese, R.K.; Haase, D.L. The container tree nursery manual, volume 7: Seedling processing, storage and outplanting. In Agriculture Handbook 674; USDA Forest Service: Washington, DC, USA, 2010. [Google Scholar]
  32. Grossniclke, S.C. Why seedlings survive: Influence of plant attributes. New For. 2012, 43, 711–738. [Google Scholar] [CrossRef]
  33. Wang, Z.; Zhao, Y.; Wei, H.X. Chitosan oligosaccharide addition affects current-year shoot of post-transplant Buddhist pine (Podocarpus macrophyllus) seedlings under contrasting photoperiods. iForest Biogeosci. For. 2017, 10, 715–721. [Google Scholar] [CrossRef]
  34. Wang, Y.J.; Wei, H.X.; Ge, L.L.; Sun, N.W.; Wang, T.; Zhang, Q.C.; Han, L.B.; Ge, X.Y.; Jin, G.Y. Chitosan oligosaccharide addition modifies nutrient utilization in highly-valued ornamental tree seedlings. For. Environ. Sci. 2017, 5, 101–106. [Google Scholar]
  35. WCMC. Dalbergia odorifera. The IUCN Red List of Threatened Species. 1998. Available online: http://www.iucnredlist.org/details/32398/0 (accessed on 8 December 2017).
  36. Dickson, A.; Leaf, A.I.; Hosner, J.F. Quality appraisal of white spruce and white pine seedling stock in nurseries. For. Chron. 1960, 36, 10–13. [Google Scholar] [CrossRef]
  37. Salifu, K.F.; Timmer, V.R. Optimizing nitrogen loading of Picea mariana seedlings during nursery culture. Can. J. For. Res. 2003, 33, 1287–1294. [Google Scholar] [CrossRef]
  38. González, A.; Castro, J.; Vera, J.; Moenne, A. Seaweed oligosaccharides stimulate plant growth by enhancing carbon and nitrogen assimilation, basal metabolism, and cell division. J. Plant Growth Regul. 2013, 32, 443–448. [Google Scholar] [CrossRef]
  39. Dzung, N.A.; Khanh, V.T.P.; Dzung, T.T. Research on impact of chitosan oligomers on biophysical characteristics, growth, development and drought resistance of coffee. Carbohydr. Polym. 2011, 84, 751–755. [Google Scholar] [CrossRef]
  40. Wei, H.X.; Guo, P. Carbohydrate metabolism during new root growth in transplanted Larix olgensis seedlings: Post-transplant response to nursery-applied inorganic fertilizer and organic amendment. iForest Biogeosci. For. 2017, 10, 15–22. [Google Scholar] [CrossRef]
  41. Tomasella, M.; Haeberle, K.H.; Nardini, A.; Hesse, B.; Machlet, A.; Matyssek, R. Post-drought hydraulic recovery is accompanied by non-structural carbohydrate depletion in the stem wood of Norway spruce saplings. Sci. Rep. 2017, 7, 14308. [Google Scholar] [CrossRef] [PubMed]
  42. Ivetić, V.; Grossnickle, S.; Škorić, M. Forecasting the field performance of Austrian pine seedlings using morphological attributes. iForest Biogeosci. For. 2017, 10, 99–107. [Google Scholar] [CrossRef]
Figure 1. A scene of Fragrant rosewood (Dalbergia odorifera) seedlings cultured under the control, light-emitting diodes (LED) (a), and high-pressure sodium (HPS) lightings (b) at the day of seedling sampling. (c) A scene of LED lighting on Fragrant rosewood seedlings under the panels (d) with diodes inlaid (e) during night time of the late-period of seedling culture.
Forests 09 00029 g001
Figure 2. The wavelengths of spectra of LED and HPS lightings. PPF, photosynthetic photon flux.
Forests 09 00029 g002
Figure 3. Biomass accumulation in leaves, stem, and root of Fragrant rosewood (D. odorifera) seedlings cultured in the interactive effects of chitosan oligosaccharide addition and lighting spectra. Ctrl, the control of the natural illumination; HPS, high-pressure sodium; LED, light-emitting diodes; −CO, the treatment without chitosan oligosaccharide addition; +CO, the treatment with chitosan oligosaccharide addition. Different letters indicate significant differences for leaf biomass at the0.05 level.
Forests 09 00029 g003
Figure 4. Concentrations of soluble sugars and starch in the stem of Fragrant rosewood (D. odorifera) seedlings cultured in the main effects of lighting spectra (a) and chitosan oligosaccharideaddition (b). Ctrl, the control of the natural illumination; HPS, high-pressure sodium; LED, light-emitting diodes; −CO, the treatment without chitosan oligosaccharide addition; +CO, the treatment with chitosan oligosaccharide addition. Different letters indicate significant differences at the 0.05 level. Letters of a and b for sugar and those of x and y for starch.
Forests 09 00029 g004
Figure 5. N (a) and P contents (b) in leaves, stem, and root of Fragrant rosewood (D. odorifera) seedlings cultured in the interactive effects of chitosan oligosaccharide addition and lighting spectra. Ctrl, the control of the natural illumination; HPS, high-pressure sodium; LED, light-emitting diodes; −CO, the treatment without chitosan oligosaccharide addition; +CO, the treatment with chitosan oligosaccharide addition. Different letters indicate significant differences at the 0.05 level.
Forests 09 00029 g005
Figure 6. Vector analysis of biomass, nutrient content, and concentration for N (a) and P (b) in leaves of Fragrant rosewood (D odorifera) seedlings cultured in the interactive effects of chitosan oligosaccharide addition and lighting spectra. Ctrl, the control of the natural illumination; HPS, high-pressure sodium; LED, light-emitting diodes; −CO, the treatment without chitosan oligosaccharide addition; +CO, the treatment with chitosan oligosaccharide addition. Shift A indicates the symptom of relative nutrient dilution in the object; shift C indicates the symptom of the relative nutrient deficiency in the reference.
Forests 09 00029 g006
Table 1. p values from analysis of variance (ANOVA) analysis of lighting spectra (S), chitosan oligosaccharide addition (O), and their interaction (S × O) on parameters of Fragrant rosewood (Dalbergia odorifera) seedlings.
ParametersSOS × OParametersSOS × O
Height<0.0001 10.9024 0.4104 Leaf sugar0.0945 0.2563 0.3096
RCD 20.0134 0.4083 0.0413Stem sugar0.00020.00650.9635
Leaf biomass<0.00010.3711 0.0442Root sugar0.3311 0.3110 0.9789
Stem biomass<0.00010.5055 0.1086 Leaf starch0.1901 0.2765 0.5451
Root biomass0.4327 0.4008 0.2048 Stem starch0.00820.6029 0.6058
R/S 30.4017 0.3275 0.3840 Root Starch0.0879 0.8282 0.7556
Leaf N concentration0.02880.6509 0.1862 Leaf N content0.02690.4920 0.5165
Stem N concentration0.1229 0.7420 0.4930 Stem N content0.00080.7993 0.6111
Root N concentration0.00010.1374 0.0779 Root N content0.0821 0.2551 0.0499
Leaf P concentration0.0872 0.9648 0.4253 Leaf P content0.8539 0.8342 0.6791
Stem P concentration0.1781 0.01480.3726 Stem P content0.00040.00640.0179
Root P concentration0.5975 0.0890 0.4816 Root P content0.0969 0.0816 0.2746
1 Bold digits indicate significance at the 0.05 level; 2 RCD, root-collar diameter; 3 R/S, root to shoot biomass ratio.
Table 2. The interactive effects of lighting spectra and chitosan oligosaccharide addition on height and root-collar diameter (RCD) in Fragrant rosewood (D. odorifera) seedlings.
TreatmentnMeanS.E. 1TreatmentnMeanS.E.
HeightRCD
Control − CO 2546.86.33Control − CO56.320.51ab 3
Control + CO 4552.028.61Control + CO55.700.78b
HPS − CO 5566.6410.18HPS − CO56.690.44ab
HPS + CO560.065.39HPS + CO55.990.39b
LED − CO 6579.645.86LED − CO56.590.6ab
LED + CO579.6814.21LED + CO57.310.81a
1 S.E., standard error; 2 control, the natural illumination without any artificial lighting; −CO, the treatment without chitosan oligosaccharide addition; 3 Different letters indicate significant difference at the 0.05 level; 4 +CO, the treatment with chitosan oligosaccharide addition; 5 HPS, high-pressure sodium; 6 LED, light-emitting diodes.
Table 3. The main effects of lighting spectra and chitosan oligosaccharide addition on N and P concentrations in Fragrant rosewood (D. odorifera) seedlings.
LeavesStemRoot
TreatmentnMeanS.E. 1 TreatmentnMeanS.E.TreatmentnMeanS.E.
N
Control 2105.130.3a 3Control103.340.56Control103.430.44a
HPS 4104.970.81abHPS102.750.28HPS102.790.33b
LED 5104.310.61bLED102.80.81LED102.670.26b
−CO 6154.750.66 −CO1530.6−CO152.860.37
+CO 7154.860.68 +CO152.920.63+CO153.060.5
P
Control103.411.67 Control102.540.98Control102.981.31
HPS102.540.42 HPS102.031.04HPS103.531.54
LED102.110.83 LED103.241.94LED102.941.05
−CO152.671.34 −CO151.930.61−CO152.691.16
+CO152.690.97 +CO153.281.69+CO153.611.27
1 S.E., standard error; 2 control, the natural illumination without any artificial lighting; 3 Different letters indicate significant difference at the 0.05 level; 4 HPS, high-pressure sodium; 5 LED, light-emitting diodes; 6 −CO, the treatment without chitosan oligosaccharide addition; 7 +CO, the treatment with chitosan oligosaccharide addition.
Table 4. The interactive effects of lighting spectra and chitosan oligosaccharide addition on evaluated seedling quality and nutrient utilization of Fragrant rosewood (D. odorifera) seedlings.
TreatmentnMeanS.E. 1 MeanS.E. MeanS.E.
DQI 2NUI 3PUI 4
Control − CO 550.720.16ab 61.720.37b3.981.87b
Control + CO 750.590.2b1.770.66b2.440.92b
HPS − CO 851.050.54a2.831.18b4.890.43b
HPS + CO50.60.14b1.840.39b3.780.96b
LED − CO 950.720.16ab3.180.44ab5.91.21b
LED + CO51.10.21a4.741.35a13.726.35a
M.S. 10 0.256.9782.23
F value 2.858.618.90
pr > F0.0369<0.0001<0.0001
1 S.E., standard error; 2 DQI, Dickson quality index; 3 NUI, N utilization index; 4 PUI, P utilization index; 5 control, the natural illumination without any artificial lighting; − CO, the treatment without chitosan oligosaccharide addition; 6 Different letters indicate significant differences at the 0.05 level;7 +CO, the treatment with chitosan oligosaccharide addition; 8 HPS, high-pressure sodium; 9 LED, light-emitting diodes; 10 M.S., mean square.

