Article

Thinning Intensity Affects Soil-Atmosphere Fluxes of Greenhouse Gases and Soil Nitrogen Mineralization in a Lowland Poplar Plantation

1
College of Forestry, Nanjing Forestry University, Nanjing 210037, China
2
Co-Innovation Center for Sustainable Forestry in Southern China, Nanjing Forestry University, Nanjing 210037, China
*
Author to whom correspondence should be addressed.
Forests 2016, 7(7), 141; https://doi.org/10.3390/f7070141
Submission received: 6 May 2016 / Revised: 5 July 2016 / Accepted: 6 July 2016 / Published: 12 July 2016

Abstract

:
Thinning is one of the intensive forest management techniques commonly applied to increase the merchantable timber volume. However, how thinning affects soil–atmospheric fluxes of greenhouse gases (GHGs) is poorly understood. A field experiment with four treatments (CK: unthinned; MB: medium intensity thinning from below; HB: high intensity thinning from below; and HI: high intensity thinning by removing every alternative row of trees) was conducted to assess the impact of thinning regimes on soil–atmospheric fluxes of GHGs (CO2, CH4, and N2O) and soil nitrogen mineralization in a poplar plantation established on a lowland. Thinning significantly increased soil water content and water table in the high thinning treatments (HB and HI) and tended to increase soil temperature (p < 0.10). The result of the one-year study showed that estimated annual emissions of CO2 and CH4 were higher in HB and HI than in other treatments, while the highest emission of N2O was in the CK. The thinning treatments increased the annual emission of CO2 by 23%–64% and that of CH4 by 190%–1200%, but decreased that of N2O by 41%–62%. Thinning increased annual N mineralization by 50.3% in HI and 30.1%in HB. Changes in soil temperature and water table drove CO2, CH4, and N2O emissions, while soil water content was the most important factor driving CH4 emission. We conclude that the moderate thinning (MB) regime is the best thinning option to minimize the impact on GHG emissions for lowland poplar plantations with similar conditions to those tested in this study.

Graphical Abstract

1. Introduction

Forest ecosystems represent a significant terrestrial carbon(C) store and have been identified to have the potential to mitigate and offset greenhouse gas (GHG) emissions through the sequestration of C by means of biomass production and the utilization of forest products and residues [1,2,3]. Several management options, such as fertilization [4,5], rotation length [6], peat land drainage system for forestry [7],and thinning [8] have been evaluated for increasing the C sink. In order to increase the economic benefits from forestry, thinning as an important forest management practice is widely adopted by many countries [9,10]. Indeed, thinning will reduce the total standing biomass, production, and may play a negative role in both timber production and C sequestration in the short-term. However, it may contribute towards mitigating climate change in the long run, depending on its net effect on forest C stocks and harvested wood products. Thinning provides off-site C storage (wood products), but its effects on on-site C storage is not clear [10,11,12].
Increasing concentrations of GHGs (such as CO2, CH4, and N2O) in the atmosphere change the earth’s energy balance and contribute to global climate change [13]. Forest plantations can play a key role in mitigating global climate change [9,14], while management practices applied to plantations can influence GHG exchange between the terrestrial biosphere and the atmosphere. Extensive research has been conducted to understand the terrestrial C cycle in forest ecosystems, but how CH4 and N2O are cycled through the terrestrial biosphere is much less studied [13]. A comprehensive understanding of GHG balance and climate change needs to take a multiple-GHGs approach to investigate the fluxes of major GHGs simultaneously. The potential for increasing the C sink through forest management has been widely discussed [4,15,16]. For example, Nilsen and Strand [9] reported that thinning intensity affected C and nitrogen (N) stores and fluxes in a Norway spruce (Picea abies) forest, and Saunders et al. [1] indicated that thinning affected the net ecosystem C exchange in a Sitka spruce forest. However, less known is the role that forest management options play in the exchanges of CH4 and N2O with the atmosphere and how these GHG emissions impact the total GHG balance.
When compared to other forest species, poplars have the characteristics of fast growth, adaptability to different environmental conditions, and suitability for diverse silvicultural systems, making them suitable for plantation establishment [15,17]. Recently, poplar wood is increasingly being used as long-term storage products such as lumber and oriented strand boards. Moreover, fast-growing poplars are also very effective C sinks and can be planted in agroforestry systems to offset agricultural sources of CO2 emissions [18,19]. The main countries with poplar plantations are China (7.6 million ha), France (236,000 ha), Iran (150,000 ha), Turkey (125,000 ha), Spain (105,000 ha), and Italy (101,430 ha) [20]. Poplar plantations have markedly increased in China since 2004 (with only 3.9 million ha of poplar plantations in 2004), and poplar shave been incorporated into many managed systems for timber and fiber production as well as for environmental application throughout the south temperate zone in central China. Over the most recent ten years, most studies on poplar plantations have been focused on renewable bioenergy with short-rotation coppice [21,22], potential utilization of phytochemicals [23], the relationship between genetic diversity and productivity [24,25,26], and site productivity maintenance [27,28,29,30,31]. Although more attention has been paid to the role of poplar plantations in CO2 sequestration in China [15,16,32], there has been no comprehensive study of how management practices affect the soil–atmosphere fluxes of GHGs in poplar plantations and how these GHG emissions impact the total GHG balance. In order to increase the production of merchantable timber, thinning is commonly used in managing poplar plantations in China. However, the thinning process opens the forest canopy, resulting in modifications in air and soil temperature, vapor pressure deficit, light penetration, intercepted rainfall, and soil water content [1,33,34]. We hypothesized that thinning disturbance would enhance emissions of GHGs and N mineralization due to modification of environmental factors, and that the response of specific GHGs to the disturbance may differ. The objectives of this research were to (1) measure soil–atmosphere fluxes of GHGs (CO2, CH4, and N2O) and soil N mineralization in a poplar plantation established on a lowland site; (2) investigate differences in GHG emissions and net mineralized N among the different thinning regimes; and (3) relate GHG emissions or soil N mineralization to soil environmental factors.

2. Materials and Methods

2.1. Study Area

The study area is located at Baoying Agriculture Farm (119°15′ E, 33°22′ N) in Lixiahe Region of Jiangsu Province, China. The main forested areas consist of poplar and dawn redwood (Metasequoia glyptostroboides) plantations established on marginal agricultural lands in the middle of the 1980s. The area has a warm temperate climate with a mean annual precipitation of 966 mm. The annual frost-free period is about 225 days, and the average radiant intensity is 494.04 kJ·cm−2. Mean annual air temperature is 14.3 °C, with average temperatures of 0.4 °C in January and 27.6 °C in July. The clay loam soil has a moderate fertility with a pH value of 7.6, a total N, P, K, Ca, and Mg contents of 0.93, 0.71, 15.92, 2.09, and 11.91 g·kg−1, respectively, in the 0–20 cm soil depth. The water table fluctuates from 0.2 to 1.0 m, and the bulk density of soil to 20 cm is 1.28 g·cm−3.

2.2. Plantation Establishment and Experimental Design

The poplar plantation was established in 2006 with one-year-old seedlings of clone 35 (Populus deltoides cv. 35) over an area of about 45.0 ha. The initial density of the plantation was 500 trees ha−1 (spacing: 4.0 m × 5.0 m). At the stand age of six, the mean diameter at breast height (1.3 m) of the plantation was 16.6 cm (averaged over all trees on the trial area), while the tree height was 18.2 m (averaged over trees sampled by 15% of all trees on the trial).
The thinning trial was set up at the end of 2011 in order to compare the thinning effect on micro climate, GHG fluxes, nutrient cycling, and plantation growth. The experiment involved four treatments: unthinned (CK), medium intensity thinning (30% removal of trees) from below (from the lower end of the diameter distribution) (MB), high intensity thinning (50% removal of trees) from below (HB), and high intensity (50% removal of trees) interlaced thinning (HI), using a randomized complete-block design with three replications. Each plot size was about 4300 m2 with a buffer row of trees between plots, and total area of the trial was about 5.2 ha. After thinning, all the thinned stems and branches were removed from the site, and the mean basal areas of the remaining trees were 11.08, 8.23, 7.54, and 5.03 m2·ha−1 for CK, MB, HB, and HI, respectively.

2.3. Measurement of Soil Temperature, Moisture Content, and Water Table Level

A wireless sensor network (WSN) was used to monitor environmental factors in different thinning treatments [35]. Briefly, the data acquisition nodes to collect environmental information were placed in the different thinning treatments. The collected data in the acquisition nodes are converged to the gateway node through the WSNs, then the gateway nodes send the data to the server via the 3G module. Five sensors were installed in each treatment for each soil depth to monitor the soil temperature and moisture content. Soil temperature and moisture content at the 5 and 15 cm depths were recorded every 5 min in each treatment. Soil water table was measured monthly by an open auger hole method [36] between January and December in 2014.

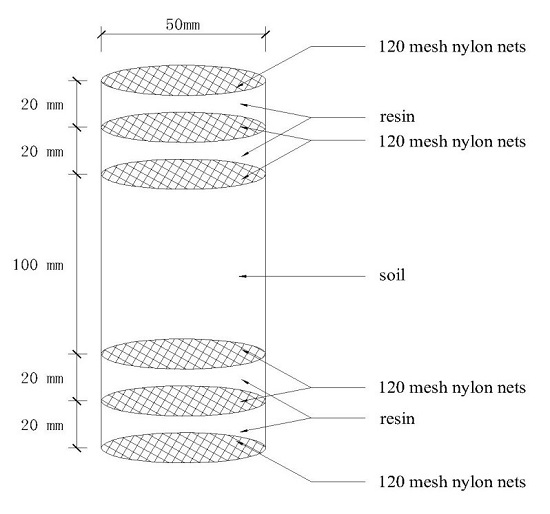
2.4. Soil N Mineralization and Sample Collection

Soil N mineralization was determined through in situ soil incubation using the resin core method [37]. The detailed resin core method described by Yan et al. [31] was exactly followed in this study during spring, autumn, and winter times, owing to the similar site conditions and both for the poplar plantations. To absorb N input from rainfall (about 10 kg·ha−1·year−1 at the study area) and litter decomposition, the upper resin layer covered with a 0.13 mm nylon mesh on the top was installed. However, the water table at the site is very high during the summer time. Therefore, a modified resin core method was adopted in this study during the summer to prevent the loss of mineralized N from the PVC tube (Figure 1).
For resin-core incubation, five sub-plots were established randomly within each plot. On 15 January 2014, after clipping and removal of plants and litter, sharp-edged PVC tubes were driven into two soil layers (0–10 and 10–20 cm) to sample soil cores and make resin-soil core combinations within each sub-plot. Based on the results from a similar site [31], the resin-soil core combinations were retrieved for chemical analysis, and new resin-soil core combinations were incubated at three-month intervals. The procedure was repeated every three months over the course of a year. Additional soil cores were sampled in adjacent locations to quantify soil initial ammonium and nitrate concentrations [31]. The collected soil and resin-soil core samples were transported to the laboratory and stored at 4 °C within a month until analysis.

2.5. Inorganic N Measurement and Data Calculation

Soil ammonium and nitrate were determined by the methods reported by Yan et al. [31] and Shibata et al. [38]. The NH4+–N and NO3–N concentrations were analyzed using a Flow-Injection Autoanalyzer (Bran+Luebbe, Hamburg, Germany). The resin bags were washed with distilled water and dried at room temperature (28 °C–32 °C), while the resin NH4+–N and NO3–N were extracted by shaking the resin bags with 2 M KCl for 12 h [31].
Soil N mineralization was estimated based on N levels in the resin and in the soil before and after incubation. Net N mineralization rates during each incubation period were calculated from differences of inorganic N concentrations between initial and incubated samples. Annual net N mineralization was calculated by summing the values from the four incubation periods in the year.

2.6. Measurement of GHG Fluxes

The static chamber method was used to estimate monthly GHG (CO2, CH4, and N2O) emissions [39] from January to December in2014. Each chamber consisted of a PVC cylindrical compartment (diameter: 20 cm, height: 25 cm) and a sealed cap made of silicone. Owing to the uniform topography at the site, six chambers were set up in each plot and a total of 24 chambers were installed for each replication in early January 2014. Gas sampling was conducted in the middle of each month. The day before sampling, the bottom section was inserted 5 cm into the soil with 20 cm of the PVC cylindrical compartment sitting above the soil surface. In each sampling day, a 30 mL gas sample was taken with a sampling probe from a suction hole during 30 min every 10 min (0, 10, 20, and 30 min) after the chamber sections were closed with a sealing cap. The sampled gases were stored in the empty bottles of 20 mL, and gas samples from each chamber were collected between 10:00 and 14:00 on each sampling date.
Atmospheric pressure was measured with an aneroid barometer (HA29DYM3, Heng Odd Instrument Co., Ltd., Beijing, China). After sampling, CO2, CH4, and N2O concentrations were measuredusing a 7890A gas chromatograph (Agilent Technologies Co. Ltd., Palo Alto, CA, USA). The gas flux was calculated by the following equation [40]:
F = M × H V 0 × P P 0 × T 0 T × d c d t
where F represents the gas flux (mg·m−2·h−1); M is the molar mass of the gas to be measured; H is the height from the soil surface to the top of the chamber; V0 is the molar volume of the gas; P is the atmospheric pressure at sampling site; T is the absolute temperature; P0 and T0 are air pressure and absolute temperature under the standard state condition; dc/dt is the rate of change in gas concentration. As a comparison among the treatments, estimated annual cumulative fluxes of GHGs were calculated by multiplying monthly mean fluxes by time.

2.7. Statistical Analysis

All results are reported as mean ± standard deviation. A one-way ANOVA was conducted to compare soil temperature, soil water content, and rates of GHG fluxes (CO2, CH4, and N2O) among the thinning treatments, while a two-way ANOVA (four thinning treatments and two soil depths) was used to determine the significance in net N mineralization rate. A Duncan’s multiple range test was used to determine the significance of differences between treatment means. All statistical analyses were carried out at α = 0.05. Relationships between soil environmental factors and GHG fluxes or N mineralization rates were evaluated using Pearson’s correlation analysis. All analyses were performed using the SPSS 10.0 statistical software package (SPSS Inc., Chicago, IL, USA).

3. Results

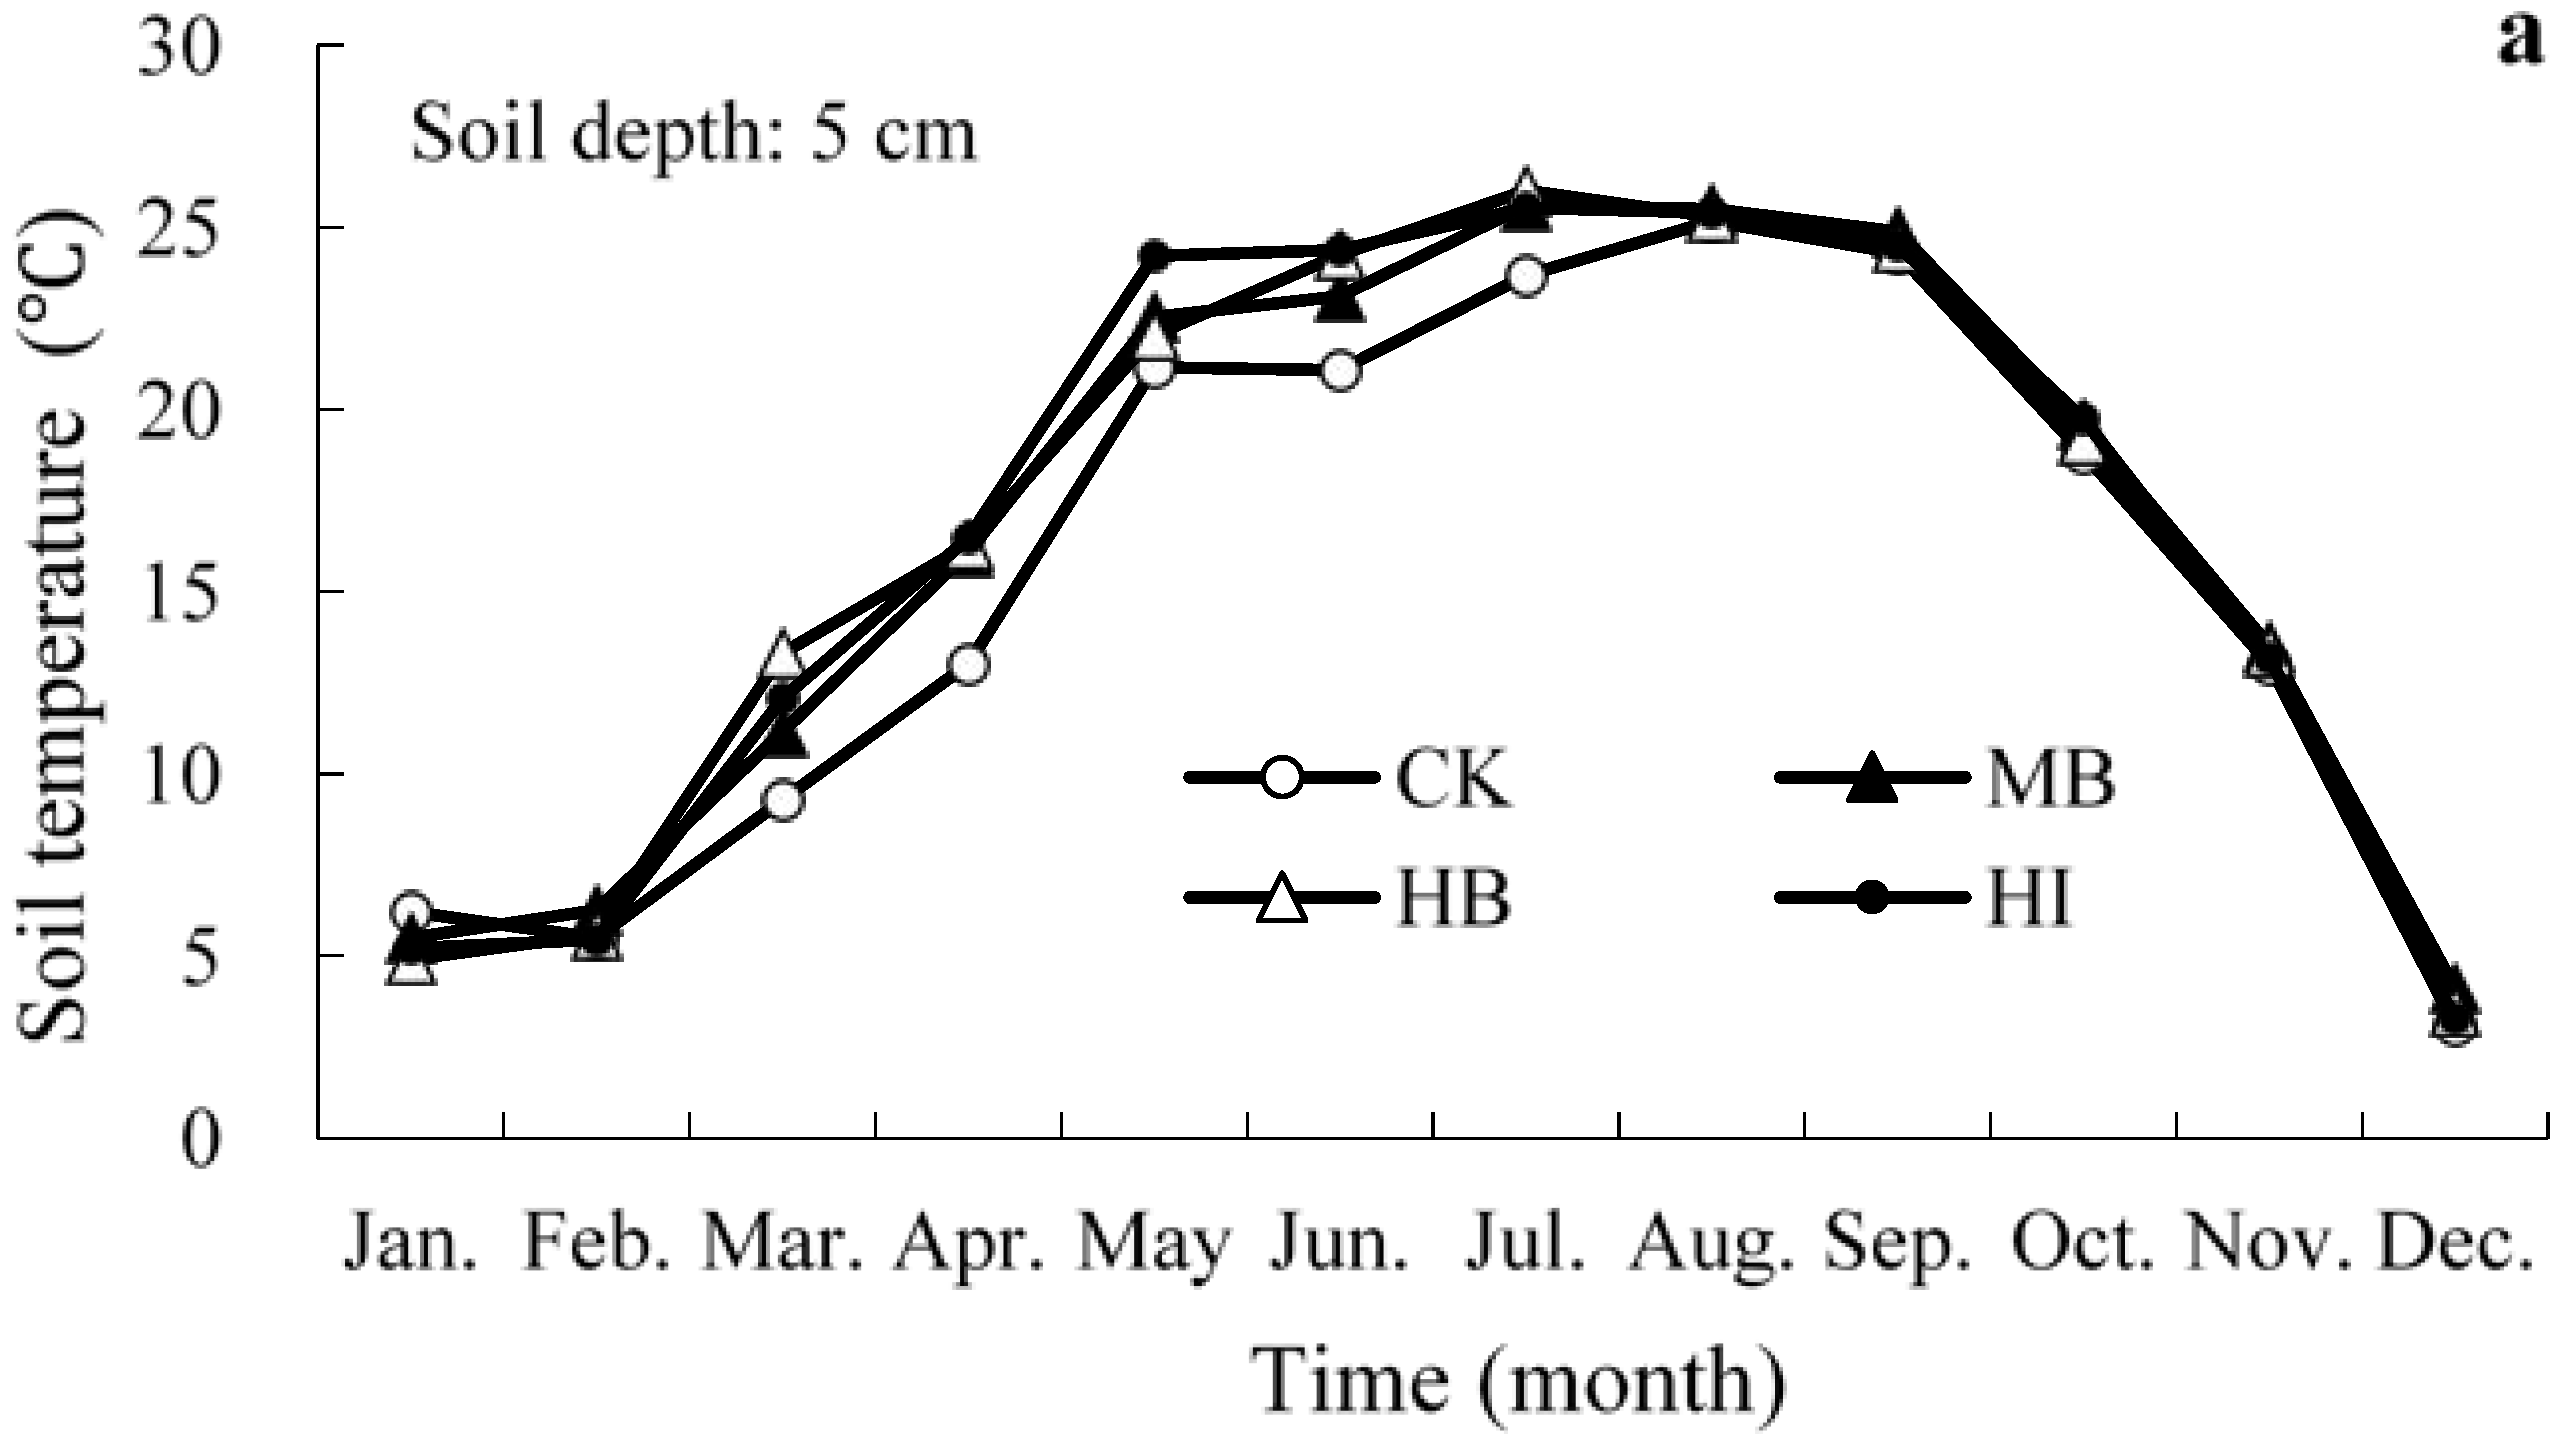
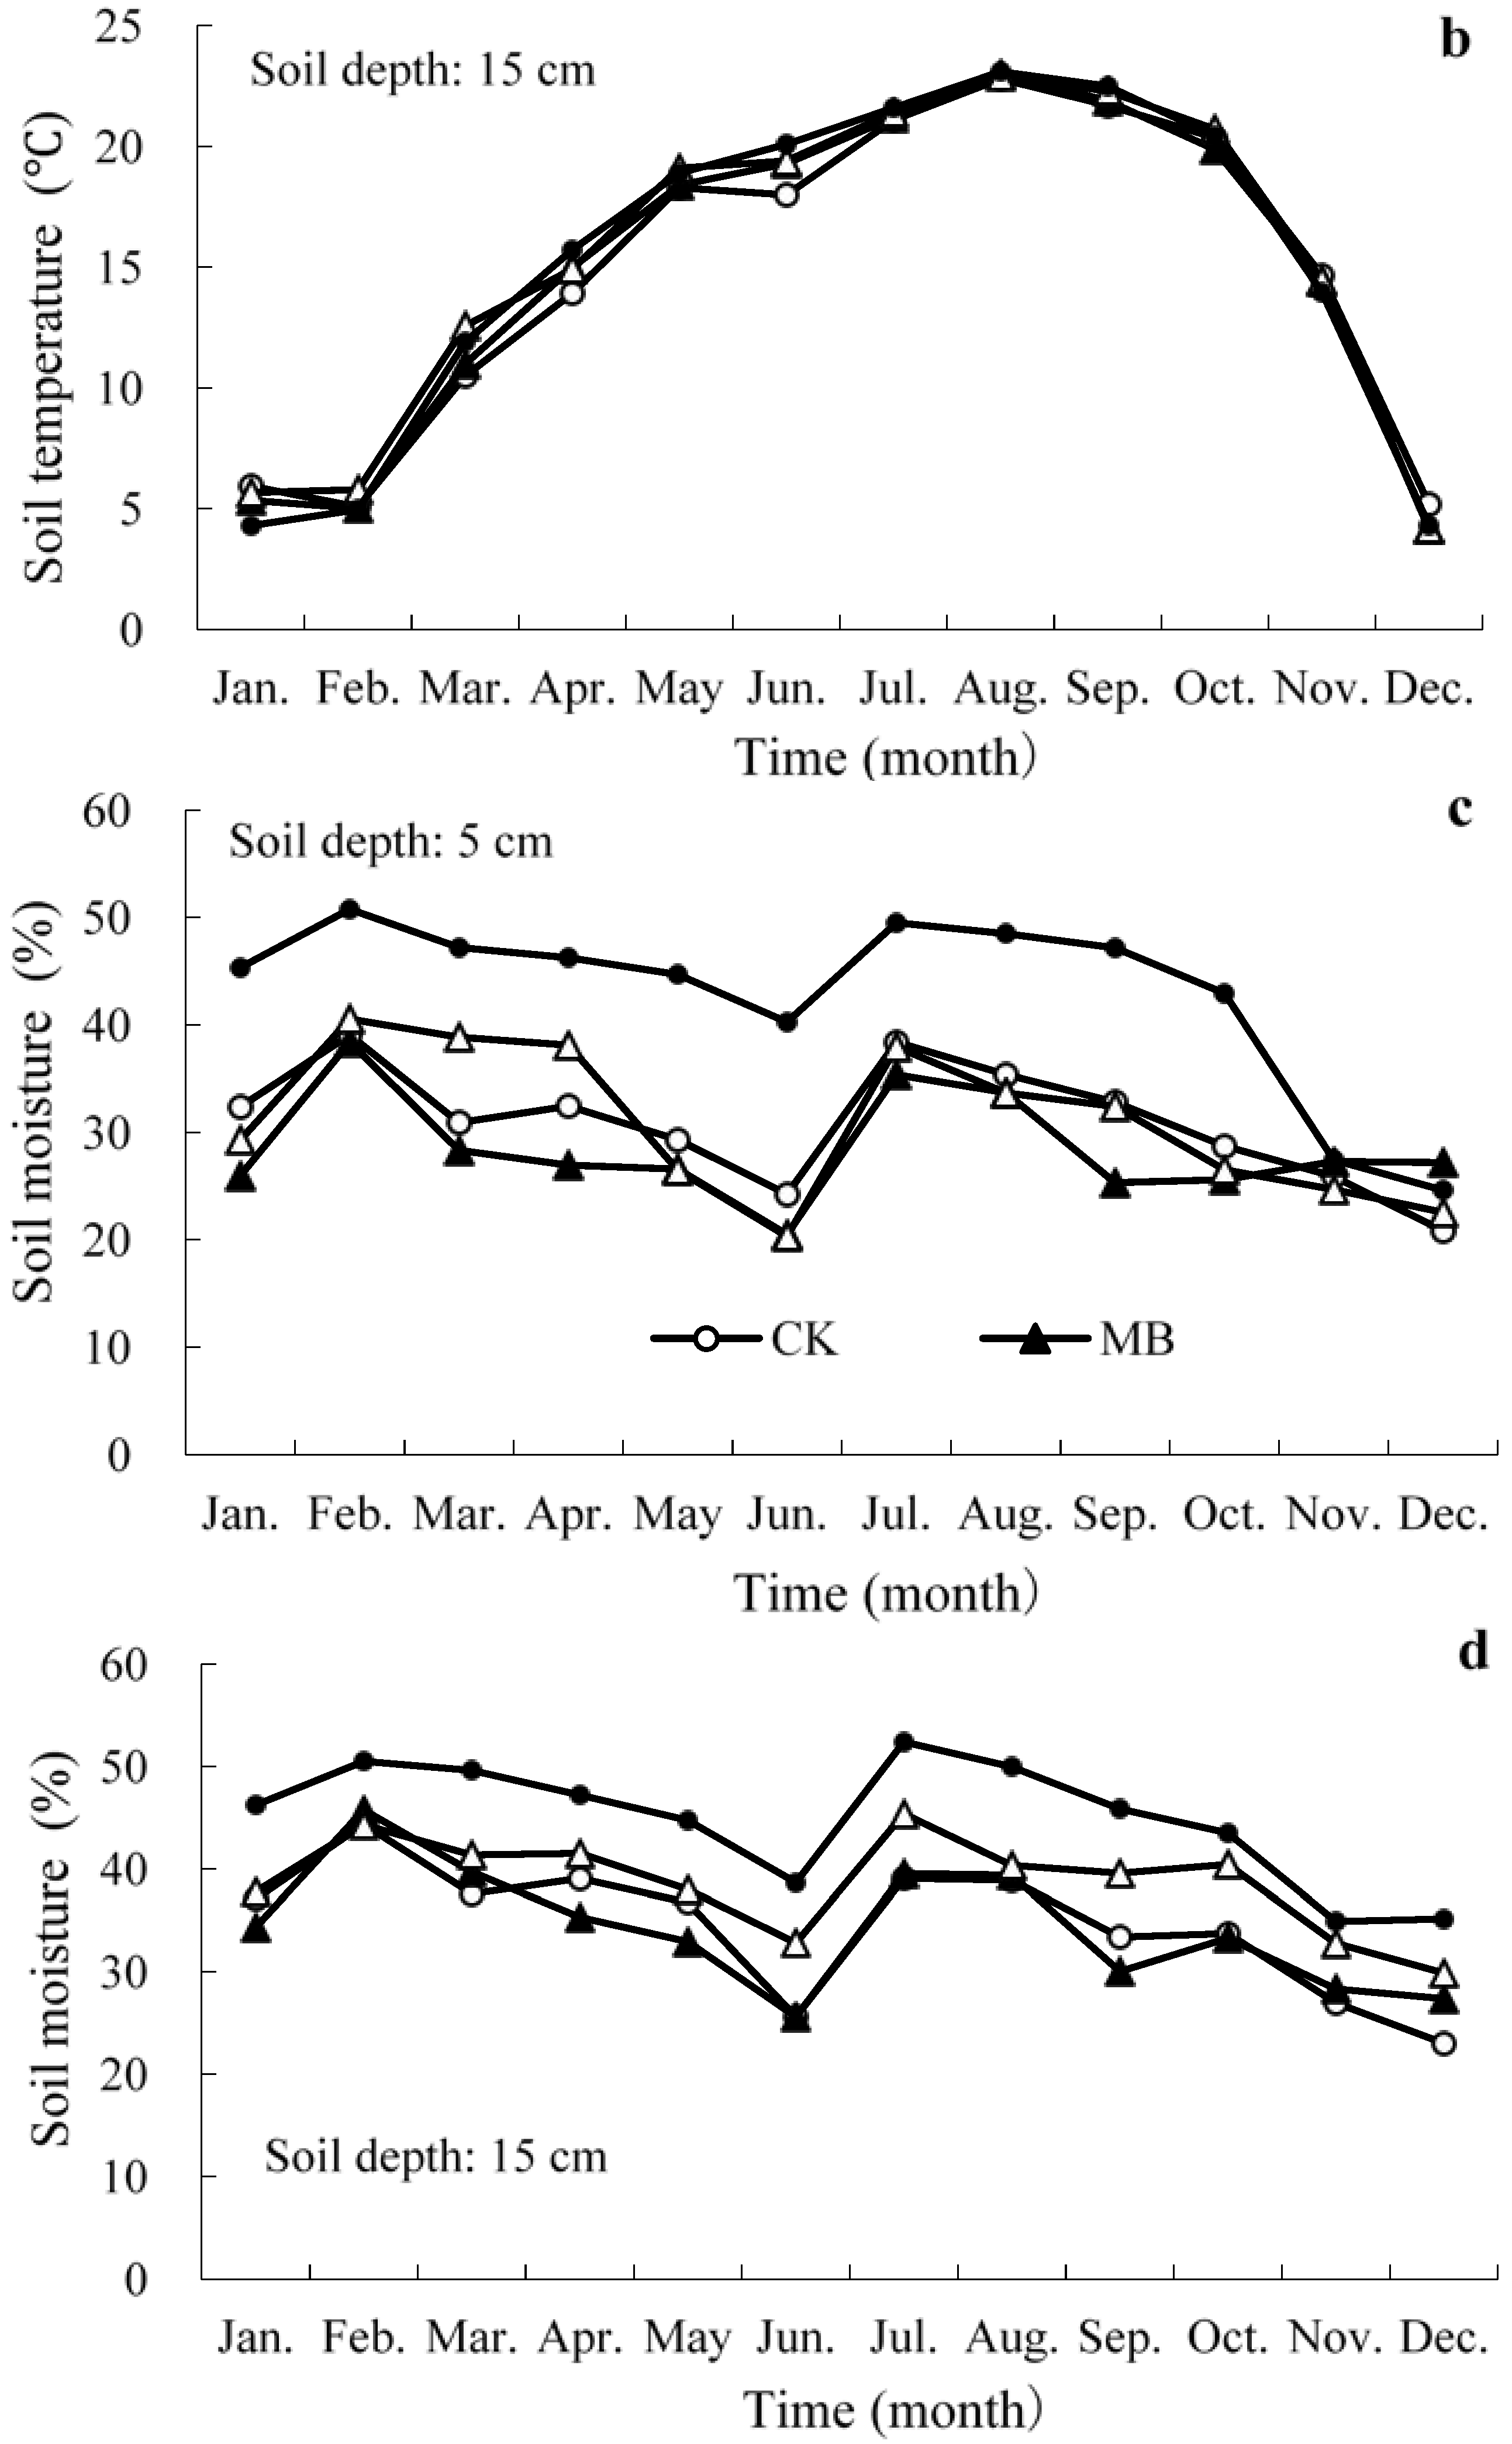
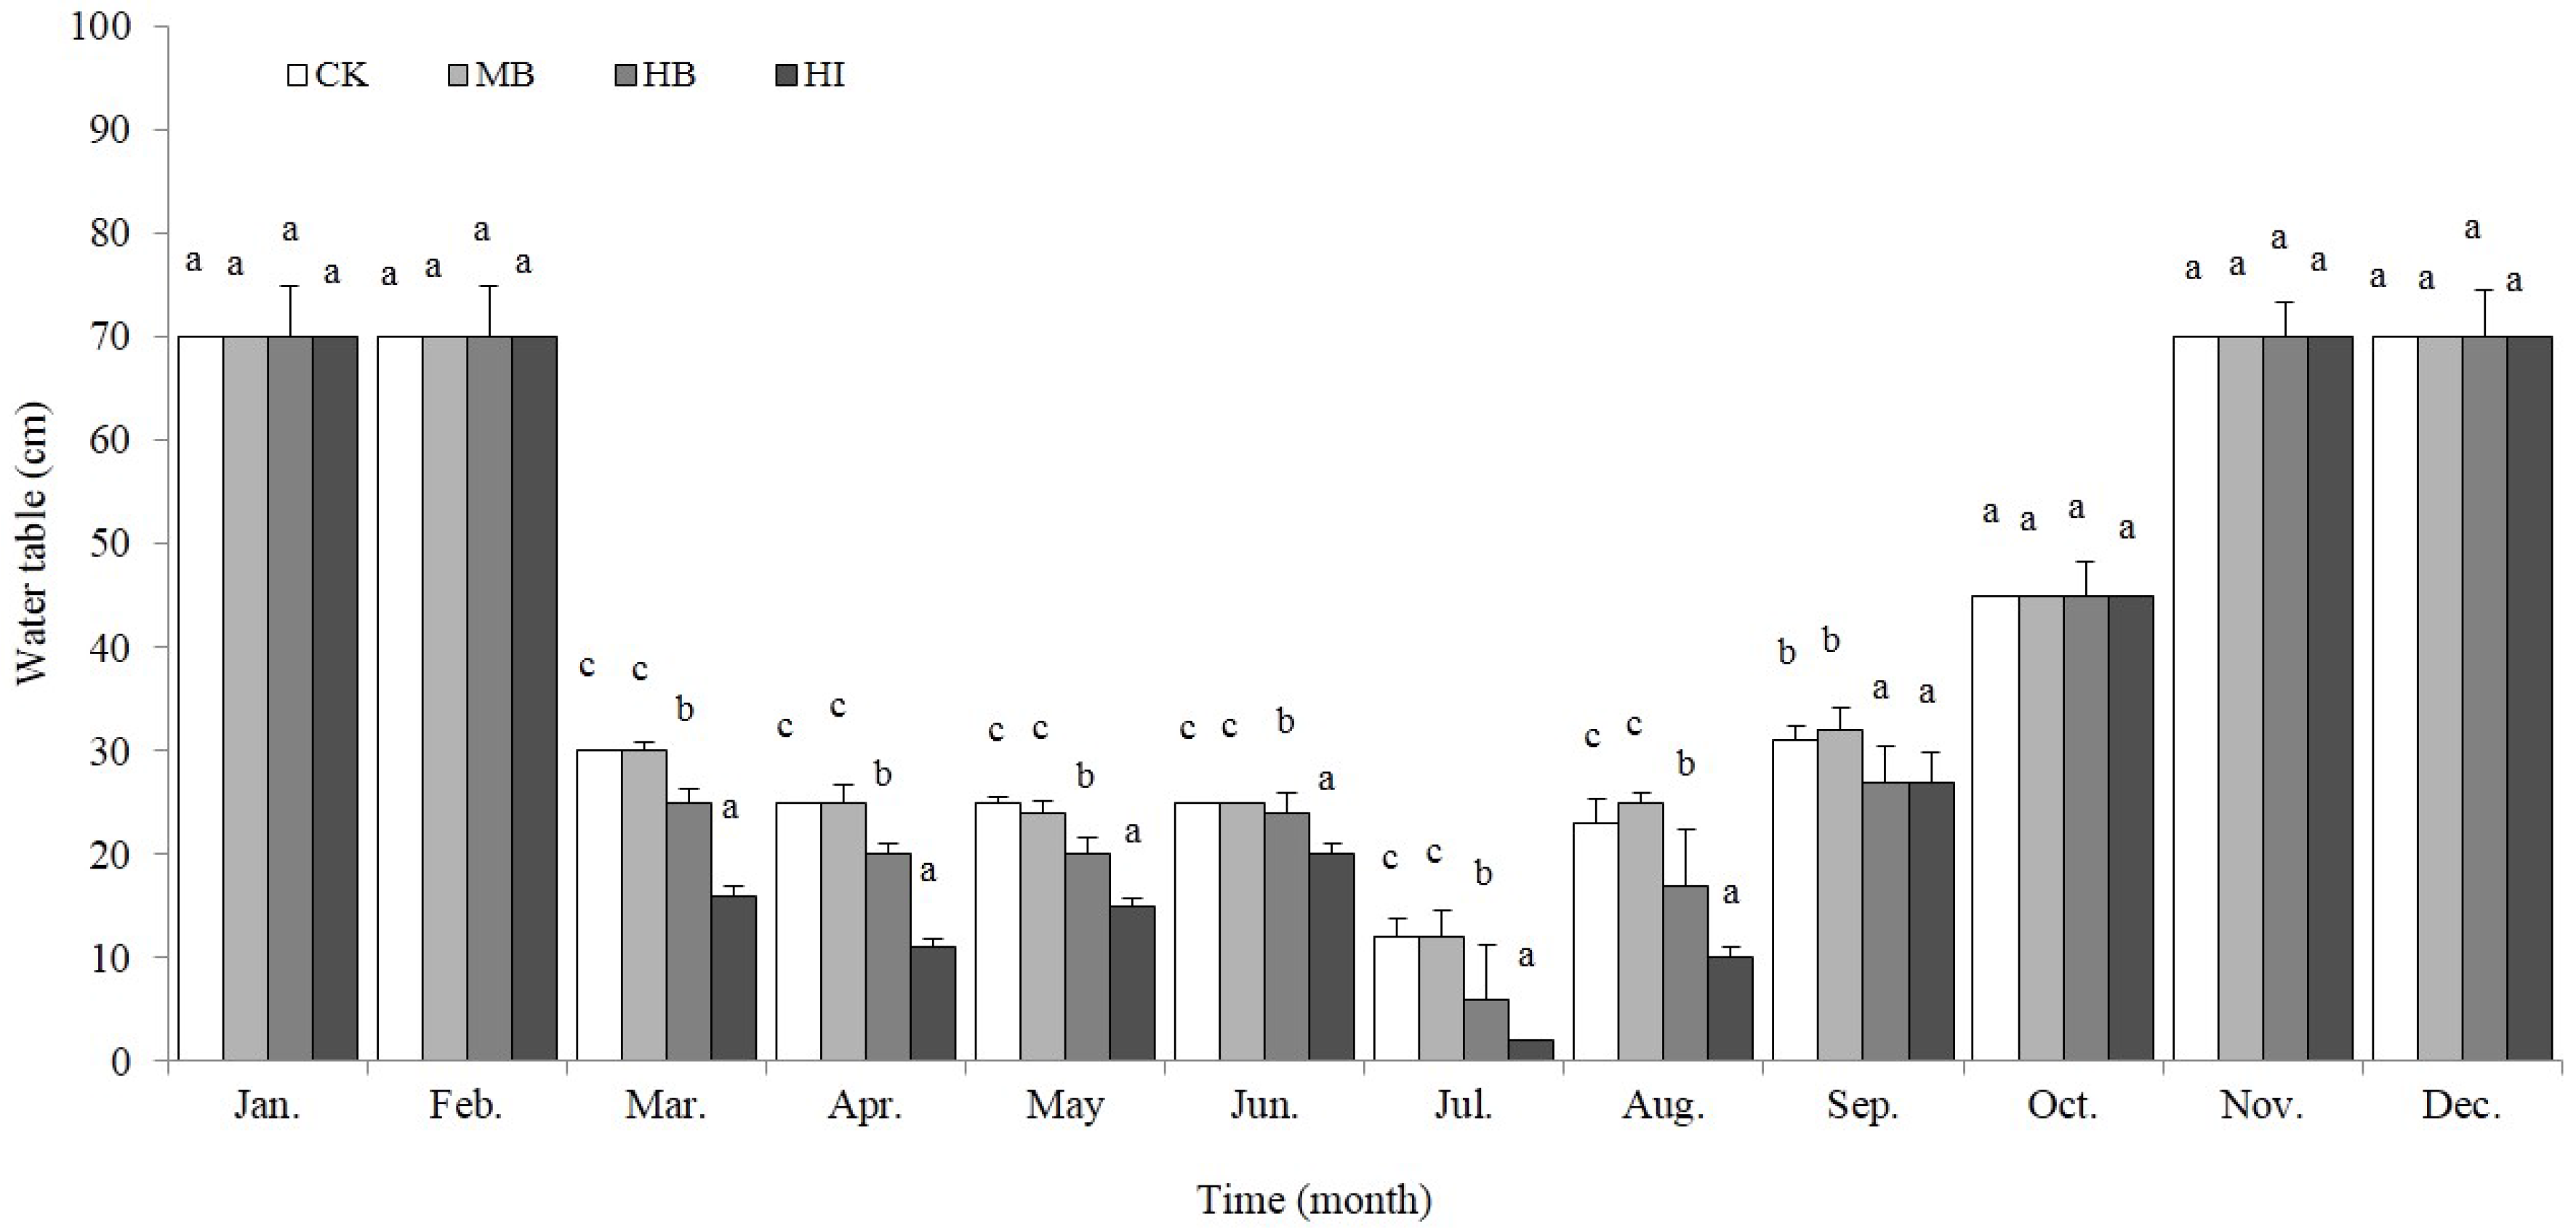
3.1. Variation in Soil Environmental Factors

Variations of soil temperature over time at two soil depths were similar, with the highest in summer and the lowest in winter (Figure 2a,b). However, mean annual soil temperature across the four treatments at the 5 cm depth was 1.2 °C warmer than that at the 15 cm depth, even though the difference was not significant. Soil temperature in the thinning treatments was slightly higher than that in the CK, but no significant difference was detected. For example, the mean annual soil temperature at the 5 cm was 15.4, 16.5, 16.5, and 16.6 °C for CK, MB, HB, and HI respectively.
The monthly soil water content was similar at the two soil depths (Figure 2c,d), but annual mean soil water content at the 15 cm depth was 14.4% greater than that at the 5 cm. The soil water content averaged over 12 months was significantly lower (p < 0.01) in CK, MB and HB than in HI at both the 5 and 15 cm depths, indicating that the HI treatment significantly enhanced soil moisture retention at the two soil depths.
Thinning treatments significantly affected the soil water table depth during the growing season (from March to September), but not in the non-growing season (Figure 3). The highest thinning intensity had a higher mean water table during the growing season and that the CK and MB had the lowest. Compared to CK, high intensity thinning (HB and HI) raised water table by 18.4% and 41.0%, respectively.

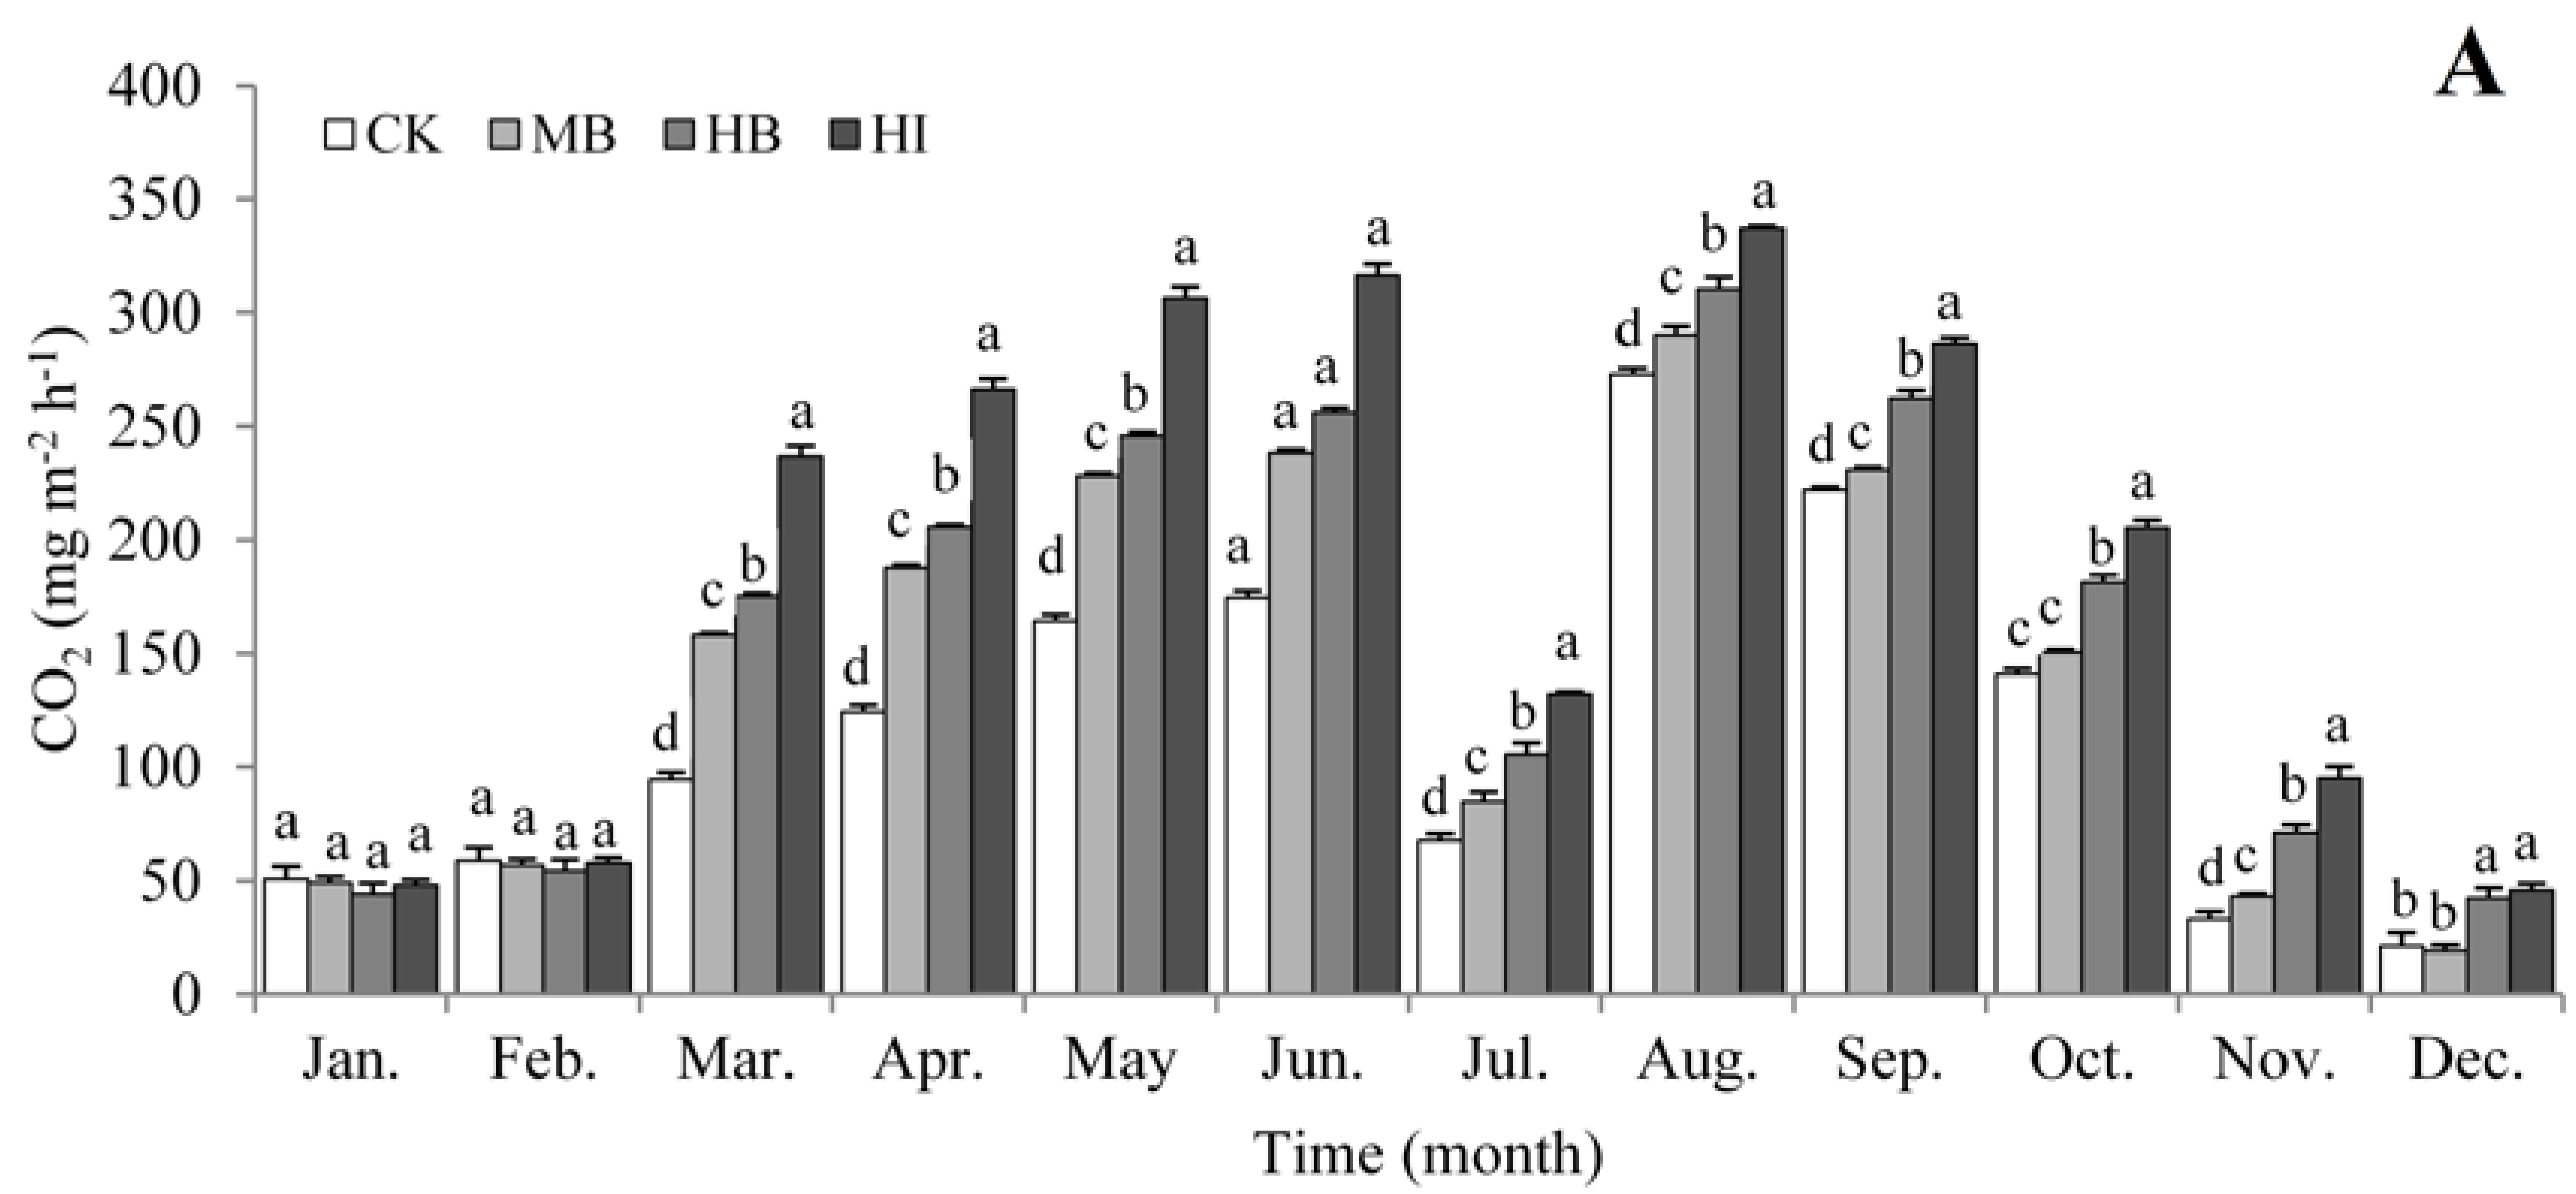
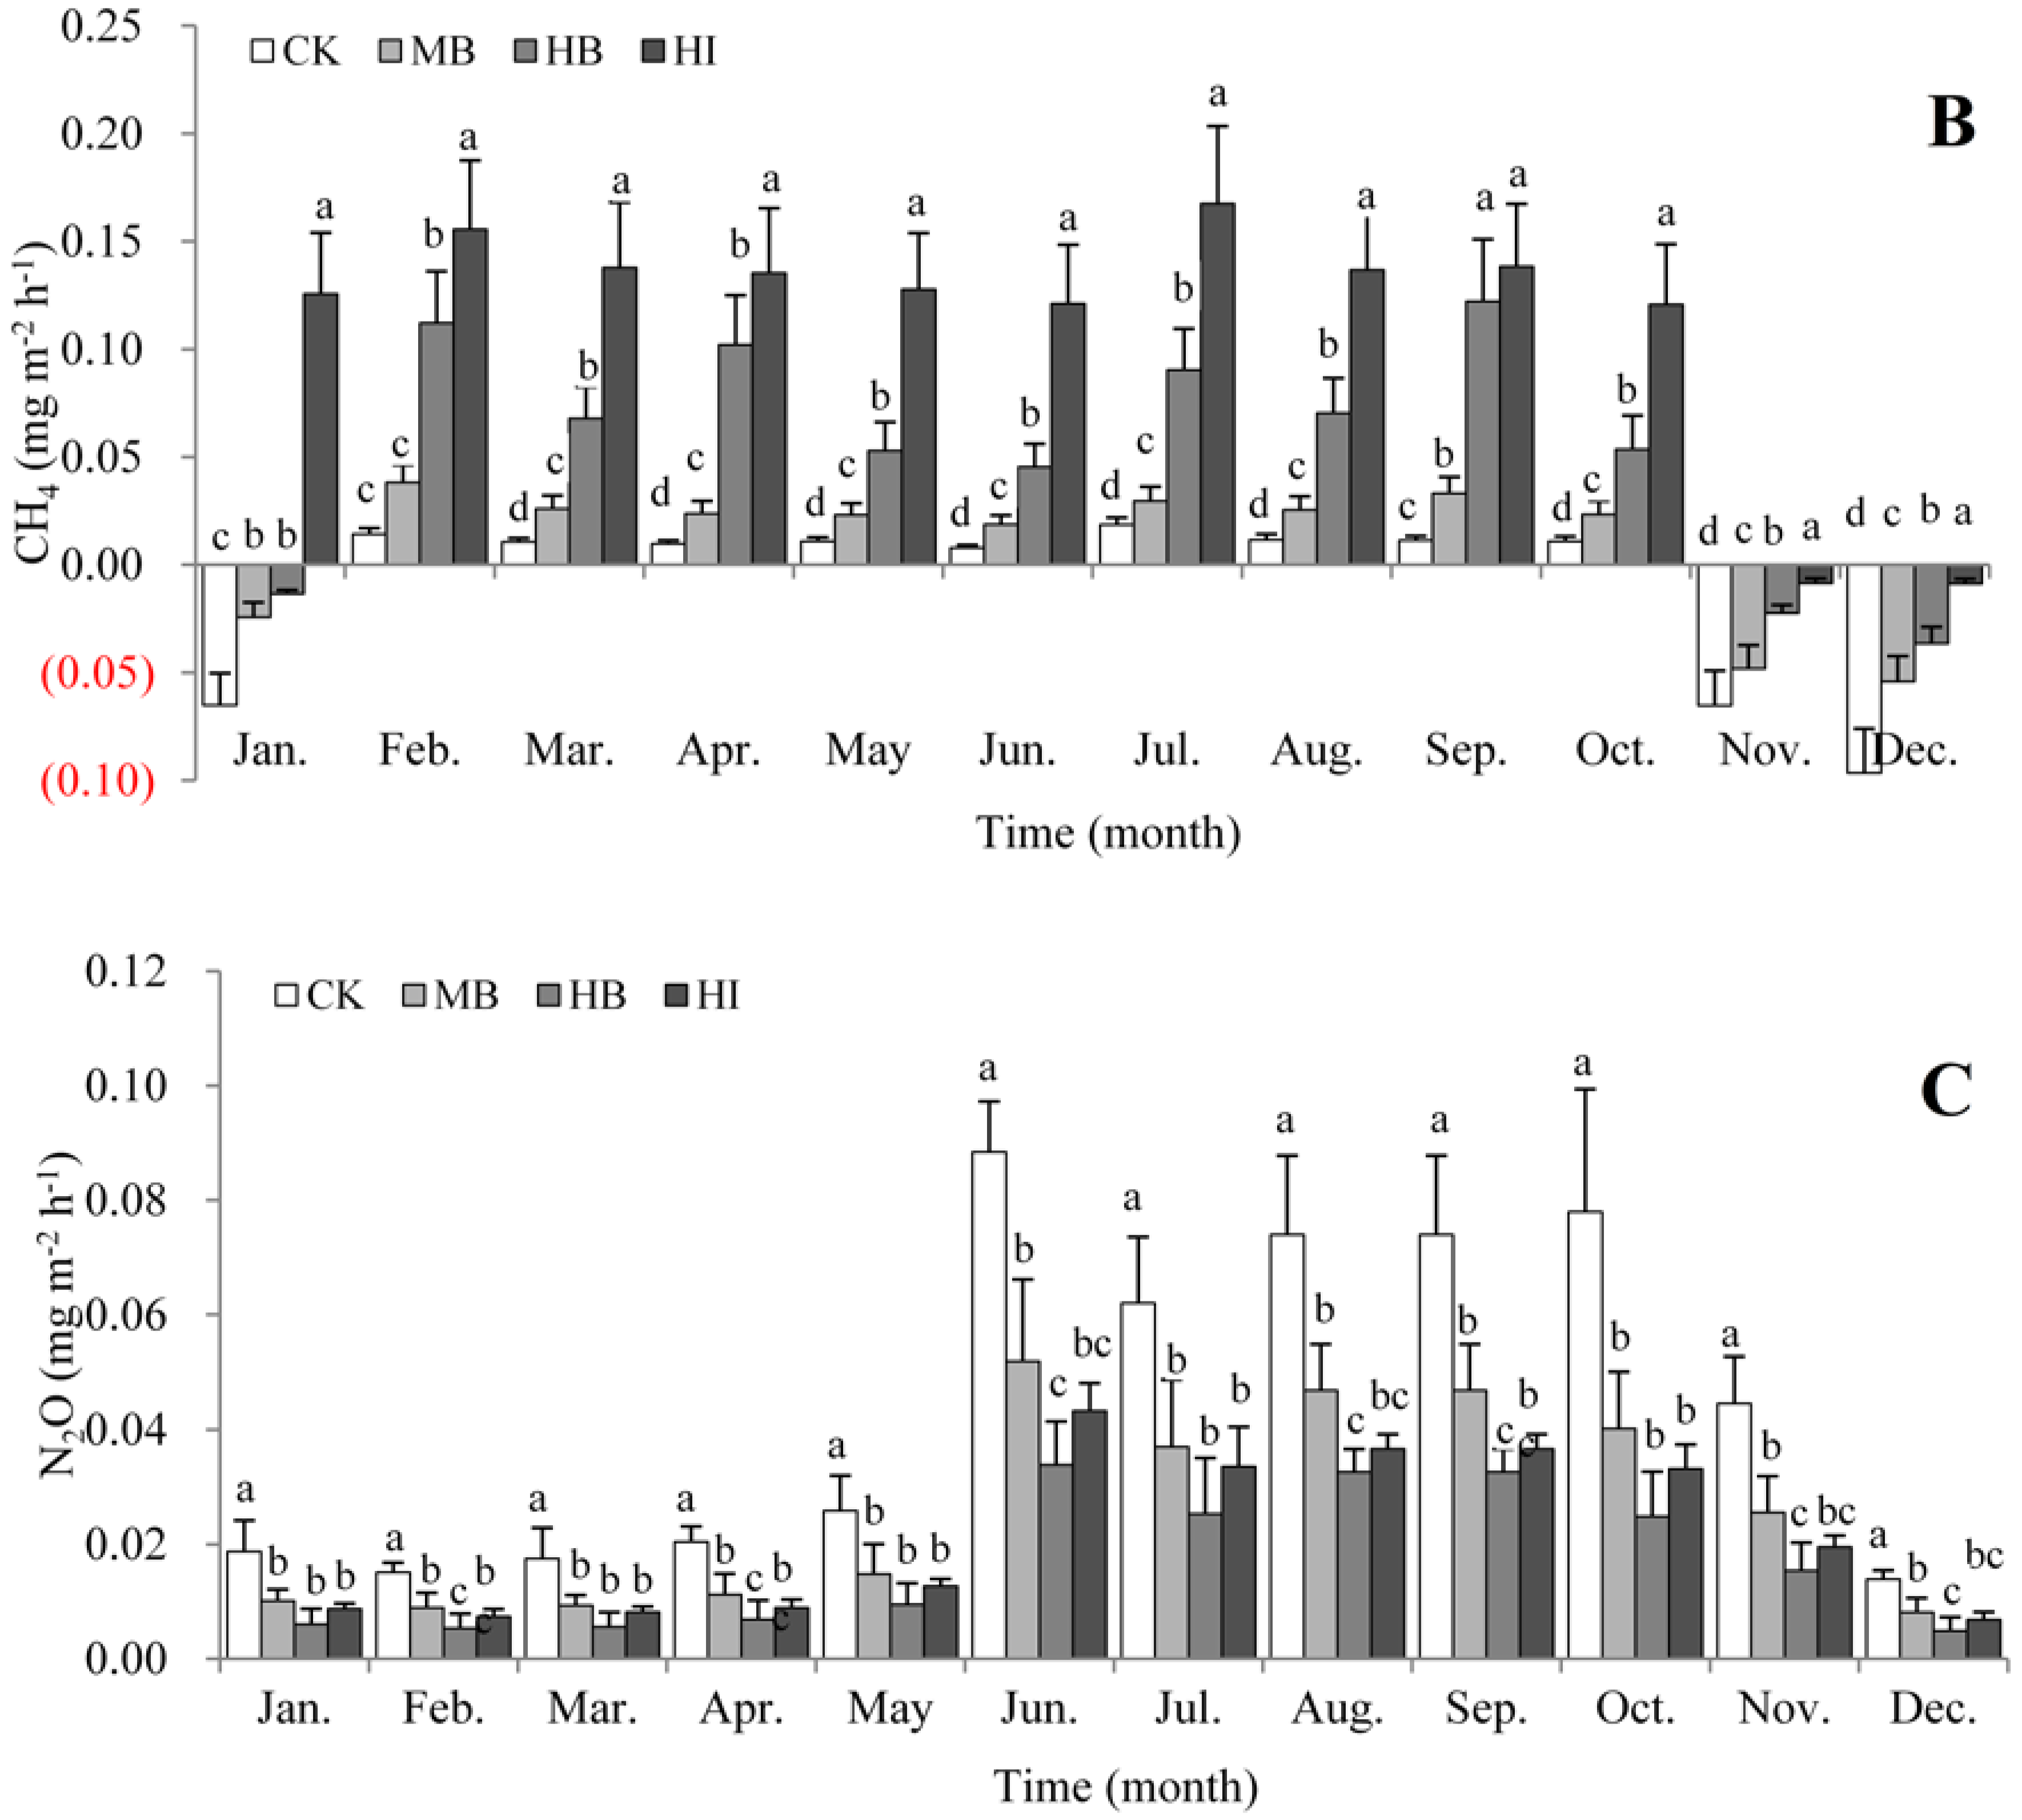
3.2. Variation in Fluxes of GHGs

The CO2 emissions were low in January and February and increased with soil temperature during the growing season (except in July, when surface waterlogging occurred), with a peak in August for all the treatments (Figure 4a). Correlation analysis showed a significantly positive relationship between soil temperature and CO2 emission rate (Table 1). Mean emission rate of CO2was approximately 4.2 times higher during the growing season than in the winter. From March to November, there was a significant difference in average CO2 emission rate among the treatments, with the ranking of HI > HB > MB > CK (Figure 4a). However, the average CO2 emission rate was not significantly different among the treatments in January and February, but significantly different in December, with the order of HI > HB > CK > MB. Throughout the year, the estimated CO2 emissions were the lowest in the CK treatments, with an average daytime emission rate of 118.7, 144.7, 162.8, and 194.5 mg CO2 m−2·h−1 for CK, MB, HB, and HI, respectively.
The CH4 fluxes were negative in winter except for the HI treatment in January (Figure 4c), with the rate ranged from 0.008 to 0.155 mg·m−2·h−1 in the other seasons. Similar to N2O emission rate, mean CH4 emission rate was significantly different among the treatments in each month, with the average daytime emission rate following the order of HI (0.112 mg·m−2·h−1) > HB (0.054 mg·m−2·h−1) > MB (0.010 mg·m−2·h−1) > CK (−0.010 mg·m−2·h−1).
The largest annual emissions of CO2 and CH4 were in the HI treatment, at1.71 kg·m−2·year−1 and 982.9 mg·m−2·year−1, respectively, while the highest emission of N2O was in the CK, at 389.5 mg·m−2·year−1 (Table 2). Compared to CK, the mean annual emission of GHGs in MB, HB, and HI increased by 23.3%, 37.2%, and 63.9%, respectively, for CO2, and 190.3%, 613.6%, and 1184.4%, respectively, for CH4, whereas they were decreased by 41.6%, 61.9%, and 52.0%, respectively, for N2O.

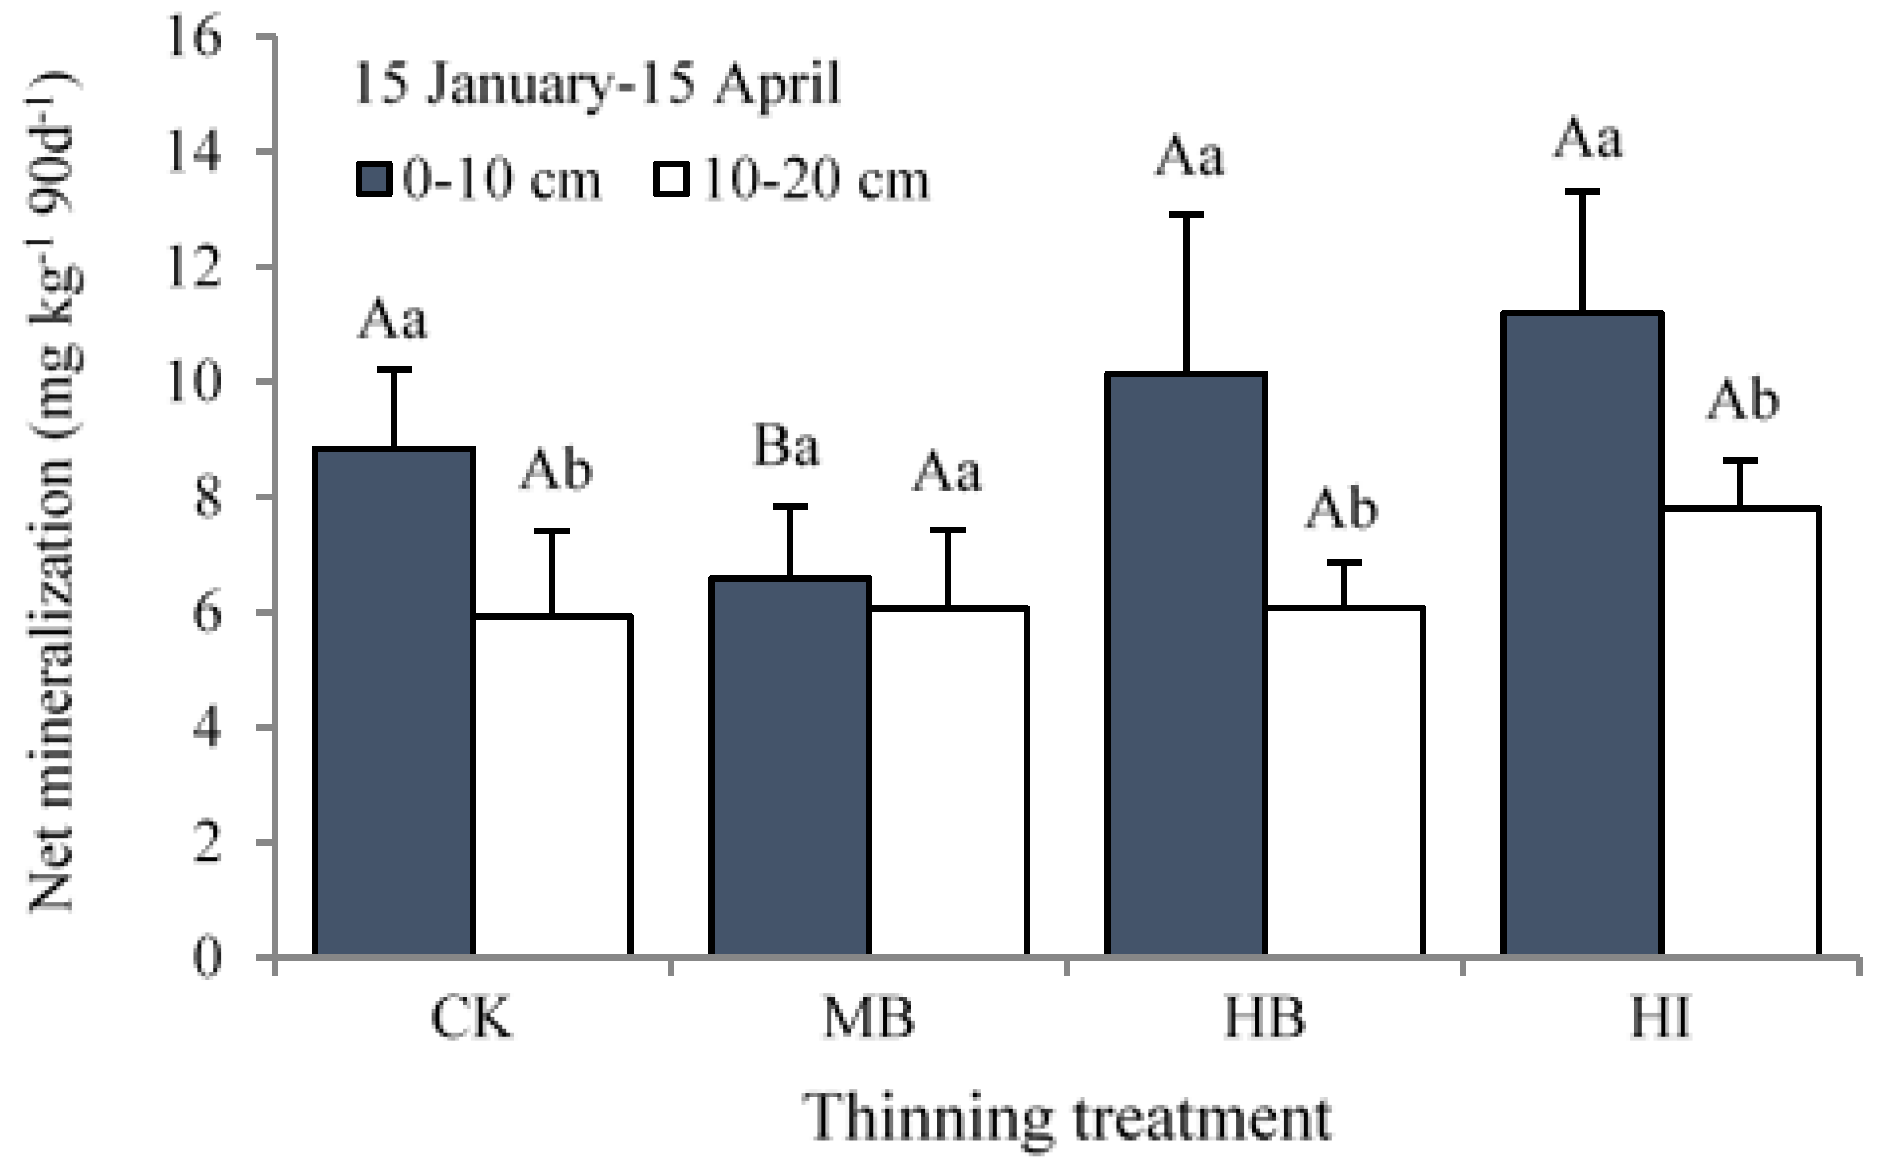
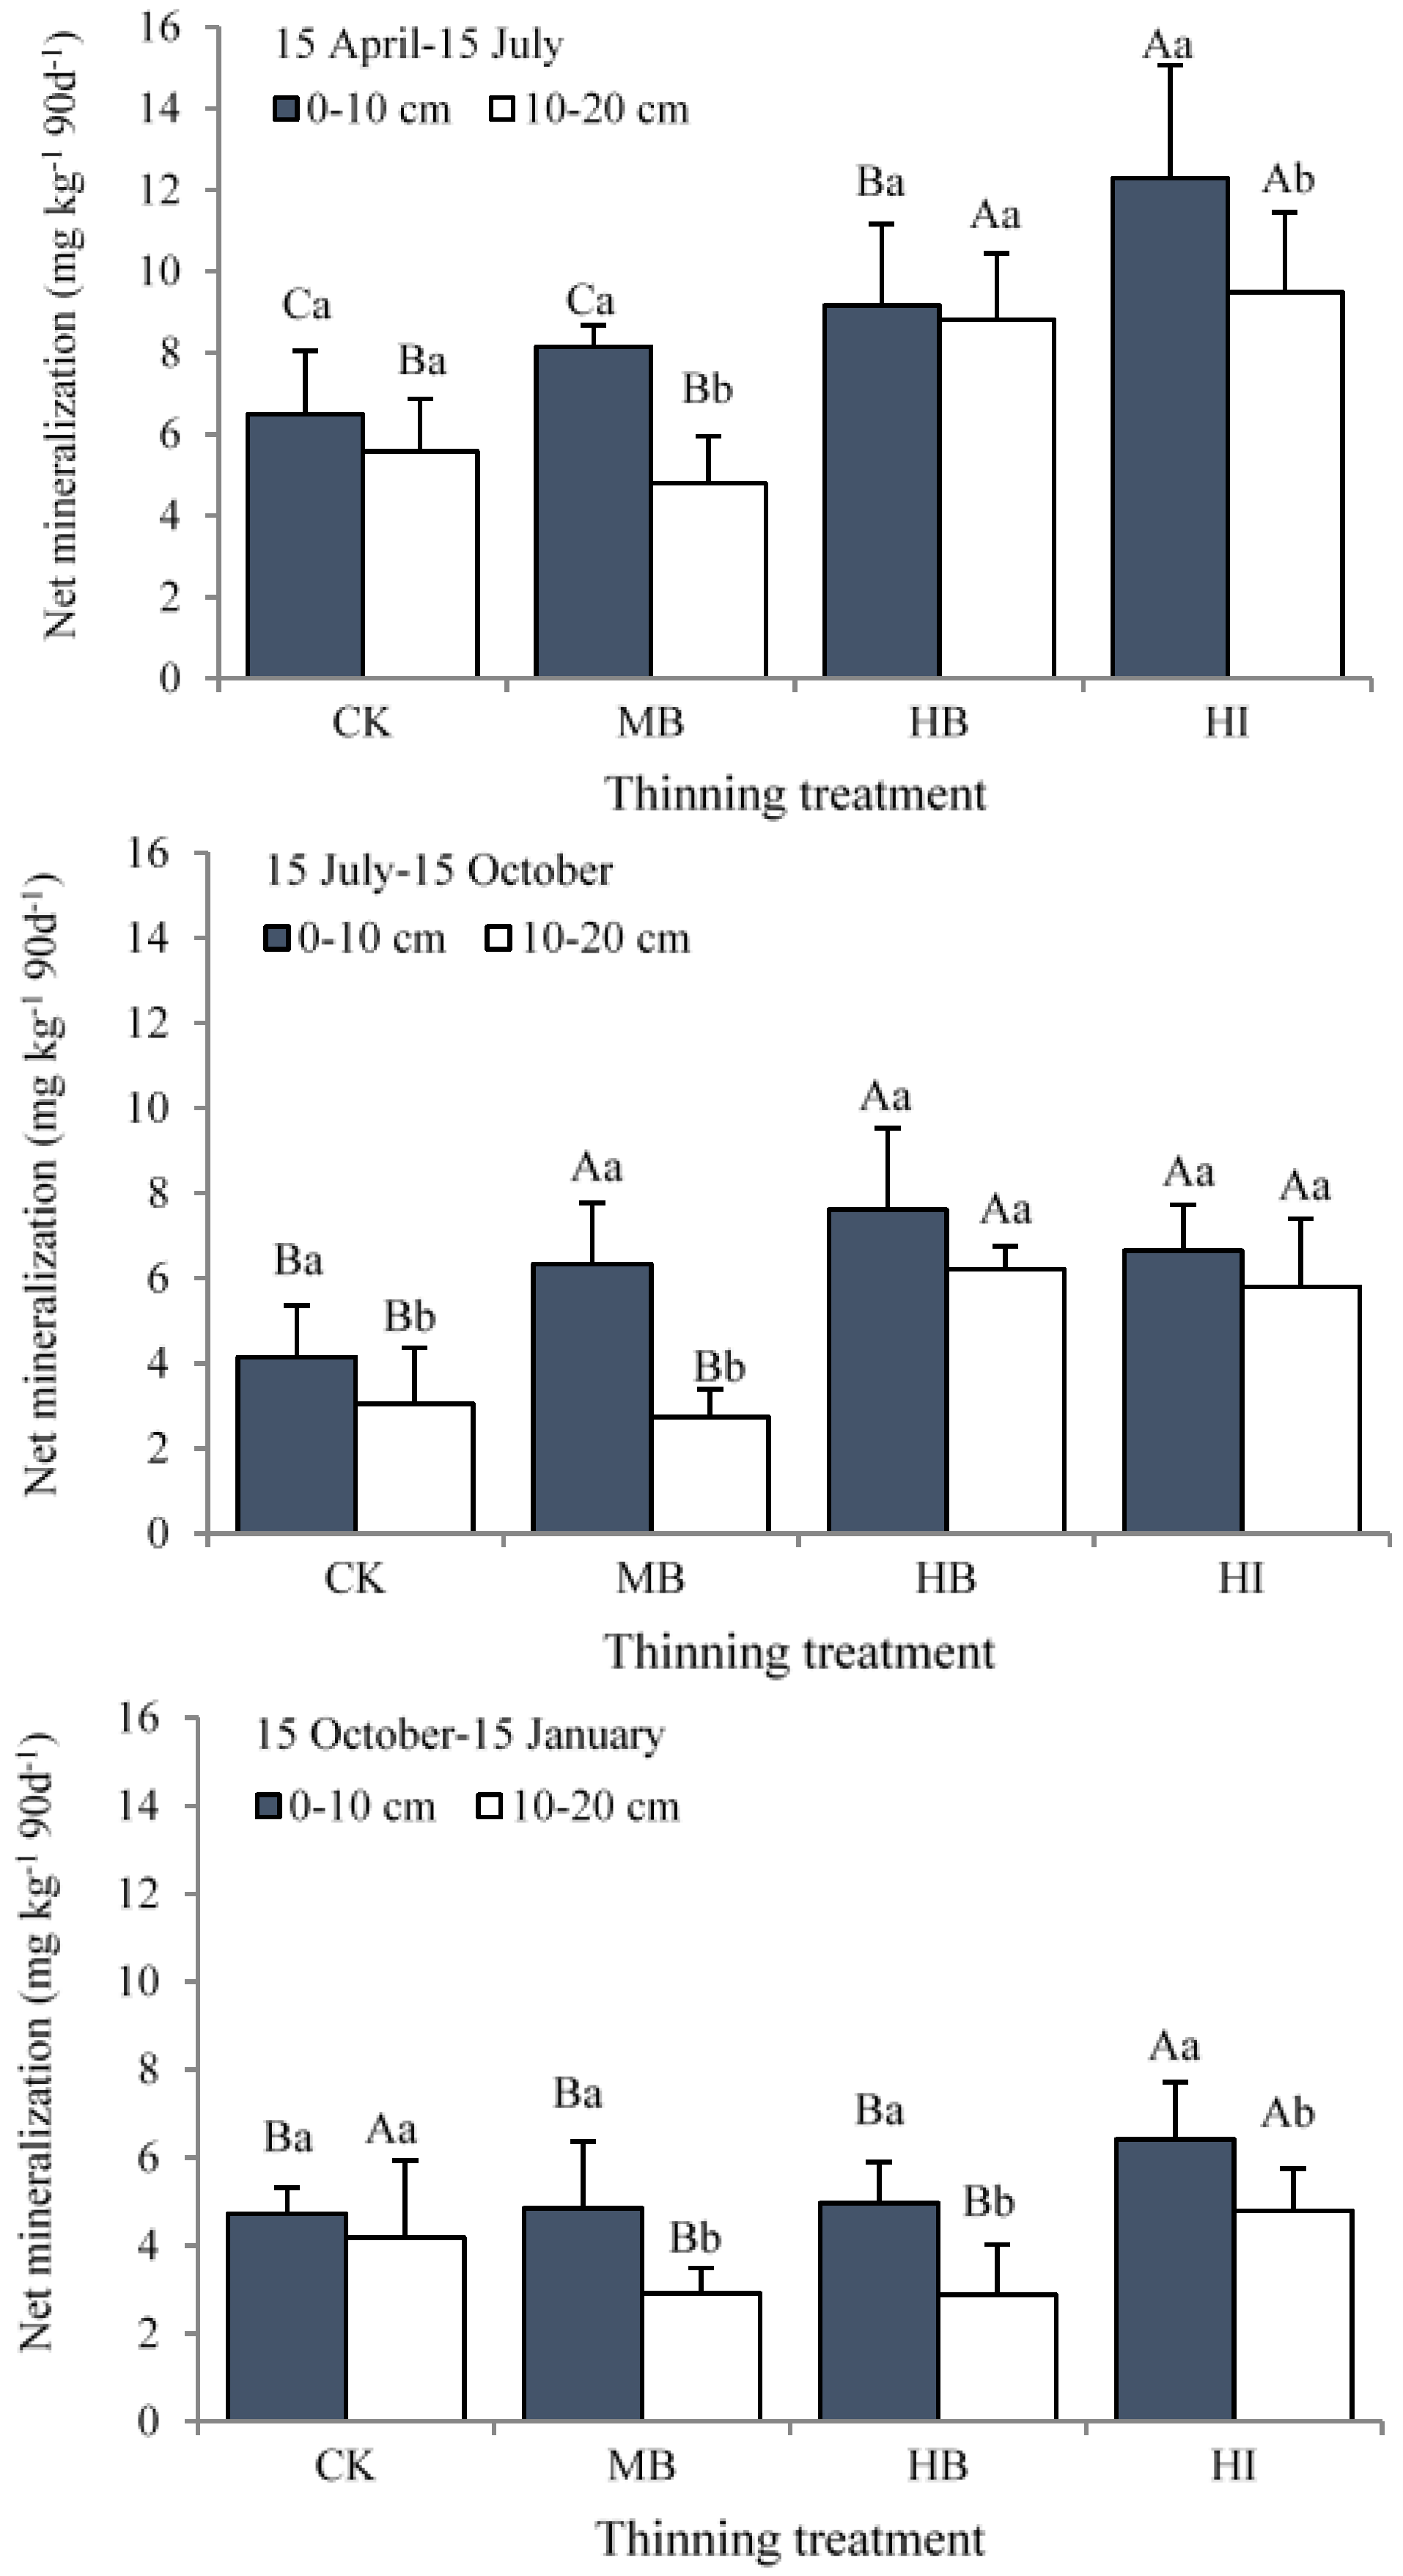
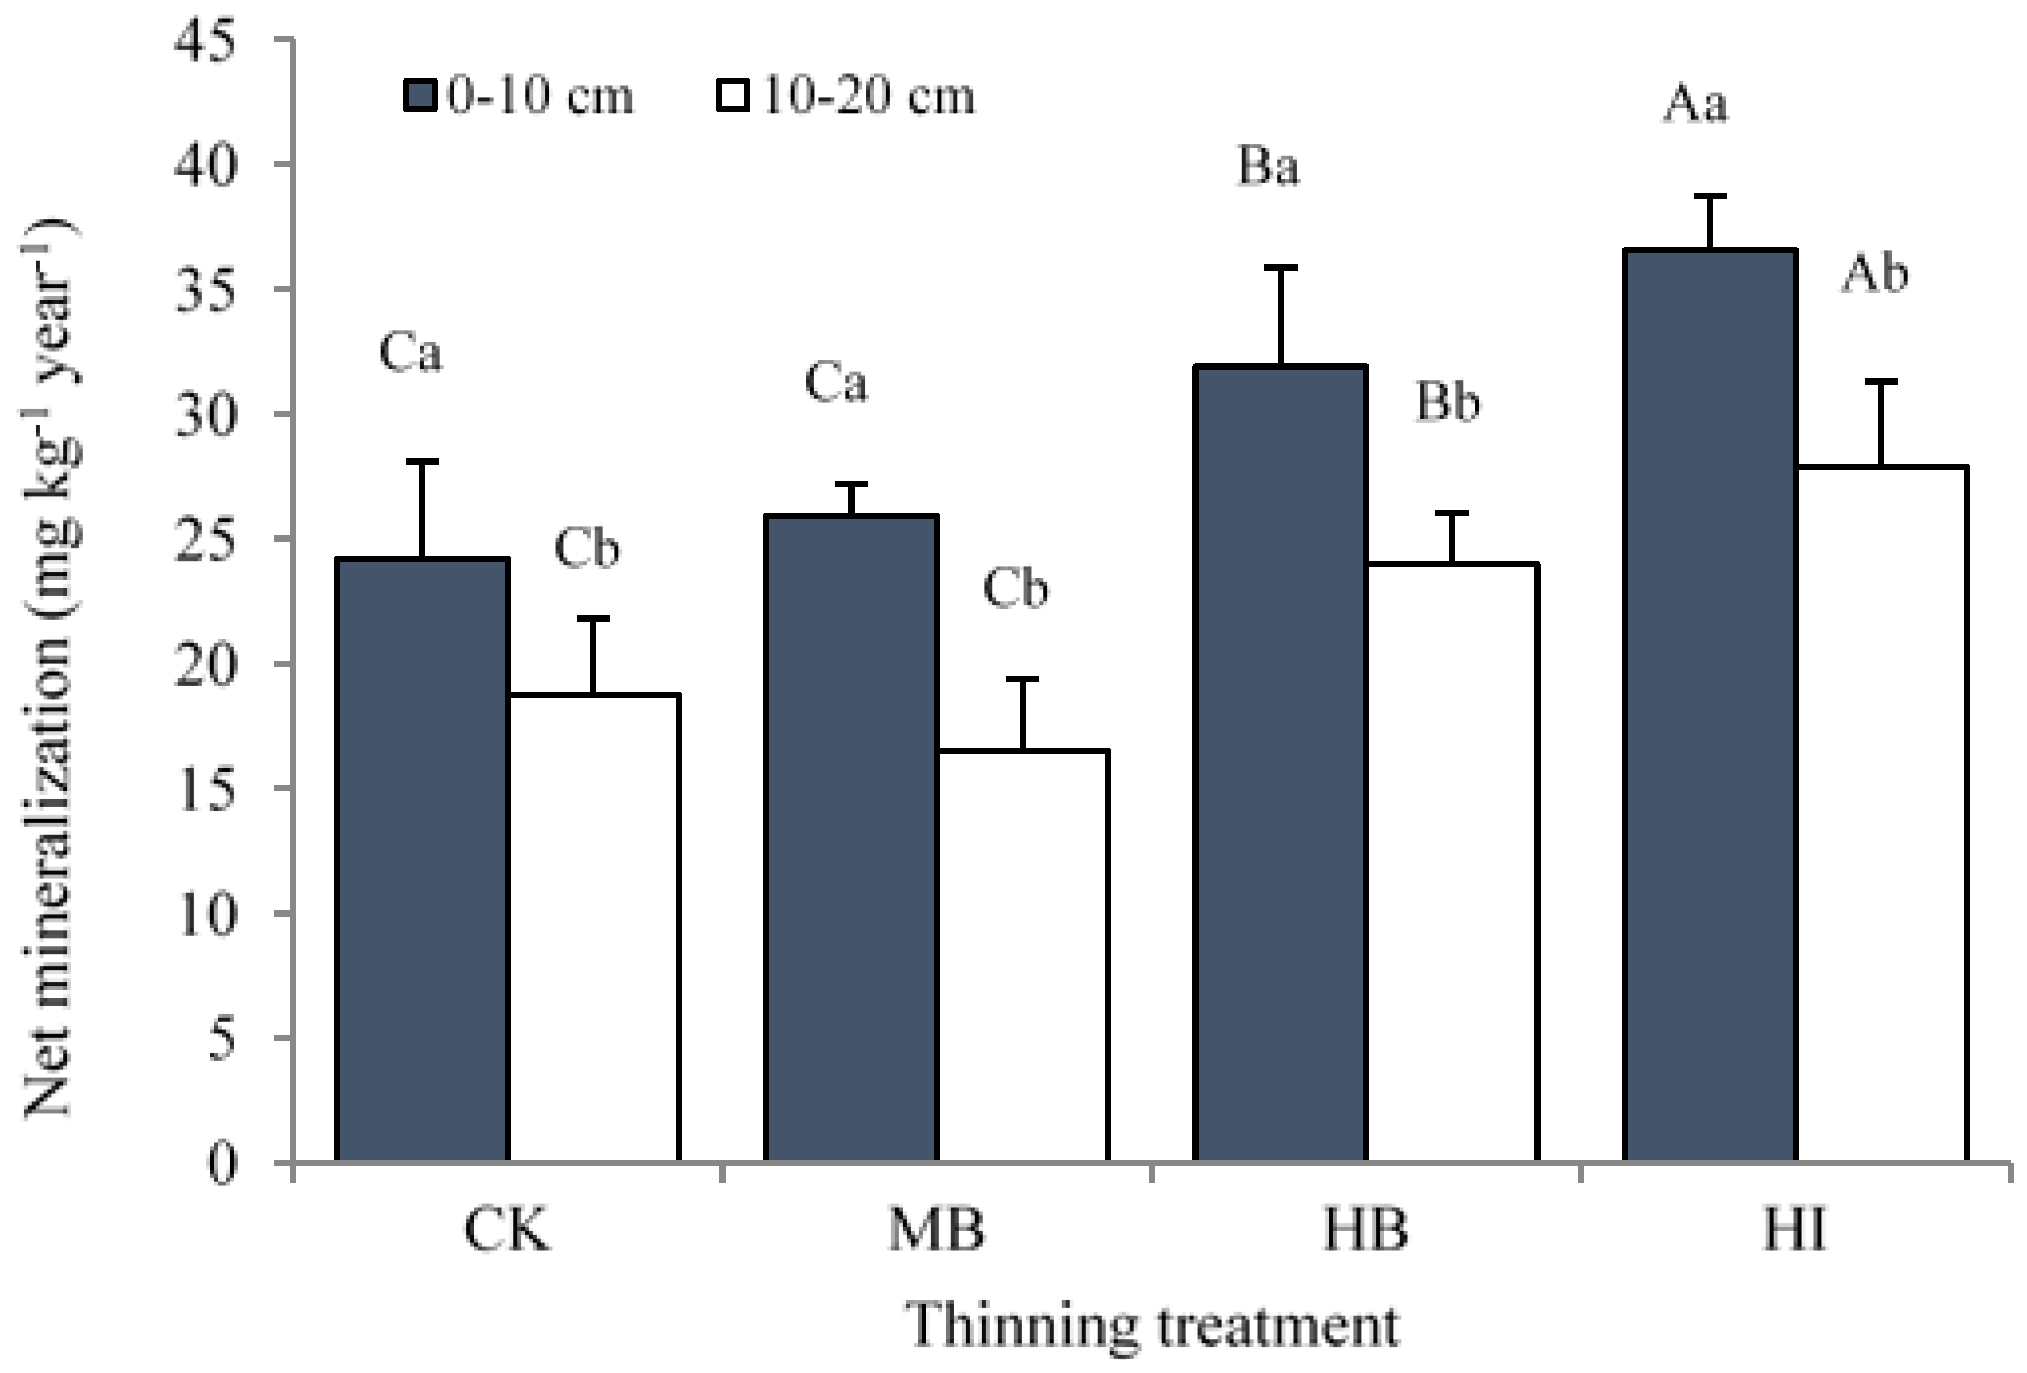
3.3. Variation in Soil N Mineralization

Seasonal dynamics of net mineralized N (NH4+–N and NO3–N) showed a similar pattern in both soil depths of 0–10 and 10–20 cm, with the lowest rates observed from 15 October to 15 January, and the highest rates from 15 April to 15 July (Figure 5). Net mineralized N in the 0–20 cm soil was significantly different among incubation periods, and treatment averages with and without thinning within three-month intervals were 15.6 mg·kg−1 in January–April ≈ 16.2 mg·kg−1 in April–July > (p < 0.05) 10.6 mg·kg−1 in July–October ≈ 8.9 mg·kg−1 in October–January.
The annual net N accumulation in the high thinning treatments (HB and HI) was significantly greater than that in the CK at the two soil depths (Figure 6), while the differences between the CK and MB treatments were not significant. Net annual N mineralized in the 0–20 cm soil ranged from 42.4 to 64.5mg·kg−1·year−1 in 2014. Compared with the CK, the HI and HB treatments significantly increased the cumulative N mineralized over the 12 months by 50.3% and 30.1%, respectively, whereas no significant differences were detected between the CK and MB treatments.

4. Discussion

4.1. Effect of Thinning Regimes on C Sequestration and N Availability

Thinning means biomass removal from forests or plantations and the re-distribution of resources, such as light, water, and nutrients [8]. Manystudies have been conducted with the aim ofinvestigating the response of tree growth and yield to different thinning regimes [1], and the varied responses were observed in different species, geographic locations, and intensities of forest thinning [8,9,41]. Generally, forest thinning has a negative impact on stand-level productivity initially, whereas the decomposition of woody debris may increase C loss from the ecosystem [1,9]. However, this effect may be dependent on the intensity and type of thinning applied and how rapidly the growth and C uptake of the remaining trees can compensate for any reduction in the leaf area. In a long-term thinning experiment in a Scots pine forest, Ruiz-Peinado et al. [10] revealed that unthinned stands had the highest C stock with 315 Mg·C·ha−1, moderate thinning presented 304 Mg·C·ha−1, and heavy thinning 296 Mg·C·ha−1, while soil C stocks in the forest floor and mineral soil were not influenced by thinning. Furthermore, Saunders et al. [1] also indicated that forest thinning (removals of stand basal area by 17% and 11%) did not significantly impact C stocks or fluxes in Norway spruce stands. This implies that light thinning could be an option to increase C storage in the form of standing biomass or soil C because increased density can also increase C input to soil due to increased litter fall [42]. Poplars are fast-growing tree species, and medium (30%) and heavy (50%) thinning intensities were applied in the present study. If we define the rotation length as 15 years, the remaining trees in the MB treatment may compensate for the reduction in the productivity of the plantations at the final harvest, due to increased photosynthetic active radiation and nutrient availability after thinning [43].
Nitrogen availability and mineralization are key parameters and transformation processes that impact plant growth and forest productivity. At the same site, differences in N mineralization rates and N availability among the treatments should be related to variations in the soil environment, understory vegetation and litter fall input caused by thinning. Our results indicated that N mineralization rates were significantly and positively correlated with soil temperature and moisture content (Table 1), and the high thinning treatments (HB and HI) significantly increased the annual net N accumulation when compared to the CK treatment (Figure 5 and Figure 6), supporting that tree spacing would affect N availability in the soil by altering N mineralization rates [44], while high annual N mineralization was found in low density plantations [31,43]. The main reason could be the difference in canopy closure of poplar plantations among the thinning treatments, which would modify the microclimate, understory diversity, litter quality, and decomposition rates, and finally influence N cycling and availability in the soil. However, attention should be paid to the possibility of N loss from leaching in the poplar plantations with a high thinning intensity. Meanwhile, the relationship between nitrogen mineralization and nitrous oxide production is also required for further study in the future.

4.2. Effect of Management Practices on GHG Emissions

Forests play an important role in the mitigation of global climate change, and indeed extending the forested areas, enhancing growth in existing forests, and maintaining C stocks may be the key aspects of sustainable management strategies in order to mitigate the effects of climate change. For example, Parmar et al. [45] indicated that land use change to Short Rotation Forestry for bioenergy production may drive changes in soil respiration by altering the composition of the soil microbial community, and may contribute towards C sequestration and GHG mitigation.
Management practices markedly impact C cycling in forest plantations, and management systems with longer rotation periods and moderate harvesting intensities are recommended to increase C fixation in forests [2]. However, the interactive effects of forest management practices on soil GHG fluxes remain unclear in forest plantations. Zhang et al. [46] reported that understory replacement with legume species likely is the optimum management technique for reducing/minimizing GHG fluxes in a Chinese chestnut plantation, while fertilization can enhance the effects of understory replacement on increasing soil organic C and nutrient availability. Results from this study indicated that increasing thinning intensity increased the annual emissions of CO2 and CH4 but decreased the emission of N2O from the soil (Table 2), supporting the point that a management practice affects more than one gas by more than one mechanism and sometimes in opposite ways [47].
In unthinned stands, GHG emissions were dominated by CO2 emissions, with negligible N2O and CH4 emissions (Table 2)—in agreement with results from forest ecosystems [11,43,44], where soil–atmospheric exchange was dominated by CO2 exchange processes. Additionally, N2O and CH4 had only a small contributory effect on the net GHG balance. However, high intensity thinning (HB and HI treatments) altered the soil–atmospheric exchange of GHGs, with the ranking order of CO2 > CH4 > N2O emissions. The annual flux of N2O varied from 1.49 to 3.90 kg N2O–N ha−1, which is lower than the IPCC emission factor (8.0 kg N2O–N ha−1) but higher than the estimated value from a temperate eucalypt forest ecosystem [13] and similar to the value reported by Berglund and Berglund [48] for a cultivated peat soil. Many studies showed that forest soils were a continuous net CH4 sink, in agreement with our result from the unthinned stands (CK), but the CH4 uptake rate (−90.64 mg·m−2·year−1) is much lower than those reported in temperate forestsin Europe [49,50], a Nothofagus forest in New Zealand [51], and a temperate eucalypt forest in Australia [11]. However, our study showed that thinning significantly increased CH4 emission from the soil, especially in the high intensity thinning treatments (HB and HI), ranging from 465 to 983 mg·m−2·year−1 (Table 2). If conversion factors of 310 for N2O and 21 for CH4 were used in the conversion of CH4 and N2O fluxes into CO2 equivalents, the estimated accumulated GHG emissions at this site were 1.16, 1.34, 1.49, and 1.79 mg·m−2·year−1 for CK, MB, HB, and HI, respectively, comparable to the values reported from a cultivated peat soil [48]. However, there is a need to assess long-term effects of forest thinning on both timber production and GHG mitigation, given the potential multi-functional role of a lowland poplar plantation.

4.3. Relationship of Environmental FactorstoGHG Emissions

Vegetation has a key role to play in the spatial and temporal variation of soil–atmosphere fluxes of GHGs by influencing the production, oxidation, and transport of gases from deep in the wetland soils [52,53,54]. Chen et al. [55] reported that a large proportion of GHGs emitted from wetland soils is due to below ground microbiological processes, whereas the growth of vegetation modifies soil properties, which strongly affect microbial activities. In this study, soil water content, temperature, and water table level differed with the thinning regime (Figure 2 and Figure 3), and accordingly, fluxes of GHGs showed significant variations among the four treatments (Figure 4 and Table 2).
Most studies have demonstrated that positive correlations between temperature and soil respiration [13,56,57], consistent with the results from this research (Table 1). However, a significant and negative correlation between water table and CO2 emission was detected in this study (Table 1). This result does not support the observation reported by many investigations, where CO2 emissions increased following the lowering of the water table level [58]; however, it is in agreement with the results reported in Berglund and Berglund [48] and Kechavarzi et al. [59], where CO2 emission rates were higher in the peat soil with a high water table level.
On a global scale, CH4 and N2O emissions contribute about 20% and 6% to greenhouse effects, respectively [60]. We found that N2O emission was most positively correlated with soil temperature among all environmental factors measured (Table 1), supporting the conclusion that temperature is a key driver for variations of N2O flux from wetland soils [52]. In this study, CH4 emission was significantly and positively correlated with soil temperature and moisture, but significantly and negatively correlated with soil water table (Table 1). These results are consistent with Chen et al. [52], but are different from Fest et al. [13], who indicated that CH4 emission was significantly and negatively correlated with soil temperature but positively correlated with soil moisture content. It appears that the individual effects of the major environmental factors on GHG emissions are well known from laboratory- and field-based studies, whereas how the interactions between those factors affect emissions and how to best optimize conditions to reduce fluxes are still not very clear and further research is needed.

5. Conclusions

Thinning altered soil environmental conditions in the poplar plantation and significantly influenced monthly dynamics of GHG emissions and seasonal variations of N mineralization rates. Soil–atmospheric exchange of GHGs in the lowland poplar plantations was dominated by CO2 exchange, with negligible N2O and CH4 emissions. Higher estimated annual emissions of CO2 and CH4 appeared in the treatments with 50% thinning intensity (HB and HI), while the largest emission of N2O occurred in the CK. High intensity thinning also significantly increased annual cumulative mineralized N by 30.1%–50.3%. Soil temperature and water table level were significantly correlated with emissions of CO2, CH4, and N2O, while soil water content was the most important driving factor for CH4 emission. Overall, our results confirmed that thinning enhanced emissions of GHGs and mineralization of N due to altered environmental conditions, but the response of specific GHGs to the disturbance differed, and we suggest that a moderate thinning with 30% intensity (MB) would be the best option for reducing GHG emissions in similar poplar plantations.

Acknowledgments

This work was supported by the National Key Technology R & D Program (2015BAD09B02), the National Basic Research Program of China (973 program, 2012CB416904) and by the Priority Academic Program Development of Jiangsu Higher Education Institutions (PAPD). We are also grateful to Scott X. Chang from University of Alberta for his valuable comments and useful suggestions on the research.

Author Contributions

Shengzuo Fang conceived and designed the experiments, supervised the study, as well as wrote the manuscript. Da Lin carried outfield measurement, chemical and GHGs analysis of soil. Ye Tian and Senxian Hong contributed to fieldwork and data analysis.

Conflicts of Interest

The authors declare no conflict of interest.

References

  1. Saunders, M.; Tobin, B.; Black, K.; Gioria, M.; Nieuwenhuis, M.; Osborne, B.A. Thinning effects on the net ecosystem carbon exchange of a Sitka spruce forest are temperature-dependent. Agric. For. Meteorol. 2012, 157, 1–10. [Google Scholar] [CrossRef]
  2. Moreno-Fernández, D.; Díaz-Pinés, E.; Barbeito, I.; Sánchez-González, M.; Montes, F.; Rubio, A.; Caňllas, I. Temporal carbon dynamics over the rotation period of two alternative management systems in Mediterranean mountain Scots pine forests. For. Ecol. Manag. 2015, 348, 186–195. [Google Scholar] [CrossRef]
  3. Sun, S.Q.; Bhatti, J.S.; Jassal, R.S.; Chang, S.X.; Arevalo, C.M.; Black, T.A.; Sidders, D. Stand age and soil productivity control soil CO2 efflux and soil organic carbon dynamics in hybrid poplar plantations. Soil Sci. Soc. Am. J. 2015, 79, 1638–1649. [Google Scholar] [CrossRef]
  4. Chen, W.; Chen, J.; Price, D.T.; Cihlar, J.; Liu, J. Carbon offset potentials of four alternative forest management strategies in Canada: A simulation study. Mitig. Adapt. Strateg. Glob. Chang. 2000, 5, 143–169. [Google Scholar] [CrossRef]
  5. Adams, A.B.; Harrison, R.B.; Sletten, R.S.; Strahm, B.D.; Turnblom, E.C.; Jensen, C.M. Nitrogen-fertilization impacts on carbon sequestration and flux in managed coastal Douglas-fir stands of the Pacific Northwest. For. Ecol. Manag. 2005, 220, 313–325. [Google Scholar] [CrossRef]
  6. Liski, J.; Pussinen, A.; Pingoud, K.; Mäkipää, R.; Karjalainen, T. Which rotation length is favorable to carbon sequestration? Can. J. For. Res. 2001, 31, 2004–2013. [Google Scholar] [CrossRef]
  7. Minkkinen, K.; Laine, J.; Hökkä, H. Tree stand development and carbon sequestration in drained peatland stands in Finland—A simulation study. Silva Fenn. 2001, 35, 55–69. [Google Scholar] [CrossRef]
  8. Thornley, J.H.M.; Cannell, G.R. Managing forests for wood yield and carbon storage: A theoretical study. Tree Physiol. 2000, 20, 477–484. [Google Scholar] [CrossRef] [PubMed]
  9. Nilsen, P.; Strand, L.T. Thinning intensity effects on carbon and nitrogen stores and fluxes in a Norway spruce (Picea abies (L.) Karst.) stand after 33 years. For. Ecol. Manag. 2008, 256, 201–208. [Google Scholar] [CrossRef]
  10. Ruiz-Peinado, R.; Bravo-Oviedo, A.; Montero, G.; del Río, M. Carbon stocks in a Scots pine afforestation under different thinning intensities management. Mitig. Adapt. Strateg. Glob. Chang. 2014. [Google Scholar] [CrossRef]
  11. Johnson, D.W.; Curtis, P.S. Effects of forest management on soil C and N storage: Meta analysis. For. Ecol. Manag. 2001, 140, 227–238. [Google Scholar] [CrossRef]
  12. Nave, L.E.; Vance, E.D.; Swanston, C.W.; Curtis, P.S. Harvest impacts on soil carbon storage in temperate forests. For. Ecol. Manag. 2010, 259, 857–866. [Google Scholar] [CrossRef]
  13. Fest, B.J.; Livesley, S.J.; Drösler, M.; van Gorsel, E.; Arndt, S.K. Soil–atmosphere greenhouse gas exchange in a cool, temperate Eucalyptus delegatensis forest in south-eastern Australia. Agric. For. Meteorol. 2009, 149, 393–406. [Google Scholar] [CrossRef]
  14. Arevalo, C.B.M.; Bhatti, J.S.; Chang, S.X.; Sidders, D. Land use change effects on ecosystem carbon balance: From agricultural to hybrid poplar plantation. Agric. Ecosyst. Environ. 2011, 141, 342–349. [Google Scholar] [CrossRef]
  15. Fang, S.Z.; Xue, J.H.; Tang, L.Z. Biomass production and carbon sequestration potential in poplar plantations with different management patterns. J. Environ. Manag. 2007, 85, 672–679. [Google Scholar] [CrossRef] [PubMed]
  16. Fang, S.Z.; Li, H.Y.; Sun, Q.Q.; Chen, L.B. Biomass production and carbon stocks in poplar-crop intercropping systems: A case study in northwestern Jiangsu, China. Agrofor. Syst. 2010, 79, 213–222. [Google Scholar] [CrossRef]
  17. Pallardy, S.G.; Gibbins, D.E.; Rhoads, J.L. Biomass production by two-year-old poplar clones on floodplain sites in the Lower Midwest, USA. Agrofor. Syst. 2003, 59, 21–26. [Google Scholar] [CrossRef]
  18. Oelbermann, M.; Voroney, R.P.; Gordon, A.M. Carbon sequestration in tropical and temperate agroforestry systems: A review with examples from Costa Rica and southern Canada. Agric. Ecosyst. Environ. 2004, 104, 359–377. [Google Scholar] [CrossRef]
  19. Peichl, M.; Thevathasan, N.V.; Gordon, A.M.; Huss, J.; Abohassan, R.A. Carbon sequestration potentials in temperate tree-based intercropping systems, Southern Ontario, Canada. Agrofor. Syst. 2006, 66, 243–257. [Google Scholar] [CrossRef]
  20. International Poplar Commission (IPC). Improving Lives with Poplars and Willows: Synthesis of Country Progress Reports. In Proceedings of the IPC 24th Session, Dehradun, India, 30 October–2 November 2012.
  21. Verlinden, M.S.; Broeckx, L.S.; Van den Bulcke, J.; Van Acker, J.; Ceulemans, R. Comparative study of biomass determinants of 12 poplar (Populus) genotypes in a high-density short-rotation culture. For. Ecol. Manag. 2013, 307, 101–111. [Google Scholar] [CrossRef]
  22. Sabatti, M.; Fabbrini, F.; Harfouche, A.; Beritognolo, I.; Mareschi, L.; Carlini, M.; Paris, P.; Scarascia-Mugnozza, G. Evaluation of biomass production potential and heating value of hybrid poplar genotypes in a short-rotation culture in Italy. Ind. Crops Prod. 2014, 61, 62–73. [Google Scholar] [CrossRef]
  23. Devappa, R.K.; Rakshit, S.K.; Dekker, R.F.H. Forest biorefinery: Potential of poplar phytochemicals as value-added co-products. Biotechnol. Adv. 2015, 33, 681–716. [Google Scholar] [CrossRef] [PubMed]
  24. Archaux, F.; Chevalier, R.; Berthelot, A. Towards practices favourable to plant diversity in hybrid poplar plantations. For. Ecol. Manag. 2010, 259, 2410–2417. [Google Scholar] [CrossRef]
  25. Elferjani, R.; DesRochers, A.; Tremblay, F. Effects of mixing clones on hybrid poplar productivity, photosynthesis and root development in northeastern Canadian plantations. For. Ecol. Manag. 2014, 327, 157–166. [Google Scholar] [CrossRef]
  26. Henkel-Johnson, D.; Macdonald, S.E.; Bork, E.W.; Thomas, B.R. Influence of weed composition, abundance, and spatial proximity on growth in young hybrid poplar plantations. For. Ecol. Manag. 2016, 362, 55–68. [Google Scholar] [CrossRef]
  27. Fang, S.Z.; Xie, B.D.; Liu, J.J. Soil nutrient availability, poplar growth and biomass production on degraded agricultural soil under fresh grass mulch. For. Ecol. Manag. 2008, 255, 1802–1809. [Google Scholar] [CrossRef]
  28. Fang, S.Z.; Xie, B.D.; Liu, D.; Liu, J.J. Effects of mulching materials on nitrogen mineralization, nitrogen availability and poplar growth on degraded agricultural soil. New For. 2011, 41, 147–162. [Google Scholar] [CrossRef]
  29. Lafleur, B.; Thiffault, E.; Paré, D.; Camiré, C.; Bernier-Cardou, M.; Masse, S. Effects of hog manure application on the nutrition and growth of hybrid poplar (Populus spp.) and on soil solution chemistry in short-rotation woody crops. Agric. Ecosyst. Environ. 2012, 155, 95–104. [Google Scholar] [CrossRef]
  30. Liu, D.; Fang, S.Z.; Tian, Y.; Dun, X.J. Variation in rhizosphere soil microbial index of tree species on seasonal flooding land: An in situ rhizobox approach. Appl. Soil Ecol. 2012, 59, 1–11. [Google Scholar] [CrossRef]
  31. Yan, Y.F.; Fang, S.Z.; Tian, Y.; Deng, S.P.; Tang, L.Z.; Chuong, D.N. Influence of tree spacing on soil nitrogen mineralization and availability in hybrid poplar plantations. Forests 2015, 6, 636–649. [Google Scholar] [CrossRef]
  32. Wang, D.; Fan, J.Z.; Jing, P.P.; Cheng, Y.; Ruan, H.H. Analyzing the impact of climate and management factors on the productivity and soil carbon sequestration of poplar plantations. Environ. Res. 2016, 144, 88–95. [Google Scholar] [CrossRef] [PubMed]
  33. Black, T.A.; Tan, C.S.; Nnyamah, J.U. Transpiration rate of Douglas fir trees in thinned and intact stands. Can. J. Soil Sci. 1980, 60, 625–631. [Google Scholar] [CrossRef]
  34. Hale, S. The effect of thinning intensity on the below-canopy light environment in a Sitka spruce plantation. For. Ecol. Manag. 2003, 179, 341–349. [Google Scholar] [CrossRef]
  35. Li, J.H.; Gu, M.M.; Meng, P.W.; Wang, Y.X.; Liu, Y.F.; Fang, S.Z. Atmosphere environment monitoring and data analysis in poplar plantation. Electr. Meas. Technol. 2014, 37, 117–120. (In Chinese) [Google Scholar]
  36. Armstrong, A.C. The measurement of watertable levels in structured clay soils by means of open auger hole. Earth Surf. Process. Landf. 1983, 8, 183–187. [Google Scholar] [CrossRef]
  37. Binkley, D.; Aber, J.; Pastor, J.; Nadelhoffer, K. Nitrogen availability in some Wisconsin forests: Comparisons of resin bags and on-site incubations. Biol. Fertil. Soils 1986, 2, 77–82. [Google Scholar] [CrossRef]
  38. Shibata, H.; Urakawa, R.; Toda, H.; Inagaki, Y.; Tateno, R.; Koba, K.; Nakanishi, A.; Fukuzawa, K.; Yamasaki, A. Changes in nitrogen transformation in forest soil representing the climate gradient of the Japanese archipelago. J. For. Res. 2011, 16, 374–385. [Google Scholar] [CrossRef]
  39. Gulledge, J.; Schimel, J.P. Controls on soil carbon dioxide and methane fluxes in a variety of Taiga forest stands in interior Alaska. Ecosystems 2000, 3, 269–282. [Google Scholar] [CrossRef]
  40. Chen, Q.F.; Ma, J.J.; Liu, J.H.; Zhao, C.S.; Liu, W. Characteristics of greenhouse gas emission in the Yellow River Delta wetland. Int. Biodeterior. Biodegrad. 2013, 85, 646–651. [Google Scholar] [CrossRef]
  41. Makinen, H.; Isomaki, A. Thinning intensity and long-term changes in increment and stem form of Scots pine trees. For. Ecol. Manag. 2004, 203, 21–34. [Google Scholar] [CrossRef]
  42. Slodicak, M.; Novak, J.; Skovsgaard, J.P. Wood production, litter fall and humus accumulation in a Czech thinning experiment in Norway spruce (Picea abies (L.) Karst.). For. Ecol. Manag. 2005, 209, 157–166. [Google Scholar] [CrossRef]
  43. Dun, X.J.; Qu, H.F.; Tian, Y.; Fang, S.Z.; Xu, X.Z. Effects of thinning treatments on soil available nitrogen of the poplar plantations in flooding land of Yangtze River. J. Nanjing For. Univ. 2013, 37, 45–50. (In Chinese) [Google Scholar]
  44. Tan, X.; Chang, S.X.; Comeau, P.G.; Wang, Y.H. Thinning effects on microbial biomass, N mineralization, and tree growth in a mid-rotation fire-origin lodgepole pine stand in the Lower Foothills of Alberta, Canada. For. Sci. 2008, 54, 465–474. [Google Scholar]
  45. Parmar, K.; Keith, A.M.; Rowe, R.L.; Sohi, S.P.; Moeckel, C.; Pereira, M.G.; McNamara, N.P. Bioenergy driven land use change impacts on soil greenhouse gas regulation under Short Rotation Forestry. Biomass Bioenerg. 2015, 82, 40–48. [Google Scholar] [CrossRef]
  46. Zhang, J.J.; Li, Y.F.; Chang, S.X.; Qin, H.; Fu, S.L.; Jiang, P.K. Understory management and fertilization affected soil greenhouse gas emissions and labile organic carbon pools in a Chinese chestnut plantation. For. Ecol. Manag. 2015, 337, 126–134. [Google Scholar] [CrossRef]
  47. Koga, N.; Sawamoto, T.; Tsuruta, H. Life cycle inventory-based analysis of greenhouse gas emissions from arable land farming systems in Hokkaido, northern Japan. Soil Sci. Plant Nutr. 2006, 52, 564–574. [Google Scholar] [CrossRef]
  48. Berglund, Ö.; Berglund, K. Influence of water table level and soil properties on emissions of greenhouse gases from cultivated peat soil. Soil Biol. Biochem. 2011, 43, 923–931. [Google Scholar] [CrossRef]
  49. Butterbach-Bahl, K.; Papen, H. Four years continuous record of CH4-exchange between the atmosphere and untreated and limed soil of a N-saturated spruce and beech forest ecosystem in Germany. Plant Soil 2002, 240, 77–90. [Google Scholar] [CrossRef]
  50. Merino, A.; Perez-Batallon, P.; Macias, F. Responses of soil organic matter and greenhouse gas fluxes to soil management and land use changes in a humid temperate region of southern Europe. Soil Biol. Biochem. 2004, 36, 917–925. [Google Scholar] [CrossRef]
  51. Price, S.J.; Sherlock, R.R.; Kelliher, F.M.; McSeveny, T.M.; Tate, K.R.; Condron, L.M. Pristine New Zealand forest soil is a strong methane sink. Glob. Chang. Biol. 2004, 10, 16–26. [Google Scholar] [CrossRef]
  52. Chen, Y.P.; Chen, G.C.; Ye, Y. Coastal vegetation invasion increases greenhouse gas emission from wetland soils but also increases soil carbon accumulation. Sci. Total Environ. 2015, 526, 19–28. [Google Scholar] [CrossRef] [PubMed]
  53. Hirota, M.; Tang, Y.H.; Hu, Q.W.; Hirata, S.; Tomomichi, K.; Mo, H.W.; Cao, G.M.; Mariko, S. Methane emissions from different vegetation zones in a Qinghai–Tibetan Plateau wetland. Soil Biol. Biochem. 2004, 36, 737–748. [Google Scholar] [CrossRef]
  54. Koelbener, A.; Strom, L.; Edwards, P.J.; Venterink, H.O. Plant species from mesotrophic wetlands cause relatively high methane emissions from peat soil. Plant Soil 2010, 326, 147–158. [Google Scholar] [CrossRef]
  55. Chen, G.C.; Tam, N.F.Y.; Ye, Y. Spatial and seasonal variations of atmospheric N2O and CO2 fluxes from a subtropical mangrove swamp and their relationships with soil characteristics. Soil Biol. Biochem. 2012, 48, 175–181. [Google Scholar] [CrossRef]
  56. Wang, Y.K.; Fang, S.Z.; Chang, S.X.; Tian, Y. Non-additive effects of litter-mixing on soil carbon dioxide efflux from poplar-based agroforestry systems in the warm temperate region of China. Agrofor. Syst. 2014, 88, 193–203. [Google Scholar] [CrossRef]
  57. Berger, T.W.; Inselsbacher, E.; Zechmeister-Boltenstern, S. Carbon dioxide emissions of soils under pure and mixed stands of beech and spruce, affected by decomposing foliage litter mixtures. Soil Biol. Biochem. 2010, 42, 986–997. [Google Scholar] [CrossRef]
  58. Wessolek, G.; Schwärzel, K.; Renger, M.; Sauerbrey, R.; Siewert, C. Soil hydrology and CO2 release of peat soils. J. Plant Nutr. Soil Sci. 2002, 165, 494–500. [Google Scholar] [CrossRef]
  59. Kechavarzi, C.; Dawson, Q.; Leeds-Harrison, P.B.; Szatylowicz, J.; Gnatowski, T. Water-table management in lowland UK peat soils and its potential impact on CO2 emission. Soil Use Manag. 2007, 23, 359–367. [Google Scholar] [CrossRef]
  60. Intergovernmental Panel on Climate Change (IPCC). Climate Change 2001: The scientific basis. Contribution of Working Group I to the Third Assessment Report of the Intergovernmental Panel on Climate Change; Cambridge University Press: Cambridge, UK, 2001. [Google Scholar]
Figure 1. Diagram illustrating the incubated soil core-ion exchange resin bag design used in the soil nitrogen (N) mineralization experiment for the summer season.
Forests 07 00141 g001
Figure 2. Monthly mean soil temperature (a,b) and water content (c,d) in different thinning treatments in poplar plantations at two soil depths. CK: unthinned; HB: high intensity thinning from below; HI: high intensity thinning by removing every alternative row of trees; MB: medium intensity thinning from below.
Forests 07 00141 g002aForests 07 00141 g002b
Figure 3. Monthly mean soil water table in different thinning treatments in poplar plantations at the experimental site. Different lower case letters indicate significant differences in water table among the thinning treatments within the same month, at p < 0.05 according to Duncan’s multiple range test.
Forests 07 00141 g003
Figure 4. Monthly mean greenhouse gas fluxes (A: CO2; B: CH4; C: N2O) in different thinning treatments in poplar plantations. Different lower case letters indicate significant differences in greenhouse gas fluxes among the thinning treatments within the same month, at p < 0.05 according to Duncan’s multiple range test.
Forests 07 00141 g004aForests 07 00141 g004b
Figure 5. Seasonal variation in soil mean net nitrogen (N) mineralization indifferent thinning treatments. CK: unthinned; MB: thinning from the lower end of the diameter distribution with 30% intensity; HB: thinning from the lower end of the diameter distribution with 50% intensity; HI: interlaced thinning with 50% intensity. Different lower case letters indicate significant differences in net N mineralization between two soil depths for the same treatment, while different upper case letters indicate significant differences among the thinning treatments within the same soil depth at p < 0.05 according to Duncan’s multiple range test.
Forests 07 00141 g005aForests 07 00141 g005b
Figure 6. Annual mean net soil nitrogen (N) mineralization indifferent thinning treatments. CK: unthinned; MB: thinning from the lower end of the diameter distribution with 30% intensity; HB: thinning from the lower end of the diameter distribution with 50% intensity; HI: interlaced thinning with 50% intensity. Different lower case letters indicate significant differences in net N mineralization between two soil depths for the same treatment, while different upper case letters indicate significant differences among the thinning treatments within the same soil depth at p < 0.05 according to Duncan’s multiple range test.
Forests 07 00141 g006
Table 1. Correlation coefficients (r) between soil environmental factors and soil greenhouse gas efflux, as well as net soil N mineralization.
Soil Environmental FactorSoil Greenhouse Gas Efflux (n = 48)Net Soil N Mineralization
(n = 16)
CO2CH4N2O
Temperature at 5 cm depth0.74 **0.40 **0.59 **0.56 *
Temperature at 15 cm depth0.70 **0.30 *0.64 **0.49 *
Moisture at 5 cm depth0.150.76 **−0.180.65 **
Moisture at 15 cm depth0.230.68 **−0.190.72 **
Water table−0.74 **−0.52 **−0.35 */
Note: * and ** indicate correlation is significant at p < 0.05 and 0.01, respectively. The N2O emissions were very low during the winter and spring, but quickly increased in the summer (Figure 4b). Emission rate of N2O (average of four treatments) was approximately enhanced by 472.9%, 372.5%, and 52.7% for summer, autumn, and spring, respectively, as compared with winter. Contrary to the CO2 emissions, the highest N2O emissions were observed in the CK treatment and the average daytime emission of N2O had the following order CK (0.044 mg·m−2·h−1) > MB (0.026 mg·m−2·h−1) > HI (0.021 mg·m−2·h−1) > HB (0.017 mg·m−2·h−1).
Table 2. Annual greenhouse gas efflux from the soil in different thinning treatments in a poplar plantation.
Thinning Treatment *CO2 (kg·m−2·year−1)CH4 (mg·m−2·year−1)N2O (mg·m−2·year−1)
CK1.04 ± 0.02 d−90.64 ± 30.41 d389.52 ± 53.76 a
MB1.27 ± 0.08 c81.87 ± 34.84 c227.46 ± 52.07 b
HB1.43 ± 0.01 b465.55 ± 114.59 b148.36 ± 38.32 c
HI1.71 ± 0.02 a982.92 ± 216.43 a187.01 ± 11.12 b,c
* CK: unthinned or control treatment; MB: thinning from the lower end of the diameter distribution with 30% intensity; HB: thinning from the lower end of the diameter distribution with 50% intensity; HI: interlaced thinning with 50% intensity. Significant differences among the thinning treatments for the same parameter are indicated by different lower case letters (p < 0.05).

