Article

The Effects of Poplar Plantations on Vascular Plant Diversity in Riparian Landscapes

by
Jorge Martín-García
1,2,*,
Hervé Jactel
3,4,
Juan Andrés Oria-de-Rueda
5 and
Julio Javier Diez
1,2
1
Sustainable Forest Management Research Institute, University of Valladolid—INIA, Avenida Madrid 57, Palencia 34004, Spain
2
Department of Plant Production and Forest Resources, University of Valladolid (Palencia Campus), Avenida Madrid 57, Palencia 34004, Spain
3
INRA, UMR1202 BIOGECO F-33612 Cestas, France
4
University of Bordeaux, BIOGECO, UMR 1202, Pessac F-33400, France
5
Forest Botany Laboratory, Agroforestry Department, University of Valladolid, Avda. Madrid 44, Palencia 34071, Spain
*
Author to whom correspondence should be addressed.
Forests 2016, 7(3), 50; https://doi.org/10.3390/f7030050
Submission received: 25 August 2015 / Revised: 15 February 2016 / Accepted: 18 February 2016 / Published: 25 February 2016

Abstract

:
Riparian vegetation, which performs many key ecological functions, has been modified or lost at an alarming rate during the past century as a result of human activity. The aims of this study are (a) to investigate the effects of poplar plantations on plant diversity in riparian zones; and (b) to estimate the ecological implications of extending cover by poplar plantations. For this purpose, we assessed species richness, habitat indicator species and functional diversity based on Grime’s C-S-R strategies. We used non-metric multidimensional scaling to examine the role of environmental factors such as soil properties, forest structure and management. Disturbance, in particular the frequency of harrowing, led to a decline in species richness and modified the indicator species and functional diversity by favoring Ruderal (R) species at the expense Stress-Tolerant (S) and Competitor (C) species, which are better suited to riparian forest conditions. Poplar plantations should not be used as surrogates for riparian forests, and minimizing harrowing in poplar plantations promotes vascular plant diversity. Furthermore, reintroduction of herbs, ferns and geophytes with a high conservation value and low seed dispersal capacity is advisable from the sixth year after establishment, once harrowing for weed control has been completed.

1. Introduction

Riparian zones, which support diverse, dynamic, and complex communities, act as interfaces between terrestrial and aquatic environments [1,2,3]. Riparian communities are known to perform many key functions, such as reducing eutrophication, trapping pesticides, stabilizing riverbanks and providing a microclimate that favors high biodiversity [4,5,6]. This type of habitat is particularly important in arid regions, such as the Mediterranean area, because wetlands communities support important ecological processes and are used by wildlife as natural ecological corridors [3].
Despite the numerous benefits that they provide, riparian zones have been greatly disturbed by human activity over the past century in Europe [4,5,7]. The native vegetation of riparian zones in many parts of Europe was almost totally lost when streamflow was regulated by construction of reservoirs and channels in the middle of the 20th century [8,9]. Furthermore, the virgin vegetation has been severely affected by excess nutrients and pollutants derived from farmland and urban areas and the presence of alien species as a result of over-exploitation of the riverscape [10]. This has led to the natural vegetation being replaced with crops or forest species, such as poplar, which are more profitable.
One of the current aims of national and regional forest policies is to extend the area occupied by forest plantations. Establishment of such plantations on degraded or agricultural land has traditionally been justified by the potential benefits, including wood and biomass production and restoration of biodiversity values [11,12,13,14,15,16,17,18,19]. However, the role of artificial forest plantations has scarcely been tested in Mediterranean landscapes encompassing riparian forests, poplar plantations and agricultural crops. The effects of management practices on herbaceous plant communities have been studied in hybrid poplar plantations in France [20,21,22], in poplar short rotation coppice plantations in Germany [23] and in other countries such as Estonia [24] and Canada [25].
Vascular plants are often used as general indicators of overall biodiversity [26,27,28] as they provide an objective means of assessing the integrity and conservation value of plant communities [29]. Vegetation is directly affected by all types of change, whether brought about by natural disturbance or human management.
Diversity is often indicated by species richness, and to a lesser extent by characteristic indicator species in habitats. However, functional diversity has traditionally been ignored by researchers, despite being of crucial importance in determining ecosystem processes [30]. Ecosystem processes are known to be consistently associated with functional composition (defined as the presence of certain functional types of plants, i.e., sets of plant species with the same attributes) and functional richness (defined as the number of different plant functional types) far more than with species richness [30,31]. Nevertheless, these three components (species richness, indicator species and functional diversity) do not contribute the same type of information and should therefore be analyzed as complementary variables.
Grime [32,33,34,35] constructed a life history theory based on the concept of functional types, to reduce the complexity of vascular plant communities and to help understand vegetation processes. Grime’s theory established that two external factors (stress and disturbance) determine the structure of plant communities. Stress is defined as “the external constraints which limit the rate of dry matter production of all or part of the vegetation”, e.g., shortages of light, water or mineral nutrients and suboptimal temperatures [35]. On the other hand, disturbance is defined as “the mechanisms which limit plant biomass by causing its partial or total destruction” e.g., activities of herbivores, pathogens, man and abiotic phenomena such as wind damage, frost and fire [35]. Grime’s theory suggests that vascular plants may be classified according to local levels of stress and disturbance into three primary strategies and also secondary strategies, present in those habitats with intermediate levels of both factors. Thus, low stress with low disturbance would give rise to Competitor species (C), high stress with low disturbance to Stress-Tolerant species (S) and low stress with high disturbance to Ruderal species (R). By contrast, in highly disturbed habitats, the effect of continuous and severe stress prevents recovery or re-establishment of the vegetation [35].
The hypotheses for this study are that vascular plant diversity in poplar plantations may differ from native riparian forests and that stress and disturbance factors may explain the differences in plant communities in the different types of habitats. The main objectives of the study were (a) to investigate the effects of poplar plantations on plant diversity in riparian zones; and (b) to assess the ecological implications of extending cover by poplar plantations. To achieve these objectives, we addressed the following questions:
  • To what extent does vascular plant diversity differ in poplar plantations and riparian forests?
  • What are the respective influences of stress and disturbance on vascular plant diversity in riparian landscapes?

2. Material and Methods

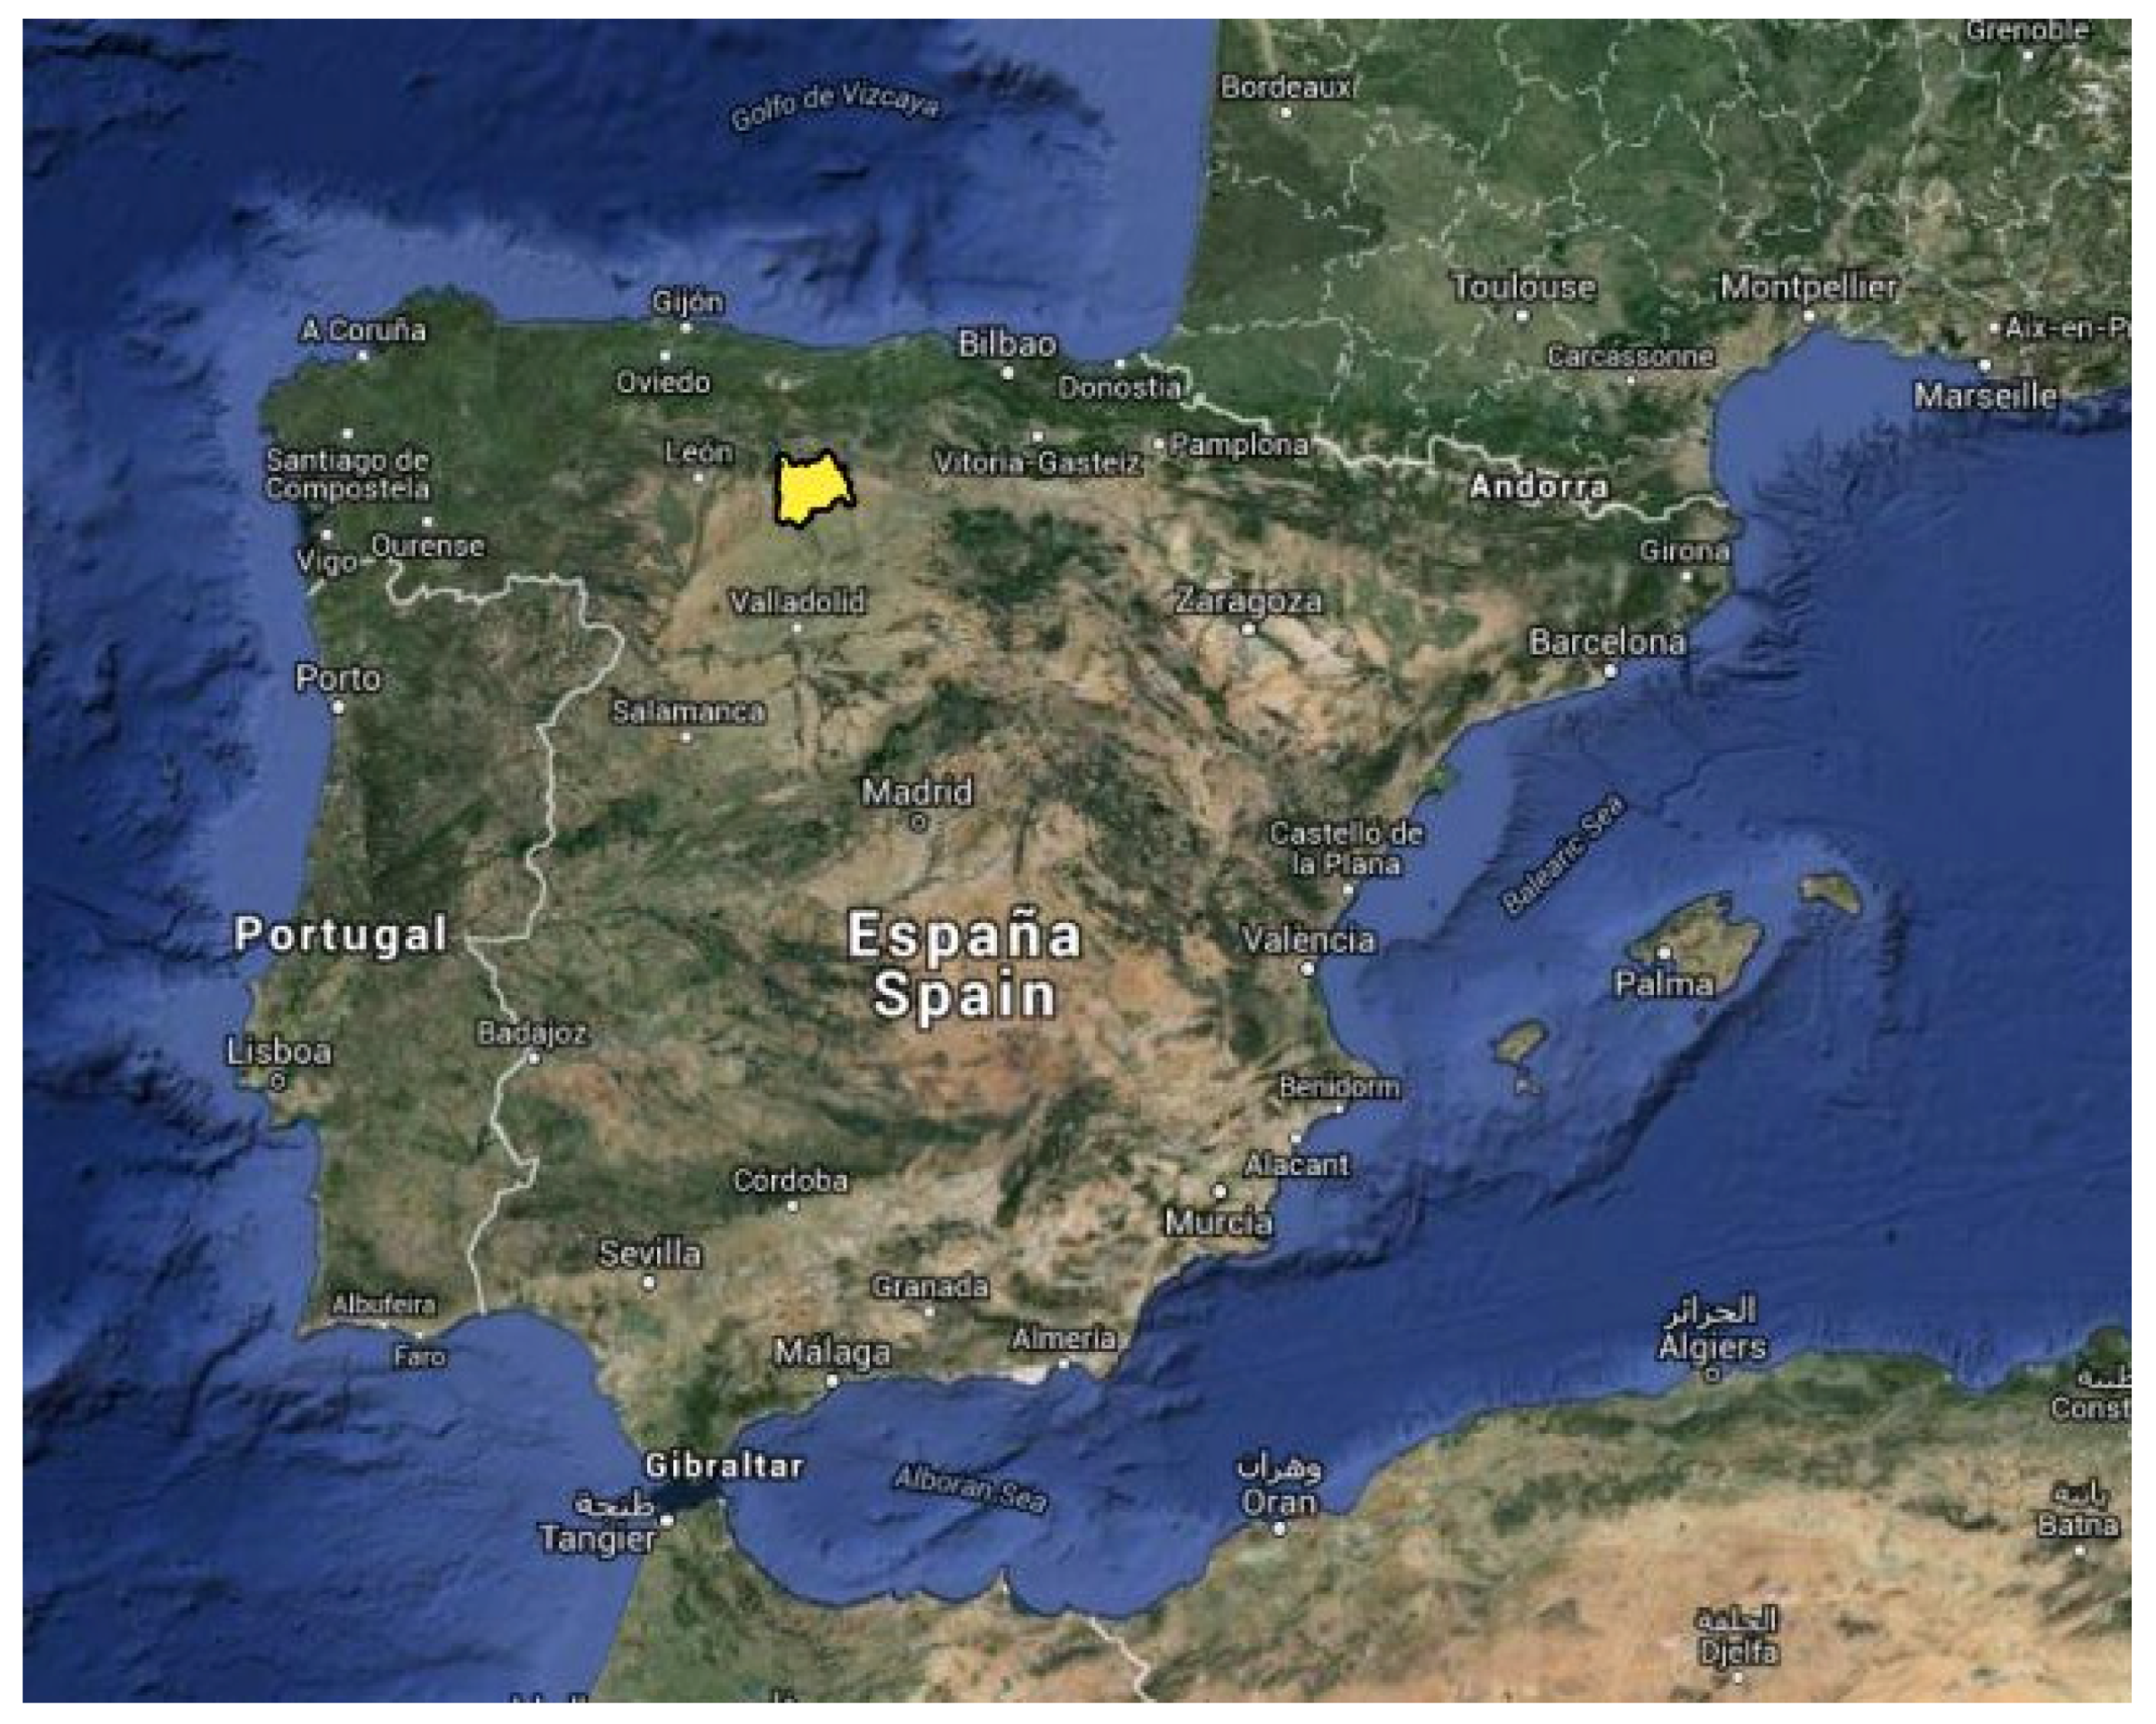
2.1. Site Description and Experimental Design

The present study was carried out in the Duero River basin, in the middle reach of the Carrión River (Castilla y León, NW Spain) (Figure 1). The altitude in the study area ranges between 800 and 900 m and, in most stands, the land is almost flat. The Climatic Digital Atlas of the Iberian Peninsula was used to estimate the climatic variables. A grid of 200 m pixel size generated from the existing network of meteorological stations was used, but included only those meteorological stations where temperature and precipitation data were collected for at least 15 and 20 years, respectively, in the period from 1950 to 1999. During the periods considered, the average annual precipitation varied between 496 and 630 mm, and the average annual temperature between 9 and 11.4 °C [36].
Before the Carrión River was regulated by the construction of several storage reservoirs in the 1930s, the riparian zone included several vegetation strips. One strip was in direct contact with the watercourse and was inhabited by plant species (mainly shrubs) with a high water requirement and the ability to tolerate floods. A second strip, located in alluvial meadow soils, was occupied by tree species that only required a seasonal water table with deep access [37]. Nowadays, as major periodic flooding no longer occurs, the first strip of vegetation in the study area is very narrow (ca. 5–7 m) and is characterized as a mixed tree and shrub stratum (mainly species of the genus Salix and Alnus glutinosa (L.) Gaertner, and to a lesser extent species of the genus Populus). Wetland forests in the second strip (mainly alder, ash or poplar stands) have been replaced by agricultural crops or poplar plantations, except for occasional remnant patches.
Poplar plantations were initially established beside the first vegetation strip. The high soil moisture in the zone made the land impossible to cultivate but the adjacent alluvial meadow soils were cultivated, exploiting rich soils and available irrigation. Poplars were subsequently planted in these zones because of the high profitability of these trees (up to 2400 €·ha−1·year−1; [38]).
Poplar plantations are monoclonal and although several hybrids are used in Spain, Populus x euramericana (Dode) Guinier clone I-214 (P. deltoides Marsh. ♀ × P. nigra L. ♂) is the most common. It covers about 70% of the total area covered by poplar plantations [39]. Poplar plantations are harvested every 12–16 years, and weed control techniques (mainly harrowing) are regularly applied during the first six years until canopy closure. The density of poplar plantations, which is maintained at a constant thickness throughout the whole rotation, is approximately 280–400 stems·ha−1 (i.e., at a spacing of 5 m × 5 m or 6 m × 6 m) [39,40].
Thirty-two P. x euramericana (clone I-214) stands were selected for the study. These were chosen by use of a factorial scheme with three factors at two levels: (i) Stand stage: young stands of 3–7 years old (open canopy) and adult stands of 8–14 years old (closed canopy); (ii) Understory management: harrowed or not harrowed. Harrowed stands were ploughed every year, whereas the stands that were not harrowed had not been ploughed for at least two years; (iii) Site quality: rich stands with optimum growth rates of poplar trees (site qualities I and II), and poor land, unsuitable for growth (site qualities III and IV). Site quality was determined by the model based on growth curves developed for P. x euramericana clone I-214 in the Duero River basin [41]. The specific values of the basal area to 10 years old for these poplars are 20.21, 16.77, 13.31 and 9.87 m2·ha−1 for site qualities of, respectively, I, II, III and IV. Four clonal plantations were therefore selected as replicates of each of the eight combinations of the previous three factors (i.e., a total of 32 poplar plantations). Furthermore, the only three native riparian forests found in the study area were sampled to compare vascular plant diversity in poplar plantations and native forests. These stands consisted of an upper story of alders (A. glutinosa), a scattered lower story of elder (Sambucus nigra L.), common hawthorn (Crataegus monogyna Jacq.), common dogwood (Cornus sanguinea L.) and a forb stratum.

2.2. Growth Measurements, Assessment of Crown Condition Variables and Soil Sampling

Several dendrometric variables can be related to the quantity of light transmitted to the understory, such as basal diameter, total height and canopy closure. Thus, in each poplar plantation, four circular subplots with a radius of 15 m were established for measuring trees. The middle point of the stand was selected at random through the use of GIS (ArcGIS 10.0, ESRI). The subplots were located 50 meters apart from each other (adjacent subplots are 35.36 m apart), at the ends of a cross located in the middle of the stand (Figure 2). All trees within each subplot were sampled. The diameter at breast height (dbh), total height and canopy width (two perpendicular measures) were measured for an average of 84 trees per stand (ranging from 68 to 112 trees per stand). Furthermore, taking into account that canopy closure not only depends on canopy area but is also influenced by the density of foliage, the crown transparency of all trees in each subplot was visually estimated during the summer (within the first two weeks of July), as recommended in the ICP Forest protocol [42,43]. Thus, canopy closure was determined by multiplying canopy area by mean crown transparency in each stand.
Mineral soil samples from the upper 30 cm (A and B horizons) were collected from all four subplots in each plot by using an open-face soil auger. The samples were mixed and homogenized to yield one composite sample per plot. The pH was determined potentiometrically with a pH meter (Basic 20 Crison, Hach Lange, L’Hospitalet de Llobregat, Spain), in a soil solution (1:2.5, soil:water). Organic matter was determined by the K2Cr2O7 method. Total N was determined by Kjeldahl digestion. Soil available P was extracted by the Olsen procedure and determined photometrically by the molybdenum-blue method. Soil exchangeable cations (K+, Na+2, Ca2+ and Mg2+) were extracted with ammonium acetate and determined by atomic absorption/emission spectrometry. Particle-size distribution (percentage of coarse fragments and soil texture) was determined by the Bouyoucos method (hydrometer method), and the ISSS (International Society of Soil Science) classification was applied. The Cationic Exchange Capacity (CEC) was determined by Bascomb’s method (i.e., the exchange cations were displaced by Ba ions, which were then displaced by Mg ions, and the remaining concentration of Mg was determined by titration against EDTA) (for more details see [44]).

2.3. Vascular Plant Sampling

Nine 2 m × 2 m sampling quadrats (36 m2 in total) were installed in each stand for quantification of the understory vegetation (i.e., a total of 315 quadrats were assessed: 36 quadrats of each type of poplar plantation and 27 quadrats of native riparian forests). The quadrats were selected using a 2 m × 2 m grid to ensure that all distances from the rows and, therefore, all levels of competition for nutrients and available light were covered. Each vascular plant was identified (field or laboratory) and the percentage cover and characteristics were determined in spring. Floristic data were automatically converted into C-S-R signatures by means of the calculator developed by Hunt et al. [45] (first part of the spreadsheet tool). This tool, which is applied to the data matrix containing quantitative records from one stand, calculates the percentage abundance of each functional type and plots the net position onto a triangular representation of C-S-R space. A C-S-R signature was thus obtained for each stand (see [45] for details).

2.4. Data Analysis

2.4.1. Comparison between Riparian Forests and Poplar Plantations

A two-step approach was used to evaluate vascular plant diversity in native riparian forests and poplar plantations. A Mann-Whitney U test was first carried out to detect whether species richness differed between riparian forests and poplar plantations. Non-metric multidimensional scaling (NMDS) was then performed to detect any possible differences in the vascular plant communities between riparian forests and poplar plantations, by considering (i) species frequency and (ii) C-S-R signatures. NMDS was conducted using Bray-Curtis as the distance metric, and the multivariate ordination was created using the metaMDS results. As there were only three riparian forests, which were mature and not ploughed, three adult non-harrowed poplar plantations were randomly selected to be used in both the Mann-Whitney U test and NMDS analyses for comparative purposes.

2.4.2. Comparison of Different Types of Poplar Plantations

To evaluate the possible differences in the vascular plant diversity according to type of poplar plantation (i.e., the eight possible combinations from the three factors: age, site quality and management), a three-step approach was used. First, analysis of variance (ANOVA) and a Tukey’s HSD post hoc test were used to test (i) the effect of the type of poplar plantation (combination of factors: age, site quality and understory management) on species richness; and (ii) the effect of age on annual and short-lived perennial species richness. As the data violated two of the ANOVA assumptions (normality and homogeneity of variances), robust statistical methods were applied. Thus, heteroscedastic one-way ANOVA was performed using the generalized Welch procedure and a 0.1 trimmed mean transformation. The ANOVA was carried out using the “Wilcox’ Robust Statistics (WRS)” package [46].
Second, characteristic species in each type of poplar plantation were detected using the Indicator Value (IndVal) method [47]. The value of IndValij is the product of two terms, the first referring to the performance of species i in terms of abundance across all types of poplar plantations and the other referring to the performance of the same species in terms of presence/absence within site group j. This index ranges from 0 to 100 for each species, corresponding to the largest IndVal value observed in the different habitats. A maximum IndVal value (100%) is reached when all individuals of a species are found in a single type of habitat and in all sites in that habitat. This procedure differentiates generalist (maximum IndVal at a higher cluster level) and stenotopic species (maximum at lower cluster levels) [47]. A hierarchical site typology based on the types of poplar plantations, which was established a priori, was used. The first level grouped all poplar plantations, and subsequent steps differentiated the poplar plantations as harrowed and not harrowed, then as rich and poor stands, and finally as young and adult stands according to the factorial scheme designed. The statistical significance of the index was estimated at each level of the hierarchy by random reallocation of plots among plot groups based on 999 permutations [47].
Third, NMDS and multiple response permutation procedures (MRPP) were performed using C-S-R signatures to explore the characteristics of the different types of poplar plantations and the associated stress and disturbance factors. NMDS procedures were also conducted using Bray-Curtis as the distance metric and environmental variables (i) stress factors: canopy closure and dendrometric variables as indicators of shortages of light, and soil properties as indicators of nutrient status; and (ii) disturbance factors (frequency of harrowing and number of years since the stand was last harrowed), which were significantly correlated with one or more axes, were overlaid on the ordination as vectors. MRPP was also used to test the null hypothesis of no differences in the vascular plants present in poplar plantations according to the age (young vs. adult stands), site quality (poor vs. rich) and understory management (harrowed vs. non-harrowed). MRPP was also performed using Bray-Curtis dissimilarity and running 1000 permutations.
All analyses were performed in R [48], and NMDS and MRPP analyses were conducted with the “Vegan” package [49]. Indicator Value Indexes were calculated with IndVal 2.1 software. Rare species occurring in fewer than two stands were excluded from IndVal, NMDS and MRPP analyses.

3. Results

3.1. Comparison between Riparian Forests and Poplar Plantations

Data on selected soil properties in the 32 stands studied are shown in Table 1. One of the most important features identified was the wide range of coarse fragment contents and texture. Soils ranged from alkaline to moderately acidic. Cationic exchange capacity (CEC) values and organic matter, N and P contents were low, whereas the exchangeable Ca contents were high (for more details see [44]).
Riparian forests and poplar plantations did not show any differences in understory species (N = 6, Z = 0.44, p = 0.66; average number of species in riparian forests = 21.3 and in poplar plantations = 20). Nevertheless, NMDS considering relative species frequency revealed a complete turnover of vascular plant assemblages from poplar plantations to riparian forests (Figure 3). More specifically, twenty species were associated with riparian forests and thirteen species were associated with poplar plantations.
Similarly, the NMDS ordination test clearly differentiated riparian forests and poplar plantations according to understory plant strategies. In particular, NMDS ordination showed that plant communities in riparian forests mainly used Stress-Tolerant and Competitorspecies (S–C). A clear gradient towards Ruderal species (R) was observed in poplar plantations (Figure 4).

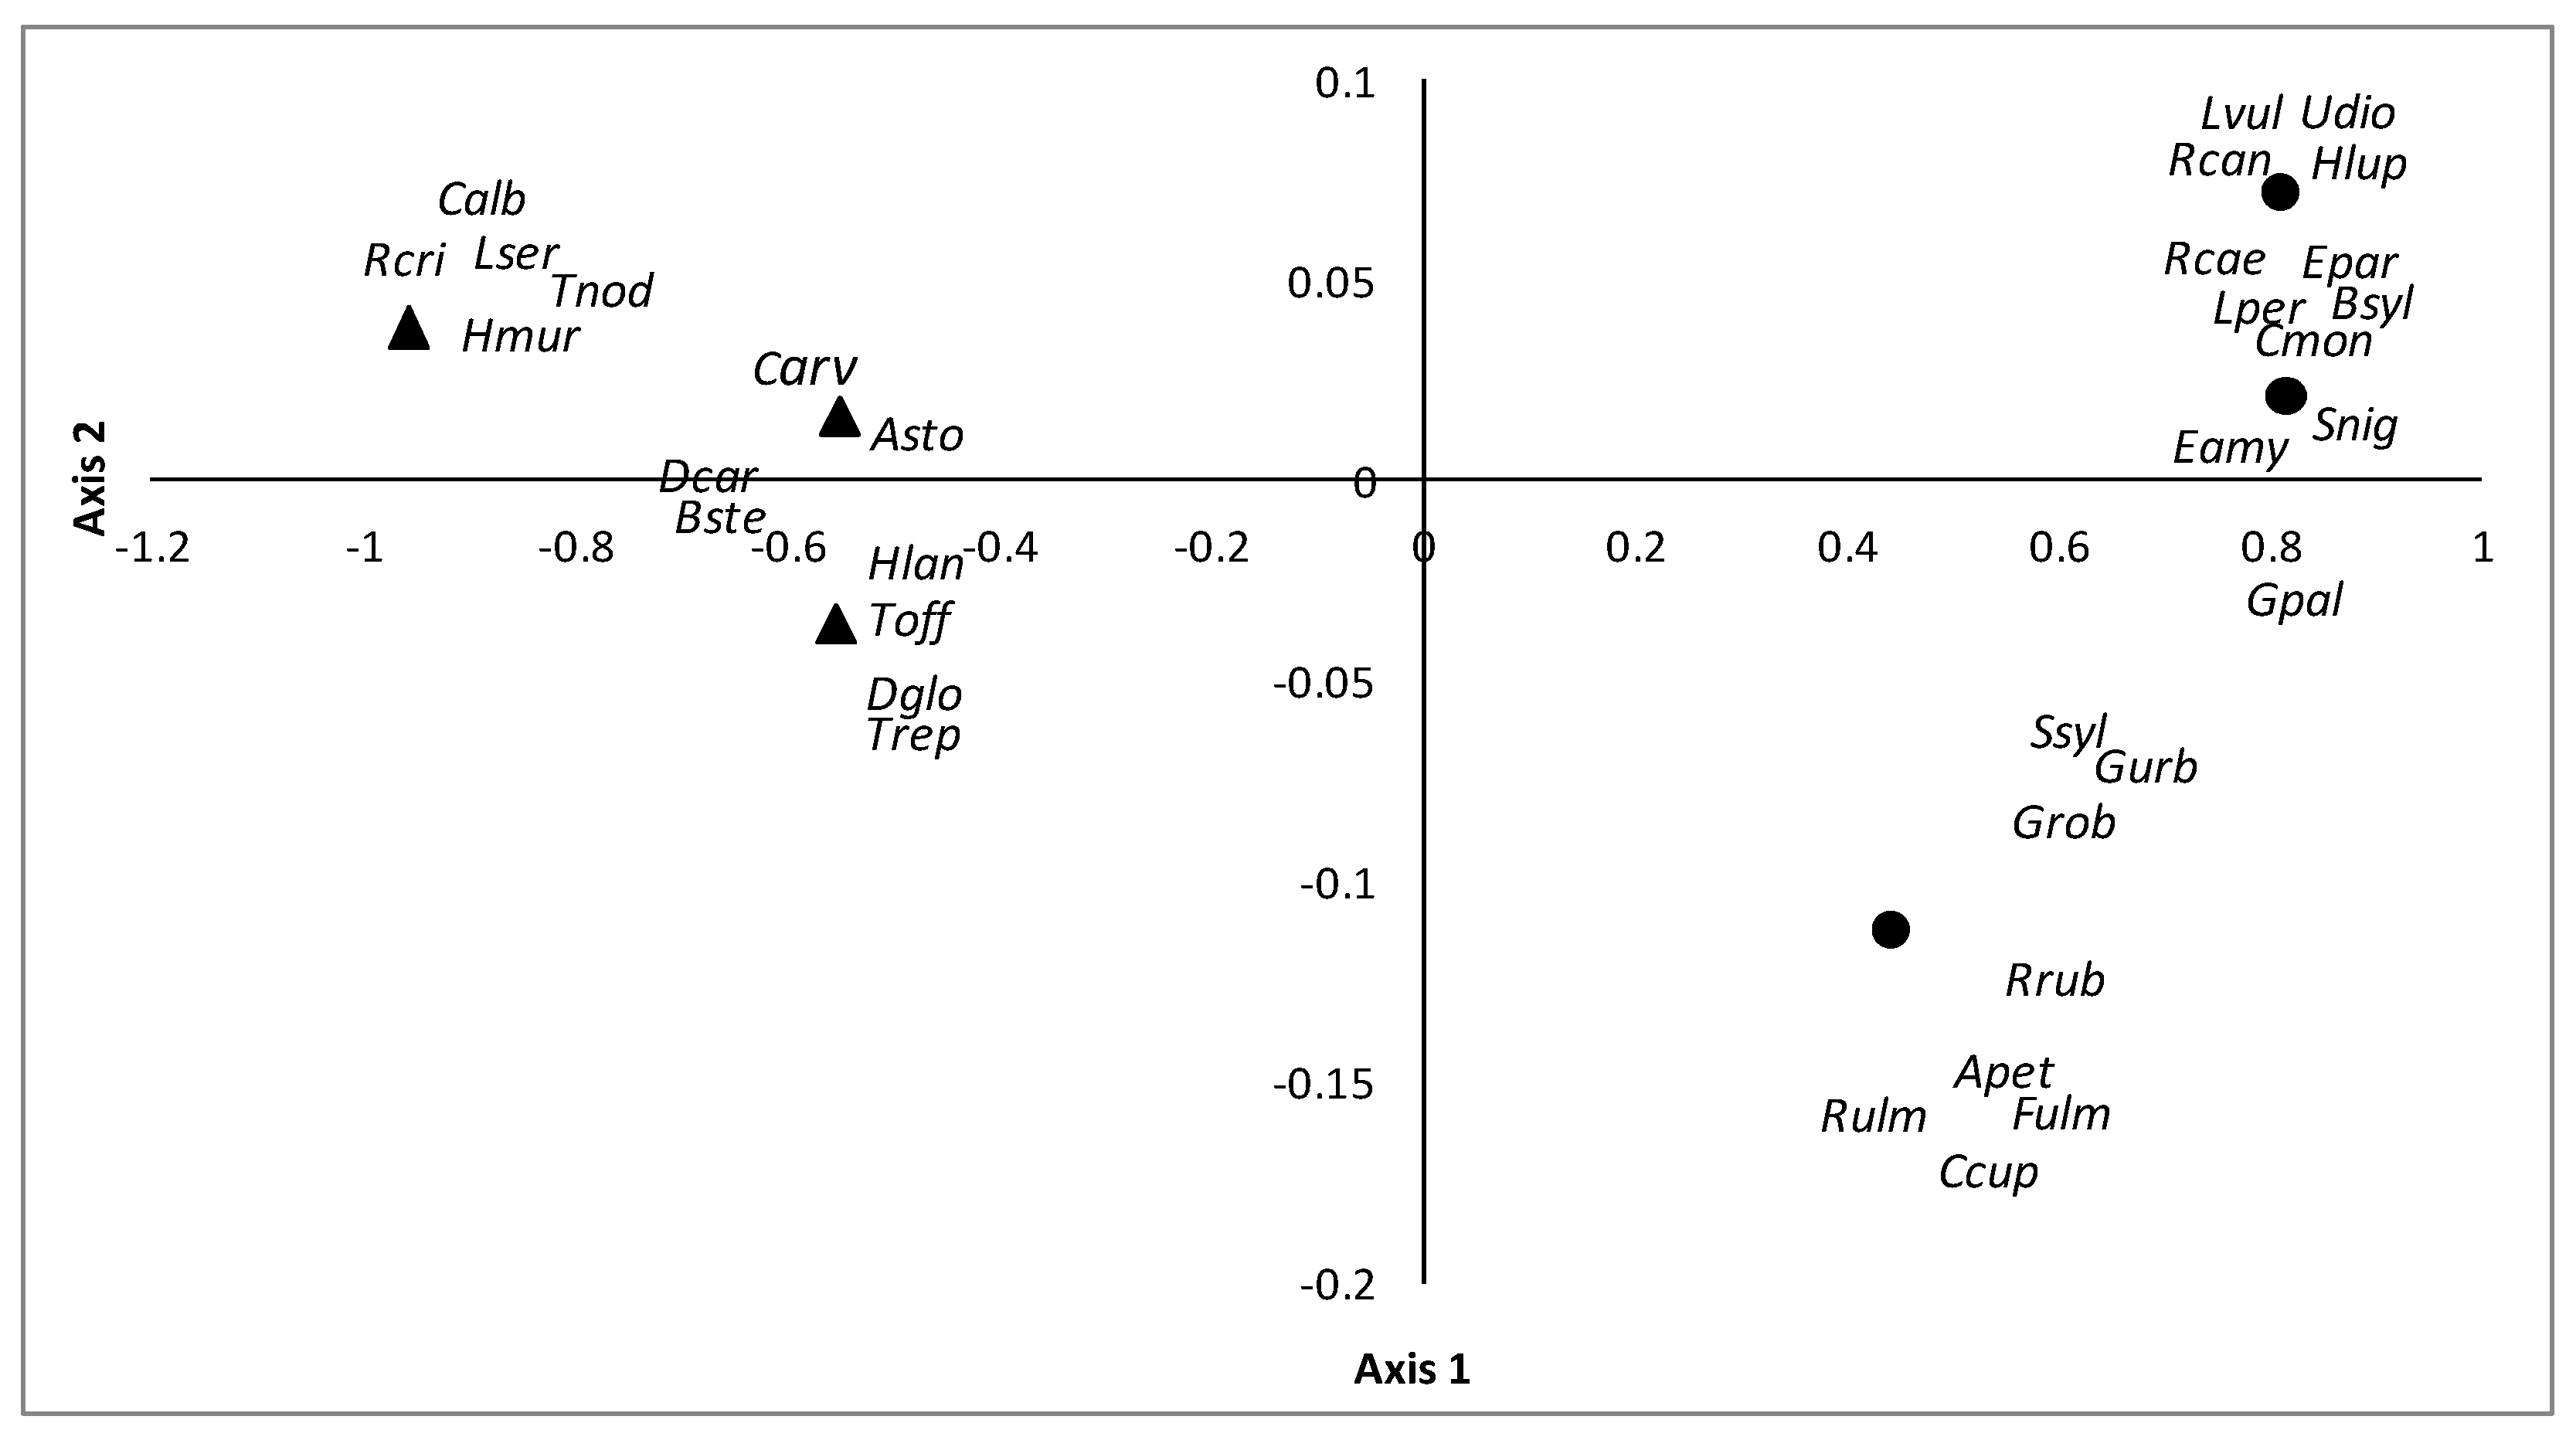
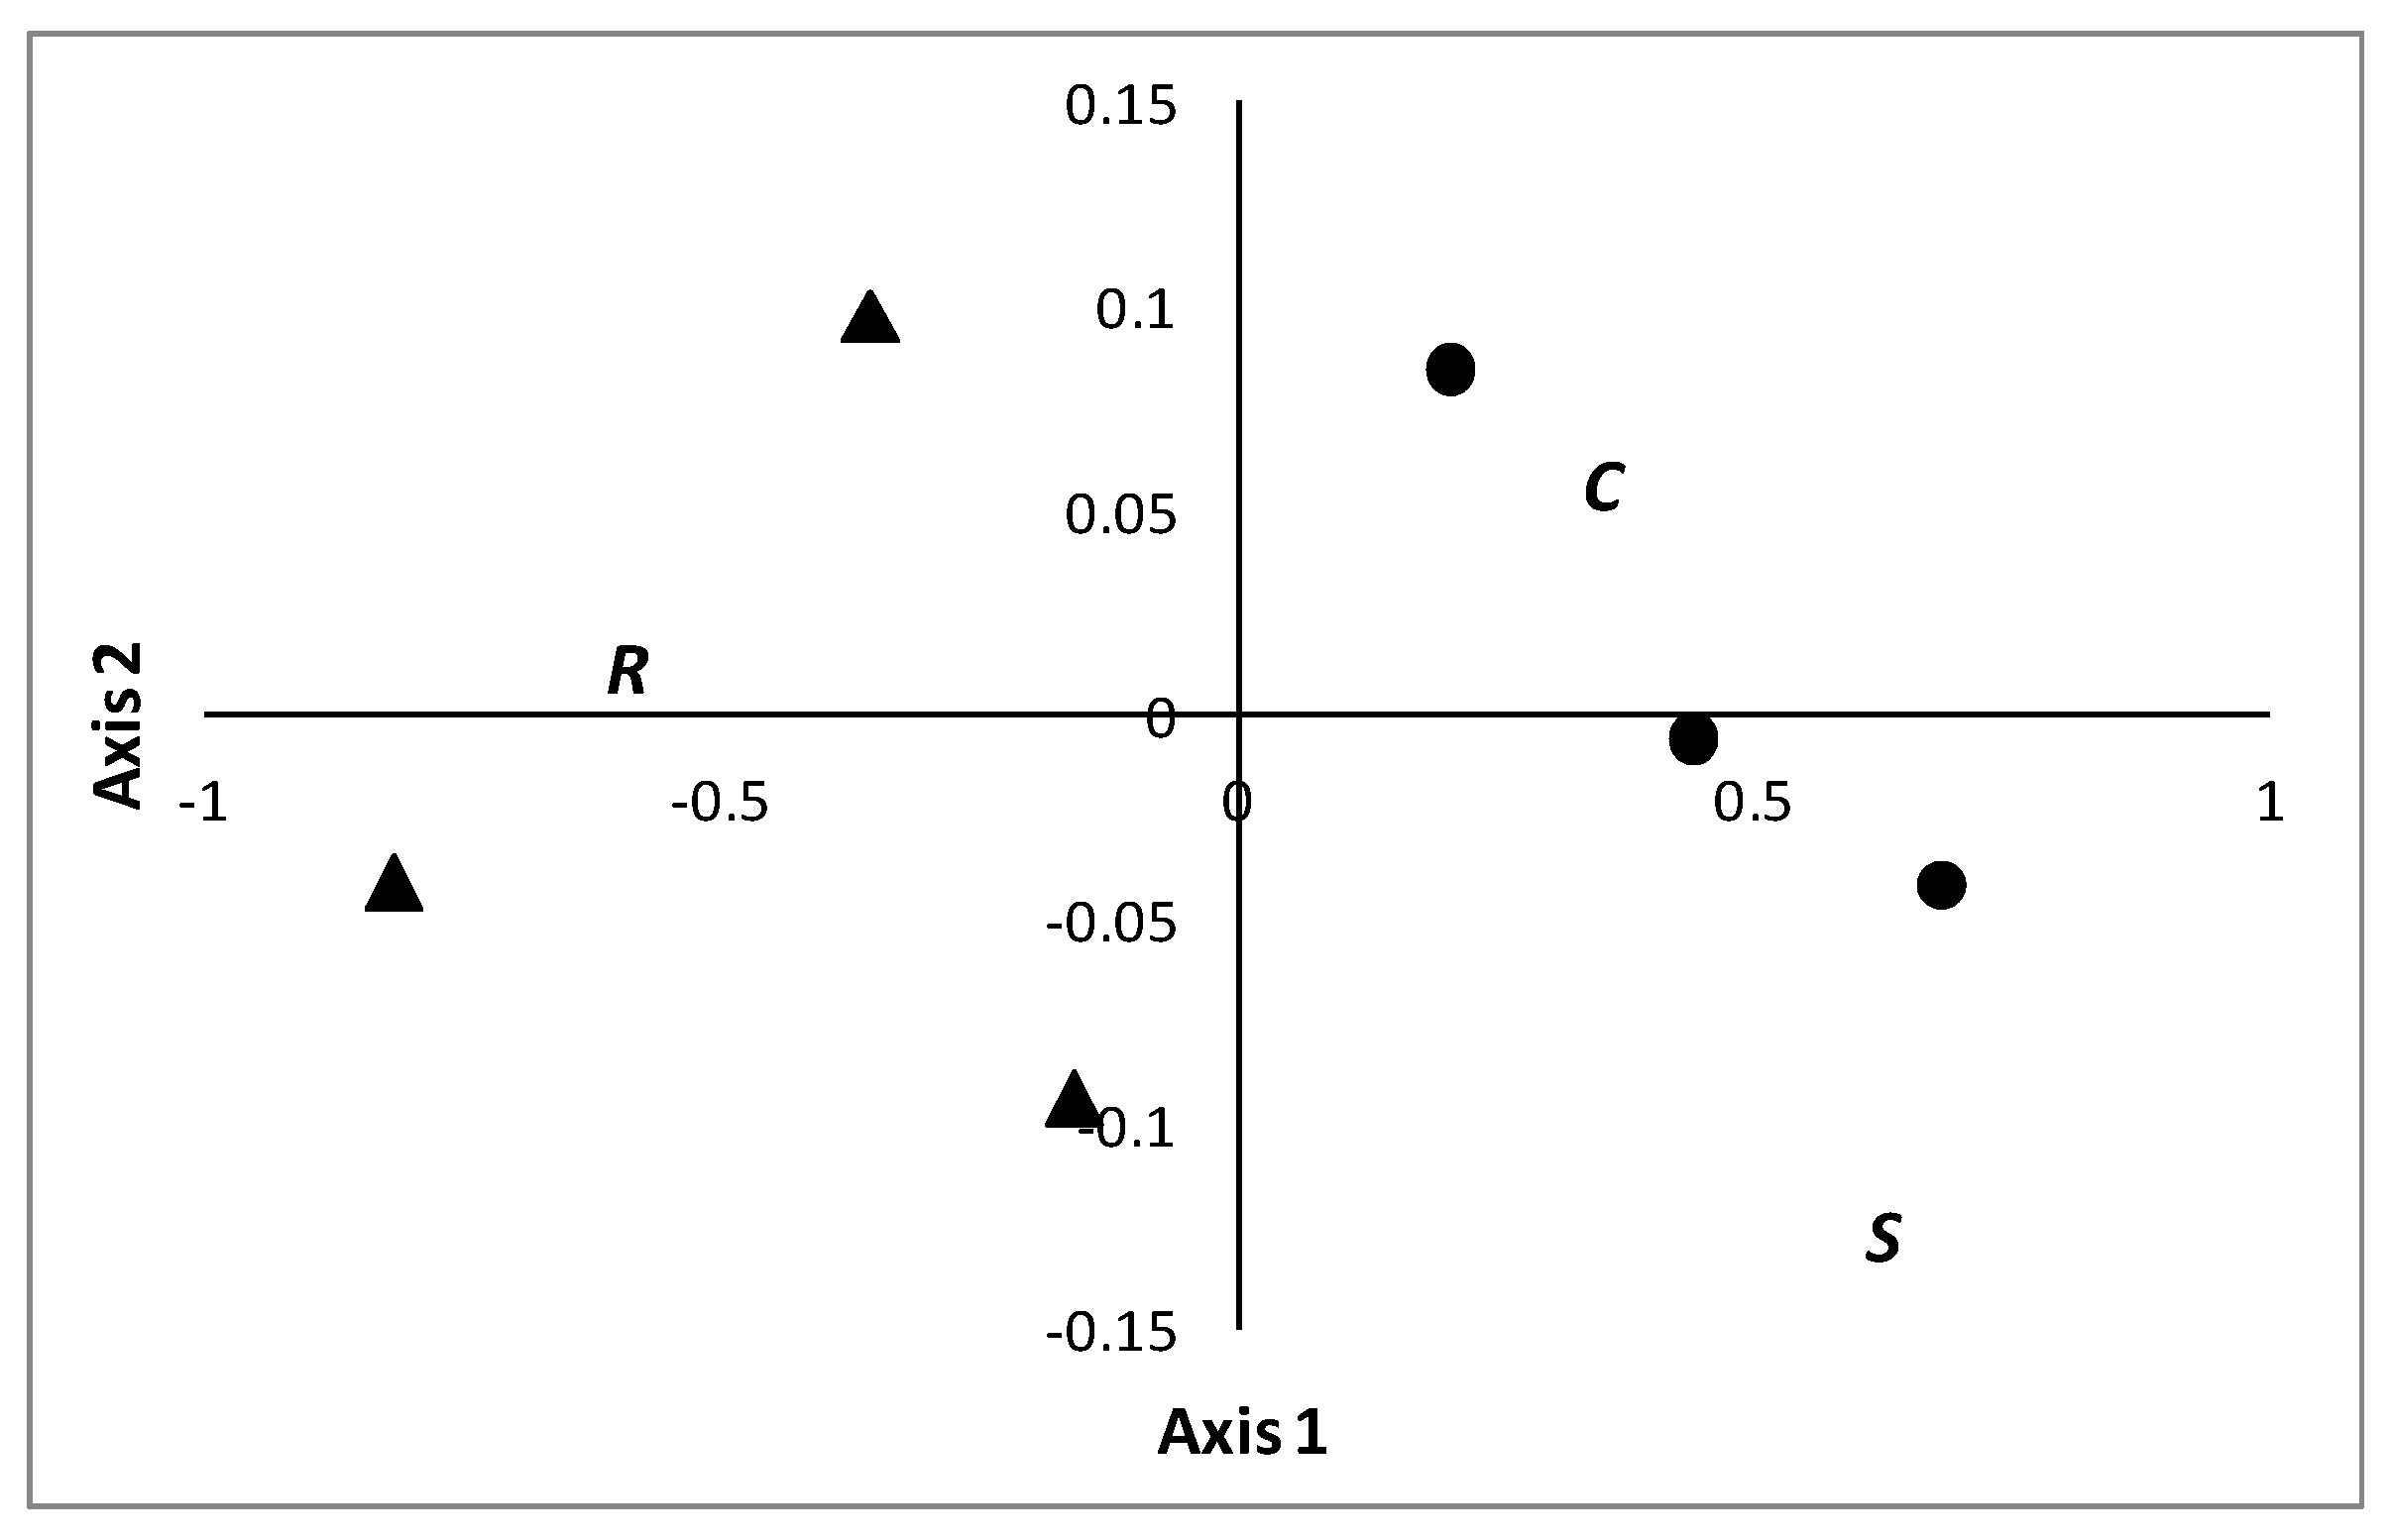
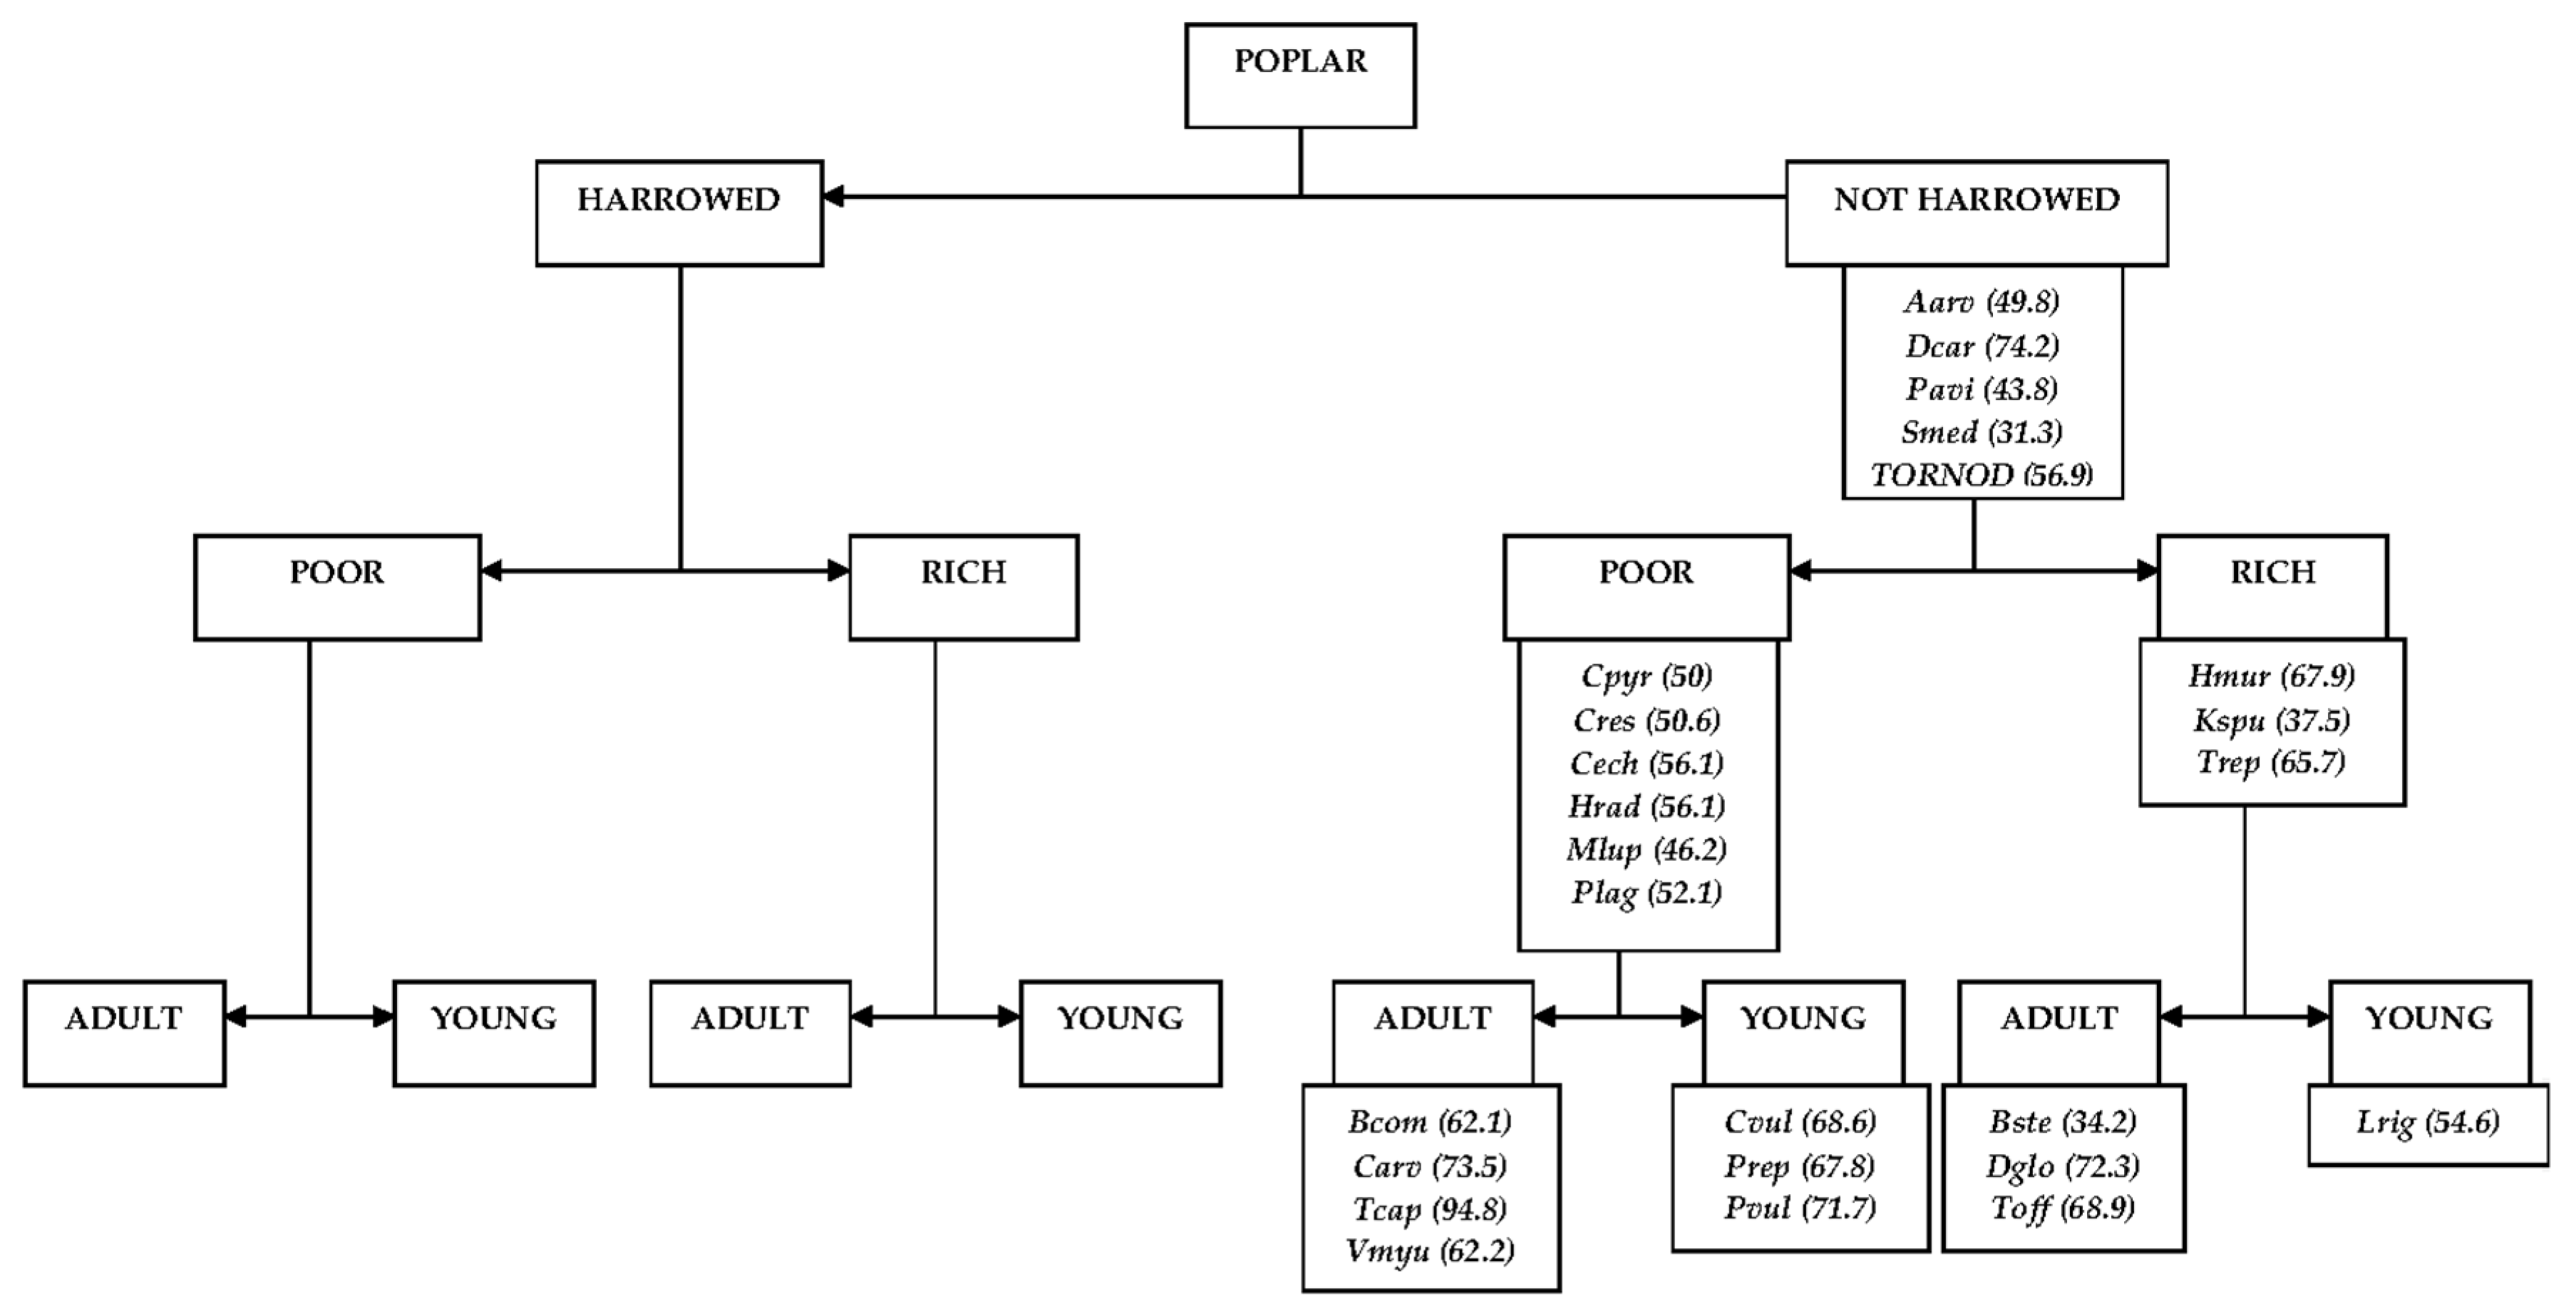
3.2. Comparison of Different Types of Poplar Plantations

A total of 133 species was recorded in the 32 poplar plantations, of which 44 occurred in only one stand. The mean values of species richness per stand differed significantly according to age (N = 32, F = 10.11, p = 0.004; average species richness in adult stands = 15.9 and in young stands = 22.9) and management (N = 32, F = 34.85, p < 0.001; average species richness in harrowed stands = 12.9 and in non-harrowed stands = 25.9), but no significant effect of site quality or interaction (i.e., age*site quality, age*management, site quality*management and age*site quality*management) was found. Furthermore, differences in the annual and short-lived perennial species richness were observed in relation to age (N = 32, FWe = 4.88, p = 0.038). In particular, young plantations included more annual and short-lived perennial species (21.4) than the adult stands (12.3).
IndVal analysis was performed for 89 species, of which 24 had a significant IndVal index at one or several levels of the typology (Figure 5). No habitat indicator species were found in harrowed stands. In particular, the maximum value for five species occurred at the first level according to management and the other nine species were found at the second level, of which six species belonged to poor stands. The third level detected eleven habitat indicator species according to age (Figure 5).
NMDS ordination and MRPP tests differentiated the C-S-R strategies in poplar plantations according to age (A = 0.06, p = 0.02) and site quality (A = 0.03, p = 0.04). In particular, NMDS ordination showed that plant communities in young plantations were mainly characterized as Ruderal species (R), whereas adult plantations (compared with young stands) were characterized by Stress-Tolerant and Competitor species (S–C) (Figure 6). Site quality also seemed to influence the strategy of plant community according to a gradient ranging from “Competitor to Stress-Tolerant species”. In particular, poplar plantations in poor sites included plant communities characterized by the Stress-Tolerant species (S), whereas in rich sites the understory species were generally Competitor species (C) (Figure 6).
Furthermore, NMDS retained two significant environmental variables (frequency of harrowing (p = 0.04) and percentage of coarse soil fragments (p = 0.04)). While the latter seems to indicate a gradient from Competitor species (C) to Stress-Tolerant species (S), the frequency of harrowing indicates a gradient from Competitor species (C) to Ruderal species (R).

4. Discussion

4.1. Comparison between Riparian Forests and Poplar Plantations

It is widely thought that biodiversity is lower in plantation forests than in natural forests. Nevertheless, several reviews have confirmed that this is not universally true [12,13,14,50]. In the present study, no differences were found in species richness between native forests and poplar plantations, which seems to indicate that the gain in disturbed habitat species may compensate for the loss of forest species in poplar plantations [51,52,53]. In contrast, Bolpagni & Piotti [10] found that the vegetation communities in lowland over-exploited riverscapes were dominated by the presence of a few opportunistic alien species.
Nevertheless, NMDS analysis detected sharp differences in vascular plant species present in riparian forests and plantations according to the species present in riparian forests and plantations. Most of the habitat indicator species identified in natural forests (Apet, Bsyl, Ccup, Eamy, Epar, Fulm, Gpal, Grob, Hlup, Lper, Lvul, Rcae, Rulm, Snig and Ssyl: see Figure 3 legend for explanation of the abbreviations) have previously been identified as having strict requirements of shade and/or soil moisture, even temporary flooding in some cases, which is typical of riparian zones [54,55]. Similar results were found in China, where the species composition of poplar plantations varied, resulting in a lower ratio of hygrophytes and a higher ratio of heliophytes [56].
Moreover, NMDS ordination clearly differentiated riparian forests and poplar plantations according to C-S-R strategies. Although plant communities in riparian forests were mainly characterized by Stress-Tolerant and Competitor species (S–C), the poplar plantations mainly supported Ruderal species (R). NMDS ordination showed differences between both types of habitats, mainly due to disturbance factors in terms of Grime’s theory (shown by the horizontal axis, Figure 4). However, no differences were found between types of habitats in terms of the stress factor (shown by vertical axis, Figure 4) in accordance with Grime’s triangle [33,34,35]. The findings seem to indicate that disturbance (harrowing) is a key factor modifying plant communities and ecological processes in poplar plantations, whereas stress seems to be less important. These findings are consistent with those obtained in other areas, where continued physical disturbance has played a key role in primary succession [35,57,58]. On the other hand, it is known that early vegetation composition after disturbance is mainly due to the species pool of the adjacent vegetation (mostly Ruderal species), whereas the soil seed bank is much less influential [59].

4.2. Comparison of Different Types of Poplar Plantations

Species richness was found to differ according to plantation age and management. In particular, species richness was lower in adult stands, due to a reduction in the number of annual species and short-lived perennial species. These types of plants invest considerable resources in producing large numbers of seeds that can survive in the soil (seed bank) for long periods: if disturbance (such as planting or harrowing) exposes the seeds to light, and the climate is favorable, the seeds will germinate and seedlings will become established and grow [34,60]. Subsequent gradual canopy closure would reduce the available light for plants and loss of generalist species should occur [61,62,63]. A decline in species richness may be expected until plantations are older than 12–13 years, at which point some riparian forest plant species could begin to be established [20]. This may explain the previously observed lack of differences between young and mature stands in hardwood forests [64], as the young stands under study were around 20 years old and recovery of forest plant species may already have been occurring, which seems to be confirmed by the fact that species composition was quite similar regardless of stand age. On the contrary, in another study of short rotation coppice plantations of poplar [23], the authors found that species richness decreased from the second year onwards. This pattern may be explained by the planting distance of 2.5 m × 0.5 m, which should lead to much earlier canopy closure than in the present study or the previously mentioned study [20], in which the planting distances ranged from 5 m × 5 m to 7 m × 7 m.
Management (i.e., harrowing carried out the last year) halved the species richness in poplar plantations, due to removal of species as a direct result of harrowing. While half of the species became established in less than a year, the remaining species may require a longer time to become established, emphasizing the importance of life strategies in determining plant assemblages. However, the opposite pattern has been reported for French poplar plantations [21,22,65]. On the other hand, higher species richness was observed in plantations where strip tillage had been carried out for site preparation in comparison with full-area ploughing [24]. Finally, we did not find any differences in species richness according to site quality, in contrast to previously observed differences in Populus tremuloides Michx. stands in northern British Columbia, Canada [66].
IndVal analysis revealed that disturbance in poplar stands (harrowing) determines the vascular plant assemblages, as all habitat indicator species found were, to a certain extent, Ruderal species (R) [54,55]. Habitat species indicators were found according to site quality and age, but the observed clusters may be due to a random effect as a result of the small number of replicates.
Although the poplar plantations were mainly characterized by Ruderal species (R), NMDS ordination showed that two factors (frequency of harrowing and percentage of coarse fragments) determined the type of C-S-R strategy used in each stand. In particular, the C-R and C-S axes were parallel to the frequency of harrowing and the percentage of coarse fragments, respectively (Figure 6). This finding is highly consistent with Grime’s theory [35], in which the C-R and C-S axes should be determined by disturbance and stress factors, respectively. With regard to disturbance, plant communities seem to be determined by the frequency of disturbance (frequency of harrowing (p = 0.04)) rather than by the time since the last disturbance (time since the land was last harrowed (p = 0.91)). Similarly, Decocq et al. [67] reported that some vascular plant species were mainly limited by the frequency of disturbance and not by the severity of disturbance.
The study findings seem to indicate that soil properties such as percentage of coarse fragments that determine habitat productivity influence vascular plant communities, whereas quantity of light transmitted to the understory was not a key factor. Thus, NMDS ordination retained the variable “percentage of coarse fragments”, which was previously recorded as the best indicator of a gradient of productivity in these poplar plantations [44], as it determines the volume of soil available for root development, the amount of available nutrients per unit of soil volume and the soil water-holding capacity. This result is consistent with findings in other areas, where soil moisture and soil nitrogen, [20] or P and K content, [61] were major determinants of plant community structure.
However, variables related to the quantity of light, such as canopy closure or dendrometric variables, were not retained by the NMDS analysis. This may be because the structure of poplar plantations (a low density of plantation around 278–400 stems/ha and all trees pruned to 6–8 m above ground level) allows enough light to be transmitted to the understory. Similar results were reported by Chen et al. [66] for P. tremuloides stands in northern British Columbia (Canada) and by Klinka et al. [68] for stands of several tree species on Vancouver Island (Canada).
MRPP tests also confirmed differences in C-S-R strategies according to site quality, although this trend was observed to a greater extent in young stands (Figure 6). This may be due to an increase in soil nutrients with age of the stand as a result of the return of some nutrients to soils through litterfall [69], or enhancement of mineralization of some nutrients because of a well-developed root system [70]. In a previous study, we observed deficiencies in several nutrients, such as nitrogen, phosphorus and boron, particularly in these young stands [44]. However, MRPP tests clearly differentiated C-S-R strategies among poplar plantations according to age, but not with respect to management (harrowed or not harrowed during the last year). This may be due to the effect of harrowing during the last year, which is not as important as the historical disturbances, as previously noted. Thus, the significant effect found by MRPP analysis according to age is probably an indirect effect due to the higher frequency of harrowing in adult stands (ANOVA, F = 4.63, p < 0.04).

5. Conclusions

The study findings indicated that poplar plantations did not include species that are specific to riparian communities and therefore should not be used as surrogates for native forests in relation to vascular plant diversity. Thus, native riparian forests should be preserved and appropriate conservation programs should be implemented as far as possible.
Disturbance, mainly by harrowing, seems to be the key factor determining the structure of vascular plant communities in poplar plantations, affecting both plant assemblages and plant strategies. To determine the structure of vascular plant communities, the frequency of harrowing is the most influential variable and is even more important than the time elapsed since the land was last harrowed. Furthermore, although poplar plantations cannot accommodate typical riparian plant species, a higher frequency of harrowing favored Ruderal species (R) to the detriment of Stress-Tolerant and Competitor species (S–C). Minimizing harrowing would be desirable, as long as this does not affect tree growth and vitality through competition, in order to favor Stress-Tolerant and Competitor strategies similar to those used by plants in native riparian forests. However, reintroduction of those riparian herbs/ferns/geophytes present only in natural riparian forests, which have low seed dispersal ability, is advisable from the sixth year (as far as possible), once harrowing for weed control has been completed.

Acknowledgments

We thank Luis Santos and Raul Fraile for technical assistance during sampling of vascular plants. Financial support for this study was provided by the European Union and the Regional Government of Castile and Leon, through the INTERREG IIIB Atlantic Area programme (FORSEE project).

Author Contributions

Jorge Martín-García, Hervé Jactel, Juan Andrés Oria-de-Rueda and Julio J. Diez conceived and designed the experiments. Jorge Martín-García performed the experiments and analyzed the data. Jorge Martín-García, Hervé Jactel, Juan Andrés Oria-de-Rueda and Julio J. Diez wrote the paper.

Conflicts of Interest

The authors declare no conflict of interest.

References

  1. Gregory, S.V.; Swanson, F.J.; McKee, W.A.; Cummins, K.W. An ecosystem perspective of riparian zones. BioScience 1991, 41, 540–551. [Google Scholar] [CrossRef]
  2. Gundersen, P.; Laurén, A.; Finér, L.; Ring, E.; Koivusalo, H.; Sætersdal, M.; Weslien, J.O.; Sigurdsson, B.B.; Högbom, L.; Laine, J.; et al. Environmental services provided from riparian forests in the Nordic countries. AMBIO 2010, 39, 555–566. [Google Scholar] [CrossRef] [PubMed]
  3. Naiman, R.J.; Decamps, H.; Pollock, M. The role of riparian corridors in maintaining regional biodiversity. Ecol. Appl. 1993, 3, 209–212. [Google Scholar] [CrossRef]
  4. Kauffman, J.B.; Beschta, R.L.; Otting, N.; Lytjen, D. An ecological perspective of riparian and stream restoration in the Western United States. Fisheries 1997, 22, 12–24. [Google Scholar] [CrossRef]
  5. Naiman, R.J.; Decamps, H. The ecology of interfaces: Riparian zones. Ann. Rev. Ecol. Syst. 1997, 28, 621–658. [Google Scholar] [CrossRef]
  6. Stutter, M.I.; Chardon, W.J.; Kronvang, B. Riparian buffer strips as a multifunctional management tool in agricultural landscapes: Introduction. J. Environ. Qual. 2012, 41, 297–303. [Google Scholar] [CrossRef] [PubMed]
  7. Nilsson, C.; Berggren, K. Alterations of Riparian Ecosystems Caused by River Regulation. BioScience 2000, 50, 783–792. [Google Scholar] [CrossRef]
  8. Schnitzler, A. Conservation of biodiversity in alluvial hardwood forests of the temperate zone. The example of the Rhine valley. For. Ecol. Manag. 1994, 68, 385–398. [Google Scholar] [CrossRef]
  9. González, M.; García, D. Restauración de Ríos. Guía Metodológica para la Elaboración de Proyectos; Secretaria General Técnica; Centro de Publicaciones, Ministerio de Medio Ambiente: Madrid, Spain, 2007; pp. 1–318. [Google Scholar]
  10. Bolpagni, R.; Piotti, A. Hydro-hygrophilous vegetation diversity and distribution patterns in riverine wetlands in an agricultural landscape: A case study from the Oglio River (Po Plain, Northern Italy). Phytocoenologia 2015, 45, 69–84. [Google Scholar] [CrossRef] [PubMed]
  11. Boothroyd-Roberts, K.; Gagnon, D.; Truax, B. Can hybrid poplar plantations accelerate the restoration of forest understory attributes on abandoned fields? For. Ecol. Manag. 2013, 287, 77–89. [Google Scholar] [CrossRef]
  12. Bremer, L.L.; Farley, K.A. Does plantation forestry restore biodiversity or create green deserts? A synthesis of the effects of land-use transitions on plant species richness. Biodivers. Conserv. 2010, 19, 3893–3915. [Google Scholar] [CrossRef]
  13. Brockerhoff, E.; Jactel, H.; Parrotta, J.A.; Quine, C.P.; Sayer, J. Plantation forests and biodiversity: Oxymoron or opportunity? Biodivers. Conserv. 2008, 17, 925–951. [Google Scholar] [CrossRef]
  14. Carnus, J.-M.; Parrotta, J.; Brockerhoff, E.; Arbez, M.; Jactel, H.; Kremer, A.; Lamb, D.; O’Hara, K.; Walters, B. Planted forests and biodiversity. J. For. 2006, 104, 65–77. [Google Scholar]
  15. Hartley, M.J. Rationale and methods for conserving biodiversity in plantation forests. For. Ecol. Manag. 2002, 155, 81–95. [Google Scholar] [CrossRef]
  16. Irwin, S.; Pedley, S.M.; Coote, L.; Dietzsch, A.C.; Wilson, M.W.; Oxbrough, A.; Sweeney, O.; Moore, K.M.; Martin, R.; Kelly, D.L.; et al. The value of plantation forests for plant, invertebrate and bird diversity and the potential for cross-taxon surrogacy. Biodivers. Conserv. 2014, 23, 697–714. [Google Scholar] [CrossRef]
  17. Loyn, R.; Mcnabb, E.G.; Macak, P.; Noble, P. Eucalypt plantations as habitat for birds on previously cleared farmland in south-eastern Australia. Biodivers. Conserv. 2007, 137, 533–548. [Google Scholar]
  18. Paquette, A.; Messier, C. The role of plantations in managing the world’s forests in the Anthropocene. Front. Ecol. Environ. 2010, 8, 27–34. [Google Scholar] [CrossRef] [Green Version]
  19. Tullus, A.; Rytter, L.; Tullus, T.; Weih, M.; Tullus, H. Short-rotation forestry with hybrid aspen (Populus tremula L. × P. tremuloides Michx.) in Northern Europe. Scand. J. For. Res. 2012, 27, 10–29. [Google Scholar] [CrossRef]
  20. Archaux, F.; Chevalier, R.; Berthelot, A. Towards practices favourable to plant diversity in hybrid poplar plantations. For. Ecol. Manag. 2010, 259, 2410–2417. [Google Scholar] [CrossRef]
  21. Laquerbe, M. Communautés de sous-bois des peupleraies artificielles: Relation entre phytomasse, richesse spécifique et perturbations. Ann. For. Sci. 1999, 56, 607–614. [Google Scholar] [CrossRef]
  22. Laquerbe, M. Richesse spécifique et phytomasse des sous-bois de peupleraies cultivées en bordure de Garonne (Sud-Ouest de la France). Ann. For. Sci. 2000, 57, 767–776. [Google Scholar] [CrossRef]
  23. Birmele, J.; Gabriele, K.; Frank, B.; Werner, K.; Hans, S.U. Successional changes of phytodiversity on a short rotation coppice plantation in Oberschwaben, Germany. Front. Plant Sci. 2015, 6, 124:1–124:8. [Google Scholar] [CrossRef] [PubMed]
  24. Soo, T.; Tullus, A.; Tullus, H.; Roosaluste, E. Floristic diversity responses in young hybrid aspen plantations to land-use history and site preparation treatments. For. Ecol. Manag. 2009, 257, 858–867. [Google Scholar] [CrossRef]
  25. Haeussler, S.; Bedford, L.; Boateng, J.O.; MacKinnon, A. Plant community responses to mechanical site preparation in northern interior British Columbia. Can. J. For. Res. 1999, 29, 1084–1100. [Google Scholar] [CrossRef]
  26. Gao, T.; Nielsenb, A.B.; Hedblom, M. Reviewing the strength of evidence of biodiversity indicators for forest ecosystems in Europe. Ecol. Indic. 2015, 57, 420–434. [Google Scholar] [CrossRef]
  27. Gray, A.N.; Azuma, D.L. Repeatability and implementation of a forest vegetation indicator. Ecol. Indic. 2005, 5, 57–71. [Google Scholar] [CrossRef]
  28. Lindenmayer, D.V.; Margules, C.R.; Botkin, D.A. Indicator of biodiversity for ecologically sustainable forest management. Conserv. Biol. 2000, 14, 941–950. [Google Scholar] [CrossRef]
  29. Aubin, I.; Messier, C.; Bouchard, A. Can plantations develop understory biological and physical attributes of naturally regenerated forests? Biol. Conserv. 2008, 141, 2461–2476. [Google Scholar] [CrossRef] [Green Version]
  30. Díaz, S.; Cabido, M. Vive la différence: Plant functional diversity matters to ecosystem processes. Trends Ecol. Evol. 2001, 16, 646–655. [Google Scholar] [CrossRef]
  31. Fleishman, E.; Noss, R.F.; Noon, B.R. Utility and limitations of species richness metrics for conservation planning. Ecol. Indic. 2006, 6, 543–553. [Google Scholar] [CrossRef]
  32. Grime, J.P. Competitive exclusion in herbaceous vegetation. Nature 1973, 242, 344–347. [Google Scholar] [CrossRef]
  33. Grime, J.P. Vegetation classification by reference to strategies. Nature 1974, 250, 26–31. [Google Scholar] [CrossRef]
  34. Grime, J.P. Evidence for the existence of three primary strategies in plants and its relevance to ecological and evolutionary theory. Am. Nat. 1977, 111, 1169–1194. [Google Scholar] [CrossRef]
  35. Grime, J.P. Plant Strategies, Vegetation Processes, and Ecosystem Properties, 2nd ed.; John Wiley & Sons Ltd: Chichester, UK, 2001. [Google Scholar]
  36. Ninyerola, M.; Pons, X.; Roure, J.M. Atlas Climático Digital de la Península Ibérica. Metodología y Aplicaciones en Bioclimatología y Geobotánica; Universidad Autónoma de Barcelona: Bellaterra, Spain, 2005. [Google Scholar]
  37. Lara, F.; Garilleti, R.; Calleja, J.A. La Vegetación de Ribera de la Mitad Norte Española; Serie Monografías, 81; Centro de Estudios de Técnicas Aplicadas del CEDEX: Madrid, Spain, 2004; pp. 1–536. [Google Scholar]
  38. Díaz, L.; Romero, C. Caracterización económica de las choperas en Castilla y León: Rentabilidad y turnos óptimos. In Proceedings of the I Simposio del Chopo, Zamora, Spain, 9–11 May 2001; pp. 489–500.
  39. Fernández, A.; Hernanz, G. El Chopo (Populus sp.) Manual de Gestión Forestal Sostenible; Junta de Castilla y León: Burgos, Spain, 2004; pp. 1–53. [Google Scholar]
  40. De Mier, A. Optimización de los sistemas de plantación y producción de chopo. In Proceedings of the I Simposio del Chopo, Zamora, Spain, 9–11 May 2001; pp. 97–105.
  41. Bravo, F.; Grau, J.M.; Antoñanzas, F.G. Curvas de calidad y tablas de producción para Populus x euramericana en la cuenca del Duero. Montes 1995, 44, 43–46. [Google Scholar]
  42. Eichhorn, J.; Roskams, P.; Ferretti, M.; Mues, V.; Szepesi, A.; Durrant, D. Part II: Visual assessment of tree condition. In Manual on Methods and Criteria for Harmonized Sampling, Assessment, Monitoring and Analysis of the Effects of Air Pollution on Forests; United Nations Economics Commission for Europe, International Cooperative Programme on Assessment and Monitoring of Air Pollution Effects on Forests (ICP-Forests): Hamburg, Germany, 2010. [Google Scholar]
  43. Martín-García, J.; Diez, J.J.; Jactel, H. Towards standardised crown condition assessment in poplar plantations. Ann. For. Sci. 2009, 66, 308–314. [Google Scholar] [CrossRef]
  44. Martín-García, J.; Merino, A.; Diez, J.J. Relating visual crown conditions to nutritional status and site quality in monoclonal poplar plantations (Populus x euramericana). Eur. J. For. Res. 2012, 131, 1185–1198. [Google Scholar] [CrossRef]
  45. Hunt, R.; Hodgson, J.G.; Thompson, K.; Bungener, P.; Dunnett, N.P.; Askew, A.P. A new practical tool for deriving a functional signature for herbaceous vegetation. Appl. Veg. Sci. 2004, 7, 163–170. [Google Scholar] [CrossRef]
  46. Wilcox, R.R.; Schönbrodt, F.D. The WRS Package for Robust Statistics in R. R Package Version 0.24, 2014. Available online: https://github.com/nicebread/WRS (accessed on 10 November 2015).
  47. Dufrêne, M.; Legendre, P. Species Assemblages and Indicator Species: The Need for a Flexible Asymmetrical Approach. Ecol. Monogr. 1997, 67, 345–366. [Google Scholar] [CrossRef]
  48. R-Development-Core-Team. R: A Language and Environment for Statistical Computing; R Foundation for Statistical Computing: Vienna, Austria, 2014. [Google Scholar]
  49. Oksanen, J.; Blanchet, F.G.; Kindt, R.; Legendre, P.; Minchin, P.R.; O’Hara, R.B.; Simpson, G.L.; Solymos, P.; Stevens, M.H.H.; Wagner, H. Vegan: Community Ecology Package. R Package Version 2.3–0, 2015. Available online: http://CRAN.R-project.org/package=vegan (accessed on 10 November 2015).
  50. Stephens, S.S.; Wagner, M.R. Forest plantations and biodiversity: A fresh perspective. J. For. 2007, 105, 307–313. [Google Scholar]
  51. Fortier, J.; Gagnon, D.; Truax, B.; Lambert, F. Understory plant diversity and biomass in hybrid poplar riparian buffer strips in pastures. New For. 2011, 42, 241–265. [Google Scholar] [CrossRef]
  52. Roberts, M.R. Effects of forest plantation management on herbaceous-layer composition and diversity. Can. J. Bot. 2002, 80, 378–389. [Google Scholar] [CrossRef]
  53. Schoonmaker, P.; McKee, A. Species composition and diversity during secondary succession of coniferous forests in the Western Cascade Mountains of Oregon. For. Sci. 1988, 34, 960–979. [Google Scholar]
  54. Aizpuru, I.; Aseguinolaza, C.; Uribe-Echebarría, P.M.; Urrutia, P.; Zorrakín, I. Claves Ilustradas de la Flora del País Vasco y Territorios Limítrofes; Servicio Central de Publicaciones del Gobierno Vasco: Vitoria-Gasteiz, Spain, 1999; pp. 1–831. [Google Scholar]
  55. Alejandre, J.A.; García, J.M.; Mateo, J. Atlas de la Flora Vascular Silvestre de Burgos; Monografías de Botánica Ibérica n°2; Jolube Consultor Botánico y Editor: Jaca, Spain, 2006; pp. 1–925. [Google Scholar]
  56. Li, Y.; Chen, X.; Xie, Y.; Li, X.; Li, F.; Hou, Z. Effects of young poplar plantations on understory plant diversity in the Dongting Lake wetlands, China. Sci. Rep. 2014, 4. [Google Scholar] [CrossRef] [PubMed]
  57. Caccianiga, M.; Luzzaro, A.; Pierce, S.; Ceriani, R.M.; Cerabolini, B. The functional basis of a primary succession resolved by CSR classification. Oikos 2006, 112, 10–20. [Google Scholar] [CrossRef]
  58. Ciccarelli, D. Mediterranean coastal dune vegetation: Are disturbance and stress the key selective forces that drive the psammophilous succession? Estuar. Coast. Shelf. Sci. 2015, 165, 247–253. [Google Scholar] [CrossRef]
  59. Baum, S.; Weih, M.; Bolte, A. Floristic diversity in Short Rotation Coppice (SRC) plantations: Comparison between soil seed bank and recent vegetation. Appl. Agric. For. Res. 2013, 3, 221–228. [Google Scholar]
  60. Decocq, G.; Valentin, B.; Toussaint, B.; Hendoux, F.; Saguez, R.; Bardat, J. Soil seed bank composition and diversity in a managed temperate deciduous forest. Biodivers. Conserv. 2004, 13, 2485–2509. [Google Scholar] [CrossRef]
  61. Baum, S.; Weih, M.; Bolte, A. Stand age characteristics and soil properties affect species composition of vascular plants in short rotation coppice plantations. BioRisk 2012, 7, 51–71. [Google Scholar] [CrossRef]
  62. Berthelot, A.; Augustin, S.; Godin, J.; Decocq, G. Biodiversity in poplar plantations in the Picardie region of France. Unasylva 2005, 55, 18–19. [Google Scholar]
  63. Small, C.J.; McCarthy, B.C. Relationship of understory diversity to soil nitrogen, topographic variation, and stand age in an eastern oak forest, USA. For. Ecol. Manag. 2005, 217, 229–243. [Google Scholar] [CrossRef]
  64. Gilliam, F.S.; Turrill, N.L.; Adams, M.B. Herbaceous-Layer and Overstory Species in Clear-cut and Mature Central Appalachian Hardwood Forests. Ecol. Appl. 1995, 5, 947–955. [Google Scholar] [CrossRef]
  65. Berthelot, A.; Roguier, S.; Landeau, S. Type d’entretien et diversité floristique sous peupleraie. Rev. For. Fr. 2001, 51, 333–336. [Google Scholar] [CrossRef]
  66. Chen, H.Y.H.; Légaré, S.; Bergeron, Y. Variation of the understory composition and diversity along a gradient of productivity in Populus tremuloides stands in northern of British Columbia, Canada. Can. J. Bot. 2004, 82, 1314–1323. [Google Scholar] [CrossRef]
  67. Decocq, G.; Aubert, M.; Dupont, F.; Alard, D.; Saguez, R.; Wattez-Franger, A.; De Foucault, B.; Delelis-Dusollier, A.; Bardat, J. Plant diversity in a managed temperate deciduous forest: Understory response to two silvicultural systems. J. Appl. Ecol. 2004, 41, 1065–1079. [Google Scholar] [CrossRef]
  68. Klinka, K.; Chen, H.Y.H.; Wang, Q.; Montigny, L. Forest canopies and their influence on understory vegetation early-seral stands on West Vancouver Island. Northwest Sci. 1996, 70, 193–200. [Google Scholar]
  69. Das, D.K.; Chaturvedi, O.P. Structure and function of Populus deltoides agroforestry systems in eastern India: 2. Nutrient dynamics. Agrofor. Syst. 2005, 65, 223–230. [Google Scholar] [CrossRef]
  70. Browaldh, M. Change in soil mineral nitrogen and respiration following tree harvesting from an agrisilvicultural system in Sweden. Agrofor. Syst. 1997, 35, 131–138. [Google Scholar] [CrossRef]
Figure 1. Geographical location of the study site.
Forests 07 00050 g001
Figure 2. Sampling design adopted in the study.
Forests 07 00050 g002
Figure 3. Ordination of vascular plants and stands. Type of forest: riparian forests are represented by circles, and poplar plantations (adult stands, not harrowed) by triangles. Vascular plant species: Apet Alliaria petiolata (M. Bieb.) Cavara & Grande, Asto Agrostis stolonifera L., Bste Bromus sterilis L., Bsyl Brachypodium sylvaticum (Hudson) Beauv., Calb Chenopodium album L., Carv Cirsium arvense (L.) Scop., Ccup Carex cuprina (I. Sándor ex Heuff.) Nendtv. ex A. Kern., Cmon Crataegus monogyna Jacq., Dcar Daucus carota L., Dglo Dactylis glomerata L., Epar Epilobium parviflorum Schreb., Eamy Euphorbia amygdaloides L., Fulm Filipendula ulmaria (L.) Maxim., Gpal Gallium palustre L., Grob Geranium robertianum L., Gurb Geum urbanum L., Hlan Holcus lanatus L., Hlup Humulus lupulus L., Hmur Hordeum murinum L., Lser Lactuca serriola L., Lvul Ligustrum vulgare L., Lper Loniera peryclimenum L., Rrub Ribes rubrum L., Rcan Rosa canina L., Rcae Rubus caesius L., Rcris Rumex crispus L., Rulm Rubus ulmifolius Schott, Snig Sambucus nigra L., Ssyl Stachys sylvatica L., Tnod Torilis nodosa (L.) Gaertn., Toff Taraxacum officinale gr Weber, Trep Trifolium repens L. and Udio Urtica dioica L.
Forests 07 00050 g003
Figure 4. Ordination of C-S-R signatures and stands. Type of forest: riparian forests are represented by circles, and poplar plantations (adult stands, not harrowed) by triangles. C-R-S signatures: C Competitor species, R Ruderal species and S Stress-Tolerant species.
Forests 07 00050 g004
Figure 5. Habitat indicator species for the different levels of the hierarchical site typology (indicator value in brackets). Aarv Anthemis arvensis, Bcom Bromus commutatus, Bste Bromus sterilis, Carv Convolvulus arvensis, Cech Cynosurus echinatus, Cpyr Cirsium pyrenaicum, Cres Crepis sp., Cvul Cirsium vulgare, Dcar Daucus carota, Dglo Dactylis glomerata, Hmur Hordeum murinum, Hrad Hypochoeris radicata, Kspu Kickxia spuria, Lrig Lolium rigidum, Mlup Medicago lupulina, Pavi Polygonum aviculare, Plag Plantago lagopus, Prep Potentilla reptans, Pvul Prunella vulgaris, Smed Stellaria media, Tcap Taeniatherum caput-medusae, Toff Taraxacum officinale gr, Trep Trifolium repens, Vmyu Vulpia myuros.
Forests 07 00050 g005
Figure 6. Ordination of vascular plants, stands and the environmental variables (represented by continuous arrows) retained by NMDS analysis. Type of forest: Adult-Poor-Harrowed are represented by black triangles, Adult-Poor-Not harrowed by black diamonds, Adult-Rich-Harrowed by black squares, Adult-Rich-Not harrowed by black circles, Young-Poor-Harrowed by white triangles, Young-Poor-Not harrowed by white diamonds, Young-Rich-Harrowed by white squares and Young-Rich-Not harrowed by white circles. C-R-S signatures: C Competitor, R Ruderal and S Stress-Tolerant species. Dotted arrows indicate the hypothetical axes (stress and disturbance) in terms of Grime’s theory.
Forests 07 00050 g006
Table 1. Summary of selected soils properties in the 32 poplar stands under study.
Soil Properties
Mean (± S.D.)Range
Coarse fragments (%)28.0 (24.2)0.64–82.1
Sand (%)68.1 (7.0)50.9–83.7
Silt (%)17.5 (5.5)9.6–32.1
Clay (%)14.3 (3.1)6.7–23.7
pH7.5 (0.93)5.9–8.6
OM (%)2.2 (0.94)0.84–5.1
N (%)0.11 (0.04)0.05–0.22
C/N12.1 (4.4)6.2–25.9
P (mg·kg−1)9.5 (8.8)0.1–34.8
K (mg·kg−1)105.9 (85.3)25.0–374.2
Ca (cmolc·kg−1)9.8 (5.4)2.8–19.4
Mg (cmolc·kg−1)0.61 (0.21)0.2–1.13
CEC (cmolc·kg−1)13.9 (3.1)8.8–22.2

