Article

National Assessment of the Fragmentation Levels and Fragmentation-Class Transitions of the Forests in Mexico for 2002, 2008 and 2013

by
Elizabeth Clay
1,
Rafael Moreno-Sanchez
1,*,
Juan Manuel Torres-Rojo
2 and
Francisco Moreno-Sanchez
3
1
Department of Geography and Environmental Sciences, University of Colorado, Denver, CO 80202, USA
2
Centro de Investigación y Docencia Económicas (CIDE), Carretera México-Toluca 3655, Col. Lomas de Santa Fe, Mexico D.F. 01210, Mexico
3
Instituto Nacional de Investigaciones Forestales y Agropecuarias, (INIFAP), Col. Barrio de Santa Catarina, Delegación Coyoacán, Mexico, D.F. 04010, México
*
Author to whom correspondence should be addressed.
Forests 2016, 7(3), 48; https://doi.org/10.3390/f7030048
Submission received: 27 October 2015 / Revised: 28 January 2016 / Accepted: 4 February 2016 / Published: 24 February 2016

Abstract

:
Landscape modification and habitat fragmentation are key drivers of global species and biodiversity loss, as well as a major threat to the conservation of forest ecosystems. Mexico is one of the five biologically richest countries in the world. This study first generated a national level assessment of the fragmentation of temperate and tropical forests in Mexico for 2002, 2008, and 2013. Then, using these results, it explores how transitions to non-forest or to other fragmentation classes have evolved within the previous date fragmentation classes for the 2002–2008 and 2008–2013 periods. The Morphological Spatial Pattern Analysis (MSPA) method was used to assess the forest fragmentation. The results show that high fragmentation classes are more likely to transition to no-forest land covers in tropical than in temperate forests and that these conversions were larger during 2002–2008 than during the 2008–2013 period in both forest types. When analyzing the transitions between fragmentation classes, a higher percent of the forest area remained the same fragmentation class between 2008 and 2013 than from 2002 to 2008. Transitions between forest fragmentation classes were relatively small compared to transitions to no-forest land covers, and transitions to higher fragmentation classes were slightly larger in tropical than in temperate forests.

1. Introduction

Landscape modification and habitat (including forests) fragmentation are key drivers of global species and biodiversity loss, and are believed to negatively affect virtually all taxonomic groups of animals and plants, as well as key ecosystem components and functions of temperate and tropical forests for long periods of time [1,2,3,4,5]. Studies have shown that more than a century after forests stabilize at some level of fragmentation a deficit still persists in the number of plant species that originally occupied those forests [2], and that the processes of species colonization of second-growth and fragmented forests may continue for centuries with 100–200-year-old recent forests still having lower species richness of forest herbaceous vegetation than ancient forests [2,6,7,8]. Increase in fragmentation has also been identified as a major threat to the conservation of forest ecosystems and their functions as a whole [9,10,11,12,13]. For example, it is known that fragmentation and edge effects strongly affect forest microclimate, tree mortality, carbon storage, fauna, flora, and forest structure [12,13].
This issue of forest fragmentation, and more generally habitat fragmentation, is complex and it is one of the most extensively studied topics in conservation biology [3,4,5,6,7,8,9,13,14,15,16,17,18,19,20,21]. Habitat fragmentation consists of both reduction in the total area of the original habitat and change in the spatial pattern of what remains. Several factors contribute to the complexity in defining fragmentation and its effects [9,22,23,24,25,26]. All natural environments are fragmented to some degree and they are subject to continuous change due to natural processes. Different single species, groups of species, and ecological systems experience and respond to the degree of fragmentation of a particular environment in different, even contradictory ways. Numerous temporal and spatial scales must be considered since the relevant scales for different single species, group of species, ecosystem processes, geographic regions, and types of environments are likely to be different. There is a lack of focus on the processes and mechanisms underlying and giving rise to the emergent fragmentation patterns. There is not yet a clear standard for assessing human-caused fragmentation. Lastly, lack of consistency in study design and methodologies used to analyze habitat fragmentation makes comparisons, integration of information and results, and replication of studies difficult.
Despite this complexity, there is agreement among forest scientists and ecologists that forest fragmentation should be quantified and monitored in order to track changes in landscape patterns and better understand interactions between human activities, forest features, and ecological processes [9,27,28,29,30]. For the purposes of this study, forest fragmentation can be defined as a process during which, “a large expanse of habitat is transformed into a number of smaller patches of smaller total area, isolated from each other by a matrix of habitats unlike the original” [31]. There have been efforts to estimate the level of fragmentation of the temperate and tropical forests at the global [32,33] and national levels [34,35,36,37,38,39]. Since these studies, a new generation of methods and software tools for the assessment of pattern and fragmentation has emerged [27] and we make use of them in this study.
Mexico is considered to be “megadiverse” and is one of the five biologically richest countries [40]. Studying the effects and evolution of forest fragmentation in Mexico is fundamental to protecting the country’s rich biodiversity, as well as its forest ecosystem functions and services. National level assessments on patterns of forest fragmentation in Mexico have been performed in the past [37,38,39]. Moreno-Sanchez et al. [34,35] provide numerical metrics of fragmentation in tabular form on the change in forest fragmentation in Mexico over time. However, this information has no explicit spatial reference. Moreno-Sanchez et al. [36] provided a national level assessment on changes of forest fragmentation in Mexico using a methodology that produces maps of the levels of fragmentation. Since then, updated land use/cover data for Mexico have been released and a new methodology for characterizing the spatial pattern of the forests has been sanctioned and agreed upon by a large number of national and international forestry agencies. We make use of both in this study.
The purpose of the present study is twofold, first to assess the level of fragmentation of the temperate and tropical forests in Mexico at the national level for three dates 2002, 2008 and 2013 using the latest available land cover data sets, as well as the newest methods and tools for the analysis of the fragmentation of forests. Second, to explore the evolution of the fragmentation during the 2002–2008 and 2008–2013 periods by cross-referencing the fragmentation classes identified for one date with the fragmentation classes of the subsequent date. The resulting cartographic and tabular information assist in better understanding the evolution of the fragmentation of the forests in the country, and in identifying potential relations of the level of forest fragmentation to transitions to no-forest land covers, as well as to future fragmentation conditions of the forests.

2. Methods

2.1. Data Sets

The data sets used in this study were the Series III (2002), Series IV (2008) and Series V (2013) land use/cover data sets produced by the National Institute of Geography and Informatics (INEGI) in Mexico [41,42,43]. Each of these data sets is at a scale of 1:250,000 and is provided in the Lambert Conical Conformal projection. INEGI has homogenized the land use/cover classes in these layers, hence temporal changes can be evaluated. The original land use/cover classes contained in these data sets where reclassified as detailed in Appendix A to create two forest classes: temperate and tropical.
The temperate and tropical forest layers were converted to raster format using a cell size of 250 m × 250 m. The cell size was chosen based on the scale of the original data layers (1:250,000), the level of locational certainty of the features in the original layers, and the consideration that, although responses by plants, animals and ecosystem functions to edge effects vary widely, 250 m represents a conservative estimate of the level of penetration of edge effect for many species and processes [12].

2.2. Assessing Forest Fragmentation Levels in 2002, 2008 and 2013 Using the MSPA Method

The Morphological Spatial Pattern Analysis (MSPA) (version 2.3) [44] (http://forest.jrc.ec.europa.eu/download/software/guidos/mspa/) was used to define the levels of fragmentation of the temperate and tropical forest in Mexico for 2002, 2008 and 2013. This method is easily implemented using the freely available GUIDOS Toolbox (version 2.3) (http://forest.jrc.ec.europa.eu/download/software/guidos/). Major national and international forestry and conservation agencies use this method and toolbox around the world (e.g., http://forest.jrc.ec.europa.eu/partners-and-customers/; United Nations Food and Agriculture Organization; International Union of Forest Research Organizations; United States Forest Service). The MSPA determines forests fragmentation classes based on the geometry and connectivity of the input image as well as user-specified input parameters [45]. The MSPA results in seven basic fragmentation classes [45,46]: Core, Islet, Loop, Bridge, Perforation, Edge, and Branch. Table 1 presents definitions of each of these fragmentation classes. Figure 1 illustrates the spatial arrangement of these fragmentation classes for a hypothetical location.
The geographic information system ArcGIS 10.2 (ESRI, Redlands, CA, USA) was used to create layers in the input format required to run the MSPA analysis in the GUIDOS toolbox. The raster layers representing temperate and tropical forests in 2002, 2008 and 2013, were first reclassified to contain a value of one for cells representing non-forest areas (background for the MSPA analysis) and a value of two for cells representing forest areas (foreground for the MSPA analysis). Then these binary raster layers were exported to 8-bit GeoTiff format with no compression for input into the MSPA method in the GUIDOS Toolbox. In the GUIDOS Toolbox, a MSPA batch process was run for the temperate and tropical forests in 2002, 2008, and 2013. Finally, the cartographic outputs of the MSPA which are in GeoTiff format were converted back to ArcGIS rasters to calculate areas and carry out transition analyses as will explained in the next section.
The parameters for the MSPA runs were set as follows ([45,47] for details on the definition and use of each of these parameters): The foreground (forest) cells connectivity was set to eight, meaning that forest cells are considered connected if they touch on the cell side or only on a cell corner. The edge width parameter was set to one cell (250 m). This value was chosen because it represents a conservative estimate of the level of penetration of edge effect for many species and processes [12]. The transition parameter was set to “On”, meaning all detected connections are reported. The statistics parameter was set to “On” which creates a text file summarizing the statistics of the results of the MSPA analysis. The intext parameter was first set to “Off” for six runs (two forest types for three dates). Later, intext was set to “On” for the same six runs resulting in a total of 12 runs of the MSPA analysis.
The intext parameter allows for differentiating between internal and external features. Internal features are defined as those being enclosed by cells classified as Perforation (i.e., they are found in gaps in Core areas; see Figure 2). When the intext = “On”, internal and external features are classified into different fragmentation classes. Internal fragmentation classes are assigned a numeric identifier value that adds 100 to the values identifying each of the basic fragmentation classes (see Figure 2 legend). The purpose of changing the intext parameter from “Off” to “On” was to explore if there are differences in fragmentation levels and the behavior of the fragmentation-class transitions between internal and external forest areas.

2.3. Analyzing Transitions between Fragmentation Classes and between These and Non-Forest during the 2002–2008 and 2008–2013 Periods

The ArcGIS raster layers showing fragmentation classes resulting from the MSPA method were used to analyze the transitions between fragmentation classes, and between these and non-forest, during the 2002–2008 and 2008–2013 periods for both tropical and temperate forests. First, the transitions between fragmentation classes generated without differentiating between internal and external classes (intext = “Off”) were analyzed. Then the transitions between fragmentation classes when differentiating between internal and external classes (intext = “On”) were analyzed.
The analysis of transitions consisted of the following (here we describe the processes using the case of intext = “Off” for the 2002–2008 period): First, in ArcGIS 1-NoData raster masks were created for each forest fragmentation class from the MSPA results for 2002 (1 = forest fragmentation class x; NoData = everything else). Then, the 2008 forest areas classified into fragmentation classes (see Table 1) were clipped using each of the 1-NoData masks created for each of the 2002 forest fragmentation classes. This process extracts the 2008 fragmentation classes (and 2008 non-forest areas) that fall within each of the 2002 fragmentation classes, and hence their areas can be calculated (see results in Table B1 for tropical forests and Table 2 for temperate forests for the 2002–2008 period). The same procedure is repeated for the 2008–2013 period to extract and calculate the areas of 2013 fragmentation classes (and 2013 non-forest areas) that fall within each of the 2008 fragmentation classes (see results in Table C1 for tropical forests and Table 2 for temperate forests for the 2008–2013 period).
Next, the same procedure previously described for the case of fragmentation classes with intext = “Off” was repeated with the intext parameter set to “On”. This results in the generation of internal and external fragmentation classes (see Table D1 for tropical forests and Table 2 for temperate forests for the 2002–2008 period; and see Table E1 for tropical forests and Table 2 for temperate forests for the 2008–2013 period).
It is important to note that the previously described procedures do not account for areas that might have transitioned from non-forest (where fragmentation is not assessed) to forests between the dates considered in the study. This would be the case where plantations or natural afforestation have occurred. These areas at the national level are relatively small compared with the transitions from forest to non-forest [48], or to the areas that remained during the periods analyzed.

3. Results

3.1. Assessment of Fragmentation Levels in 2002, 2008 and 2013 without Differentiating between Internal and External Classes (Intext = “Off”)

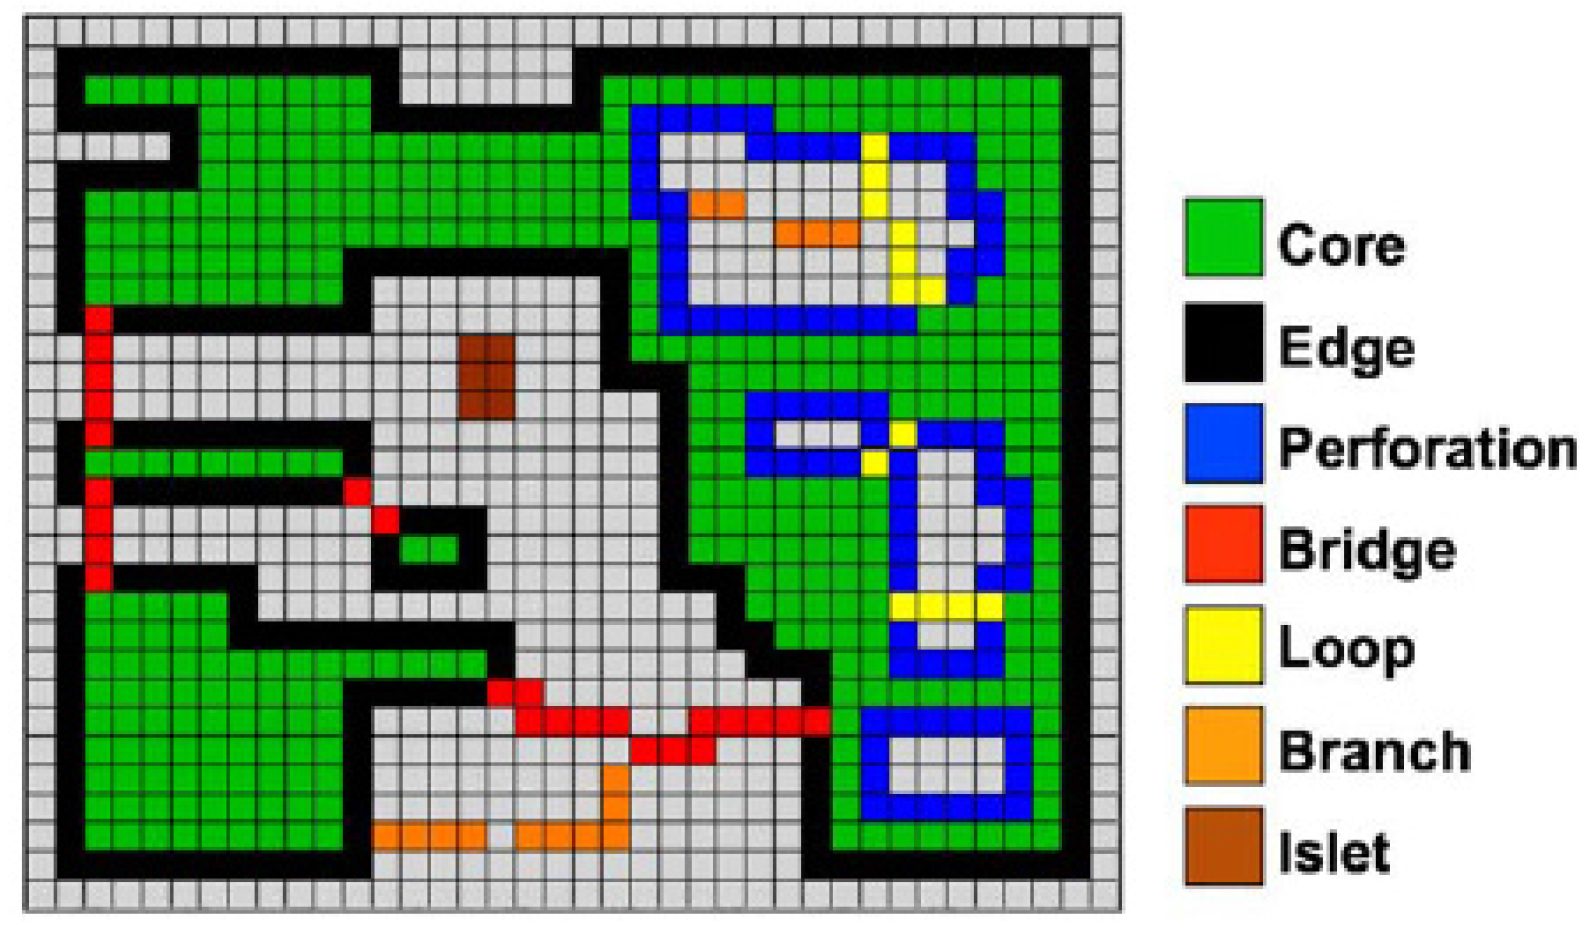
Figure 3 shows a sample of the cartographic products obtained from the MSPA analysis when setting the intext parameter to “Off” for a zoomed-in area of the tropical forests in 2002. Similar cartographic outputs were generated for both the temperate and tropical forest in 2002, 2008, and 2013.
Table 2 and Table 3 present the forest fragmentation classes resulting from the MSPA method (intext = “Off”) for tropical and temperate forests, respectively. Each table shows for the 2002, 2008 and 2013 dates the area in hectares in each fragmentation class, the percent of the total forest area that falls within each fragmentation class, and the difference in area classified into each fragmentation class between 2002 and 2008 and between 2008 and 2013. The percent change in each fragmentation class between dates was calculated using the formula:
( t 1   t 2 ) / t 1
where t1 is the forest area classified into fragmentation class x in date 1 and t2 is the forest area classified into fragmentation class x in subsequent date 2.
Results for the Tropical Forests: At the national level there were a total 18,070,262 (in 2002), 17,957,907 (in 2008) and 18,425,013 (in 2013) hectares of tropical forests (Table 2). For each date, approximately 72.7% of the total tropical forest area was classified as Core, followed by Edge (approximately 17%), and a total of about 10% fell in the Branch, Perforation, Bridge, Loop, and Islet classes (around 4.5%, 2.9%, 1.5%, 0.5% and 0.42%, respectively). During the 2002–2008 period at the national level, the tropical forest areas decreased by 112,355 hectares (a 0.62% decrease based on the 2002 total tropical forests area). During the 2008–2013 period at the national level, there was a total gain of 467,106 hectares (a 2.6% increase based on the 2008 total tropical forests area).
During the 2002–2008 period the fragmented classes Loop, Islet, Bridge and Branch saw the largest percent increases based on the area in each of those categories in 2002 (21.4%, 19.9%, 17.2% and 5.8%, respectively). The lowest percent change occurred in classes representing compact areas (Core −1.5% and Edge −0.6%), or the edges of perforations in Core areas (Perforation −0.4%). In absolute terms, the loss of 112,355 hectares in the total area of tropical forests was concentrated on the loss of Core and Edge areas, while the fragmented classes Branch, Bridge, Loop and Islet had increases in area. These results suggest that the fragmentation of the tropical forest increased during the 2002–2008 period. The reduction in Core and Edge left behind narrow peninsulas of forests (Branch 45,581 hectares) and narrow bands that fortunately connect Core areas (Bridge 43,620 hectares). The increase in fragmentation is also reflected on the percent increase of small isolated forest patches (Islet) that were created during this period.
During the 2008–2013 period the percent changes based on the 2008 area in each fragmentation class were much smaller than their equivalents during the 2002–2008 period. The Loop (9.8%) and Bridge (4.1%) classes saw the largest percent increases based on the areas of forest classified into those classes in 2008. Core and Perforation increased by almost the same proportion (around 3.2%). The lowest percent changes occurred in the Edge (−0.2%) and Islet (−1.9%) classes. In absolute terms, the gain in total tropical forest area at the national level by 2013 (467,106 hectares) was mostly classified as Core (416,650 hectares), Branch (20,600 hectares) and Perforation (16,869 hectares), followed by Bridge and Loop. These results point to a reduction in the level of fragmentation of the forests during the 2008–2013 period. The increase in Core hectares accompanied by a decrease in Edge suggests that the majority of forest areas that were added during this period had relatively simple shapes with some level of gaps in them (Perforation increase). Although narrow bands of forests increased (Branch, Bridge and Loop), these increases are half of the hectares added to these classes during the previous period which experienced a total forest area loss (−112,355 hectares) instead of the gain of 467,106 hectares that occurred during 2008–2013 period.
Results for the Temperate Forests: At the national level there were a total of 22,126,451 (in 2002), 21,222,037 (in 2008) and 21,271,030 (in 2013) hectares of temperate forests (Table 3). For each date, approximately 69.5% of the total temperate forest area was classified as Core followed by Edge (approximately 19%), and close to a total of 10% fell in the Branch, Perforation, Bridge, Loop, and Islet classes (around 5.6%, 2.5%, 1.8%, 0.67% and 0.63%, respectively). During the 2002–2008 period at the national level, the temperate forest areas decreased by 904,414 hectares (a 4.09% decrease based on the 2002 total temperate forests area). During the 2008–2013 period, there was a total gain of 48,993 hectares (a 0.23% increase based on the 2008 total temperate forests area).
During the 2002–2008 period, the Perforation class had the largest percent change based on the area in that class in 2002 (−14.9%). The Loop class had a 9.5% increase and Core had a 5.5% decrease. The other fragmentation classes experienced small percent changes (most around 1%). In absolute terms, the loss of 904,414 hectares in the total area of temperate forests concentrated on reduction of area in the Core (−862,470 hectares) and Perforation (−90,081 hectares) classes, while Edge and Loop had the largest hectare increases. Overall, these results indicate that the loss of forest area affected mostly contiguous compact areas (Core) and the gaps within them (Perforation), and that the remaining forest areas have more complex shapes (increase in Edge) and more narrow bands of forests that connect Core areas to themselves (Loop).
During the 2008–2013 the percent changes based on the 2008 area in each fragmentation class were much smaller than their equivalents during the 2002–2008 period. The Perforation class (−2.4%) had the largest percent change based on the areas of forest classified into that category in 2008. The rest of the fragmentation classes had a less than 1% change based on the areas in each class in 2008. In absolute terms, Edge and Core had the largest increases (30,712 and 29,443 hectares respectively), while the fragmented classes experienced reductions in the forest area classified into each of them, except for Branch that had a small increase of 5100 hectares. These results suggest that during 2008–2013 the temperate forest areas became more compact (increase in Core hectares) with less perforations (decrease in Perforation), but with more complex shapes (increase in Edge) and with less narrow bands of forests (decreases in Bridge and Loop with small increase in Branch). The results for the temperate forests for both periods 2002–2008 and 2008–2013 indicate that the fragmentation of the temperate forests at the national level increased during the 2002–2008 period and later decreased during 2008–2013.
Overall, the results in this section for the tropical and temperate forests indicate that the rate of change in the extent and spatial pattern of both forest types have slowed down between the two periods analyzed. Both types of forests increased their fragmentation during the 2002–2008 period and later decrease it during the 2008–2013 period.

3.2. Assessment of Fragmentation Levels for 2002, 2008 and 2013 Differentiating between External and Internal Classes (Intext = “On”)

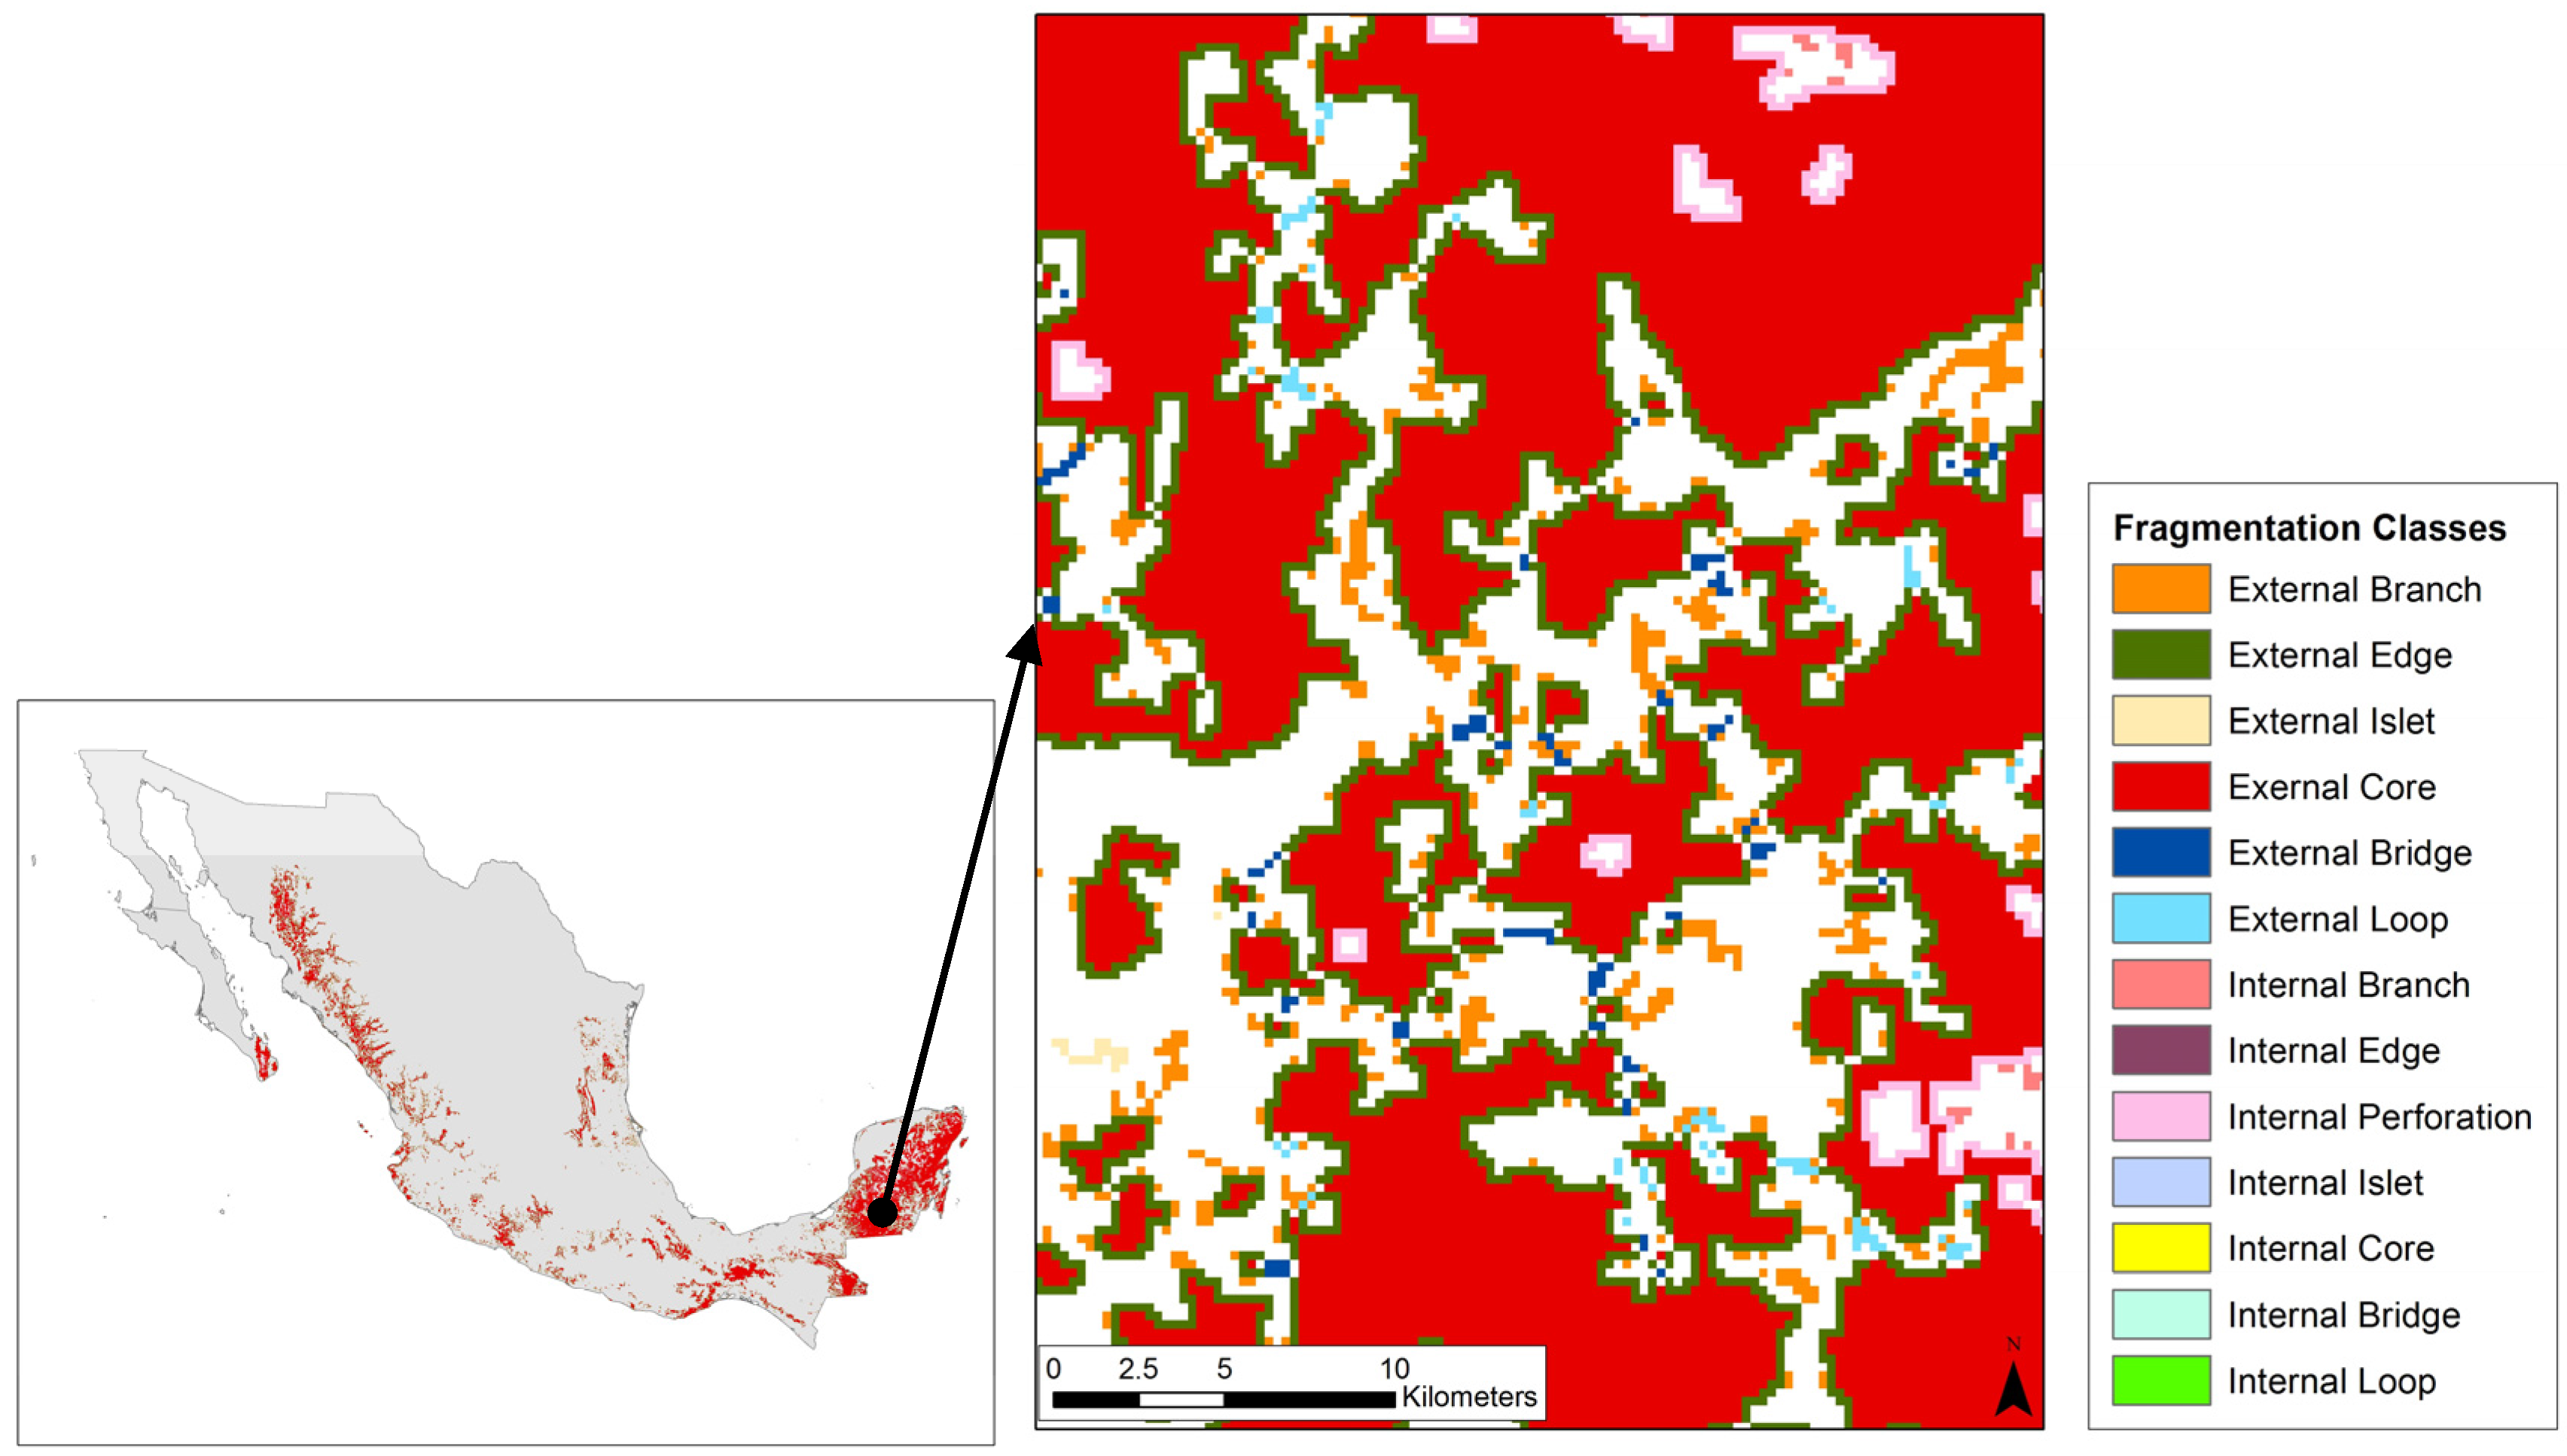
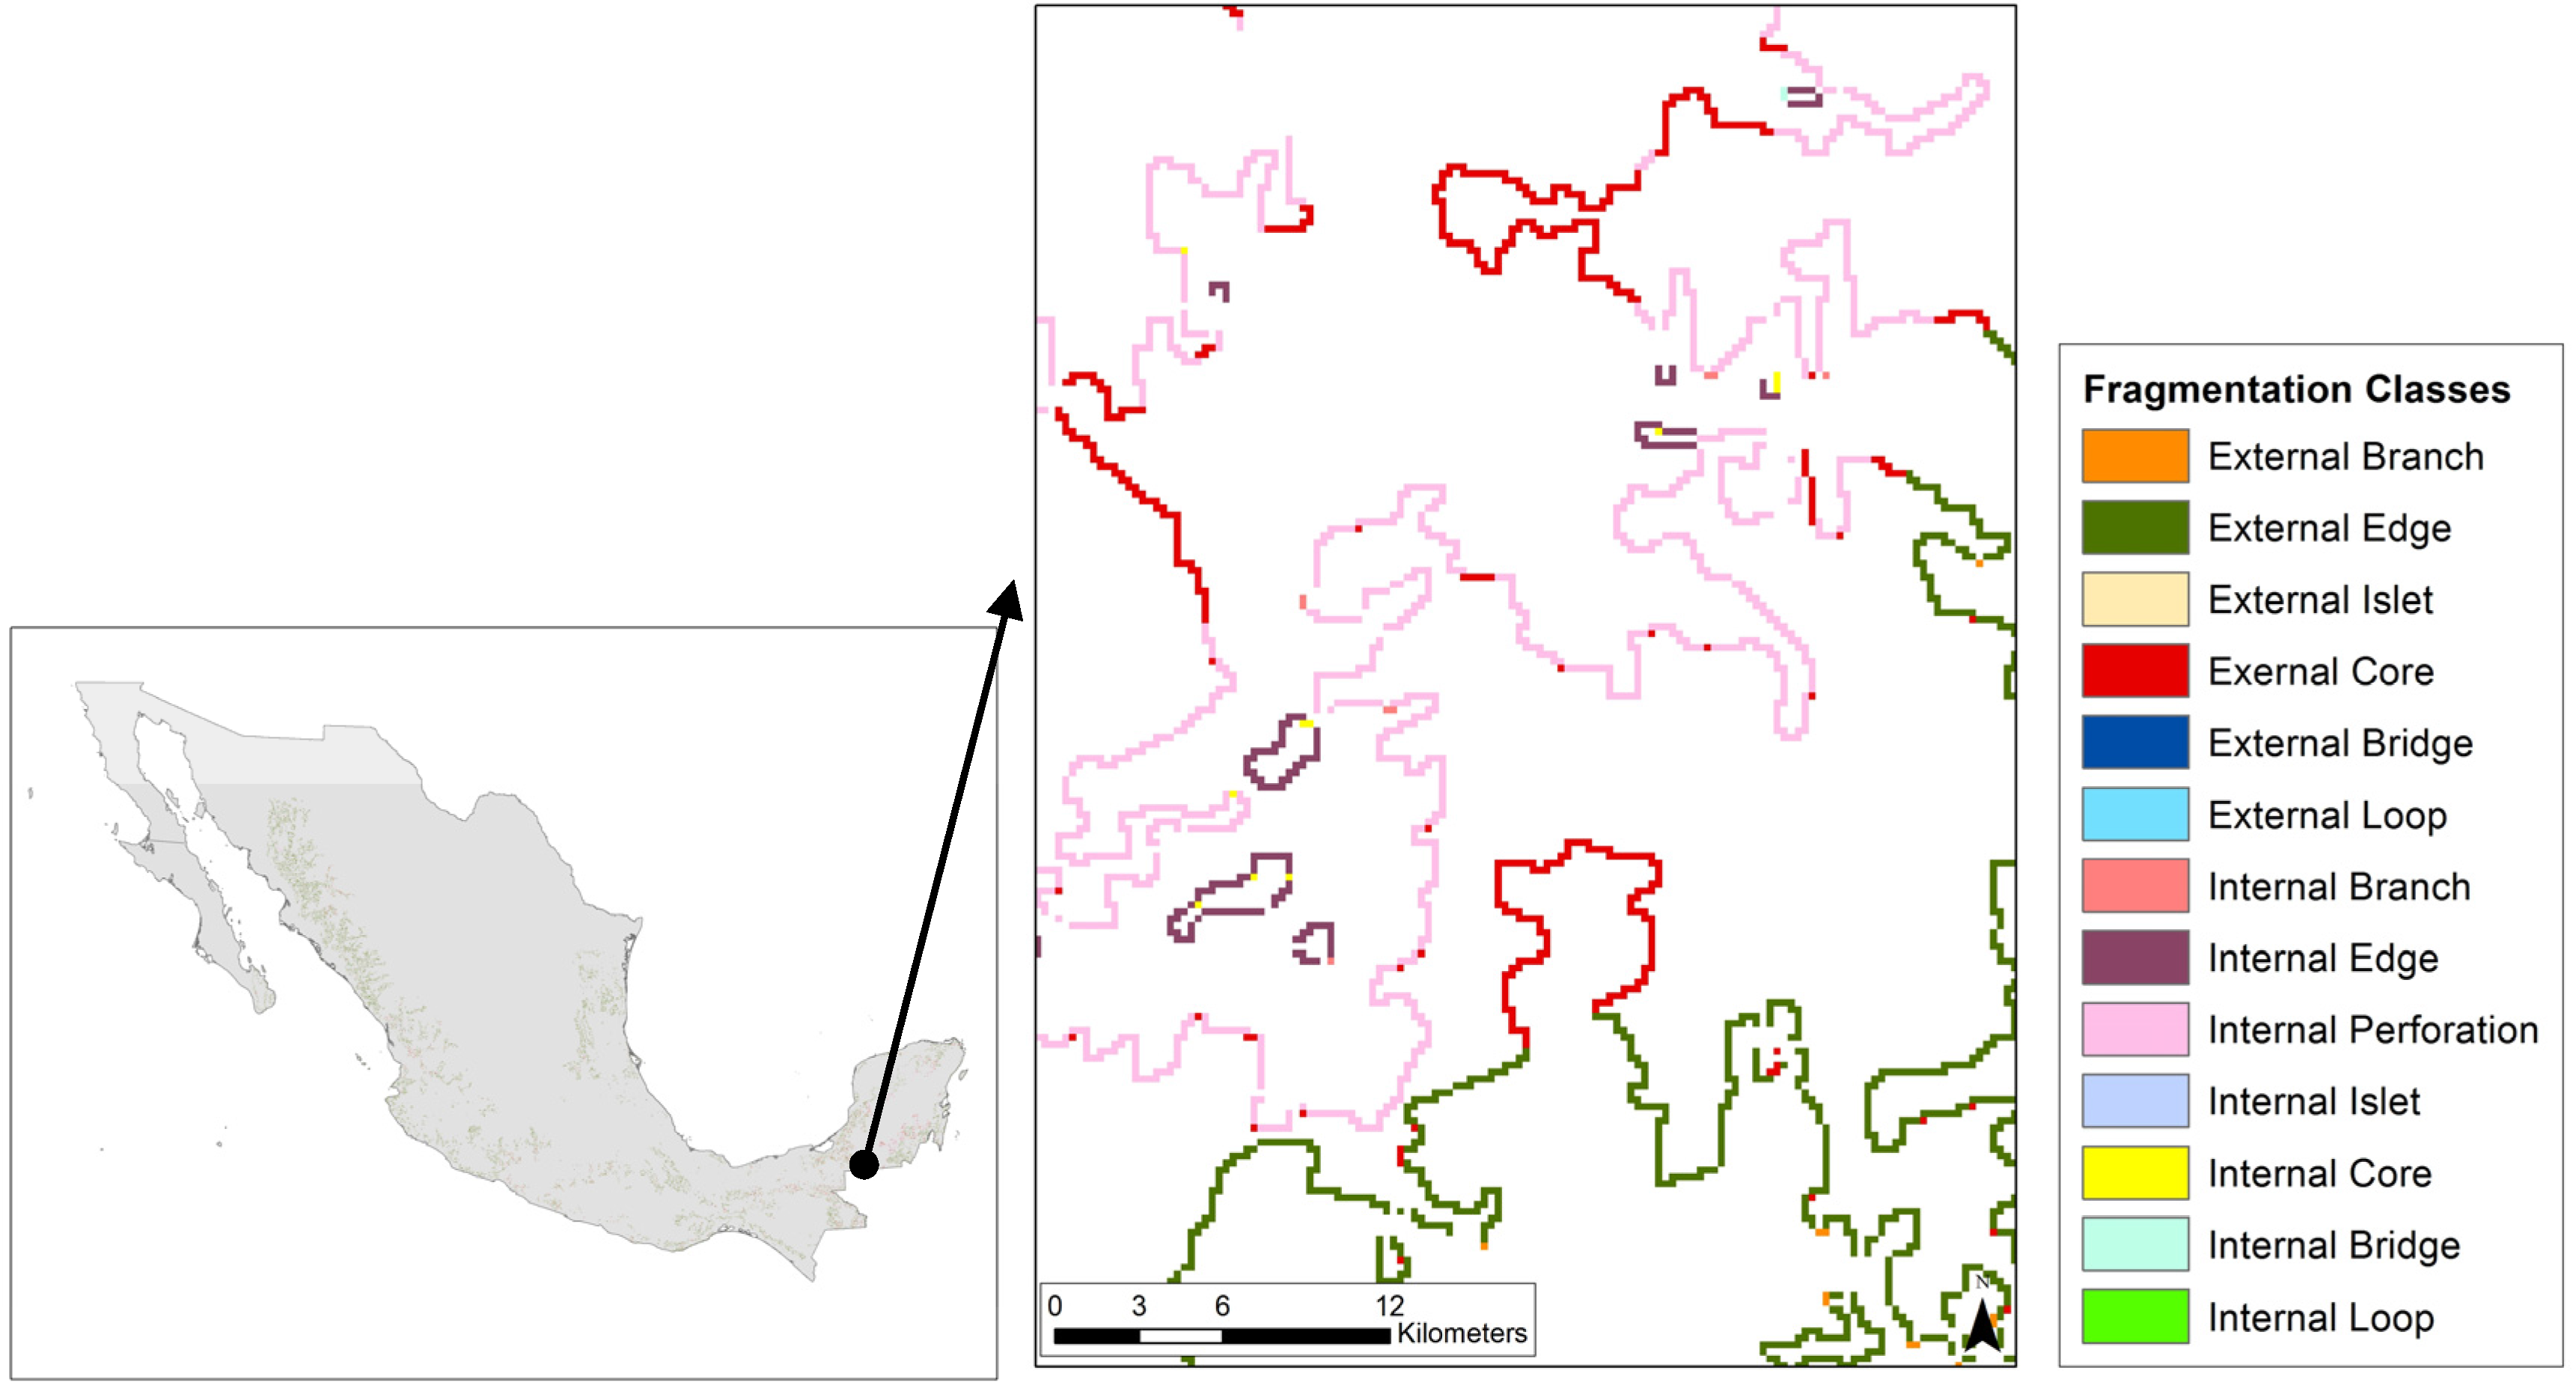
Figure 4 shows a sample of the cartographic products obtained from the MSPA analysis when setting the intext parameter to “On” for a zoomed-in area of the tropical forests in 2002. Similar cartographic outputs were generated for both the temperate and tropical forest in 2002, 2008, and 2013.
Table 4 and Table 5 present the forest fragmentation classes resulting from the MSPA method for the tropical and temperate forests, respectively. These results were generated with the MSPA intext parameter set to “On”. Each table shows for the 2002, 2008 and 2013 dates the area in hectares in each fragmentation class, the percent of the total forest area that falls within each fragmentation class, and the difference in area classified into each fragmentation class between 2002 and 2008 and between 2008 and 2013. The percent change in each fragmentation class between dates was calculated using the formula presented in Section 3.1.
From the outset, it can be pointed out that only a very small proportion (around 3%) of the total national forest area (of both tropical and temperate forests) is classified into internal fragmentation classes. This means that at the national level, at the scale of the source data, with the definition of forest types, and with the cell size used for the analyses, the forest areas are relatively compact with proportionally few gaps in Core areas. However, the results in this section for both forest types indicate that based on the areas classified within the same class during the periods analyzed, more percent changes occur in internal fragmentation classes than in external ones (see last columns in Table 4 and Table 5). These results indicate that proportionally, forests within gaps in external Core areas are changing more than those external to those areas.

3.2.1. Results for the Tropical Forests

Table 4 shows that of the tropical forests at the national in 2002, a total of 17,428,256 hectares (96.4%) were classified into external fragmentation classes and a total 642,008 hectares (3.5%) were classified into internal fragmentation classes. The numbers for 2008 were a total of 17,301,319 hectares (96.3%) in external classes and a total of 656,589 hectares (3.6%) in internal fragmentation classes; while for 2013 the numbers were a total of 17,735,482 hectares (96.2%) in external and a total of 689,533 hectares (3.7%) in internal fragmentation classes. These results indicate that for the three dates at the national level, a very small proportion (around 3.6%) of the tropical forests are located in gaps in Core areas. They also indicate that there has been a very small increase in gaps in Core areas during the dates studied (3.5% to 3.7% between 2002 and 2013).
More specifically in regard to the external fragmentation classes, for all dates, the largest proportion of the total area of tropical forests at the national level is classified into the External Core class (73.1%, 72.4%, and 72.8% in 2002, 2008 and 2013, respectively), followed by External Edge (around 17%), and External Branch (around 4.2%) for the three dates. The External Loop and External Islet classes have the lowest allocation of areas (around 0.4% each) for the three dates.
In regard to the internal fragmentation classes, for all dates, the largest proportion of the total area of tropical forests at the national level is classified into the Internal Perforation class (around 2.95% for all three dates), followed by Internal Branch (around 0.25% for the three dates). Internal Core and Internal Edge have both an allocation of only around 0.1% of the total national tropical forest area for the three dates studied. These results indicate that there are very few internal patches of forests that are large enough to contain Internal Core areas with their corresponding Internal Edge areas. The very small area classified into the Internal Bridge class (only around 0.07% for the three dates) indicates that there are few connections between Internal Core areas or between these and External Core areas. More common are areas classified into Internal Branch (around 0.24% for the three dates), which are arranged as narrow bands of forests. The areas arranged as small isolated patches in Core perforations (Internal Islet) are practically negligible (0% for the three dates).
When observing the percent changes in areas classified into each fragmentation class based on the class area at the beginning of each 2002–2008 and 2008–2013 periods (last columns in Table 4), the following information is interesting. The percent changes in both external and internal fragmentation classes have decreased from the 2002–2008 to the 2008–2013 period. Overall, the percent changes occurring in the internal fragmentation classes (e.g., see Internal Bridge, Internal Loop in 2002–2008) are larger than those occurring in the external classes for both periods studied.
Based on the tropical forest areas classified into each fragmentation class at the beginning of the 2002–2008 period, the following internal classes had the largest percent changes: Internal Bridge (60.9%), Internal Loop (45.5%), Internal Branch (22.3%), and Internal Core (−17.4%). The large percent increase in Internal Bridge suggest that although Internal Core areas were reduced, connectors between Internal Core areas, and between these and External Core areas were left behind, as well as loops connecting Core areas to themselves. For the same period, the external classes that had the largest percent changes were: External Islet (20.1%) as well as External Bridge and External Loop (both around 15%). In absolute terms, the loss of tropical forests area during this period was concentrated in the External Core (−206,280 hectares) and External Edge (−20,775 hectares) classes. All these results mean that during the 2002–2008 period the fragmentation of the tropical forests increased with more percent changes occurring in areas internal to Core forests.
During 2008–2013 period, the percent changes based on the area in each class at the beginning of the period were much smaller than those that during the 2002–2008 period both external and internal classes. Like in the previous period, larger percent changes occurred in the internal classes than in the external ones. Internal Islet (−33.3%), Internal Core (20.4%) and Internal Loop (18.9%) had the largest percent increases based on the areas classified into these classes at the beginning of the period. The largest areal change occurred in the forests classified as External Core (gain of 412,758 hectares) followed by External Branch (16,318 hectares), Internal Perforation (16,869 hectares) and External Bridge (11,031 hectares). These results mean that the fragmentation of the tropical forest decreased during the 2008–2013 period with most of the tropical forest areal gains classified as compacted Core areas, followed by narrow bands of forests, and internal edges of External Core areas (Perforation).

3.2.2. Results for the Temperate Forests

Table 5 shows that of the area of temperate forests in 2002, a total of 21,353,861 hectares (96.5%) were classified into external fragmentation classes and a total 772,588 hectares (3.4%) were classified into internal fragmentation classes. The numbers for 2008 were a total of 20,573,434 hectares (96.9%) in external classes and a total of 648,609 hectares (3%) in internal fragmentation classes; while for 2013 the numbers were a total of 20,643,014 hectares (97%) in external and a total of 628,020 hectares (2.9%) in internal fragmentation classes. These results indicate that for the three dates at the national level, a very small proportion (around 3.2%) of the temperate forests at the national level are located in perforations in Core areas. They also point to a very small decrease in perforations in Core areas during the dates studied (3.5% to 2.9% between 2002 and 2013).
More specifically in regard to the external fragmentation classes, for all dates, the largest proportion of the total area of temperate forests at the national level is classified into the External Core class (70.1%, 69.3%, and 69.1% in 2002, 2008 and 2013, respectively), followed by External Edge (around 18.7%), and External Branch (around 5.3%) for the three dates. The External Loop and External Islet classes have the lowest allocation of areas (around 0.5% and 0.6%, respectively) for the three dates.
In regard to the internal fragmentation classes, for all dates, the largest proportion of the total area of temperate forests at the national level is classified into the Internal Perforation class (around 2.5% for all three dates), followed by Internal Branch (around 0.25% for the three dates). Internal Core and Internal Edge have both an allocation of only around 0.1% of the total national temperate forest area for the three dates studied. These results indicate that there are very few forest patches in Core perforations that are large enough to contain Internal Core areas with their corresponding Internal Edge areas. The very small area classified into the Internal Bridge class (only around 0.07% for the three dates) indicates that there are few connections between Internal Core areas or between these and External Core areas. More common are areas classified into Internal Branch (around 0.26% for the three dates), which are arranged as narrow bands of forests. The areas arranged as small isolated patches in Core perforations (Internal Islet) are negligible (less than 0.01% for the three dates).
When observing the percent changes in areas classified into each fragmentation class based on the class area at the beginning of each 2002–2008 and 2008–2013 periods (last columns in Table 5), the following information is interesting. The percent changes in both external and internal fragmentation classes have decreased from the 2002–2008 to the 2008–2013 period. Overall, the percent changes occurring in the internal fragmentation classes are larger than those occurring in the external classes for both periods studied.
The changes in areas classified into each fragmentation class during the 2002–2008 period suggest that although there were large losses of External Core (−855,370 hectares), this reduction in the forest cover was not predominantly in the form of perforations of Core areas (notice that all the internal fragmentation classes experienced reductions during this period). During the 2008–2013 period there was a total gain of almost 49,000 hectares of temperate forests, most of these gains were classified as External Core and External Edge; all the internal fragmentation classes experienced reductions in the areas allocated to them. These results indicated that the fragmentation of the temperate forest was reduced during 2008–2013 period.
In summary, the results in this section (differentiating between internal and external classes) indicate that for both types of forests their levels of fragmentation have decreased over time. In addition, for both forest types, the large majority of their areas are classified into the external fragmentation classes, meaning that there are a relatively small number of gaps in Core areas at the national level. For both types of forests, and for the two periods studied, the percent changes based on the area in each class at the beginning of each period are larger in the internal fragmentation classes than in the external classes. This means that proportionally more changes are occurring inside gaps in Core forest areas than outside of them. The forest area losses that occurred during the 2002–2008 period in both temperate and tropical forests concentrated in losses of External Core areas. These losses were not accompanied by increases in areas classified into internal fragmentation classes. These results suggest that the deforestation processes that occurred during the 2002–2008 period predominantly occurred in the external edges of the forests rather than in the form of perforations in Core forest areas. The gains in forest extent that occurred during the 2008–2013 period in both tropical (467,106 hectares) and temperate (48,993 hectares) forests were primarily additions to external classes. However, the increase in tropical forest area was accompanied by an increase in the gaps in Core areas (Internal Perforation class increased by 16,869 hectares; see last columns in Table 4), while the increase in temperate forest area was accompanied by a reduction in all the internal fragmentation classes (see last columns in Table 5). This means that the areal increases in the temperate forests were more contiguous than in the tropical forests.

3.3. Transitions between Fragmentation Classes during the 2002–2008 and 2008–2013 Periods without Differentiating between Internal and External Fragmentation Classes (Intext = “Off”)

Figure 5 shows a sample of the type of cartographic products that were created to assess the transitions between fragmentation classes, and between them and non-forest. The narrow band in the zoom-in insert corresponds to the areas classified into one of the fragmentation classes (in this case Edge in 2002). The colors in the 2002-Edge band correspond to each of the fragmentation classes and non-forest areas in 2008 that fall within the 2002-Edge band. Similar cartographic results were created for each fragmentation class in the year 2002 to analyze the 2008 fragmentation classes that fall within each of the 2002 fragmentation classes. The same results were generated for the 2008–2013 period and for both types of forests (tropical and temperate).
Appendix B and Appendix C present the transition matrices between fragmentation classes (intex = “Off”) for the 2002–2008 and 2008–2013 periods, respectively. Table B1 shows the results for the tropical forests from 2002 to 2008 and Table B2 for the temperate forests. Similarly, Table C1 presents the results for the tropical forests for the 2008–2013 period and Table C2 presents the results for the temperate forests for the same period.

3.3.1. Results for the Tropical Forests

From 2002 to 2008 in the tropical forests (Table B1), the percentage of the area classified into each 2002 fragmentation class changing to non-forest by 2008 is much higher than the percent change to another 2008 fragmentation class. The Islet and Branch classes had the highest percent of their 2002 area changing to non-forest (around 26% for both), and Core had the lowest (6.6%). These results coincide with empirical evidence that forests arranged in small isolated patches (Islet) or narrow bands (Branch, Bridge and Loop) are more like to be deforested or to evolve to other fragmentation classes than large compacted Core areas. In absolute terms, the largest transitions of area were from Core and Edge to non-forest (880,081 and 519,288 hectares respectively), followed by Core to Edge (407,163 hectares). These areal changes indicate that the largest areas affected by deforestation processes were contiguous compact forest areas.
From 2008 to 2013 (Table C1), tropical forests again experienced a higher percent change of the area classified into each 2008 fragmentation class turning into non-forest by 2013 than transitions to other 2013 fragmentation classes. However, we must remember that during this period there was a net gain of 467,106 hectares of tropical forests (see Table 3). Islet forests experienced the most percent change to non-forest (10.4% by 2013), followed by Perforation areas (8%), while Core forests saw the least amount (3%). In absolute terms, the largest transitions of area were from Core and Edge to non-forest (397,594 and 129,331 hectares respectively), followed by Core to Edge (132,419 hectares), and a transition in the opposite direction from Edge to Core (130,594 hectares). These results indicate that some areas loss forest mostly in the form of Core and Edge areas, but that forest areal gains concentrated in Core gains.

3.3.2. Results for the Temperate Forests

From 2002 to 2008 (Table B2), temperate forests also experienced a higher percent change of the areas classified into each 2002 fragmentation class into non-forest by 2013 than transitions into other 2008 fragmentation classes. The Branch class (15.8%) followed by Loop and Perforation (both around 13%) experienced the most change to non-forest. Again, these results coincide with empirical evidence that narrow bands of forests (Branch and Loop), as well as the borders of the forests (Perforation) are more likely to be deforested than large contiguous Core areas. Interestingly there was a proportionally larger percent change of Perforation to Edge (13%). This suggests that many forest areas encircling perforations in Core areas were broken and the cells that used to be Perforation became Edge. In absolute terms, the largest transitions of area were from Core and Edge to non-forest (768,475 and 469,275 hectares respectively), followed by Core to Edge (417,769 hectares). These areal changes indicate that the largest areas affected by deforestation processes were contiguous compact forest areas.
During the 2008–2013 period (Table C2) the temperate forests experienced very little transitions. All the fragmentation classes retained most of their areas by 2013 (around 97%). Even though very small, Islet forests experienced the largest percent change of their area in 2008 to non-forest by 2013 (3%). In absolute terms, the largest transition was from Core and Edge to non-forest (65,900 and 36,356 hectares, respectively), followed by transitions from Edge to Core (32,894 hectares). These results indicate that some areas lost forest mostly in the form of Core and Edge areas, but that forest areal gains (48,993 hectares at the national level) were concentrated in Core gains.

3.4. Transitions between Fragmentation Classes during 2002–2008 and 2008–2013 Periods Differentiating between Internal and External Fragmentation Classes (Intext = “On”)

Figure 6 shows a sample of the type of cartographic products that were created to assess the transitions between fragmentation classes, and between them and non-forest when the intext parameter is set to “On”. The narrow band in the zoom-in insert corresponds to the areas classified into the External Edge class in 2002. The colors in the 2002-Edge band correspond to each of the internal and external fragmentation classes and non-forest areas in 2008 that fall within the 2002-External-Edge band. Similar cartographic results were created for each internal and external fragmentation class in the year 2002 to analyze the 2008 internal and external fragmentation classes that fall within each of the 2002 fragmentation classes. The same results were generated for the 2008–2013 and for both tropical and temperate forests.
Appendix D and Appendix E present the transition matrices between fragmentation classes (differentiating between internal and external classes) for the 2002–2008 and 2008–2013 periods, respectively. Table D1 shows the results for the tropical forests and Table D2 for the temperate forests during the 2002–2008 period. Similarly, Table E1 presents the results for the tropical forests for the 2008–2013 period and Table E2 presents the results for the temperate forests for the same period. Next we will highlight the results that are particular to the differentiation between internal and external fragmentation classes.

3.4.1. Results for the Tropical Forests

From 2002–2008 (Table D1), the External Islet forests experienced the most percent change to non-forest (25.8%) and External Core experienced the least (6.6%). For the internal classes, Internal Islet (25.8%) experienced the most percent change to non-forest and Internal Core (13.1%) the least. These results mean that proportionally, Islets (internal and external) are more likely to be deforested, and Core areas the least likely. In terms of retention of areas within the same class by the end of the period, in general external classes retained more of their area with the same fragmentation class than internal classes, for example, External Core (88.5%) and External Edge (67.8%) versus Internal Core (26.9%) and Internal Edge (32.9%). This suggests that in general internal classes changed more to non-forest or other fragmentation classes than external classes. In absolute terms, the largest areal transitions occurred from External Core to non-forest (877,056 hectares) and to External Edge (402,213 hectares), followed by transitions from Internal Perforation to External Core (97,444 hectares) and to External Edge (63,025 hectares). These results suggest that the deforestation that occurred during 2002–2008 affected more heavily contiguous compacted Core areas, with the consequent increase in External Edge. The relative large transitions from the Internal Perforation to other classes (e.g., External Core and External Edge) indicate a closing of gaps in Core areas.
For the 2008–2013 period (Table E1), internal classes continue to have larger percent transitions to other fragmentation classes or to non-forest than the external classes (see percent of each area that remains the same class by 2013). The largest percent transition to non-forest occurred in the Internal Islet class (44.4%), followed by Internal Edge (12.5%). In absolute terms, the largest areal transitions occurred from External Core to non-forest (396,275 hectares) and to External Edge (128,988 hectares), followed by External Edge to External Core (126,831 hectares). These results suggest that the gain in total tropical forest area in 2008–2013 (approximately 467,000 hectares) was distributed among fragmented classes more than in Core or Edge classes, or that they fell outside the area covered by each of the fragmentation classes created for the tropical forest cover reported for 2008.

3.4.2. Results for the Temperate Forests

From 2002–2008 (Table D2), both the internal and external fragmentation classes transitioned in larger proportion to non-forest than to other fragmentation classes. In general the internal fragmentation classes experienced larger percent transitions than the external classes. Internal Islet (38.7%) and Internal Bridge (28.1%) had the largest percent transitions to non-forest, followed by Internal Edge, and Internal Branch (all around 25%). The lowest percent transition to non-forest was in External Core areas (4.9%). These results mean that proportionally, internal fragmented classes are more likely to be deforested than External Core areas. In terms of retention of areas within the same class by the end of the period, in general external classes retained more of their area with the same fragmentation class than internal classes. For example, External Core (91.1%) versus Internal Core (43.3%). This suggests that in general internal classes changed more to non-forest or other fragmentation classes than external classes. In absolute terms, the largest areal transitions occurred from External Core (764,700 hectares) and from External Edge (462,263 hectares) to non-forest. These results suggest that the deforestation that occurred during 2002–2008 affected more heavily contiguous compacted Core areas.
For the 2008–2013 period (Table E2), the percent transitions of external and internal classes were smaller and more similar to each other than their equivalents during the 2002–2008 period (see percent of each area that remains the same class by 2013). The largest percent transition to non-forest occurred in the Internal Islet class (10.2%). The rest of the external and internal classes had much smaller percent transitions to non-forest (most around 1%). In absolute terms, the largest areal transitions occurred from External Core (65,838 hectares) and from External Edge (36,306 hectares) to non-forest. These results suggest the gain in 2008–2013 in total temperate forest area (approximately 49,000 hectares) was distributed among fragmented classes more than in External Core or Edge classes, or that they fell outside the area covered by each of the fragmentation classes created for the temperate forest cover in 2008.

4. Discussion

In regards to the first objective of our study (the assessment of the level of fragmentation of the forests), the following major points can be made. The temperate forests are slightly more fragmented than the tropical forests, and the level of fragmentation in both types of forests have decreased from the first to the second time period analyzed. Although there is more total area of temperate than tropical forests, a lower proportion of the temperate forests are in the Core class across all dates compared to their equivalents for the tropical forests. Additionally, across all dates, temperate forests contain a higher percent of their total area in the fragmented classes (Branch, Bridge, Loop, and Islet) than the tropical forests. Across all dates, a slightly larger percent of the total area of the temperate forest is classified as Edge compared with their equivalents for the tropical forests. This suggests that at the national level, the temperate forest patches have more complex shapes than the tropical forest patches. One factor that might be contributing to this finding is the way we defined tropical forests. In this forest type we included the tropical forest secondary growth in arboreal stage. In tropical forests with rapid successional stages, perforations in Core areas and changes at the edge of the forests are more likely to be rapidly filled or smoothed out by secondary growth.
These results support the findings from a previous national-level study of the fragmentation of the forests that applied the same definition of tropical and temperate forests, but used different land cover data sets, dates, and fragmentation assessment methodology [36]. However, our findings differ from the results of other forest fragmentation studies in Mexico carried out at the national level, but that used different groupings of forest types [34], or studies that have concentrated on more specific tropical forest types at different geographic scales [49,50,51]. These studies report that more specific types of tropical forests (e.g., tropical evergreen forests) have high levels of fragmentation [34]. This difference emphasizes the complexity in assessing forest fragmentation since it is context and species dependent and the need for methodologies and tools that facilitate the rapid generation of comparable fragmentation estimates that are easy to replicate for different forest types, dates, and geographic scales.
The exploration of the informational value of differentiating between internal and external fragmentation classes (intext = “On”) resulted in the finding that, proportionally, internal forest areas are experiencing more transitions to non-forest or other fragmentation classes than external forest areas. This finding supports empirical evidence and reports that land use allocations are stabilizing, and that changes on the external edges of the forests are not as prevalent as they used to be during the times when the agricultural and cattle ranching frontiers were expanding into the edges of the forest areas [52,53]. However, this outcome must be considered in the context that only a very small proportion (around 3%) of the total tropical and temperate forest areas were classified into internal fragmentation classes for the three dates analyzed. This small proportion is in part due to the scale of the original data sets (1:250,000), the generalization effects created when grouping several forest types into the broader tropical and temperate forest classes used in this study, and the cell size used in the analyses (250 m × 250 m). Under these conditions, small perforations and fine details in the internal edges of the forest areas are difficult to detect and report in the source data sets used in this study. Future studies conducted over smaller geographical areas and/or at higher resolutions would be able to support or refute the existence of differences in transition rates between internal and external fragmentation classes.
In regard to the second goal of our study, when analyzing the transitions between fragmentation classes and between fragmentation classes and non-forest during the 2002–2008 and 2008–2013 periods, clear trends were identified. For both periods and forest types analyzed, the percent change from any of the fragmentation classes to non-forest is high compared to the change from one fragmentation class to another fragmentation class. The islet fragmentation class (internal and external) is the most vulnerable to transition to non-forest, followed by classes that represent elongated narrow forest areas (i.e., Branch, Bridge, and Loop), while core forests are consistently the least likely to change to non-forest. This is to be expected, as smaller isolated forest patches, as well as elongated narrow forest patches, are more likely to change to other land uses than forests that are farther from edges and span large compacted areas (i.e., Core class). Generally, the Edge class shows less of a tendency to change to non-forest than the elongated forest patches. Another evident trend is that transitions from forest to non-forest are decreasing over time across both temperate and tropical forests. The percent of each fragmentation class that changed to non-forest is much higher from 2002–2008 than it is from 2008–2013. During the 2002–2008 period, five to 26% of each fragmentation class changed to non-forest, while from 2008–2013 about 0% to 10%of each fragmentation class changed to non-forest. This reduction in the loss of forests and natural areas in general has also been reported in previous studies at the national and regional levels [48,54,55]. Two processes that might help explain this trend are: First, some areas of the country have reached maturity in terms of land use/cover allocations. For example, easily accessible forest areas suitable for agriculture have already been converted to this use for some time. Second, several studies report a growing trend in Mexico whereby farmers are abandoning low-productivity agricultural/cattle-ranching activities due to migration to urban centers putting less pressure on converting forests to anthropogenic land uses [48,52,56,57,58].
Differences in fragmentation of tropical and temperate forests are also evident across both periods analyzed. Overall, tropical forests are more likely to transition to non-forest than temperate forests. Tropical forests from 2002–2008 changed from a minimum of seven percent to a maximum of 26% to non-forest, while temperate forests from 2002–2008 changed a minimum of 5% to a maximum of 16% to non-forest (see Table B1 and Table B2). Similarly, from 2008–2013, tropical forests changed between 3% and 10% to non-forest, while temperate forests changed between 0% and 3% (see Table C1 and Table C2). This information reinforces empirical knowledge and results of studies stating that tropical forests, more than temperate forests, are in closer proximity to population centers and anthropogenic land uses, and they face larger risks of deforestation [35,54].
When analyzing the transitions between fragmentation classes, it is evident that there is more change from 2002–2008 than there is from 2008–2013. Across all fragmentation classes, higher percentages of the forest areas classified within a fragmentation class remained within the same fragmentation class from 2008–2013 than from 2002–2008. Core forests consistently changed the least in both tropical and temperate forests during both periods. This result is to be expected as these forests are buffered from edge effects and represent large compacted forest areas.
We used the national level land use/cover data sets that are the most recent, authoritative, comparable, and with the highest levels of quality control published to date by the Mexican federal government [41,42,43]. However, when considering the results and discussion presented above, the following potential sources of uncertainty should be kept in mind: First, there could be errors in the land use/cover classifications between the Series III, IV and V. These data sets have been reviewed and homogenized recently, and hence the likelihood of these errors has been reduced. The original land use/cover data sets are at a scale of 1:250,000. At this scale, small forest areas are difficult to detect and the reporting of the shape of the forest area borders is not extremely accurate. Second, the generalization effects introduced by using a 250 m × 250 m cell size may decrease the amount of detail defining the edges of forests. Third, there is a generalization effect when grouping more detailed forest cover classes into the broader tropical and temperate forests types used in this study. This could indirectly contribute to losing detail on the shape of the forest area borders. Finally, we acknowledge the difference in length between the 2002–2008 period (six years) and 2008–2013 period (five years). However, this difference is nominal as the INEGI’s Series III, IV and V were created using inputs (e.g., satellite images) collected over a period of time around the official date of publication [41,42,43,59]. While we acknowledge these possible sources of uncertainty, it is important to note that none by itself or in combination is large enough to change the clear trends identified at the national level in the results of this study.

5. Conclusions and Recommendations

The fragmentation of the forests influences ecological processes, the provisions of goods and services, and impacts the sustainability of the remaining forest areas in Mexico. Therefore, assessments and monitoring of the level of fragmentation of the forests should be incorporated into national forest inventories and forest ecosystems health reports. This information can enhance the prioritization and targeting of conservation efforts and management interventions in the remaining forests in the country.
The most appropriate use of the results of our study is to support strategic-level, national-scale, monitoring and decision-making processes because of the scale of the source land use/cover data sets we used, the aggregation we did of the specific forest types into the broader tropical and temperate forest types, and the resolution at which we carried out the fragmentation analyses. The results presented were generated using the latest authoritative national-level land cover data sets, as well as fragmentation analysis methodology sanctioned and used by multiple forest agencies. They form a quantitative baseline (in tabular and cartographic form) to support the systematic monitoring of the levels and evolution of the fragmentation of the forest in Mexico.
This study provides insights into how forest fragmentation levels and transitions between fragmentation classes, and between these and non-forest areas, have evolved in the tropical and temperate forests between the 2002–2008 and 2008–2013 periods at the national level. Clear trends were identified at the national level: The fragmentation levels and transitions of both forest types are larger in 2002–2008 than in the 2008–2013 period; high fragmentation classes (Branch, Bridge, Loop and Islet) are more likely to transition to non-forest; tropical forests fragmentation classes are more likely to transition to non-forest than fragmentation classes in the temperate forests; and proportionally, more transitions are occurring in internal fragmentation classes than in external ones. The reduction in transitions between fragmentation classes, and between these and non-forest, observed from the first to the second period points to an increased stabilization of the shape of forest patches and extent of the tropical and temperate forest covers at the national level.
Future studies can use (yet-to-be-developed) higher resolution, larger scale, land cover data sets, and/or concentrate on smaller geographic areas or more specific forest types to compare and integrate their results with the findings in this study. We suggest the consistent use of a fragmentation analysis methodology across multiple scales and forest types to facilitate comparisons and multi-scale integration.
Using the MSPA to identify forest fragmentation levels has several advantages. It is conceptually simple to understand by diverse stakeholders, and computationally easy to implement using freely available software; these features facilitate the periodical replication of fragmentation assessments at the national level, as well as at smaller geographical areas. The MSPA method produces cartographic products that allow the exploration of the spatial relationships of forest fragmentation over time, as well as the analysis of the potential relationships between fragmentation patterns to environmental (e.g., topography) or anthropogenic factors (e.g., adjacency or distance to agricultural areas). The MSPA results provide scientists, managers and the general public a visual representation of the forest fragmentation that they can explore and relate to their empirical knowledge and on-the-ground experiences in the forests. Finally, the MSPA output assigns unique identifiers to each fragmentation class, which facilitates further analysis, such as the cross-referencing of fragmentation classes between dates as it was done in this study.
This study does not differentiate between natural and anthropogenic causes of forest fragmentation, which is important for conservation purposes. Future studies can use GIS systems to overlay the cartographic results of this study with maps of anthropogenic activities such as urban developments, agricultural uses, and cattle ranching to better understand the driving factors of forest fragmentation in different geographic areas. Additionally, the fragmentation classes can be cross-referenced with socioeconomic data at the county or state level in order to enhance the understanding of the relationships between socioeconomic factors (e.g., poverty levels) and activities (e.g., dominant economic activity) with land use change and forest fragmentation processes, and their impacts on forest ecosystems over time. Lastly, since the beginning of this study, an updated version of the Guidos Toolbox containing the MSPA has been released (Guidos Toolbox 2.3, Revision 1). The newer version incorporates more fragmentation analysis tools that can provide further information such as differentiating between forest areas natural edge interface and an anthropogenic/artificial edge interface. This is valuable information that would enhance the results of this study and contribute to better targeting forest conservation efforts.

Supplementary Files

Supplementary File 1

Author Contributions

Elizabeth Clay applied the methods and carried out the analyses. Rafael Moreno-Sanchez conceived and designed the study, analyzed and discussed the results jointly with Elizabeth Clay, and wrote this article. Juan Manuel Torres-Rojo and Francisco Moreno-Sanchez contributed the data sets, contributed to the analysis of the results, and provided local expertise regarding the forests in Mexico.

Conflicts of Interest

The authors declare no conflict of interest.

Appendix A

Vegetation types from INEGI's Series III, IV and V included in the definition of temperate forests and tropical forests.
Temperate Forests
INEGI’s CVE_UNION codeDescription
BABosque de Oyamel
BBBosque de Cedro
BCBosque Cultivado
BGBosque de Galeria
BIBosque inducido
BJBosque de Tascate
BMBosque Mesofilo de Montana
BPBosque de Pino
BPQBosque de Pino-Encino
BQBosque de Encino
BQPBosque de Encino-Pino
BSBosque de Ayarin
Tropical Forests
SAPSelva Alta Perennifolia
SAQSelva Alta Subperennifolia
SBCSelva Baja Caducifolia
SBKSelva Baja Espinosa
SBPSelva Baja Perennifolia
SBQSelva Baja Subperennifolia
SBSSelva Baja Subcaducifolia
SGSelva de Galeria
SMCSelva Mediana Caducifolia
SMPSelva Mediana Perennifolia
SMQSelva Mediana Subperennifolia
SMSSelva Mediana Subcaducifolia
VSA/PTVegetacion Secundaria de Selvas Arborea/Vegetacion de Peten
VSA/SAPVegetacion Secundaria de Selvas Arborea/Selva Alta Perennifolia
VSA/SAQVegetacion Secundaria de Selvas Arborea/Selva Alta Subperennifolia
VSA/SBKVegetacion Secundaria de Selvas Arborea/Selva Baja Espinosa
VSA/SBQVegetacion Secundaria de Selvas Arborea/Selva Baja Subperennifolia
VSA/SGVegetacion Secundaria de Selvas Arborea/Selva de Galeria
VSA/SMQVegetacion Secundaria de Selvas Arborea/Selva Mediana Subperennifolia
VSA/SMSVegetacion Secundaria de Selvas Arborea/Selva Mediana Subcaducifolia
VSA/BSVegetacion Secundaria de Selvas Arborea/Bosque de Ayarin

Appendix B

Fragmentation classes transition matrices for tropical and temperate forests in the 2002–2008 period without differentiating between internal and external classes.
Table B1. Fragmentation classes transition matrices for tropical forest in the 2002–2008 period without differentiating between internal and external classes.
Tropical Forests Transitions 2002–2008 (Intext = Off)
% Change to Each 2008 Fragmentation Class/Hectares Changed to Each 2008 Fragmentation Class
Fragmentation Class 2002Area 2002 (ha)Non-ForestBranchEdgePerforationIsletCoreBridgeLoop
Branch781,79424.858.88.20.50.93.82.10.7
194,200459,84464,4753950741929,41916,7695719
Edge3,108,63116.72.867.81.90.19.01.20.4
519,28887,3752,107,53157,5444588280,40638,81913,050
Perforation531,33112.61.612.453.30.018.40.70.9
67,038873165,700283,32513897,81938694713
Islet67,08826.58.94.10.057.41.41.00.6
17,75060002744038,538956669431
Core13,240,8316.60.43.10.90.088.50.30.1
880,08151,194407,163114,681236311,721,29445,06918,975
Bridge252,96319.56.510.60.40.38.252.42.0
49,37516,46326,844103873820,863132,6255019
Loop87,62518.77.010.72.80.47.59.543.4
16,3816150938824313386550836338,025
Table B2. Fragmentation classes transition matrices for temperate forest in the 2002–2008 period without differentiating between internal and external classes.
Temperate Forests Transitions 2002–2008 (Intext = Off)
% Change to Each 2008 Fragmentation Class/Hectares Changed to Each 2008 Fragmentation Class
Fragmentation Class 2002Area 2002 (ha)Non-ForestBranchEdgePerforationIsletCoreBridgeLoop
Branch1,234,48815.875.94.50.20.61.70.90.4
195,350936,87555,4312506770021,23110,8444550
Edge4,074,18211.51.880.30.30.15.00.70.3
469,27571,7813,272,46310,7315119204,31929,53710,956
Perforation602,02512.81.612.762.90.08.30.71.1
76,894951376,244378,5063149,76343696706
Islet134,44412.53.42.30.080.80.70.10.2
16,763460631190108,625988131213
Core15,549,2014.90.32.70.60.091.10.20.1
768,47551,488417,76991,750215014,161,75035,90019,919
Bridge394,61311.43.65.70.20.14.473.51.1
45,18114,02522,58885050017,175290,0004294
Loop137,50012.63.75.62.00.24.05.366.6
17,3385069775027503385444723891,575

Appendix C

Fragmentation classes transition matrix tropical and temperate forests in the 2008–2013 period without differentiating between internal and external classes.
Table C1. Fragmentation classes transition matrices for tropical forest in the 2008–2013 period without differentiating between internal and external classes.
Tropical Forests Transitions 2008–2013 (Intext = Off)
% Change to Each 2013 Fragmentation Class/Hectares Changed to Each 2013 Fragmentation Class
Fragmentation Class 2008Area 2008 (ha)Non-ForestBranchEdgePerforationIsletCoreBridgeLoop
Branch827,3756.088.61.70.40.51.90.70.2
49,488732,81914,2693575400615,66955252025
Edge3,087,4384.20.988.61.50.14.20.40.2
129,33126,4752,735,47545,1562100130,59413,5754731
Perforation529,0508.11.09.962.40.017.30.50.8
42,631508852,350330,35613191,6252,6134256
Islet80,47510.44.01.80.082.01.10.20.4
8400325614131965,988900175325
Core13,030,5383.10.21.00.60.095.00.10.1
397,59420,725132,41981,15697512,374,35614,6888625
Bridge296,5814.62.23.40.60.12.684.61.8
13,606656910,15617503567788250,9695388
Loop106,4506.32.13.62.10.24.34.875.9
67312231379422752384531506980,788
Table C2. Fragmentation classes transition matrices for temperate forests in the 2008–2013 period without differentiating between internal and external classes.
Temperate Forests Transitions 2008–2013 (Intext = Off)
% Change to Each 2013 Fragmentation Class/Hectares Changed to Each 2013 Fragmentation Class
Fragmentation Class 2008Area 2008 (ha)Non-ForestBranchEdgePerforationIsletCoreBridgeLoop
Branch1,217,5131.197.70.60.00.10.30.10.0
12,8131,189,6257706188105640811538506
Edge4,117,1940.90.297.90.10.00.80.10.0
36,35671134,032,788262580032,8943731888
Perforation511,9440.70.13.094.30.01.60.00.2
375067515,469482,70608419125800
Islet138,5503.01.00.50.095.20.30.10.0
41311,3816500131,8753757563
Core14,686,7310.40.00.20.10.099.20.00.0
65,900433127,66911,96341914,571,92527691756
Bridge399,5370.70.51.30.00.00.896.10.5
271921945213131753356383,9871863
Loop150,5690.70.41.70.50.01.61.293.9
99454426317191924191819141,425

Appendix D

Fragmentation classes transition matrix tropical and temperate forests in the 2002–2008 period differentiating between internal and external fragmentation classes.
Table D1. Fragmentation classes transition matrix tropical forests in the 2002–2008 period differentiating between internal and external fragmentation classes.
Tropical Forests Transitions 2002–2008 (Intext = On)
% Change to Each 2008 Fragmentation Class/Hectares Changed to Each 2008 Fragmentation Class
External ClassesInternal Classes
Fragmentation Class 2002Area 2002 (ha)Non-ForestExternal BranchExternal EdgeExternal IsletExternal CoreExternal BridgeExternal LoopInternal BranchInternal EdgeInternal PerforationInternal IsletInternal CoreInternal BridgeInternal Loop
External Branch742,893.825.1458.348.470.993.332.150.690.530.020.270.000.010.030.02
186,787.45433,406.3062,943.757325.0024,762.5015,975.005162.503906.25162.501975.006.2568.75256.25156.25
External Edge3,085,49416.732.7667.840.158.871.220.390.040.121.810.000.010.020.02
516,324.9585,225.002,093,331.004587.50273,668.8037,743.7512,187.501337.503562.5055,887.500.00387.50500.00718.75
External Islet66,312.526.478.994.1457.231.441.010.590.000.000.000.130.000.000.00
17,550.005962.502743.7537,950.00956.25668.75393.750.000.000.0087.500.000.000.00
External Core13,217,8106.640.323.040.0288.470.310.090.060.030.860.000.070.030.05
877,056.3042675.00402,212.502356.2511,693,780.0041,162.5012,331.258281.254137.50114,331.306.259412.503475.006587.50
External Bridge244,693.719.816.4810.740.307.9052.131.750.040.040.250.000.040.440.09
48,462.5015,862.5026,287.50731.2519,318.75127,556.254293.75100.0093.75600.000.0093.751075.00218.75
External Loop71,05019.647.1312.200.457.1110.2439.530.270.001.170.000.090.201.96
13,956.255068.758668.75318.755050.007275.0028,087.50193.750.00831.250.0062.50143.751393.75
Internal Branch38,90019.0612.482.220.0311.660.630.1445.441.305.080.190.130.760.88
7412.504856.25862.5012.504537.50243.7556.2517,675.00506.251975.0075.0050.00293.75343.75
Internal Edge23,137.512.800.7313.050.0025.850.730.002.7832.937.160.001.591.760.62
2962.50168.753018.750.005981.25168.750.00643.757618.751656.250.00368.75406.25143.75
Internal Perforation531,331.212.620.7111.860.0218.340.470.340.940.5053.320.000.070.260.55
67,037.503756.2563,025.00125.0097,443.752512.501787.504975.002675.00283,325.0012.50375.001356.252925.00
Internal Islet77525.810.000.0012.100.000.000.004.840.000.0052.420.000.004.84
200.000.000.0093.750.000.000.0037.500.000.00406.250.000.0037.50
Internal Core23,018.7513.140.431.680.0051.810.540.000.601.851.520.0026.851.330.24
3025.00100.00387.500.0011,925.00125.000.00137.50425.00350.000.006181.25306.2556.25
Internal Bridge8268.7511.040.912.420.0015.508.090.685.143.175.290.082.0440.215.44
912.5075.00200.000.001281.25668.7556.25425.00262.50437.506.25168.753325.00450.00
Internal Loop16,57514.631.214.110.008.263.3610.904.150.239.650.110.412.3440.65
2425.00200.00681.250.001368.75556.251806.25687.5037.501600.0018.7568.75387.506737.50
Table D2. Fragmentation classes transition matrix temperate forests in the 2002–2008 period differentiating between internal and external fragmentation classes.
Temperate Forests Transitions 2002–2008 (Intext = On)
% Change to Each 2008 Fragmentation Class/Hectares Changed to Each 2008 Fragmentation Class
External ClassesInternal Classes
Fragmentation Class 2002Area 2002 (ha)Non-ForestExternal BranchExternal EdgeExternal IsletExternal CoreExternal BridgeExternal LoopInternal BranchInternal EdgeInternal PerforationInternal IsletInternal CoreInternal BridgeInternal Loop
External Branch1,171,46915.376.64.50.61.70.80.30.10.00.00.00.00.00.0
179,575896,97552,725735619,763989435698759441902581119
External Edge4,046,65011.41.780.50.15.00.70.30.00.00.20.00.00.00.0
462,26370,5883,256,1195063202,08128,70610,63831381995630163175163
External Islet132,86312.23.42.381.10.70.10.20.00.00.00.00.00.00.0
16,15045383075107,7699811312130006000
External Core15,526,4604.90.32.70.091.10.20.10.00.00.60.00.00.00.0
764,70045,681414,550211314,141,32033,63813,5755506206991,37519388818136219
External Bridge375,10010.63.55.80.14.274.60.90.00.00.10.00.00.10.0
39,70013,13121,69448815,819279,769343111319213075544106
External Loop101,31911.63.86.40.33.55.068.70.10.00.40.00.00.10.2
11,731383864503193506508169,563106134000675231
Internal Branch63,01925.09.93.20.32.10.80.552.00.93.30.20.20.60.9
15,77562562038213133147531332,7695752088131113394550
Internal Edge27,53125.51.615.40.05.61.30.01.641.04.20.22.01.10.5
70134504250615313561343111,275116950544300144
Internal Perforation602,02512.80.812.30.08.20.50.40.80.362.90.00.00.20.7
76,894473874,1561349,5383156247547752088378,5061922512134231
Internal Islet158138.70.80.02.00.00.00.03.62.80.051.80.40.00.0
6131303100056440819600
Internal Core22,73816.60.73.40.029.41.30.00.61.71.60.143.30.70.5
3775156763066882946144388375199856156119
Internal Bridge19,51328.12.12.90.05.58.10.81.91.63.30.01.141.53.1
548141956961069158815636330663862138100600
Internal Loop36,18115.51.13.30.05.23.37.52.10.36.50.00.22.552.7
5606381118861875119427257441002350135688819,056

Appendix E

Fragmentation classes transition matrix tropical and temperate forests in the 2008–2013 period differentiating between internal and external fragmentation classes.
Table E1. Fragmentation classes transition matrix tropical forests in the 2008–2013 period differentiating between internal and external fragmentation classes.
Tropical Forests Transitions 2008–2013 (Intext = On)
% Change to Each 2013 Fragmentation Class/Hectares Changed to Each 2013 Fragmentation Class
External ClassesInternal Classes
Fragmentation Class 2008Area 2008 (ha)Non-ForestExternal BranchExternal EdgeExternal IsletExternal CoreExternal BridgeExternal LoopInternal BranchInternal EdgeInternal PerforationInternal IsletInternal CoreInternal BridgeInternal Loop
External Branch779,7885.689.21.70.51.40.60.20.50.00.20.00.00.00.0
43,844695,45612,981395011,250492512564106561700638106113
External Edge3,064,7194.10.888.80.14.10.40.10.00.11.40.00.00.00.0
126,49424,9942,720,3752081126,83112,8814019638277542,8386125125538
External Islet79,68810.14.01.882.31.10.20.40.00.00.00.10.00.00.0
80503175141365,569881169325600100000
External Core13,011,5303.00.11.00.094.90.10.00.00.00.60.00.10.00.0
396,27516,050128,98889412,350,33012,44450444450240080,75650846318753513
External Bridge283,2754.42.13.30.12.385.41.50.00.00.30.00.00.40.1
12,331598194633506506241,831433856319000191075394
External Loop82,3195.51.83.80.33.15.477.80.10.00.80.00.00.11.4
4563146331132382531441964,03856668100631150
Internal Branch47,58811.912.31.60.18.70.60.457.61.03.90.00.60.50.9
5644585674431411927521327,400488187519263219444
Internal Edge22,71912.51.213.30.113.01.00.32.541.010.20.03.01.50.4
2838281301913296323875563930623190675331100
Internal Perforation529,0508.10.49.20.017.20.20.30.60.762.40.00.10.30.5
42,631190048,8258190,9751088142531883525330,3565065015252831
Internal Islet78844.40.80.06.32.40.80.08.70.02.434.10.00.00.0
3506050196069019269000
Internal Core19,0066.90.31.70.235.80.70.20.93.72.10.046.11.20.2
131963319316806131311637134000875623838
Internal Bridge13,3069.60.71.50.07.016.40.53.33.56.40.02.544.24.4
127594194692521886943846985003385875588
Internal Loop24,1319.01.42.40.08.00.89.61.60.46.60.00.32.257.7
2169331575019251942319381100159407553813,925
Table E2. Fragmentation classes transition matrix temperate forests in the 2008–2013 period differentiating between internal and external fragmentation classes.
Temperate Forests Transitions 2008–2013 (Intext = On)
% Change to Each 2013 Fragmentation Class/Hectares Changed to Each 2013 Fragmentation Class
External ClassesInternal Classes
Fragmentation Class 2008Area 2008 (ha)Non-ForestExternal BranchExternal EdgeExternal IsletExternal CoreExternal BridgeExternal LoopInternal BranchInternal EdgeInternal PerforationInternal IsletInternal CoreInternal BridgeInternal Loop
External Branch1,165,4121.197.60.70.10.30.10.00.00.00.00.00.00.00.0
12,6441,137,787.007706.251056.253993.751537.50481.25162.500.0043.750.000.000.000.00
External Edge4,097,7440.90.1797.950.020.800.090.020.000.000.060.000.000.000.00
36,3067050.004,013,588.00793.7532,862.503706.25881.2512.500.002537.500.000.000.006.25
External Islet137,3812.91.010.4795.230.270.050.050.000.000.000.000.000.000.00
40131381.25650.00130,825.00375.0075.0062.500.000.000.000.000.000.000.00
External Core14,671,0900.40.030.190.0099.210.020.010.000.000.080.000.000.000.00
65,8383731.2527,512.50418.7514,555,800.002656.251143.75587.50125.0011,962.500.00643.7575.00593.75
External Bridge385,1630.70.571.350.020.8454.600.300.000.000.010.000.000.000.01
27062193.755181.2575.003218.75210,281.251143.750.000.0043.750.000.000.0037.50
External Loop116,6440.60.322.190.021.381.3693.780.040.000.130.000.000.000.15
738368.752556.2518.751612.501587.50109,387.5043.750.00156.250.000.000.00175.00
Internal Branch52,1000.35.460.000.000.170.000.0093.730.000.280.000.000.000.05
1692843.750.000.0087.500.000.0048,831.250.00143.750.000.000.0025.00
Internal Edge19,4500.30.0313.910.030.160.000.000.2284.800.450.000.000.130.00
506.252706.256.2531.250.000.0043.7516,493.7587.500.000.0025.000.00
Internal Perforation511,9440.70.052.930.001.640.010.060.080.1094.290.000.000.020.10
3750243.7514,975.000.008412.5031.25287.50431.25493.75482,706.200.006.2593.75512.50
Internal Islet116910.20.000.000.530.000.000.000.000.000.0089.300.000.000.00
1190.000.006.250.000.000.000.000.000.001043.750.000.000.00
Internal Core15,6440.40.040.080.0014.500.000.080.040.120.000.0084.460.240.04
636.2512.500.002268.750.0012.506.2518.750.000.0013,212.5037.506.25
Internal Bridge14,3750.10.000.220.000.966.570.000.000.000.610.000.0090.261.30
130.0031.250.00137.50943.750.000.000.0087.500.000.0012,975.00187.50
Internal Loop33,9250.80.130.220.002.360.062.870.260.001.660.000.020.6391.05
25643.7575.000.00800.0018.75975.0087.500.00562.500.006.25212.5030,887.50

References

  1. Tabarelli, M.; Da Silva, J.M.C.; Gascon, C. Forest fragmentation, synergisms and the impoverishment of neotropical forests. Biodivers. Conserv. 2004, 13, 1419–1425. [Google Scholar] [CrossRef]
  2. Vellend, M.; Verheyen, K.; Jacquemyn, H.; Kolb, A.; Van Calster, H.; Peterken, G.; Hermy, M. Extinction debt of forest plants persists for more than a century following habitat fragmentation. Ecology 2006, 87, 542–548. [Google Scholar] [CrossRef] [PubMed]
  3. Fischer, J.; Lindenmayer, D.B. Landscape modification and habitat fragmentation: A synthesis. Glob. Ecol. Biogeogr. 2007, 16, 265–280. [Google Scholar] [CrossRef]
  4. Turner, I.M. Species loss in fragments of tropical rain forest: A review of the evidence. J. Appl. Ecol. 1996, 33, 200–209. [Google Scholar] [CrossRef]
  5. Foley, J.A.; DeFries, R.; Asner, G.P.; Barford, C.; Bonan, B.; Carpenter, S.R.; Chapin, F.S.; Coe, M.T.; Daily, G.C.; Gibbs, H.K.; et al. Global consequences of land use. Science 2005, 309, 570–574. [Google Scholar] [CrossRef] [PubMed]
  6. Jacquemyn, H.; Butaye, J.; Hermy, M. Forest plant species richness in small, fragmented mixed deciduous forest patches: The role of area, time and dispersal limitation. J. Biogeogr. 2001, 28, 801–812. [Google Scholar] [CrossRef]
  7. Vellend, M. Habitat loss inhibits recovery of plant diversity as forests regrow. Ecology 2003, 84, 1158–1164. [Google Scholar] [CrossRef]
  8. Vellend, M. Parallel effects of land-use history on species diversity and genetic diversity of forest herbs. Ecology 2004, 85, 3043–3055. [Google Scholar] [CrossRef]
  9. Murcia, C. Edge effects in fragmented forests: Implications for conservation. Trends Ecol. Evol. 1995, 10, 58–62. [Google Scholar] [CrossRef]
  10. Laurance, W.F.; Delamônica, P.; Laurance, S.G.; Vasconcelos, H.L.; Lovejoy, T.E. Conservation: Rainforest fragmentation kills big trees. Nature 2000, 404, 836–836. [Google Scholar] [CrossRef] [PubMed]
  11. Ribeiro, M.C.; Metzger, J.P.; Martensen, A.C.; Ponzoni, F.J.; Hirota, M.M. The Brazilian Atlantic Forest: How much is left, and how is the remaining forest distributed? Implications for conservation. Biol. Conserv. 2009, 142, 1141–1153. [Google Scholar] [CrossRef]
  12. Harper, K.A.; MacDonald, S.E.; Burton, P.J.; Chen, J.; Brosofske, K.D.; Saunders, S.C.; Euskirchen, E.S.; Roberts, D.; Jaith, M.S.; Per-Anders, E. Edge influence on forest structure and composition in fragmented landscapes. Conserv. Biol. 2005, 19, 768–782. [Google Scholar] [CrossRef]
  13. Laurance, W.F.; Camargo, J.L.; Luizão, R.C.; Laurance, S.G.; Pimm, S.L.; Bruna, E.M.; Phillip, P.C.; Williamson, B.; Benitez-Malvido, J.; Vasconcelos, H.I.; et al. The fate of Amazonian forest fragments: A 32-year investigation. Biol. Conserv. 2011, 144, 56–67. [Google Scholar] [CrossRef]
  14. Harrison, S.; Bruna, E. Habitat fragmentation and large-scale conservation: What do we know for sure? Ecography 1999, 22, 225–232. [Google Scholar] [CrossRef]
  15. Donovan, T.M.; Flather, C.H. Relationship among North American songbird trends, habitat fragmentation, and landscape occupancy. Ecol. Appl. 2002, 12, 364–374. [Google Scholar]
  16. Schmiegelow, F.K.A.; Mönkkönen, M. Habitat loss and fragmentation in dynamic landscapes: Avian perspectives from the boreal forest. Ecol. Appl. 2002, 12, 375–389. [Google Scholar]
  17. Thompson, J.; Brokaw, N.; Zimmerman, J.K.; Waide, R.B.; Everham, E.M.; Lodge, D.J.; Taylor, C.M.; Garcia-Montiel, D.; Fluet, M. Land use history, environment, and tree composition in a tropical forest. Ecol. Appl. 2002, 12, 1344–1363. [Google Scholar] [CrossRef]
  18. Tscharntke, T.; Steffan-Dewenter, I.; Kruess, A.; Thies, C. Contribution of small habital fragmentes to conservation of insect communities of grassland-cropland landscapes. Ecol. Appl. 2002, 12, 354–363. [Google Scholar]
  19. Fahrig, L. Effects of habitat fragmentation on biodiversity. Annu. Rev. Ecol. Evol. Syst. 2003, 34, 487–515. [Google Scholar] [CrossRef]
  20. Groom, M.J.; Meffe, G.K.; Ronald, C. Principles of Conservation Biology, 3rd ed.; Sinauer Associates: Sunderland, MA, USA, 2005; Volume 779, pp. 213–252. [Google Scholar]
  21. Schleuning, M.; Farwig, N.; Peters, M.K.; Bergsdorf, T.; Bleher, B.; Brandl, R.; Dalitz, H.; Fischer, G.; Freund, W.; Gikungu, M.W.; et al. Forest fragmentation and selective logging have inconsistent effects on multiple animal-mediated ecosystem processes in a tropical forest. PLoS ONE 2011, 6, e27785–e27785. [Google Scholar] [CrossRef] [PubMed]
  22. Lord, J.M.; Norton, D.A. Scale and the spatial concept of fragmentation. Conserv. Biol. 1990, 4, 197–202. [Google Scholar] [CrossRef]
  23. Haila, Y. Islands and fragments. In Maintaining Biodiversity in Forest Ecosystems; Hunter, M.L.J., Ed.; Cambridge University Press: Cambridge, UK, 1999; pp. 234–264. [Google Scholar]
  24. Haila, Y. A conceptual genealogy of fragmentation research: From island biogeography to landscape ecology. Ecol. Appl. 2002, 12, 321–334. [Google Scholar]
  25. Villard, M.A. Habitat fragmentation: Major conservation issue or intellectual attractor? Ecol. Appl. 2002, 12, 319–320. [Google Scholar] [CrossRef]
  26. Lindenmayer, D.B.; Fisher, J. Tackling the habitat fragmentation panchreston. Trends Ecol. Evol. 2006, 22, 127–132. [Google Scholar] [CrossRef] [PubMed]
  27. Kupfer, J.A. Landscape ecology and biogeography: Rethinking landscape metrics in a post-FRAGSTATS landscape. Prog. Phys. Geogr. 2012, 36, 400–420. [Google Scholar] [CrossRef]
  28. Boutin, S.; Hebert, D. Landscape ecology and forest management: Developing and effective partnership. Ecol. Appl. 2002, 12, 390–397. [Google Scholar]
  29. McGarigal, K.; Cushman, S.A. Comparative evaluation of experimental approaches to the study of habitat fragmentation effects. Ecol. Appl. 2002, 12, 335–345. [Google Scholar] [CrossRef]
  30. Rutledge, D. Landscape Measures as Indices of the Effects of Fragmentation: Can Pattern Reflect Process? Doc Science Internal Series 98; New Zealand Department of Conservation: Wellington, New Zealand, 2003. Available online: http://sof.eomf.on.ca/Biological_Diversity/Ecosystem/Fragmentation/Indicators/Shape/Documents/Landscape_fragmentation_%20process.pdf (accessed on 1 December 2015).
  31. Wilcove, D.S.; McLellan, C.H.; Dobson, A.P. Habitat fragmentation in the temperate zone. Conserv. Biol. 1986, 6, 237–256. [Google Scholar]
  32. Riitters, K.H.; Wickham, J.; O’Neill, R.; Jones, B.; Smith, E. Global-Scale Patterns of Forest Fragmentation. Ecol. Soc. 2000, 4, p. 3. Available online: http://www.ecologyandsociety.org/vol4/iss2/art3/ (accessed on 15 August 2015).
  33. Wade, T.G.; Ritters, K.H.; Wickham, J.D.; Jones, K.B. Distribution and causes of global forest fragmentation. Conserv. Ecol. 2003, 7, 7–21. [Google Scholar]
  34. Moreno-Sanchez, R.; Moreno-Sanchez, F.; Torres-Rojo, J.M. National assessment of the evolution of forest fragmentation in Mexico. J. For. Res. 2011, 22, 167–174. [Google Scholar] [CrossRef]
  35. Moreno-Sanchez, R.; Torres-Rojo, J.M.; Moreno-Sanchez, F.; Hawkins, S.; Little, J.; MacPartland, S. National assessment of the fragmentation, accessibility and anthropogenic pressure on the forests in Mexico. J. For. Res. 2012, 23, 529–541. [Google Scholar] [CrossRef]
  36. Moreno-Sanchez, R.; Buxton-Torres, T.; Silbernagel, K.; Moreno-Sanchez, F. Fragmentation of the forests in Mexico: National level assessments for 1993, 2002 and 2008. Int. J. Stat. Geogr. 2014, 5, 4–17. [Google Scholar]
  37. Kupfer, J.A. National assessment of forest fragmentation in the US. Glob. Environ. Chang. 2006, 16, 72–82. [Google Scholar] [CrossRef]
  38. Heilman, G.E., Jr.; Strittholt, J.R.; Slosser, N.C.; Dellasala, D.A. Forest fragmentation of the conterminous United States: Assessing forest intactness through road density and spatial Characteristics. BioScience 2002, 52, 411–422. [Google Scholar] [CrossRef]
  39. Riitters, K.H.; Wickham, J.; Coulston, J.W. A preliminary assessment of Montreal process indicators of the forest fragmentation for the United States. Environ. Monit. Assess. 2004, 91, 257–276. [Google Scholar] [CrossRef] [PubMed]
  40. Groombridge, B.; Jenkins, M.D. Global biodiversity. In Earth’s Living Resources in the 21st Century; United Nations Environment Programme: Nairobi, Kenya, 2000. [Google Scholar]
  41. Instituto Nacional de Geografía e Informática. Guía Para la Interpretación de la Cartografía uso del Suelo y Vegetación, Escala 1:250,000 Serie III; INEGI: Aguascalientes, Mexico, 2009; p. 77. Available online: http://www.inegi.org.mx/prod_serv/contenidos/espanol/bvinegi/productos/geografia/publicaciones/guias-carto/sueloyveg/1_250_III/Suelo_Vegeta.pdf (accessed on 1 August 2015).
  42. Instituto Nacional de Geografía e Informática. Guía Para la Interpretación de la Cartografía uso del Suelo y Vegetación, Escala 1:250,000 Serie IV; INEGI: Aguascalientes México, 2012; p. 132. Available online: http://www.inegi.org.mx/prod_serv/contenidos/espanol/bvinegi/productos/geografia/publicaciones/guias-carto/sueloyveg/1_250_IV/1_250_IV.pdf (accessed on 1 August 2015).
  43. Instituto Nacional de Geografía e Informática. Guía para la Interpretación de la Cartografía uso del Suelo y Vegetación, Escala 1:250,000 Serie V; INEGI: Aguascalientes, México, 2014; p. 200. Available online: http://www.inegi.org.mx/geo/contenidos/recnat/usosuelo/doc/guia_interusosuelov.pdf (accessed on 1 August 2015).
  44. Vogt, P.; Riitters, K.H.; Estreguil, C.; Kozak, J.; Wade, T.G.; Wickham, J.D. Mapping spatial patterns with morphological image processing. Landsc. Ecol. 2007, 22, 171–177. [Google Scholar] [CrossRef]
  45. Soille, P.; Vogt, P. Morphological segmentation of binary patterns. Pattern Recognit. Lett. 2008, 30, 456–459. [Google Scholar] [CrossRef]
  46. Wickham, J.D.; Riitters, K.H.; Wade, T.G.; Vogt, P. A national assessment of green infrastructure and change for the conterminous United States using morphological image processing. Landsc. Urban Plan. 2010, 94, 186–195. [Google Scholar] [CrossRef]
  47. European Commission Joint Research Centre. http://forest.jrc.ec.europa.eu/download/software/guidos/mspa/ (accessed on 15 August 2015).
  48. Alejandro, V.; Mas, J.-F.; Bocco, G.; Palacio-Prieto, J.L. Mapping land cover changes in Mexico, 1976–2000 and applications for guiding environmental management policy. Singap. J. Trop. Geogr. 2010, 31, 152–162. [Google Scholar]
  49. Mendoza, E.; Fay, J.; Dirzo, R. A quantitative analysis of forest fragmentation in Los Tuxtlas, southeast Mexico: Patterns and implications for conservation. Rev. Chil. Hist. Nat. 2005, 78, 451–467. [Google Scholar] [CrossRef]
  50. Cayuela, L.; Benayas, J.M.R.; Echeverria, C. Clearance and fragmentation of tropical montane forests in the Highlands of Chiapas, Mexico (1975–2000). For. Ecol. Manag. 2006, 226, 208–218. [Google Scholar] [CrossRef]
  51. Galicia, L.; Zarco-Arista, A.E.; Mendoza-Robles, L.I.; Palacio-Prieto, J.L.; Garcia-Romero, A. Land use/cover, landforms and fragmentation patterns in a tropical dry forest in the southern Pacific region of Mexico. Singap. J. Trop. Geogr. 2008, 29, 137–154. [Google Scholar] [CrossRef]
  52. Ramirez, I. Cambios in las cubiertas del suelo en la sierra de Angangueo michoaclan y estado de Mexico 1971–1994–2000. Investig. Geogr. 2001, 45, 39–55. [Google Scholar]
  53. Cuevas, G.M.V.; Aragon, I.E.R. Evaluacion de los cambios de cobertura del suelo en la reserve de la biosfera: Barranca de Metztitlan, Hidalgo, Mexico (1973–2006). Pap. Geogr. 2010, 50, 307–316. [Google Scholar]
  54. Alejandro, V.; Mas, J.F.; Gallegos, J.R.G.; Mayorga-Saucedo, R.; Alcantara, P.C.; Castro, R.; Fernandez, T.; Bocco, G.; Ezcurra, Y.E.; Palacio, J.L. Patrones y tasas de cambio de uso del suelo en Mexico. Gac. Ecol. 2002, 62, 21–37. [Google Scholar]
  55. Alejandro, V.; Durán, E.; Ramírez, I.; Mas, J.-F.; Bocco, G.; Ramírez, G.; Palacio, J.-L. Land use-cover change processes in highly biodiverse areas: The case of Oaxaca, Mexico. Glob. Environ. Chang. 2003, 13, 175–184. [Google Scholar]
  56. Garcia de Fuentes, A.; Morales, J. Dinámica regional de Yucatán 1980–2000. Investig. Geogr. Bol. Inst. Geogr. 2000, 42, 157–172. [Google Scholar]
  57. Garcia, G.G.; March, I.; Castillo, M. Transformación de la vegetación por cambio de uso del suelo en la Reserva de la Biosfera Calakmul, Campeche. Investig. Geogr. UNAM 2002, 46, 45–57. [Google Scholar]
  58. Lopez, E.; Bocco, G.; Mendoza, M.; Velazquez, A.; Aguirre-Rivera, J.R. Peasant emigration and land-use change at the watershed level: A GIS-based approach in Central Mexico. Agric. Syst. 2006, 90, 62–78. [Google Scholar] [CrossRef]
  59. Niño Alcocer, M.; Victoria Hernandez, A. Información de uso del suelo y vegetación escala 1:250,000 Serie V (Conjunto Nacional). Memorias del Congreso SELPER (Sociedad Latinoamericana de Percepción Remota y Sistemas de Información Espacial). 2013. Available online: http://langif.uaslp.mx/selper/documentos/CD_SELPER_2013/MEMORIAS_SELPER_PDF/Estudios_Tematicos/ID_008.pdf (assessed on 15 August 2015).
Figure 1. An illustration of the definition of the seven fragmentation classes resulting from the MSPA analysis for a hypothetical area and foreground (forest) patches. Cells in grey color represent the background (non-forest) areas [47].
Forests 07 00048 g001
Figure 2. Illustration of the fragmentation classes that are generated when setting the intext parameter to on (value of 1) or off (value of 0) for a hypothetical area and foreground (forest) patches. Cells in grey color represent the background (non-forest) areas. The numbers correspond to the values assigned to each fragmentation class as unique identifiers [47].
Forests 07 00048 g002
Figure 3. Sample of the map output of MSPA fragmentation classes generated with the intext parameter set to “Off” for an area of the tropical forests in 2002.
Forests 07 00048 g003
Figure 4. Sample of the map output of MSPA fragmentation classes generated with the intext parameter set to “On” for an area of the tropical forests in 2002.
Forests 07 00048 g004
Figure 5. Example of fragmentation classes in 2008 that fall within the 2002-Edge class for a sample area of tropical forests.
Forests 07 00048 g005
Figure 6. Example of internal and external fragmentation classes in 2008 that fall within the 2002-External-Edge class for a sample area of tropical forests.
Forests 07 00048 g006
Table 1. Definition of the basic fragmentation classes created by the Morphological Spatial Pattern Analysis (MSPA) method.
Fragmentation ClassDescription
CoreDefined as those foreground (i.e., forest) cells surrounded in all sides by foreground cells and a distance from the background (i.e., non-forest) greater than the edge width parameter specified for the MSPA analysis.
IsletComposed of connected forest cells that do not contain any Core cell.
PerforationPerforation class is composed of cells that form the transition between forest and non-forest areas for interior regions of forest areas. Imagine a group of forest cells in the shape of a doughnut; the cells forming the inner edge of the doughnut would be classified as Perforation, whereas those forming the outer edge would be classified as Edge.
EdgeComposed of forest cells that form the transition between forest and non-forest areas.
BridgeBridge class is composed of forest cells that connect two or more disjointed areas of Core.
LoopLoop is composed of forest cells that connect an area of Core to itself.
BranchComposed of forest cells that extent from an area of Core, but do not connect to another area of Core.
Table 2. Areas in each fragmentation class (intext = “Off”) for the tropical forests in 2002, 2008 and 2013. The differences in area in each fragmentation class and percent changes between dates are presented in the last columns on the right-hand side.
Tropical Forests (Intext = Off)
2002–20082008–2013
Fragmentation Class2002 Area (ha)Percent of Total Forest Area in 20022008 Area (ha)Percent of Total Forest Area in 20082013 Area (ha)Percent of Total Forest Area in 2013Change of Area in Class from 2002 to 2008 (ha)% Change 2002–2008 Based on Class Area in 2002Change of Area in Class from 2008 to 2013 (ha)% Change 2008–2013 Based on Class Area in 2008
Branch781,7944.33827,3754.61847,9754.6045,5815.8320,6002.49
Edge3,108,63117.203,087,43817.193,078,61916.71−21,193−0.68−8819−0.29
Perforation531,3312.94529,0502.95545,9192.96−2281−0.4316,8693.19
Islet67,0880.3780,4750.4579,5940.4313,38719.95−881−1.09
Core13,240,83173.2713,030,53872.5613,447,18872.98−210,293−1.59416,6503.20
Bridge252,9621.40296,5821.65308,7941.6843,62017.2412,2124.12
Loop87,6250.48106,4510.59116,9250.6318,82621.4810,4749.84
Total Forest Area18,070,26217,957,90718,425,013−112,355−0.62467,1062.60
Table 3. Areas in each fragmentation class (intext = “Off”) for the temperate forests in 2002, 2008 and 2013. The differences in area in each fragmentation class and percent changes between dates are presented in the last columns on the right-hand side.
Temperate Forests (Intext = Off)
2002–20082008–2013
Fragmentation Class2002 Area (ha)Percent of Total Forest Area in 20022008 Area (ha)Percent of Total Forest Area in 20082013 Area (ha)Percent of Total Forest Area in 2013Change of Area in Class from 2002 to 2008 (ha)% Change 2002–2008 Based on Class Area in 2002Change of Area in Class from 2008 to 2013 (ha)% Change 2008–2013 Based on Class Area in 2008
Branch1,234,4885.581,217,5135.741,222,6135.75−16,975−1.3851000.42
Edge4,074,18218.414,117,19419.404,147,90619.5043,0121.0630,7120.75
Perforation602,0252.72511,9442.41499,6442.35−90,081−14.96−12,300−2.40
Islet134,4440.61138,5500.65138,2880.6541063.05−262−0.19
Core15,549,20170.2714,686,73169.2114,716,17469.18−862,470−5.5529,4430.20
Bridge394,6131.78399,5381.88397,4631.8749251.25−2075−0.52
Loop137,5000.62150,5690.71148,9430.7013,0699.50−1626−1.08
Total Forest Area22,126,45121,222,03721,271,030−904,414−4.0948,9930.23
Table 4. Areas in each fragmentation class (intext = “On”) for the tropical forests in 2002, 2008 and 2013. The differences in area and percent changes between dates are presented in the last columns on the right-hand side.
Tropical Forests (Intext = On)
Fragmentation Class2002 Area (ha)Percent of Total Forest Area in 20022008 Area (ha)Percent of Total Forest Area in 20082013 Area (ha)Percent of Total Forest Area in 20132002–20082008–2013
Change of Area in Class from 2002 to 2008 (ha)% Change 2002–2008 Based on Class Area in 2002Change of Area in Class from 2008 to 2013 (ha)% Change 2008–2013 Based on Class Area in 2008
External Branch742,8944.11779,7884.34796,1064.3236,8944.9716,3182.09
External Edge3,085,49417.073,064,71917.073,053,50016.57−20,775−0.67−11,219−0.37
External Islet66,3130.3779,6880.4479,0690.4313,37520.17−619−0.78
External Core13,217,81073.1513,011,53072.4613,424,28872.86−206,280−1.56412,7583.17
External Bridge244,6941.35283,2751.58294,3061.6038,58115.7711,0313.89
External Loop71,0510.3982,3190.4688,2130.4811,26815.865,8947.16
EXTERNAL TOTAL17,428,25696.4517,301,31996.3417,735,48296.26−126,937−0.73434,1632.51
Internal Branch38,9000.2247,5880.2651,8690.28868822.3342819.00
Internal Edge23,1380.1322,7190.1325,1190.14−419−1.81240010.56
Internal Perforation531,3312.94529,0502.95545,9192.96−2281−0.4316,8693.19
Internal Islet7750.007880.005250.00131.68−263−33.38
Internal Core23,0190.1319,0060.1122,9000.12−4013−17.43389420.49
Internal Bridge82690.0513,3060.0714,4880.08503760.9111828.88
Internal Loop16,5760.0924,1320.1328,7130.16755645.58458118.98
INTERNAL TOTAL642,0083.55656,5893.66689,5333.7414,5812.2732,9445.02
Total Forest Area18,070,26217,957,90718,425,013−112,355−0.62467,1062.60
Table 5. Areas in each fragmentation class (intext = “On”) for the temperate forests in 2002, 2008 and 2013. The differences in area and percent changes between dates are presented in the last columns on the right-hand side.
Temperate Forests (Intext = On)
2002–20082008–2013
Fragmentation Class2002 Area (ha)Percent of Total Forest Area in 20022008 Area (ha)Percent of Total Forest Area in 20082013 Area (ha)Percent of Total Forest Area in 2013Change of Area in Class from 2002 to 2008 (ha)% Change 2002–2008 Based on Class Area in 2002Change of Area in Class from 2008 to 2013 (ha)% Change 2008–2013 Based on Class Area in 2008
External Branch1,171,4695.291,165,4125.491,172,2445.51−6057−0.5268320.59
External Edge4,046,65018.294,097,74419.314,130,77519.4251,0941.2633,0310.81
External Islet132,8630.60137,3810.65137,2440.6545183.40−137−0.10
External Core15,526,46070.1714,671,09069.1314,702,30769.12−855,370−5.5131,2170.21
External Bridge375,1001.70385,1631.81384,0441.8110,0632.68−1119−0.29
External Loop101,3190.46116,6440.55116,4000.5515,32515.13−244−0.21
EXTERNAL TOTAL21,353,86196.5120,573,43496.9420,643,01497.05−780,427−3.6569,5800.34
Internal Branch63,0190.2852,1000.2550,3690.24−10,919−17.33−1731−3.32
Internal Edge27,5310.1219,4500.0917,1310.08−8081−29.35−2319−11.92
Internal Perforation602,0252.72511,9442.41499,6442.35−90,081−14.96−12,300−2.40
Internal Islet15810.0111690.0110440.00−412−26.06−125−10.69
Internal Core22,7380.1015,6440.0713,8690.07−7094−31.20−1775−11.35
Internal Bridge19,5130.0914,3760.0713,4190.06−5137−26.33−957−6.66
Internal Loop36,1810.1633,9260.1632,5440.15−2255−6.23−1382−4.07
INTERNAL TOTAL772,5883.49648,6093.06628,0202.95−123,979−16.05−20,589−3.17
Total Forest Area22,126,45121,222,03721,271,030−904,414−4.0948,9930.23

