1. Introduction
Since the 1960s, weight scaling of sawlogs for volume based transactions has developed into a widely applied method used by forest industry across North America [
1,
2], with interior British Columbia uses weight scaling to process 97% of its harvested timber [
3]. Developments in timber harvesting techniques and lumber production processes, such as improved supply chain procedures and mechanized machinery, have increased harvesting efficiency and retrievable products from each forest management activity [
4]. In order to meet the growing demand for increased forest products while reducing scaling costs for mills, a systematic random sample of trucks arriving at the mill is often used to determine truck weight-to-volume (W-V) relationships. The process of weight scaling, however, relies heavily upon regional knowledge of wood characteristics and seasonal trends to accurately estimate harvested volumes [
5].
Water content is among the many variables associated with W-V relationships affecting sawlog inventory [
6]. Stem moisture content in weight scaling systems has been found to be significant in southern hardwoods and not significant in some mid-western softwood sawlogs studies [
2,
7]. Sap flux density and thus log moisture vary spatially within stems, commonly peaking towards the outer edges in the radial direction and declining toward the heartwood, leading to different moisture contents between heartwood and sapwood [
8,
9]. For softwoods, the moisture content of heartwood is typically considerably lower than for sapwood [
10,
11,
12]. Additional studies have identified seasonal patterns associated with stem moisture content of pulpwood [
13]. Previous studies have explored similar methodologies for measuring bole moisture loss of softwoods, with each producing common trends of moisture loss related to season and the presence of tree crowns [
14,
15,
16,
17]. Subsequent results have shown faster moisture loss immediately following felling, with trees that have intact crowns losing more moisture over the study duration. However, these studies are characterized by smaller sample sizes (8–20 stems) and narrow sample diameter ranges (6–18 cm).
Although decreasingly common in the northern Rocky Mountain region, operational practices that have been the focus of past research, such as sour-felling and floatation of logs for transportation purposes provide insight into changes in wood moisture content for weight scaling [
18]. For example, sour felling works to encourage moisture loss in harvested stems in an effort to increase the amount of volume that can be transported on each truckload [
19,
20]. Reducing transportations costs to lower biomass moisture content can also provide increased energy yields in forest products burned for energy [
20]. This process also increases the buoyancy of logs for transportation through floatation [
18]. However, while increased moisture loss benefits harvest operations based on volume based transactions, it negatively impacts profit margins of operations using weight based transactions by removing a source of profit in the bole moisture content and subsequently total stem weight. Finally, fuel moisture content studies have modeled stem moisture changes and rates based on stem size; limitations of such approaches have included the coarse temporal-resolution of samples (weekly) and that key information such as time since felling (
i.e., proportion of dead and green stems) is often not included in the regression models [
21,
22].
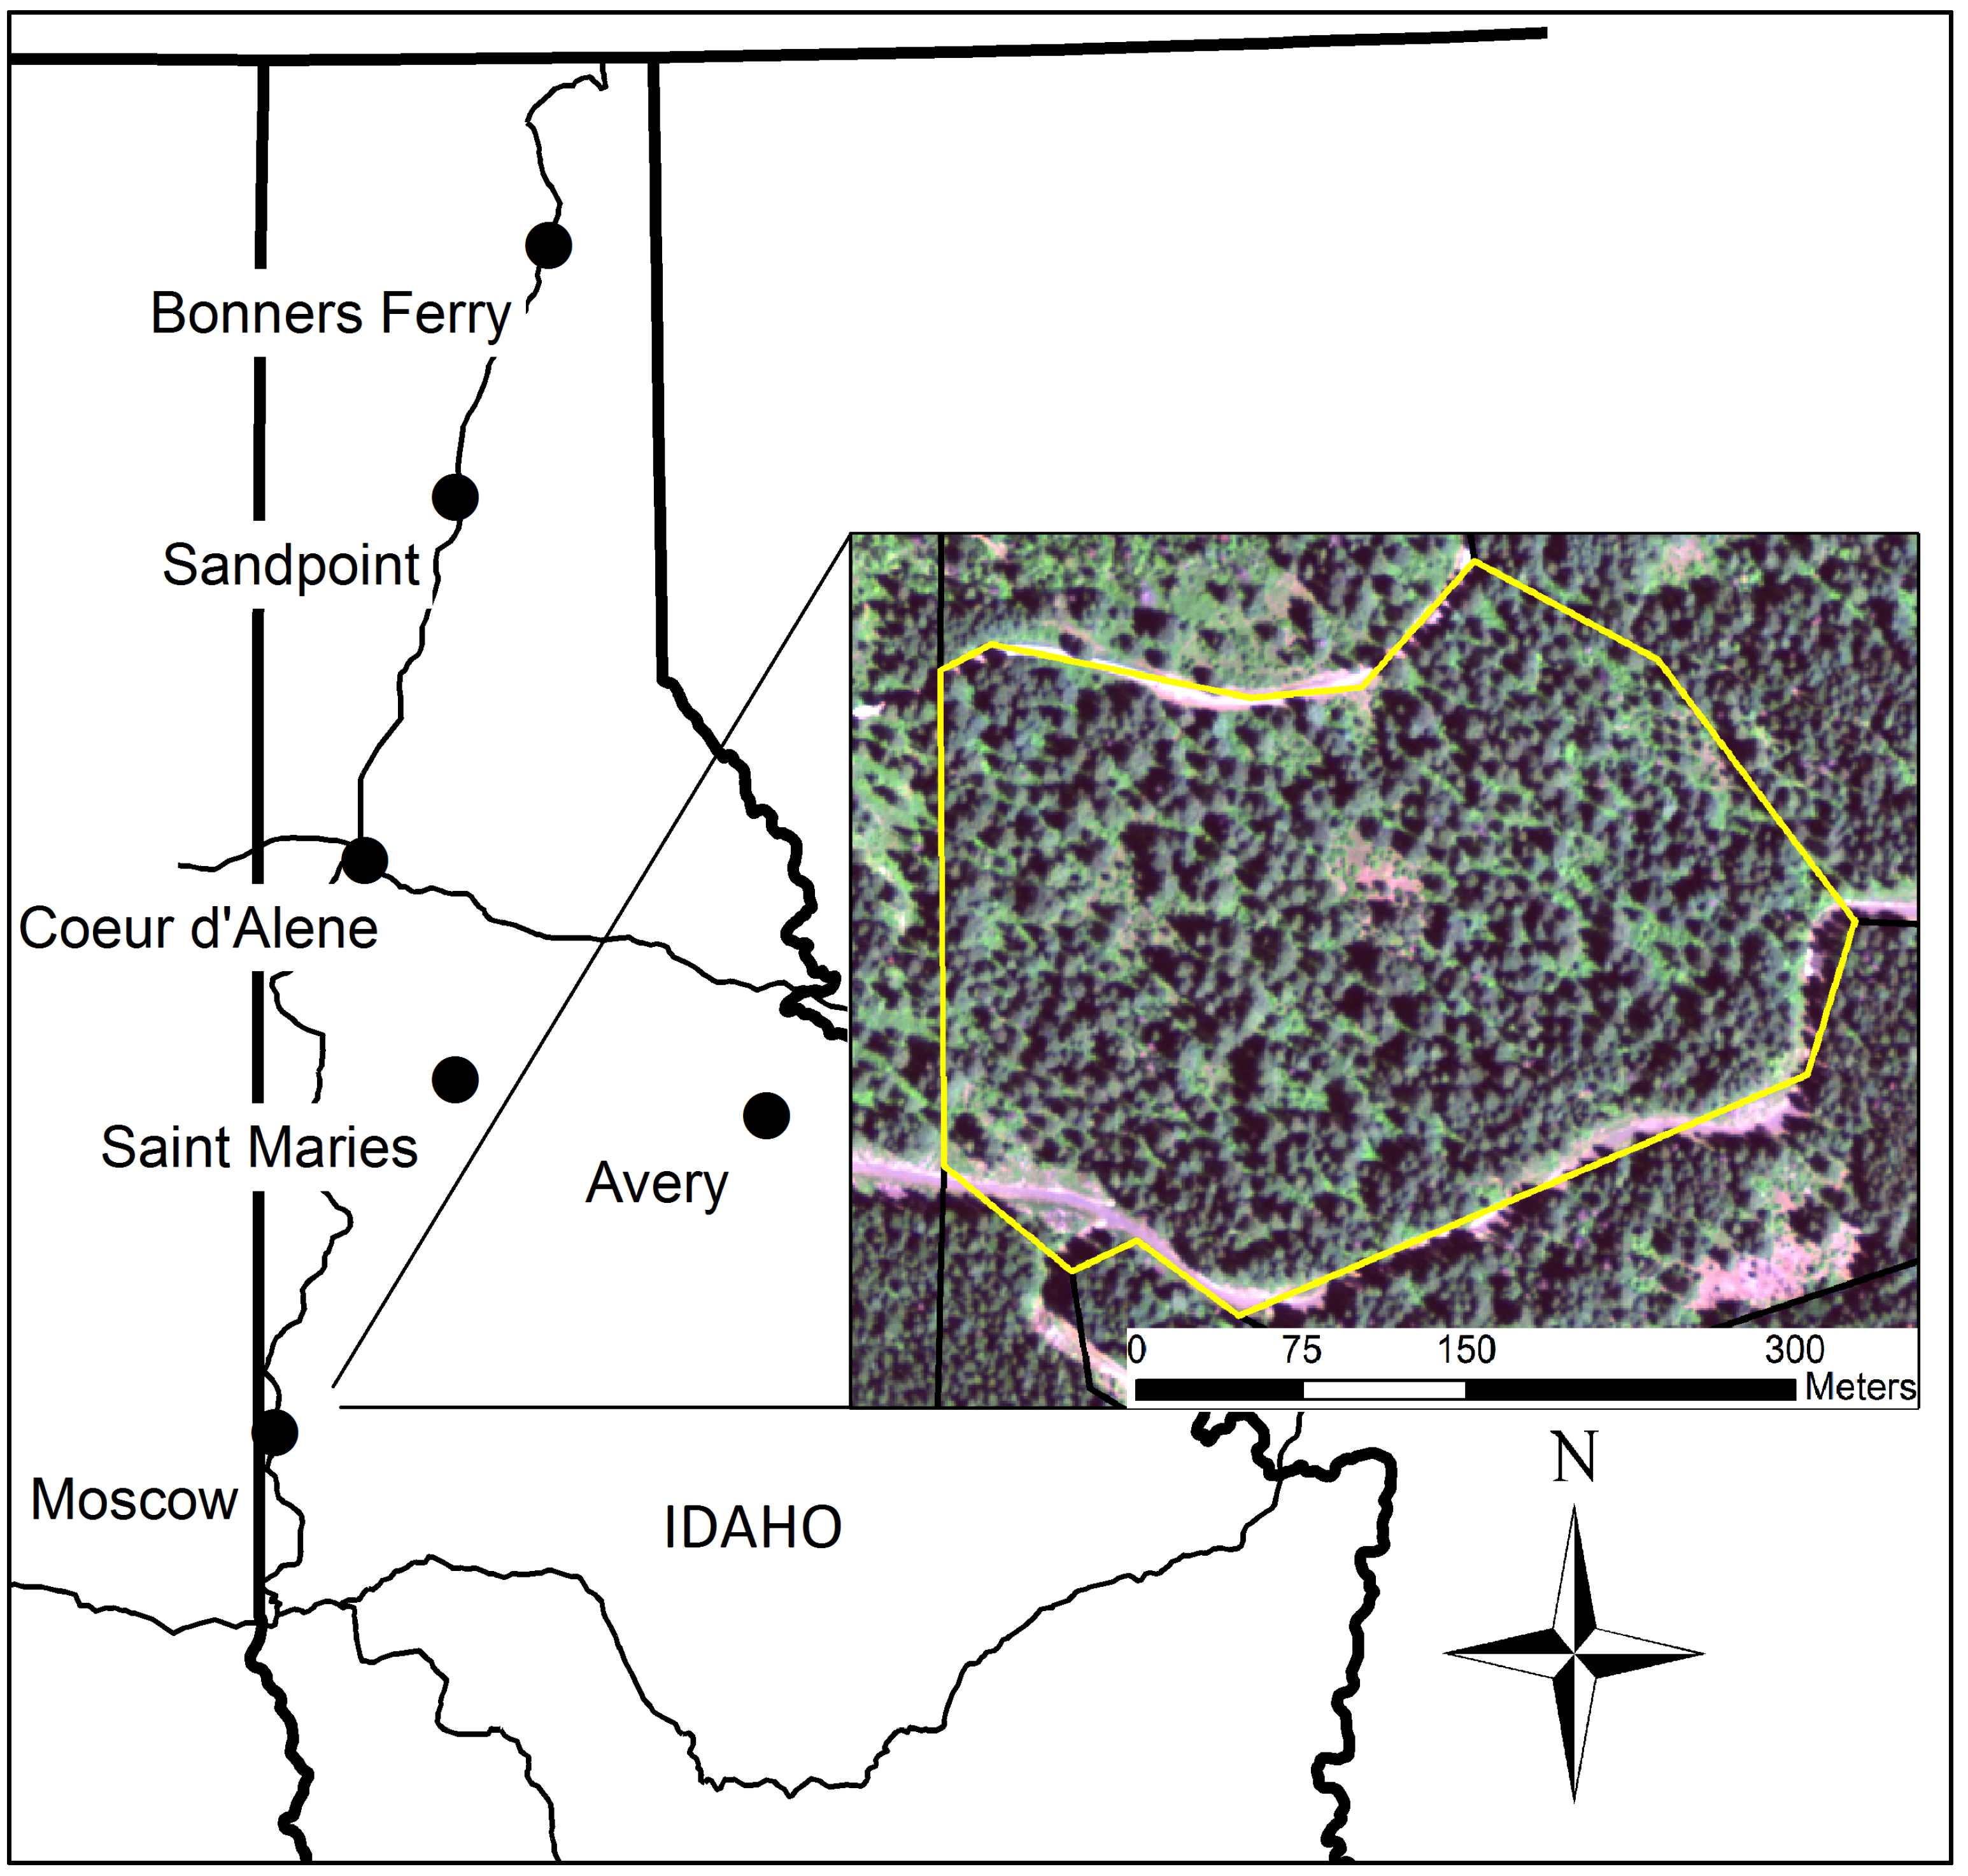
Douglas-fir (
Pseudotsuga menziesii var.
glauca Franco) is one of the predominant species of the forests in the interior Pacific Northwest [
23]. The water stored in standing timber is progressively reduced by as much as 50% in sapwood during the summer season, relative to the reduced winter draw down or reduction of sapwood moisture content [
24,
25]. The relationship between reduced moisture content in the sapwood of felled timber and the ratio of stem W-V is not well understood [
26,
27,
28]. Log buyers and land appraisers are challenged with accurately establishing the value of standing timber; but either stumpage or mill-delivered log values must incorporate changes in order to value the result of felling, processing, and delivery practices. Improved knowledge of the uncertainties in mapping moisture loss within softwood sawlogs with respect to current operational harvesting practices is needed to better understand potential changes to scaled product and ultimately profit margin.
The objective of this study was to determine the effects of bole size, harvesting method, and environmental factors on moisture content of felled Douglas-fir sawlogs and the subsequent effect on sawlog W-V relationships. We hypothesized that stem size and harvest system would affect sawlog moisture content. Specifically, that smaller stems and stem retaining limbs would lose more moisture than larger stems and stems without limbs. In keeping with the concept of seasonal bole water storage and draw-down [
13,
29], we also hypothesized that stemwood moisture content would be significantly affected by relative humidity, atmospheric temperature, and vapor pressure deficit (VPD). Finally, we believed that including environmental factors such as soil moisture and stem ground contact would not significantly affect changes in moisture content. The change in moisture content observed with respect to the measured variables will help determine the impact of moisture loss on W-V relationships and current weight scaling practices.
4. Discussion
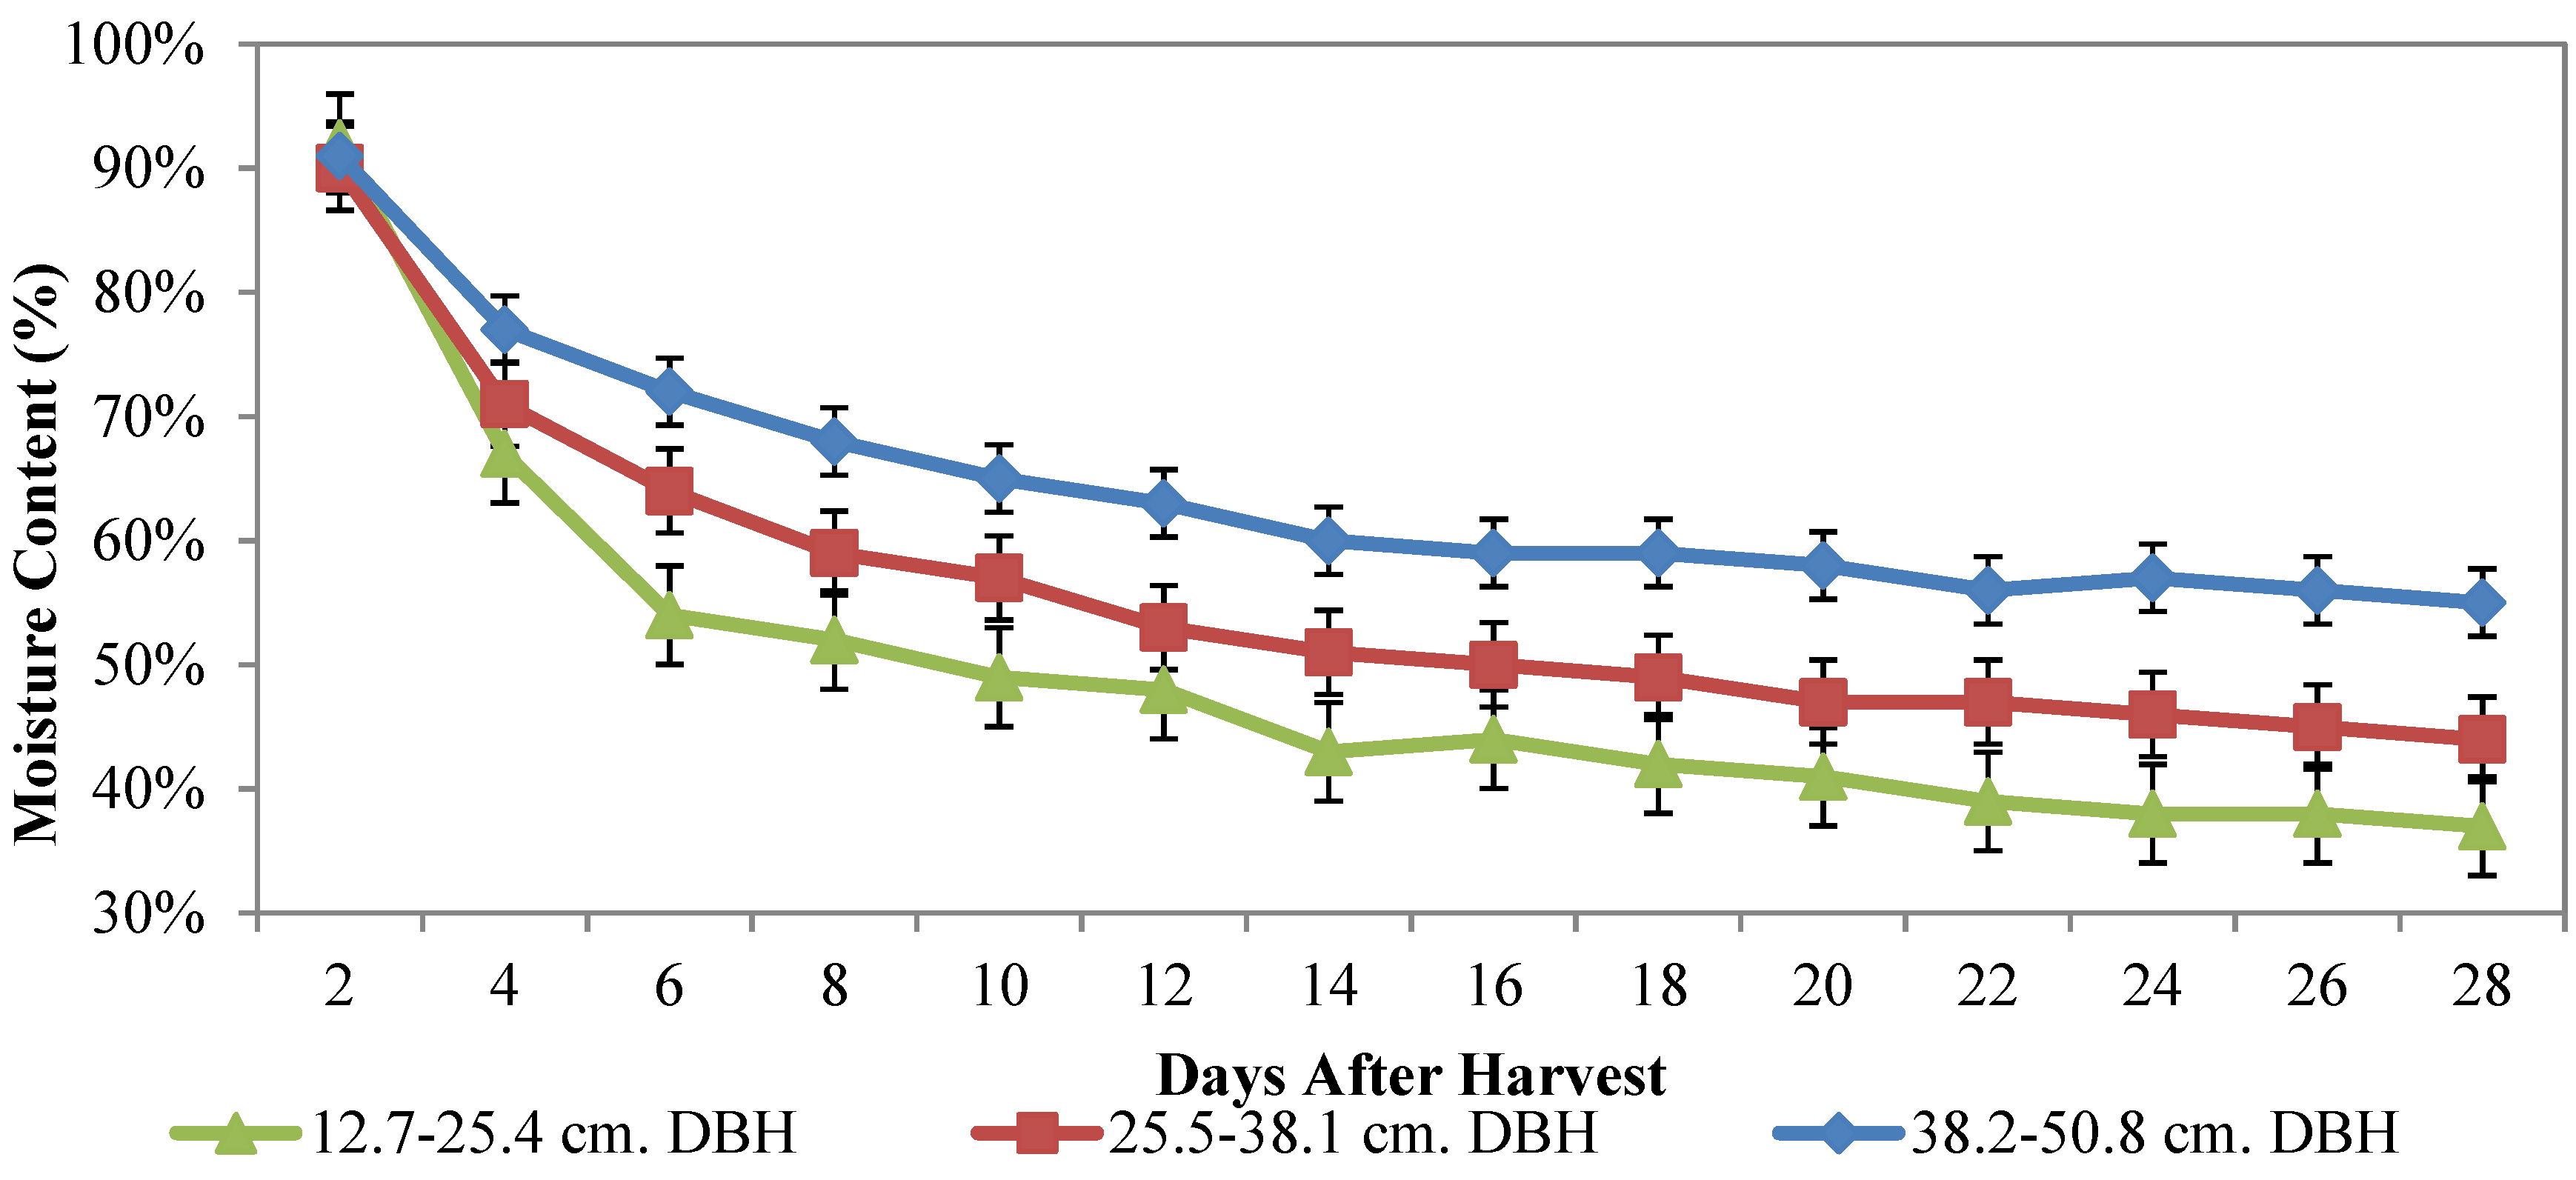
In support of our hypothesis that stem size would affect the moisture content in felled Douglas-fir, we saw significant correlation between stem moisture content and stem size class. The greatest amount of moisture loss was observed in the days immediately following harvesting. In addition, the majority of the moisture lost was contained in the sapwood compared to the heartwood, which makes sense when considering that the majority of each tree’s pre-treatment moisture was located primarily in the sapwood. The best model identified by the AIC test included the variables days since harvest, size class, and VPD. Although the AIC model with the smallest number should be considered the best overall, limited differences between the best two models (<10) supports using the second best model when operational data is available. In accordance with ΔAIC comparisons [
39], the second best AIC model was also evaluated, which included an interaction term between size class and treatment type.
Studies looking at seasonal changes in live tree stem moisture have reported a range of results, including increased sapwood moisture content during the growing season [
27,
44]. In contrast, several studies show increased stem moisture content in winter months [
7,
13]. While the standing, seasonal moisture content of conifers fluctuates by region and species, the moisture content of felled trees exhibits more variability. The large quantity of water lost suggests that even under alternative seasonal conditions, the effect of harvest system and time between harvest and delivery could prove significant when working in a weight scaling system. Tree age and size can affect wood characteristics and in turn water storage capacity [
45].
The effect of stem size on moisture content over time from this study is consistent with conventional fuel moisture models used to characterize 1000 and 10,000 hours fuel moisture content. These rates classify the time needed for moisture to change 1/3 of the way towards equilibrium moisture content. While these rates prove efficient for fire predictions and fuel modeling, they contain general practices that reduce their effectiveness when applied to weight scaling. For example, they do not account for the time a given species has been dead or downed. In addition, the percentage of bark cover is not identified and base moisture contents for 1000 hours fuels are averaged over 7-day periods.
We found that harvesting and processing of sawlogs affects log moisture content, and that the results depend on sawlog diameter. Because moisture content directly affects sawlog weight, the relationship of W-V, and thus log value, would be affected when using weight scaling systems that do not account for these variables. As identified in the results, stems harvested using whole-tree harvesting system with limbs remaining on the stem after harvesting and prior to processing showed greater moisture loss than stems harvested using cut-to-length harvesting, where processing occurs at the stump and logs are limbed and bucked to length immediately. While the harvest method was important in our study, significant moisture loss occurs in each scenario. In practice, operators may modify practices to minimize loss, depending on which system is being deployed and what current environmental conditions are at the time of harvest. For example, in the current study, 38.2–50.8 cm. sawlogs lost an average of 34% moisture content from each log over a one month period after harvest, regardless of harvest system. Assuming a truckload contains 24,500 kilograms, roughly matching state averages and legal highway limits, a 34% moisture content loss would result in 4.16 metric tons of lost water weight or 17% loss in total truckload value if paid using a weight basis system. Current industry weight-to-volume relationships for Intermountain West Douglas-fir during the third seasonal quarter are 5.51 tons/mbf or 2.33 tons m
−3. A 17% loss in weight would shift the ratio to 4.57 tons/mbf or 1.94 tons m
−3. This decrease in weight-to-volume ratio could impact the financial productivity of landowners and contractors. Converting between Scribner board foot to cubic volume was derived from Spelter, 2004 [
46]. While the very dry, warm conditions during the study may have increased moisture loss, moisture loss was present in all felled trees and should be considered operationally.
Altering harvesting practices to change bole moisture content and improve profit margins greatly depends on the scaling unit employed. Losses in moisture content are viewed negatively when associated with transactions based on weight. However, loss in bole moisture content has long been sought out when product transactions are based on mbf or cubic meter volume. Methods such as “sour felling”, which consists of whole tree harvesting followed by transpirational drying to allow moisture loss have been applied in efforts to increase loaded truck net volume per load [
16]. While effective, these practices encourage increased defect in harvested product in the form of checking, insect infestation, and staining [
17]. The increase in volume per load profit can be counteracted in the subsequent loss of usable product; retaining the idea that sour felling is best applied when working with pulpwood or woody biomass where profit margins are limited and defect is less important [
14,
16,
17,
47]. Sour felling practices are also applicable in harvesting systems where floating logs is used for transportation or storage purposes. Decreases in the bole moisture content result in increased buoyancy for periods of storage or transportation. Log storage in water, when properly executed, reduces checking, insect activity, and staining of logs [
48]. Ultimately, the perception of harvesting method and bole size on moisture loss in sawlogs should be considered in direct relation to the unit of volume measure. With western United States scaling practices shifting towards increased transactions through weight scaling, long standing notions of moisture loss in felled sawlogs must be adjusted accordingly in order to maximize profit margin.
Beyond environmental factors present during drying, bark cover and thickness is often assumed to influence drying rates [
49,
50]. However, when investigating moisture content of branches, Boddy, 1983 [
51] did not find drying to be significantly faster in bark-less branches. In contrast, Nicholls and Brackley, 2008 [
52], identified bark as a barrier to moisture loss. This is supported by Defo and Brunette, 2006 [
53], who found that the stem drying rate of aspen is proportional to the percentage of bark absent. Bark is reported to make up 10–25 percent of the over-bark volume and weight of a tree [
54,
55]. Therefore, depending on location and season, bark can prove to be beneficial or costly to the forester or contractors [
56]. However, felled trees lose moisture through either diffusion or transpiration. While the presence of bark would affect the diffusion process, transpiration would be unaffected. In contrast, remaining tree foliage would be affected by transpiration. Therefore, if stem moisture loss is dominated by transpiration then the effects of bark coverage may go unnoticed. Further investigation concerning the pathway of stem moisture loss could help quantify the importance of bark on stem moisture loss. The simulated processing techniques for the current study were completed using chainsaws as opposed to machinery, leaving the majority of the stem bark intact. This alteration from expected seasonal and operational bark loss from machine processing limits the understanding of bark influence on moisture loss in this study.
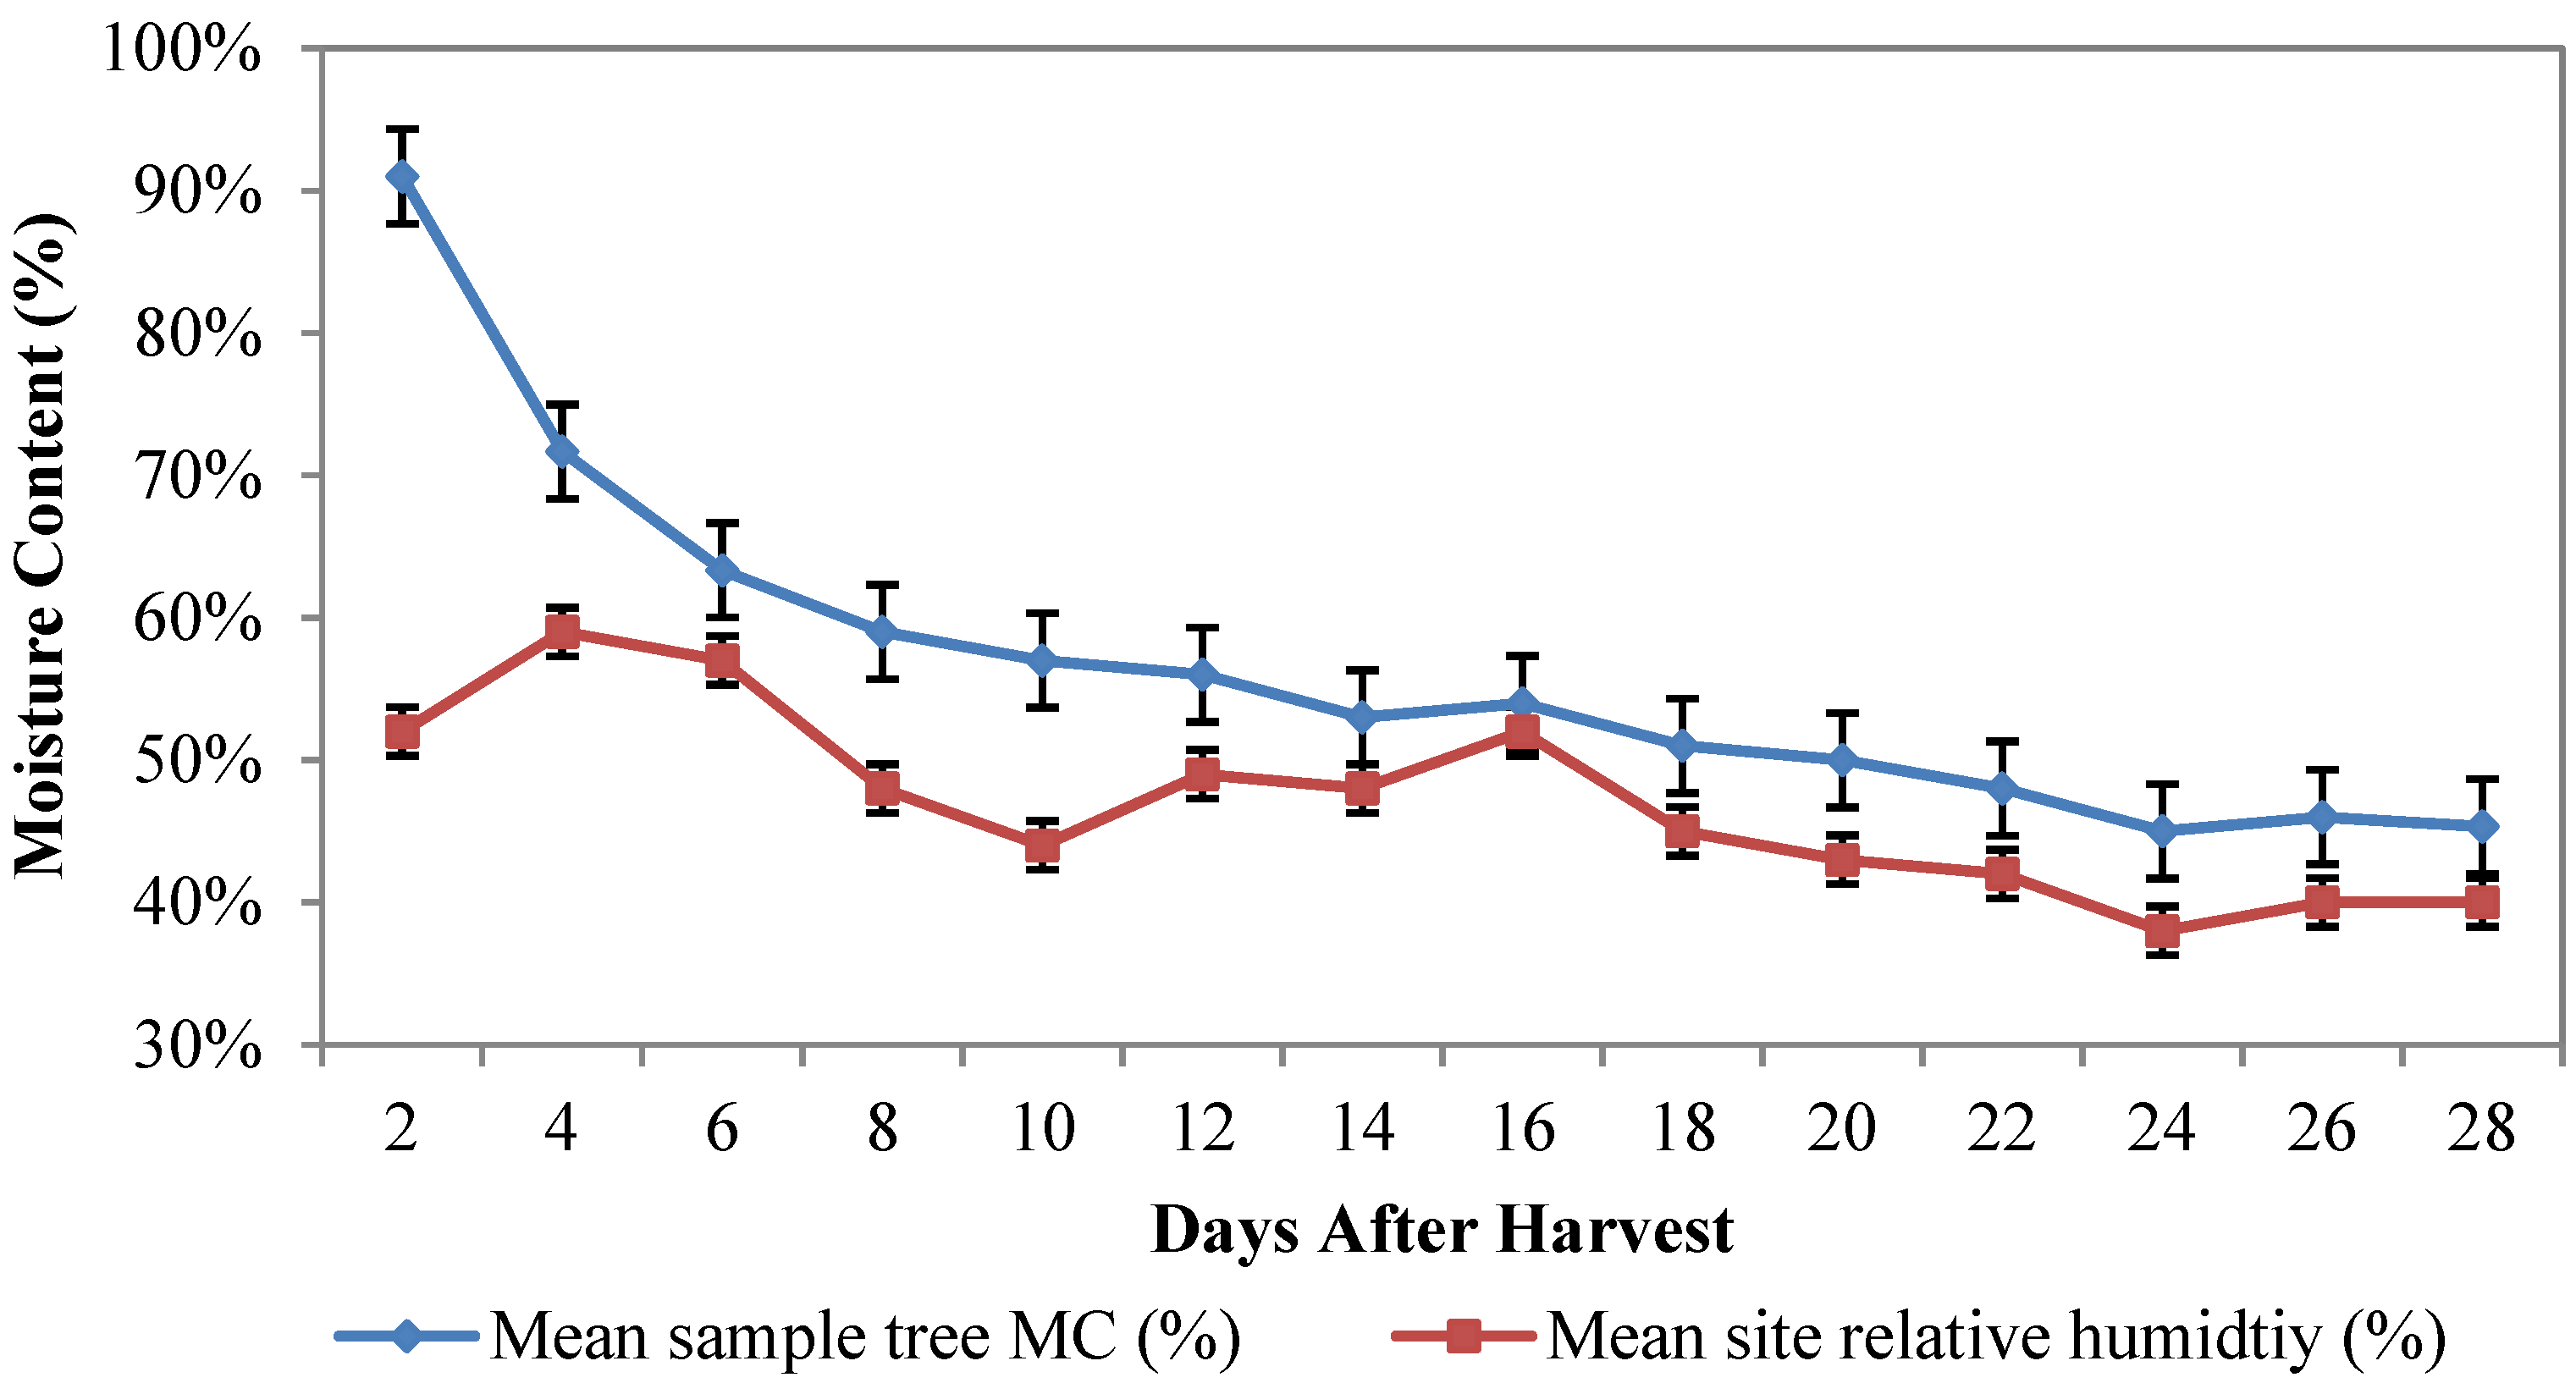
While the species characteristics are relevant in mapping stem moisture loss rates, local environmental conditions drive changes to solid wood moisture content. The combination of low relative humidity, high mean daily temperatures, and limited precipitation on the southern aspect provided an extreme setting for moisture loss. The long-term effect of seasonal relative humidity in a region will cause non-living wood to fluctuate with a delayed lag time until equilibrium with the environment is reached. The rate of drying increases with the difference between relative humidity and stem moisture content at the time of harvesting. In order for foresters and contractors to understand and adapt to the variability in sawlog moisture content when working with weight scaling systems in mountainous terrain, sawlog size, harvesting method, and present atmospheric conditions must be considered.

 ,
, 


