Article

Seasonal and Depth Dynamics of Soil Moisture Affect Trees on the Tibetan Plateau

1
College of Geography and Environmental Science, Northwest Normal University, No. 967, Anning East Road, Lanzhou 730070, China
2
Key Laboratory of Resource Environment and Sustainable Development of Oasis, Gansu Province, Northwest Normal University, Lanzhou 730070, China
*
Author to whom correspondence should be addressed.
Forests 2024, 15(5), 752; https://doi.org/10.3390/f15050752
Submission received: 24 March 2024 / Revised: 21 April 2024 / Accepted: 23 April 2024 / Published: 25 April 2024
(This article belongs to the Section Forest Soil)

Abstract

:
The soil moisture (SM) influences tree growth with climate change. However, the spatial and temporal dynamics of tree water use strategies in climate-sensitive areas remain uncertain. Therefore, we collected the tree-ring oxygen isotope (δ18OTR) chronologies and divided the wet–dry gradients according to the precipitation on the Tibetan Plateau (TP). Further, the relationship between the δ18OTR and environmental factors was analyzed across different gradients. We found the following: (1) The SM during the growing season was the most important factor for δ18OTR. (2) The response of the δ18OTR to the SM had a lag in arid areas than in humid areas. (3) Trees absorbed the SM on the surface in humid areas (r = −0.49 to −0.41, p < 0.01), while trees absorbed the SM from deep in the soil in arid areas (r = −0.48 to −0.29, p < 0.01). The results demonstrated that trees were better able to cope with drought stress in arid regions because they used more stable deep soil water than in humid regions. Therefore, the findings will provide a scientific basis for water use of trees using the δ18OTR in complex environmental contexts. Trees with single water use strategies should be given more attention to keep ecosystems healthy.

1. Introduction

Climate change has profound impacts on forest ecosystems [1,2]. Tree growth is mainly influenced by temperature, precipitation, and their interactions [3,4]. It is well known that tree growth in arid regions is controlled by soil moisture (SM), while in humid regions, it is mainly influenced by temperature [5]. Therefore, there is variability in the environmental sensitivity of trees in different climatic contexts.
The SM is the main source to sustain plant growth [6]. It plays a vital role in maintaining ecosystem health. The SM varies with soil seasons and depths [7]. There are also differences in the uptake strategies of SM by trees in different moisture environments [8]. Some studies have found that the SM plays a role in tree growth on the Tibetan Plateau (TP) [9,10], especially during the growing season [11]. Unfortunately, it is not practical to collect soil samples when conducting large-scale studies, making it exceptionally difficult to use measured soil data to study tree water use strategies. However, tree-ring oxygen isotope (δ18OTR) is now used as an indicator to study long-term changes in the SM because of their stability [12]. For example, the SM for nearly a century has been reconstructed using the δ18OTR in the Western Himalayas [13].
The δ18OTR is jointly controlled by the coupled processes of transpiration and water uptake in tree root systems [14]. Therefore, the δ18OTR is an important indicator that can record the response of trees to seasonal climate change [15]. A complex set of δ18OTR formation processes are influenced by external climatic factors [16,17]. Trees absorb precipitation entering the soil and then preserve the precipitation signal in the δ18OTR through transpiration fractionation in the leaves [18,19].
The precipitation in monsoon areas has significant seasonal variations, and similar variations occur in the SM [20,21]. Thus, the δ18O of SM varies at different depths and seasons. The δ18OTR stores SM signals through complex physiological mechanisms [22]. For example, it has been found that the δ18O of Pinus tabulaeformis in the East Asian monsoon (EAM) zone is controlled by the SM [23]. And it has been shown that trees used the shallow SM in the wet season and deep water in the dry season in the EAM region [24].
The TP has been found to have a trend of increasing temperatures [25] and decreasing precipitation in recent years due to shifts in the Asian summer monsoons (ASMs) [26,27]. The δ18OTR was consequently affected in this region [28,29]. At present, there are many articles on the use of δ18OTR to study climate reconstruction and the interpretation of physiological mechanism on the TP [30,31,32]. There are few studies that have been conducted to use the δ18OTR to study water use strategies. Therefore, the purpose of this paper is to explore three main questions on the TP: (1) What are the seasonal dynamics of different gradients of SM use? (2) Is there a difference in the depth of water used by trees at different gradients? (3) Are the seasons as well as soil depths of different gradients of trees water use coupled?

2. Materials and Methods

2.1. Study Areas

As shown in Figure 1, we selected a total of six sampling points. The Delingha region (DE) is in the northeastern part of the TP. The Ganesh (GA) and Wache (WA) regions are in the southern of the TP. The Manali (MA) and Jageshwar (JA) regions are in the southwestern part of the TP. And the Karakorun region (KA) is in the west of the TP. The JA is the wettest region, and the DE is the driest region in our study (Figure 2). The difference in the annual total precipitation between these two regions is 1311 mm. On the basis of the annual total precipitation, the six regions are classified into humid areas (JA, WA, and GA regions) and arid areas (MA, KA, and DE regions).

2.2. Tree-Ring Isotope Data

The δ18OTR data were downloaded from the NOAA Paleoclimatology Datasets (https://www.ncei.noaa.gov, accessed on 26 August 2023). Table 1 provides specific information on the six sampling sites. The experimental methods were checked when downloading data to ensure that the same experimental methods did not affect the accuracy of the study [33]. Some scholars have already found that elevation and age do not affect the δ18OTR [34,35].

2.3. Meteorological Data

The maximum (Tmax), mean(T), and minimum temperatures (Tmin), precipitation (PRCP), and the Palmer drought severity index (PDSI) from Climate Explorer (http://climexp.knmi.nl/start.cgi, accessed on 28 August 2023) were calculated (Figure 2). These were monthly scale data for the subsequent study. The vapor pressure deficit (VPD) was calculated as in Equation (1) [39]. And relative humidity (RH) was calculated as in Equations (2) and (3) [40].
VPD = a c t u a l   w a t e r   v a p o u r   p r e s s u r e = s a t u r a t e d   w a t e r   v a p o u r   p r e s s u r e = e 0 × 10 7.5 T T + 237.3 actual   water   vapor   pressure
RH = e e s a t × 100
e s a t = 6.108 × exp ( 17.27 × T / T + 273.3
where e0 = 6.11 hpa.

2.4. The SM Data

The SM data was obtained from the Global Land Data Assimilation System (http://Idas.gsfc.nasa.gov/gldas, accessed on 29 August 2023). It spans the period of 1948–2015, with a spatial resolution of 0.25° × 0.25°. Due to its good temporal and spatial resolutions, it has been used for a large number of studies in recent years. The SM data of three depths of 0−100 cm were selected. We transform the SM data (unit: kg/m2) into volumetric water content (VWC, unit: m3/m3) according to Equation (4).
VWC = k g m 2 × m 3 1000 k g × 1000 m m 1 m × 1 t h i c k n e s s   o f   l a y e r   i n   m m

2.5. Data Analysis

Pearson’s correlation analysis as well as partial correlation analysis were used to study the main climatic factors affecting δ18OTR. The variability in the δ18OTR chronology was tested using one-way analysis of variance (ANOVA) in different regions. Meanwhile, the spatial correlation analysis of the δ18OTR and the SM was performed using MATLAB 2023.

3. Results

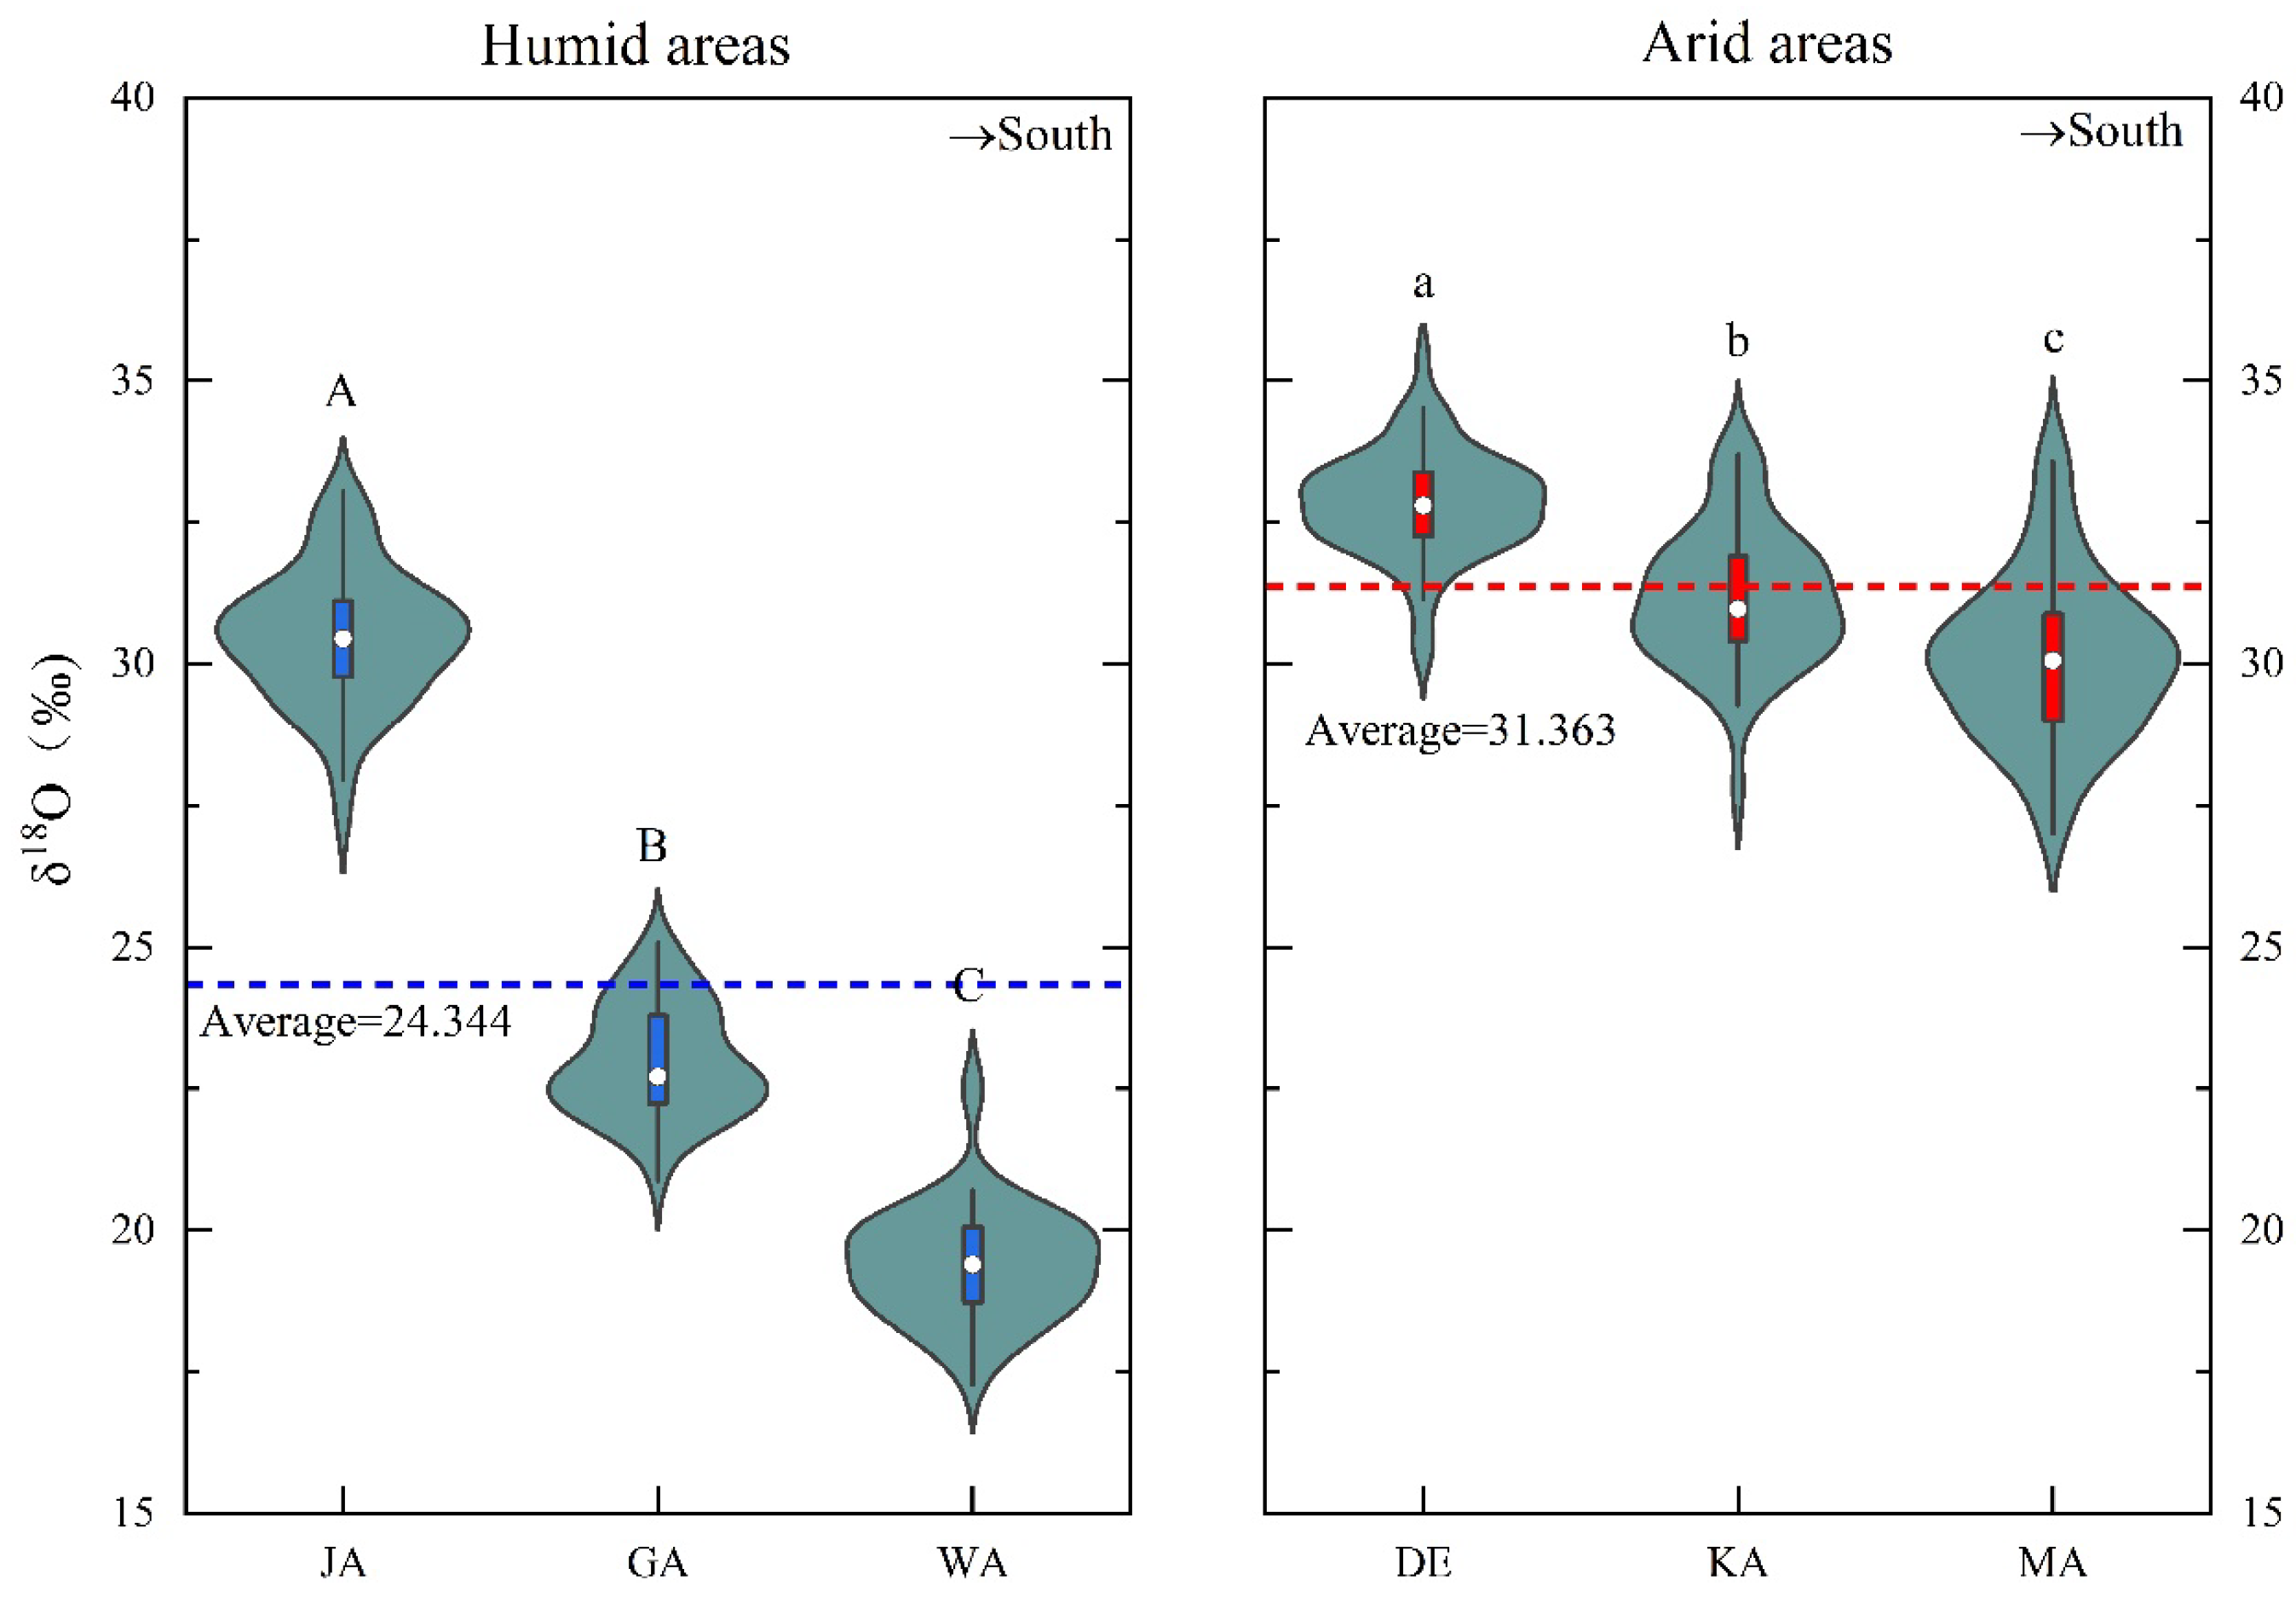
3.1. The Spatial and Temporal Patterns of the δ18OTR

Figure 3 shows that the values of the δ18OTR in the arid areas as a whole (31.36‰) were larger than those in the humid areas (24.34‰) on the TP. But the dynamics of δ18OTR showed inconsistent spatial and temporal variation characteristics across wet and dry gradients. In addition, the values of δ18OTR showed an increasing trend in all regions except the DE region. And the increasing trend was overall more pronounced in the humid areas.
The spatial dynamics of the δ18OTR showed that, as the climate becomes wetter, the values of the δ18OTR declined (Figure 4). The δ18OTR values are the highest (DE, 32.90‰) on the northern of the TP. On the contrary, the δ18OTR values are the lowest (WA, 19.40‰) on the southern of the TP.

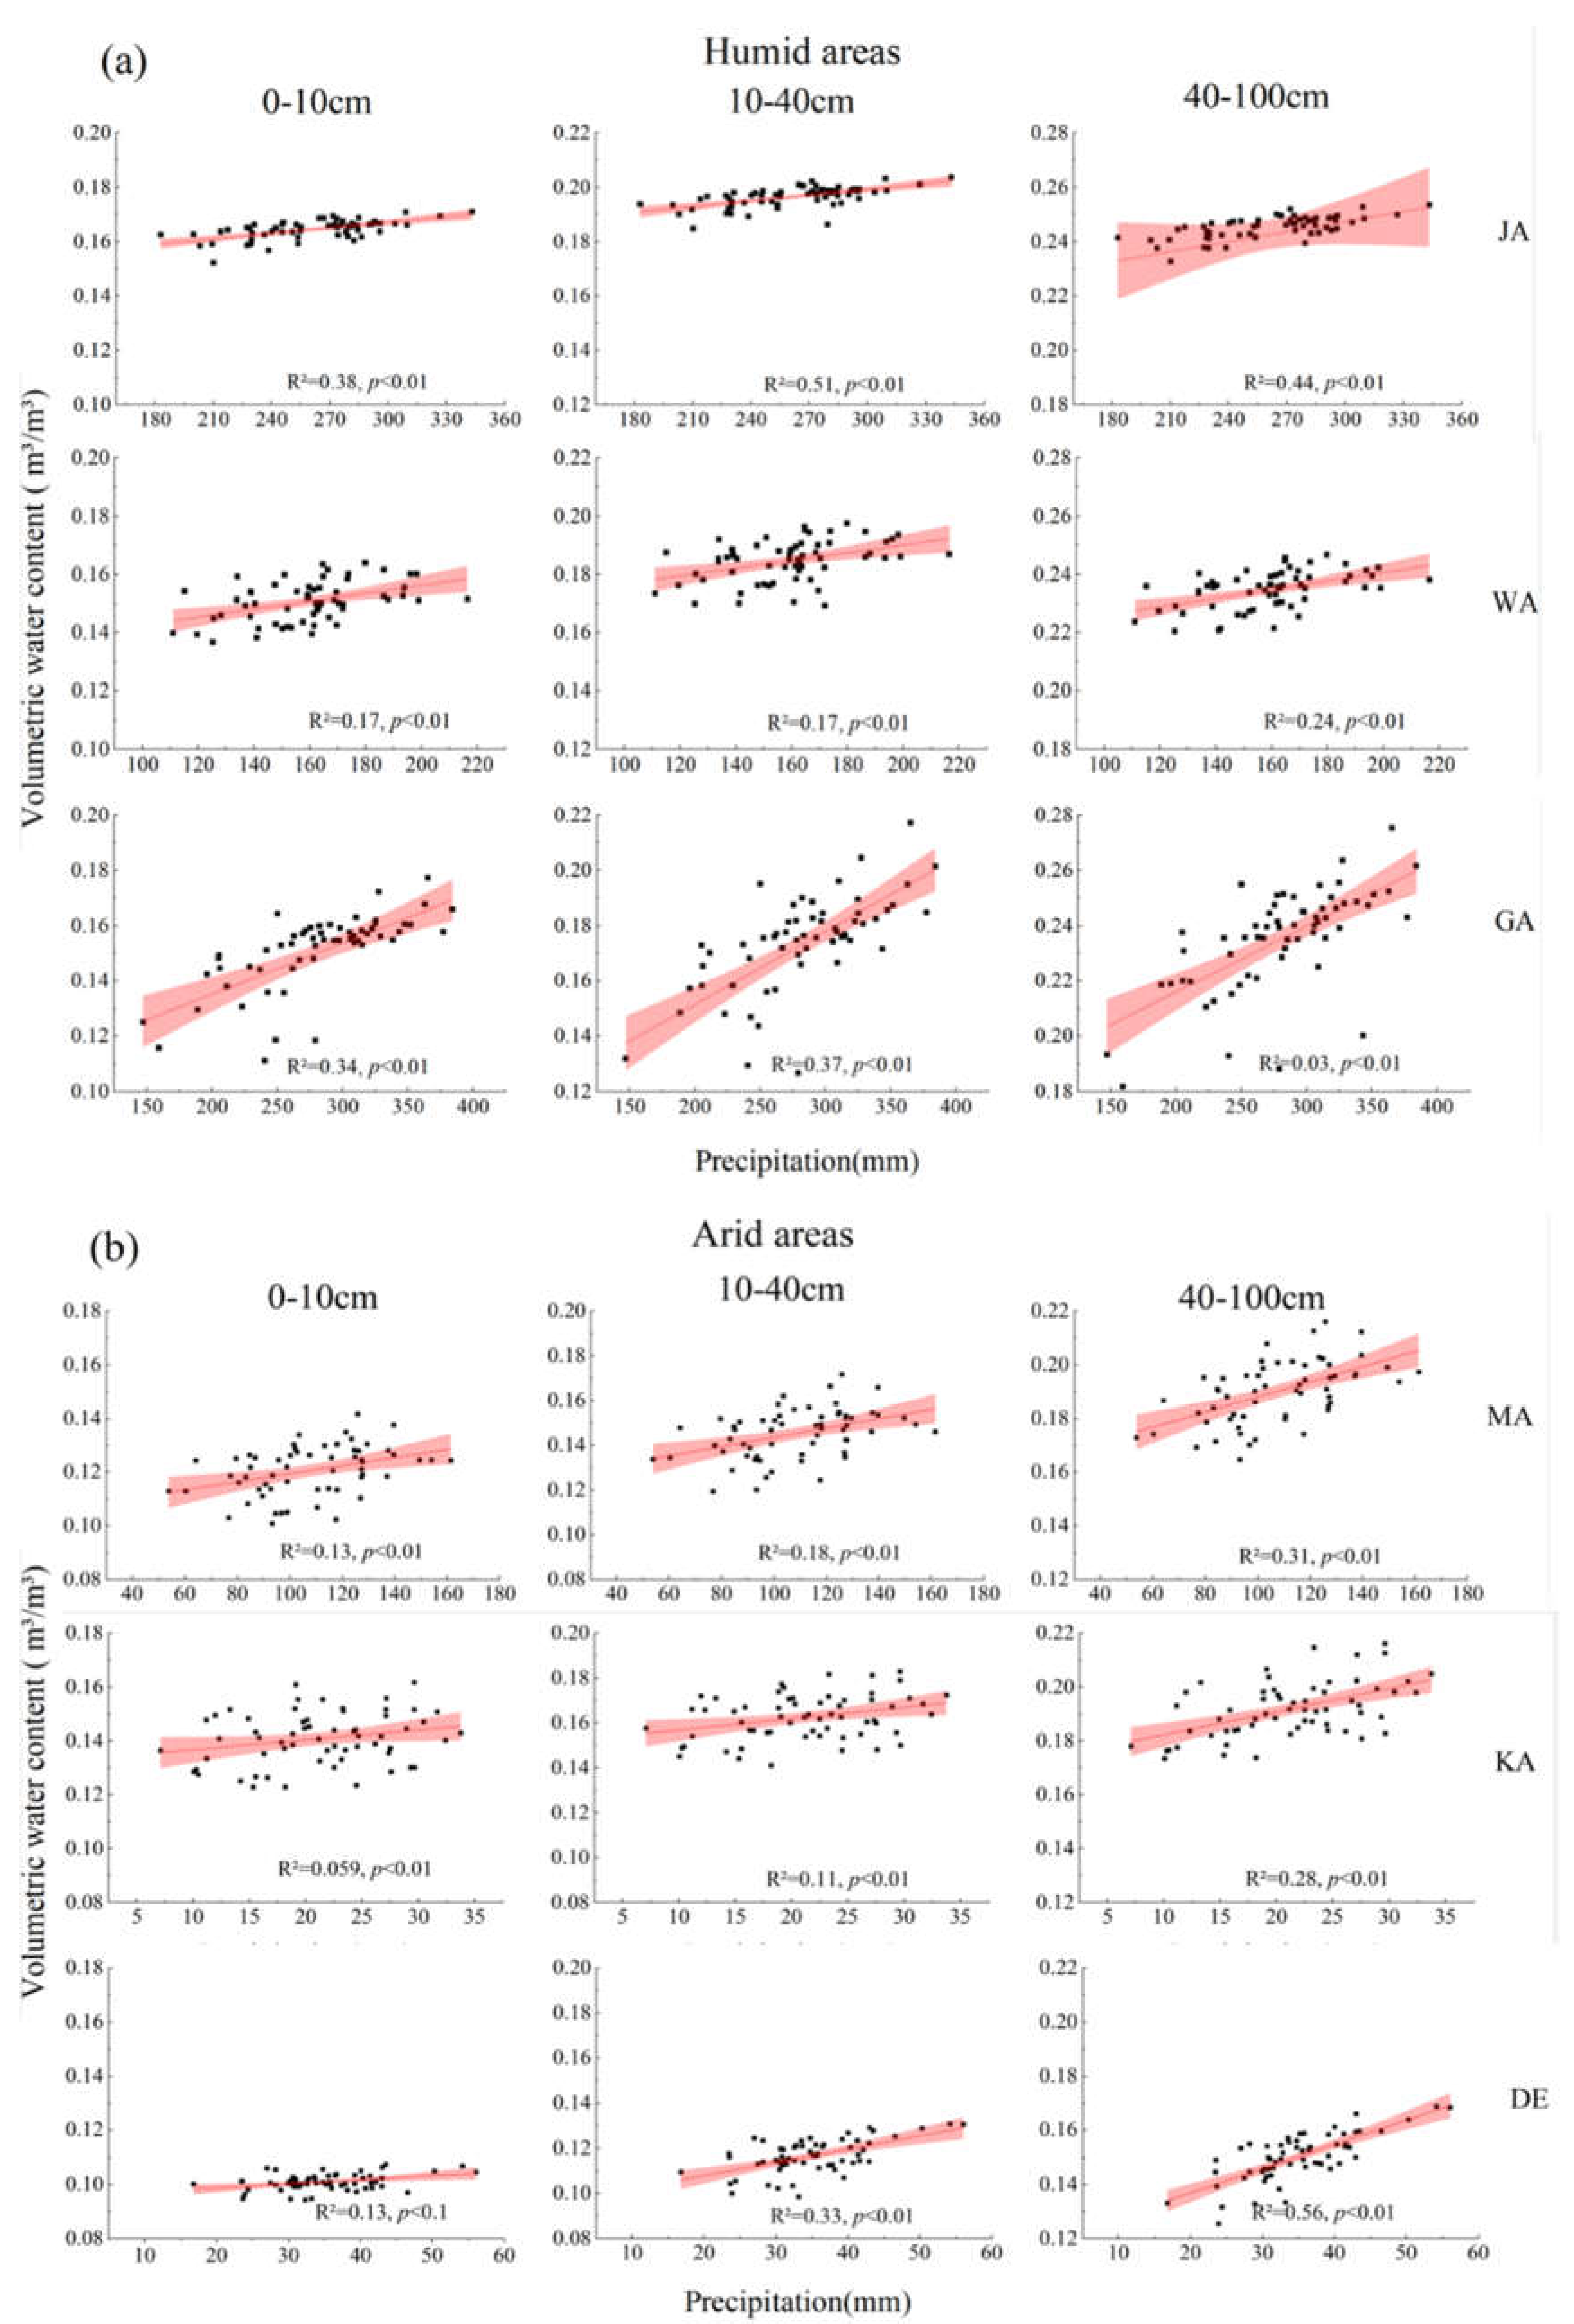
3.2. The SM Dynamics at Different Depth Gradients

Figure 5 shows that the SM at different depths exhibits inconsistent variability characteristics on the TP (Figure 5). Specifically, the SM increased with a deeper soil depth (Figure 5a). And the SM in the DE region is much lower than in other regions.
Figure 5b shows that the seasonal dynamics of SM are more pronounced in humid areas. The high values of SM occur from June to September in humid areas (VMCJun–Sep > 45%). However, this phenomenon does not occur in arid areas. In the MA region, the high values of SM occur from June to September (VMCJun–Sep > 35%). The high values of VMC occur from April to June (VMCApr–Jun > 32%) in the KA region. But no seasonal dynamic was observed in the SM in the driest DE region.
The wettest JA region showed a decreasing trend for the SM, while the driest DE region showed an increasing trend for the SM (Figure 6). Overall, the surface SM increased in the wetter areas, while middle and deeper SM decreased. In arid areas, the SM decreased by 40–100 cm and increased by 0–40 cm. Meanwhile, it was found that the SM in humid areas fitted better with precipitation (Figure 7).

3.3. The Response of δ18OTR to Climatic and SM Factors

It is revealed that the overall δ18OTR responded negatively to PDSI, PRCP, and RH (Figure 8). The δ18OTR is positively correlated with T, Tmax, Tmin, and VPD in study areas (Figure 8). And δ18OTR in the humid areas are mainly influenced by climatic factors during the middle of the growing season in the humid areas and during the late growing season in the arid areas.
The response of the δ18OTR to the SM in terms of season and depth were further investigated (Figure 9). The correlation between the δ18OTR and the SM was greater with SM0–10 cm and SM10–40 cm cm in July in humid areas. However, the δ18OTR was significantly negatively correlated with SM10–40 cm and SM40–100 cm in September in arid areas. The seasonal response of the δ18OTR to the SM lagged in arid areas. Specifically, the δ18OTR was significantly negatively correlated with SM at 0–40 cm (rJun–Aug = −0.49 to −0.41, p < 0.05) in the JA and WA regions, while it was negatively correlated with the SM at all depths (rJun–Aug = −0.44 to −0.26, p < 0.05) in the WA region. However, the δ18OTR was significantly negatively correlated at all depths in the MA region (rJun–Sep = −0.47 to −0.31, p < 0.05), while the δ18OTR was more significantly negatively correlated with SM40–100 cm from July to September (rJun–Sep = −0.48 to −0.29, p < 0.05) in the KA and DE regions.

3.4. The Correlation between δ18OTR and Key Factors during the Growing Season

The δ18OTR and the SM showed high correlations during the growing season (June–September). Therefore, the partial correlation analysis was further used to study the most important climatic factors affecting the δ18OTR (Table 2). The results found that δ18OTR was significantly negatively correlated with the SM at 0–10 cm in the JA region when VPD and RH were controlled. And the δ18OTR was significantly correlated with the SM at 0–10 and 10–40 cm in the WA and GA regions. The δ18OTR was highly significantly negatively correlated with SM at all depths in the MA region when VPD and RH were controlled. However, the δ18OTR was significantly negatively correlated with the SM at 40–100 cm in the KA and DE regions.

3.5. The Spatial Patterns of δ18OTR Response to SM with Soil Depths

The response of the δ18OTR to the SM was generally negatively correlated in the study areas (Figure 10). But the correlation of the δ18OTR to the SM at 40–100 cm is stronger than the correlation to the SM at 0–40 cm (Figure 10). And the responses of the δ18OTR to the SM changed from negative to positive as the soil depth deepened in the southern and northeastern parts of the TP (Figure 10). The correlation decreases from the JA region to the DLH region with the SM at 0–10 cm. That means that, as the climate becomes drier, the correlation decreases between the δ18OTR and the SM at 0–40 cm. However, the positive responses of the δ18OTR to the SM at 40–100 cm increase in the DE region.

4. Discussion

4.1. The δ18OTR Records Soil Water Use by Tree Growth on the TP

The temperature has shown a continuous warming trend [41], and precipitation has increased in the eastern and western parts [42,43] and decreased in the southwestern part of the TP since the 1960s [44]. Trees will adopt multiple water use strategies to increase the chances of survival in this context. It has been shown that the δ18OTR could reflect the water uptake of seasons and the depths in trees [19]. This means that the δ18OTR can record soil water δ18O information for different seasons and depths [31].
The δ18OTR is mainly controlled by the coupled processes of source water and external climate [15]. In our results, the δ18OTR was more sensitive to the SM than to temperature during the growing season (Figure 8 and Figure 9). The δ18OTR is derived from the SM, but the δ18O of SM varies with soil depths [45]. The isotopic signals in the SM are preserved in the δ18OTR through the xylem during the growing season [46]. Therefore, the δ18OTR can be used as one of the indicators of SM use in trees.
At the same time, the values of the δ18OTR were greater in arid areas (Figure 3). Lower SM leads to an increase in the ratio of internal leaf CO2 (Ci) to atmospheric CO2(Ca) in leaves, which enhances the evaporative enrichment of leaf water in arid areas [47]. Then, the tree root system absorbs heavy-source water, and the δ18OTR is increased further [15]. During the conversion of sucrose produced by tree photosynthesis to cellulose, it undergoes a partial oxygen isotope signal exchange in the source water [48]. In other words, the δ18OTR keeps the mixed signal of source water and leaf evaporation [49]. These two processes result in a higher δ18OTR in arid areas. On the contrary, the decrease in the δ18OTR is due to the reduced evaporation and makes leaf water enrichment weaker in humid areas [50].

4.2. Seasonal Use Strategies of SM for Trees across Wet and Dry Gradients

In climate-sensitive areas, the SM is critical for tree growth. The life history stage [24], season [51], tree species [52], ability of plant access to water [53], and the amount of recent rainfall [14] all have an impact on tree water use strategies. In our study, the δ18OTR was significantly correlated with the SM during the growing season, but the δ18OTR responded to the SM later in arid areas (Figure 9).
The δ18OTR is affected by the SM from June to August in humid areas (Figure 9). Because it is influenced by the ASM and receives adequate precipitation from it in these months, which further affects the δ18OTR. These results suggest that monsoon precipitation has a significant effect on tree growth (Figure 8). We believe that precipitation signals in the soil from the ASM are absorbed by tree root systems. Finally, the δ18O of precipitation is retained through the δ18OTR in humid areas. Our results have been confirmed in other studies on the TP [31,32].
The δ18OTR are affected by the SM from July to September in arid areas (Figure 9). It is worth noting that the response of the δ18OTR to the SM lagged in arid areas. We believe this is related to the extended growing season of trees on the TP [36]. However, there are significant differences within the arid areas. The δ18OTR in the MA region was controlled by summer monsoon precipitation and RH [54]. And trees mainly absorb winter snowfall in the KA region, which provides a stable water source [37]. Therefore, the correlation between the δ18OTR and the summer SM is not high in the KA region. In the DE region, the δ18OTR was controlled by the SM from May to September [53], and this observation is consistent with that of our study.
The summer precipitation has a greater effect on the SM in the southeastern part of the TP [38]. And the δ18OTR was significantly negatively correlated with precipitation during the growing season in Southern Mexico [55], Northwestern Tibetan Plateau [56], and Ordos Plateau [57]. This is because summer precipitation replenishes plant water supplies [20]. Therefore, the correlation between the SM and precipitation is higher in the southeastern part of the TP than in its northwestern part.

4.3. Depth Use Strategies of SM for Trees across Wet and Dry Gradients

As a typical climate-sensitive area, the TP has a very high spatial variability in precipitation [58]. As a result, trees flexibly adjust their water use strategies to ensure growth. Trees use the deep SM preferentially in arid areas [44], whereas they use the shallow SM in humid areas [59]. This is consistent with our results. However, the water use strategies for trees in complex environments deserve further research.
The δ18OTR was significantly negatively correlated with the SM at 0–10 cm in the JA region. The δ18OTR were significantly negatively correlated with the SM at 0–10 and 10–40 cm after the VPD or RH was controlled in the WA and GA regions (Table 2). This suggests that trees tended to take up the SM in the surface and middle layers in humid areas. Meanwhile, the surface soil can provide nutrients to the trees [4,60]. In other words, trees preferentially absorb SM on the surface in humid areas.
The significant negative correlation between the δ18OTR and the SM at 40–100 cm in the KA and DE regions was revealed in arid areas (Table 2). In arid areas, capillary water induces trees to form deeper root systems to absorb deep soil water and groundwater to meet higher transpiration needs during the dry season [61,62]. The highly significant negative correlation between the δ18OTR and the SM at all depths in the MA region can be explained by the fact that some SM isotope signals are masked by strong evaporation [63,64]. On the other hand, the “bimodal” precipitation pattern may encourage trees to develop a well-developed root system in this region.
Trees have different coping strategies to climate extremes [60,65]. Trees using a single water strategy will bear a greater risk of death [27,66]. The chances of facing drought stress are increasing on the TP [67]. Trees face greater challenges for survival in humid areas because of the single use of the shallow SM. We argue for the better monitoring of tree growth in the humid regions of this region.

5. Conclusions

In this study, we used the δ18OTR at six sites to investigate whether there are differences in water use strategies of trees across wet and dry gradients on the TP. The results indicated that the SM during the growing season was the main factor influencing tree growth. Trees mainly absorbed the shallow SM in the humid areas, whereas they mainly absorbed the deep SM in the arid areas. And the response of the δ18OTR to the SM in the arid areas lagged behind that in the humid areas. Our study provides a theoretical basis for the further use of δ18OTR to study how tree growth adapts to the SM changes. We argue that shallow soil water uptake is a threat to tree growth in the context of warming on the TP. Therefore, the monitoring of tree growth in the southeastern part of the region should be conducted further.

Author Contributions

Q.L., formal analysis, data curation, visualization, and writing—original draft preparation. L.J., funding acquisition. R.X., writing—original draft. X.C., investigation. P.Z., editing. X.W., supervision. X.Y., investigation. All authors have read and agreed to the published version of the manuscript.

Funding

This research was supported by National Natural Science Foundation of China (No. 42371038), Basic Research Innovation Group Project of Gansu Province (No. 22JR5RA129), and the 2022 Major Scientific Research Project Cultivation Plan of Northwest Normal University (NWNU-LKZD2022-04). We also thank the anonymous referees for their helpful comments on the manuscript.

Data Availability Statement

The data presented are available on request from the corresponding author of this study.

Conflicts of Interest

The authors declare no conflicts of interest.

References

  1. Keyimu, M.; Li, Z.; Liu, G.; Fu, B.; Fan, Z.; Wang, X.; Halik, U. Tree-ring based minimum temperature reconstruction on the southeastern Tibetan Plateau. Quat. Sci. Rev. 2021, 251, 106712. [Google Scholar] [CrossRef]
  2. Wang, J.; Taylor, A.R.; D’Orangeville, L. Warming-induced tree growth may help offset increasing disturbance across the Canadian boreal forest. Proc. Natl. Acad. Sci. USA 2023, 120, e2212780120. [Google Scholar] [CrossRef] [PubMed]
  3. Seddon, A.W.; Macias-Fauria, M.; Long, P.R.; Benz, D.; Willis, K.J. Sensitivity of global terrestrial ecosystems to climate variability. Nature 2023, 531, 229–232. [Google Scholar] [CrossRef]
  4. Priyadarshini, K.V.R.; Prins, H.H.; Bie, S.; Heitkönig, I.M.; Woodborne, S.; Gort, G.; Kroon, H. Seasonality of hydraulic redistribution by trees to grasses and changes in their water-source use that change tree-grass interactions. Ecohydrology 2016, 9, 218–228. [Google Scholar] [CrossRef]
  5. Amer, A.; Franceschi, E.; Hjazin, A. Structure and Ecosystem Services of Three Common Urban Tree Species in an Arid Climate City. Forests 2023, 14, 671. [Google Scholar] [CrossRef]
  6. Eslaminejad, P.; Heydari, M.; Kakhki, F.V.; Mirab-balou, M.; Omidipour, R.; Muñoz-Rojas, M.; Lucas-Borja, M.E. Plant species and season influence soil physicochemical properties and microbial function in a semi-arid woodland ecosystem. Plant Soil 2020, 456, 43–59. [Google Scholar] [CrossRef]
  7. Ma, J.; Han, J.; Zhang, Y.; Dong, Q.; Lei, N.; Liu, Z.; Du, Y. Temporal stability of soil water content on slope during the rainy season in gully regulation watershed. Environ. Earth Sci. 2020, 79, 173. [Google Scholar] [CrossRef]
  8. Bertrand, G.; Masini, J.; Goldscheider, N.; Meeks, J.; Lavastre, V.; Celle-Jeanton, H.; Hunkeler, D. Determination of spatiotemporal variability of tree water uptake using stable isotopes (δ18O, δ2H) in an alluvial system supplied by a high-altitude watershed, Pfyn forest, Switzerland. Ecohydrology 2014, 7, 319–333. [Google Scholar] [CrossRef]
  9. Wang, H.; Tetzlaff, D.; Soulsby, C. Modelling the effects of land cover and climate change on soil water partitioning in a boreal headwater catchment. J. Hydrol. 2018, 558, 520–531. [Google Scholar] [CrossRef]
  10. Zeng, Q.; Rossi, S.; Yang, B.; Qin, C.; Li, G. Environmental drivers for cambial reactivation of Qilian junipers (Juniperus przewalskii) in a semi-arid region of northwestern China. Atmosphere 2020, 11, 232. [Google Scholar] [CrossRef]
  11. Zhang, F.; Jia, W.; Zhu, G.; Shi, Y.; Zhang, M. Using stable isotopes to investigate differences of plant water sources in subalpine habitats. Hydrol. Process. 2022, 36, e14518. [Google Scholar] [CrossRef]
  12. Gao, S.; Liu, R.; Zhou, T.; Fang, W.; Yi, C.; Lu, R.; Luo, H. Dynamic responses of tree-ring growth to multiple dimensions of drought. Glob. Change Biol. 2018, 24, 5380–5390. [Google Scholar] [CrossRef] [PubMed]
  13. Bose, T.; Sengupta, S.; Chakraborty, S.; Borgaonkar, H. Reconstruction of soil water oxygen isotope values from tree ring cellulose and its implications for paleoclimate studies. Quat. Int. 2016, 425, 387–398. [Google Scholar] [CrossRef]
  14. Xu, Q.; Li, H.; Chen, J.; Cheng, X.; Liu, S.; An, S. Water use patterns of three species in subalpine forest, Southwest China: The deuterium isotope approach. Ecohydrology 2011, 4, 236–244. [Google Scholar] [CrossRef]
  15. Roden, J.S.; Lin, G.; Ehleringe, J.R. A mechanistic model for interpretation of hydrogen and oxygen isotope ratios in tree-ring cellulose. Geochim. Cosmochim. Acta 2000, 64, 21–35. [Google Scholar] [CrossRef]
  16. Wright, I.J.; Reich, P.B.; Westoby, M. Least-cost input mixtures of water and nitrogen for photosynthesis. Am. Nat. 2003, 161, 98–111. [Google Scholar] [CrossRef] [PubMed]
  17. Xiao, H.; Deng, W.; Wei, G.; Chen, J.; Zheng, X.; Shi, T.; Zeng, T. A pilot study on zinc isotopic compositions in shallow-water coral skeletons. Geochem. Geophys. Geosyst. 2020, 21, e2020GC009430. [Google Scholar] [CrossRef]
  18. Deurwaerder, H.; Hervé-Fernández, P.; Stahl, C.; Burban, B.; Petronelli, P.; Hoffman, B.; Verbeeck, H. Liana and tree below-ground water competition-evidence for water resource partitioning during the dry season. Tree Physiol. 2018, 38, 1071–1083. [Google Scholar] [CrossRef] [PubMed]
  19. Gessler, A.; Ferrio, J.P.; Hommel, R.; Treydte, K.; Werner, R.A.; Monson, R.K. Stable isotopes in tree rings: Towards a mechanistic understanding of isotope fractionation and mixing processes from the leaves to the wood. Tree Physiol. 2014, 34, 796–818. [Google Scholar] [CrossRef]
  20. Hahm, W.J.; Dralle, D.N.; Rempe, D.M.; Bryk, A.B.; Thompson, S.E.; Dawson, T.E.; Dietrich, W.E. Low subsurface water storage capacity relative to annual rainfall decouples Mediterranean plant productivity and water use from rainfall variability. Geophys. Res. Lett. 2019, 46, 6544–6553. [Google Scholar] [CrossRef]
  21. Lind, M.; Zhang, L.; Falste, D.; Franklin, O.; Brännström, A. Plant diversity and drought: The role of deep roots. Ecol. Modell. 2014, 290, 85–93. [Google Scholar] [CrossRef]
  22. Baker, J.C.A.; Gloor, M.; Spracklen, D.V.; Arnold, S.R.; Tindall, J.C.; Clerici, S.J.; Brienen, R.J.W. What drives interannual variation in tree ring oxygen isotopes in the Amazon. Geophys. Res. Lett. 2016, 43, 11–831. [Google Scholar] [CrossRef]
  23. Wang, L.; Liu, H.; Leavit, S.; Cresse, E.L.; Quine, T.A.; Shi, J.; Shi, S. Tree-ring δ18O identifies similarity in timing but differences in depth of soil water uptake by trees in mesic and arid climates. Agric. For. Meteorol. 2021, 308, 108569. [Google Scholar] [CrossRef]
  24. Yang, B.; Wen, X.; Sun, X. Seasonal variations in depth of water uptake for a subtropical coniferous plantation subjected to drought in an East Asian monsoon region. Agric. For. Meteorol. 2015, 201, 218–228. [Google Scholar] [CrossRef]
  25. Sun, J.; Ye, C.; Liu, M.; Wang, Y.; Chen, J.; Wang, S.; Tsubo, M. Response of net reduction rate in vegetation carbon uptake to climate change across a unique gradient zone on the Tibetan Plateau. Environ. Res. 2022, 203, 111894. [Google Scholar] [CrossRef] [PubMed]
  26. Wong, J.; Fong, A.; McVicar, N.; Smith, S.; Giambattista, J.; Wells, D.; Alexander, A. Comparing deep learning-based auto-segmentation of organs at risk and clinical target volumes to expert inter-observer variability in radiotherapy planning. Radiother. Oncol. 2020, 144, 152–158. [Google Scholar] [CrossRef] [PubMed]
  27. Fang, O.; Zhang, Q.B. Tree resilience to drought increases in the Tibetan Plateau. Glob. Change Biol. 2019, 25, 245–253. [Google Scholar] [CrossRef]
  28. Ge, F.; Sielmann, F.; Zhu, X.; Fraedrich, K.; Zhi, X.; Peng, T.; Wang, L. The link between Tibetan Plateau monsoon and Indian summer precipitation: A linear diagnostic perspective. Clim. Dyn. 2017, 49, 4201–4215. [Google Scholar] [CrossRef]
  29. Tan, L.; Cai, Y.; Edwards, L.R.; Lan, J.; Zhang, H.; Gao, Y. High resolution monsoon precipitation changes on southeastern Tibetan Plateau over the past 2300 years. Quat. Sci. Rev. 2018, 195, 122–132. [Google Scholar] [CrossRef]
  30. Grießinger, J.; Bräuning, A.; Helle, G.; Schleser, G.H.; Hochreuther, P.; Meier, W.J.H.; Zhu, H. A dual stable isotope approach unravels common climate signals and species-specific responses to environmental change stored in multi-century tree-ring series from the Tibetan plateau. Geosciences 2019, 9, 151. [Google Scholar] [CrossRef]
  31. Xu, C.; Zhu, H.; Nakatsuka, T.; Sano, M.; Li, Z.; Shi, F.; Guo, Z. Sampling strategy and climatic implication of tree-ring cellulose oxygen isotopes of Hippophae tibetana and Abies georgei on the southeastern Tibetan Plateau. Int. J. Biometeorol. 2018, 63, 679–686. [Google Scholar] [CrossRef] [PubMed]
  32. Sano, M.; Dimri, A.P.; Ramesh, R. Moisture source signals preserved in a 242-year tree-ring δ18O chronology in the western Himalaya. Glob. Planet. Change 2017, 157, 73–82. [Google Scholar] [CrossRef]
  33. Zhang, J.; Gou, X.; Manzanedo, R.D.; Zhang, F.; Pederson, N. Cambial phenology and xylogenesis of Juniperus przewalskii over a climatic gradient is influenced by both temperature and drought. Agric. For. Meteorol. 2018, 260, 165–175. [Google Scholar] [CrossRef]
  34. Shi, P.J.; Huang, J.G.; Hui, C.; Grissino-Mayer, H.D.; Tardif, J.; Zhai, L.H.; Li, B.L. Capturing spiral radial growth of conifers using the superellipse to model tree-ring geometric shape. Front. Plant Sci. 2015, 6, 856. [Google Scholar] [CrossRef] [PubMed]
  35. Wernicke, J.; Grießinger, J.; Hochreuther, P.; Bräuning, A. Variability of summer humidity during the past 800 years on the eastern Tibetan Plateau inferred from δ18O of tree-ring cellulose. Clim. Past. 2014, 10, 3327–3356. [Google Scholar]
  36. Sano, M.; Tshering, P.; Komori, J. May-September precipitation in the Bhutan Himalaya since 1743 as reconstructed from tree ring cellulose δ18O. J. Geophys. Res. Atmos. 2013, 118, 8399–8410. [Google Scholar] [CrossRef]
  37. Treydte, K.S.; Schleser, G.H.; Helle, G. The twentieth century was the wettest period in northern Pakistan over the past millennium. Nature 2006, 440, 1179–1182. [Google Scholar] [CrossRef] [PubMed]
  38. Yang, B.; Qin, C.; Bräuning, A. Long-term decrease in Asian monsoon rainfall and abrupt climate change events over the past 6,700 years. Proc. Natl. Acad. Sci. USA 2021, 118, e2102007118. [Google Scholar] [CrossRef] [PubMed]
  39. Zeng, X.; Li, X.; Evans, M.N.; Wang, W.; An, W.; Xu, G.; Wu, G. Seasonal incursion of Indian Monsoon humidity and precipitation into the southeastern Qinghai-Tibetan Plateau inferred from tree ring δ18O values with intra-seasonal resolution. Earth Planet. Sci. Lett. 2016, 443, 9–19. [Google Scholar] [CrossRef]
  40. Murray, F.W. On the Computation of Saturation Vapor Pressure; Rand Corporation: Santa Monica, CA, USA, 1966. [Google Scholar]
  41. New, M.; Hulme, M.; Jones, P. Representing twentieth-century space-time climate variability. Part I: Development of a 1961-90 mean monthly terrestrial climatology. J. Clim. 1999, 12, 829–856. [Google Scholar] [CrossRef]
  42. Duan, A.; Xiao, Z. Does the climate warming hiatus exist over the Tibetan Plateau? Sci. Rep. 2015, 5, 13711. [Google Scholar] [CrossRef]
  43. Jiao, L.; Jiang, Y.; Zhang, W.; Wang, M.; Wang, S.; Liu, X. Assessing the stability of radial growth responses to climate change by two dominant conifer trees species in the Tianshan Mountains, northwest China. For. Ecol. Manag. 2019, 433, 667–677. [Google Scholar] [CrossRef]
  44. Li, Y.; Peng, S.; Liu, H.; Zhang, X.; Ye, W.; Han, Q.; Li, Y. Westerly jet stream controlled climate change mode since the Last Glacial Maximum in the northern Qinghai-Tibet Plateau. Earth Planet. Sci. Lett. 2020, 549, 116529. [Google Scholar] [CrossRef]
  45. Hu, S.; Zhou, T.; Wu, B. Impact of developing ENSO on Tibetan Plateau summer rainfall. J. Clim. 2021, 34, 3385–3400. [Google Scholar] [CrossRef]
  46. Li, Q.; Liu, Y.; Nakatsuka, T.; Fang, K.; Song, H.; Liu, R.; Wang, K. East Asian Summer Monsoon moisture sustains summer relative humidity in the southwestern Gobi Desert, China: Evidence from δ18O of tree rings. Clim. Dyn. 2019, 52, 6321–6337. [Google Scholar] [CrossRef]
  47. Farquhar, G.D.; Lloyd, J. Carbon and oxygen isotope effects in the exchange of carbon dioxide between terrestrial plants and the atmosphere. In Stable Isotopes and Plant Carbon-Water Relations; Academic Press: Cambridge, MA, USA, 1993; pp. 47–70. [Google Scholar]
  48. Mirfenderesgi, G.; Bohrer, G.; Matheny, A.M.; Fatichi, S.; Schäfer, K.V. Tree level hydrodynamic approach for resolving aboveground water storage and stomatal conductance and modeling the effects of tree hydraulic strategy. J. Geophys. Res. Biogeosci. 2016, 121, 1792–1813. [Google Scholar] [CrossRef]
  49. Zhan, N.; Wang, Z.; Xie, Y.; Shang, X.; Liu, G.; Wu, Z. Expression patterns and regulation of non-coding RNAs during synthesis of cellulose in Eucalyptus grandis Hill. Forests 2021, 12, 1565. [Google Scholar] [CrossRef]
  50. Giraldo, J.A.; Valle, J.I.; González-Caro, S.; Sierra, C.A. Intra-annual isotope variations in tree rings reveal growth rhythms within the least rainy season of an ever-wet tropical forest. Trees 2022, 36, 1039–1052. [Google Scholar] [CrossRef]
  51. Rao, W.; Chen, X.; Meredith, K.T.; Tan, H.; Gao, M.; Liu, J. Water uptake of riparian plants in the lower Lhasa River Basin, South Tibetan Plateau using stable water isotopes. Hydrol. Process. 2020, 34, 3492–3505. [Google Scholar] [CrossRef]
  52. Van, T.; Verheyen, K.; Kint, V.; Van, E.; Muys, B. Plasticity of tree architecture through interspecific and intraspecific competition in a young experimental plantation. For. Ecol. Manag. 2017, 385, 1–9. [Google Scholar]
  53. Schwendenmann, L.; Pendall, E.; Sanchez-Bragado, R.; Kunert, N.; Hölscher, D. Tree water uptake in a tropical plantation varying in tree diversity: Interspecific differences, seasonal shifts and complementarity. Ecohydrology 2015, 8, 1–12. [Google Scholar] [CrossRef]
  54. Zhang, J.; Gou, X.; Alexander, M.R.; Xia, J.; Wang, F.; Zhang, F.; Pederson, N. Drought limits wood production of Juniperus przewalskii even as growing seasons lengthens in a cold and arid environment. Catena 2021, 196, 104936. [Google Scholar] [CrossRef]
  55. Brienen, R.J.; Hietz, P.; Wanek, W.; Gloor, M. Oxygen isotopes in tree rings record variation in precipitation δ18O and amount effects in the south of Mexico. J. Geophys. Res. Biogeosci. 2013, 118, 1604–1615. [Google Scholar] [CrossRef]
  56. Guo, X.; Tian, L. Spatial patterns and possible mechanisms of precipitation changes in recent decades over and around the Tibetan Plateau in the context of intense warming and weakening winds. Clim. Dyn. 2022, 59, 2081–2102. [Google Scholar] [CrossRef]
  57. Liu, Y.; Wang, L.; Li, Q. Asian summer monsoon-related relative humidity recorded by tree ring δ18O during last 205 years. J. Geophys. Res. Atmos. 2019, 124, 9824–9838. [Google Scholar] [CrossRef]
  58. Li, F.F.; Lu, H.L.; Wang, G.Q.; Yao, Z.Y.; Li, Q.; Qiu, J. Zoning of precipitation regimes on the Qinghai-Tibet Plateau and its surrounding areas responded by the vegetation distribution. Sci. Total Environ. 2022, 838, 155844. [Google Scholar] [CrossRef]
  59. Holdo, R.M.; Nippert, J.B.; Mack, M.C. Rooting depth varies differentially in trees and grasses as a function of mean annual rainfall in an African savanna. Oecologia 2018, 186, 269–280. [Google Scholar] [CrossRef]
  60. Zhou, Y.; Chen, S.; Song, W.; Lu, Q.; Lin, G. Water-use strategies of two desert plants along a precipitation gradient in northwestern China. J. Plant Ecol. 2011, 35, 789. [Google Scholar] [CrossRef]
  61. Sun, L.; Yang, L.; Chen, L.; Zhao, F.; Li, S. Short-term changing patterns of stem water isotopes in shallow soils underlain by fractured bedrock. Hydrol. Res. 2019, 50, 577–588. [Google Scholar] [CrossRef]
  62. Grossiord, C.; Sevanto, S.; Dawson, T.E.; Adams, H.D.; Collins, A.D.; Dickman, L.T.; McDowell, N.G. Warming combined with more extreme precipitation regimes modifies the water sources used by trees. New Phytol. 2017, 213, 584–596. [Google Scholar] [CrossRef]
  63. Oerter, E.; Finstad, K.; Schaefer, J.; Goldsmith, G.R.; Dawson, T.; Amundson, R. Oxygen isotope fractionation effects in soil water via interaction with cations (Mg, Ca, K, Na) adsorbed to phyllosilicate clay minerals. J. Hydrol. 2014, 515, 1–9. [Google Scholar] [CrossRef]
  64. Dai, Y.; Zheng, X.J.; Tang, L.S.; Li, Y. Stable oxygen isotopes reveal distinct water use patterns of two Haloxylon species in the Gurbantonggut Desert. Plant Soil 2015, 389, 73–87. [Google Scholar] [CrossRef]
  65. Tron, S.; Bodner, G.; Laio, F. Can diversity in root architecture explain plant water use efficiency? A modeling study. Ecol. Modell. 2015, 312, 200–210. [Google Scholar] [CrossRef] [PubMed]
  66. Xue, R.; Jiao, L.; Zhang, P.; Du, D.; Wu, X.; Wei, M.; Li, Q.; Wang, X.; Qi, C. The key role of ecological resilience in radial growth processes of conifers under drought stress in the subalpine zone of marginal deserts. Sci. Total Environ. 2023, 903, 166864. [Google Scholar] [CrossRef]
  67. Yao, Y.; Liu, Y.; Zhou, S.; Son, J.; Fu, B. Soil moisture determines the recovery time of ecosystems from drought. Glob. Change Biol. 2013, 29, 3562–3574. [Google Scholar] [CrossRef]
Figure 1. Geographical locations of study area and sampling sites.
Forests 15 00752 g001
Figure 2. Meteorological elements of the study areas.
Forests 15 00752 g002
Figure 3. The time series of the δ18OTR for each site.
Forests 15 00752 g003
Figure 4. Significance test for study areas. Inter-sample differences in δ18OTR values were assessed using one−way ANOVA, with different letters indicating significant differences (p < 0.05).
Forests 15 00752 g004
Figure 5. Dynamics of SM in different soil layers in different months. The squares in the boxplot diagram represent the median SM, different letters indicating significant differences (p < 0.05), the black dots represent the outliers and the range of the boxes represents the 25%–75% data interval (a). The blue line in the graph represents the 40–100 cm volumetric water content, the red line represents the 10–40 cm volumetric water content and the black line represents the 0–10 cm volumetric water content (b).
Forests 15 00752 g005
Figure 6. Interannual variation in SM.
Forests 15 00752 g006
Figure 7. Linear fitting of SM and precipitation. The red area in the graph represents the 95% confidence interval and the red line represents the fitted trend line.
Forests 15 00752 g007
Figure 8. Correlations of δ18OTR with monthly climate variables. “+”: significant correlations at 95%. “*”: significant correlations at 99%.
Forests 15 00752 g008
Figure 9. Correlations of δ18OTR with monthly SM. “+”: p < 0.05. ”*”: p < 0.01.
Forests 15 00752 g009
Figure 10. The spatial correlation between SM and δ18OTR in June–September. The green point in the figure represents δ18OTR sampling points. The colors in the graph from red to blue to indicate that the correlation changes from negative to positive.
Forests 15 00752 g010
Table 1. The δ18OTR chronology information.
SitesLocationElevation (m)Tree SpeciesTime SpanAnnual Total Precipitation (mm)Date Source
JA29°38′ N,
79°51′ E
1870Cedrus deodara1621–20081505Xu et al. (2018) [31]
WA27°59′ N,
90° E
3500Larix griffithii1743–20111330Sano et al. (2013) [36]
GA28°10′ N,
85°11′ E
3500Abies spectabilis1801–2000958Xu et al. (2018) [31]
MA32°13′ N,
77°13′ E
2700Abies pindrow1768–2008650Sano et al. (2017) [32]
KA35°54′ N,
74°56′ E
2900Juniperus excelsa1900–1998329Treydte et al. (2006) [37]
DE37°48′ N,
97°78′ E
3500Juniperus przewalskii1168–2011197Yang et al. (2021) [38]
Table 2. Partial correlation analysis between δ18OTR and environmental factors from June–September.
Control VariablesCorrelations with δ18OTRJAWAGAMAKADE
VPDVMC0–10−0.396 **−0.364 *−0.409 *−0.459 *−0.211−0.145
VMC10–40−0.265−0.360 *−0.383 *−0.472 *−0.277−0.286
VMC40–100−0.210−0.225−0.241−0.416 *−0.356*−0.385 *
PDSI−0.161−0.106−0.255−0.264−0.278−0.585 **
RH0.2700.1790.423 *0.151−0.064−0.163
PDSIVMC0–10−0.251−0.459 *−0.365 *−0.527 **−0.0040.173
VMC10–40−0.213−0.451 *−0.317−0.542 **−0.1180.164
VMC40–100−0.14−0.156−0.343−0.500 **−0.2390.119
VPD0.0570.432−0.141−0.3140.003−0.021
RH0.072−0.396 *0.251−0.028−0.042−0.022
RHVMC0–10−0.356 **−0.377 *−0.392 *−0.53 **−0.213−0.130
VMC10–40−0.289−0.380 *−0.365 *−0.542 **−0.276−0.274
VMC40–100−0.214−0.225−0.280−0.499 *−0.352 *−0.365 *
VPD0.2960.2590.367 *0.159−0.042−0.008
PDSI−0.208−0.113−0.242−0.315−0.277−0.570 **
“*” indicates p < 0.05, and “**” indicates p < 0.01.
Disclaimer/Publisher’s Note: The statements, opinions and data contained in all publications are solely those of the individual author(s) and contributor(s) and not of MDPI and/or the editor(s). MDPI and/or the editor(s) disclaim responsibility for any injury to people or property resulting from any ideas, methods, instructions or products referred to in the content.

