Article

Application of an Integrated Model for Analyzing Street Greenery through Image Semantic Segmentation and Accessibility: A Case Study of Nanjing City

1
College of Architecture, Nanjing Tech University, Nanjing 211816, China
2
School of History, Anhui Normal University, Wuhu 241000, China
3
School of Environmental Science, Nanjing Xiaozhuang University, Nanjing 211171, China
*
Author to whom correspondence should be addressed.
Forests 2024, 15(3), 561; https://doi.org/10.3390/f15030561
Submission received: 27 February 2024 / Revised: 10 March 2024 / Accepted: 18 March 2024 / Published: 20 March 2024

Abstract

:
Urban street greening, a key component of urban green spaces, significantly impacts residents’ physical and mental well-being, contributing substantially to the overall quality and welfare of urban environments. This paper presents a novel framework that integrates street greenery with accessibility, enabling a detailed evaluation of the daily street-level greenery visible to residents. This pioneering approach introduces a new measurement methodology to quantify the quality of urban street greening, providing robust empirical evidence to support its enhancement. This study delves into Nanjing’s five districts, employing advanced image semantic segmentation based on machine learning techniques to segment and extract green vegetation from Baidu Street View (BSV) images. Leveraging spatial syntax, it analyzes street network data sourced from OpenStreetMap (OSM) to quantify the accessibility values of individual streets. Subsequent overlay analyses uncover areas characterized by high accessibility but inadequate street greening, underscoring the pressing need for street greening enhancements in highly accessible zones, thereby providing valuable decision-making support for urban planners. Key findings revealed that (1) the green view index (GVI) of sampled points within the study area ranged from 15.79% to 38.17%, with notably better street greening conditions observed in the Xuanwu District; (2) the Yuhua District exhibited comparatively lower pedestrian and commuting accessibility than the Xuanwu District; and (3) approximately 139.62 km of roads in the study area demonstrated good accessibility but lacked sufficient greenery visibility, necessitating immediate improvements in their green landscapes. This research utilizes the potential of novel data and methodologies, along with their practical applications in planning and design practices. Notably, this study integrates street greenery visibility with accessibility to explore, from a human-centered perspective, the tangible benefits of green landscapes. These insights highlight the opportunity for local governments to advance urban planning and design by implementing more human-centered green space policies, ultimately promoting societal equity.

1. Introduction

Green vegetation, including trees, shrubs, and herbaceous plants, holds an indispensable role as organic elements that enhance urban environments, uplift the city’s identity, and enhance the well-being of its residents [1,2,3]. It represents a critical facet that demands consideration in the planning of eco-friendly urban spaces [4]. Recent decades have witnessed a paradigm shift in urban planning, moving from prioritizing ‘growth-first’ approaches to emphasizing ‘quality enhancement’ within a broader ‘human-centric’ policy framework. This citizen-driven demand for improved spatial quality has fueled research exploring the quality of street greenery from a human-centered perspective [5].
Streets, essential components of urban public spaces, represent the most frequently visited public domain in residents’ daily lives. They possess the potential to enhance inhabitants’ experiences and make substantial contributions to a city’s society and culture. Existing research highlights the direct impact of street greening on augmenting residents’ perceptions of spatial quality and walkability within their communities [6]. Additionally, easily accessible urban greenery can effectively foster a sense of place, alleviate daily stresses, attract residents to outdoor activities, and facilitate routine social interactions [7,8]. Therefore, it is essential to develop methods for effectively measuring the actual benefits of street greenery experienced by residents in their daily lives.
The crux of the issue revolves around two central questions: (1) How to achieve a fine-grained analysis of human-scale greening perception in large-scale urban areas? (2) How to integrate street greenery visibility with street accessibility to explore the tangible benefits of green landscapes on a human perceptual scale?
Greening measurement constitutes a pivotal task in urban planning and management. However, conventional manual measurement methods are laborious, time-consuming, and often lack precision [9,10,11]. Currently, large-scale evaluations of urban street greening primarily rely on metrics such as green coverage and the Normalized Difference Vegetation Index (NDVI), extracted from satellite remote sensing images [12,13]. While these metrics provide insights into the extent and distribution of urban green spaces, they are limited by their satellite perspective and fail to capture the genuine visual experiences of city residents regarding these green landscapes [14,15]. Consequently, they inadequately represent whether these green spaces align with the people-centric principles of urban development.
Moreover, while the accessibility and visibility of street greenery are commonly considered, there is a need for a scientific approach to integrating the daily street accessibility of individuals with the human-scale visual visibility of greenery. Such an approach aims to precisely analyze the actual human-scale perception of greenery experienced during daily accessibility, providing valuable insights for planners and policymakers aiming to enhance greenery landscapes.
Overcoming these challenges requires innovative methods to evaluate the visibility and accessibility of street greenery across vast urban areas. Fortunately, recent advancements offer promising solutions. Firstly, readily available network street-view images and OSM data provide ample data for large-scale greenery assessments [16,17]. Concurrently, machine learning algorithms, particularly image semantic segmentation, significantly improve the efficiency of extracting and analyzing image data [18]; this advancement enables the rapid extraction of green information from photos. Spatial syntax tools have also introduced novel research possibilities for accessibility analysis.
To comprehensively evaluate the human-scale street greening experience, this study selects Nanjing’s main urban area as the research focus. This study utilizes BSV images as the street green data source. Through image semantic segmentation, accessibility analysis, and other methodologies, it thoroughly analyzes the accessibility and visibility of street greenery within Nanjing’s main urban area from a human-scale perspective. The primary objective of this study is to explore the correlation between street greenery visibility, as determined by image semantic segmentation, and spatial accessibility, assessed through spatial syntax. This study investigates the interplay between street greenery visibility and accessibility, adopting a human-centered perspective to quantify the tangible benefits of urban green spaces. By identifying areas with street greenery accessibility and visibility, this analysis provides actionable insights for prioritized interventions in urban planning. These findings can facilitate the organic revitalization of Nanjing’s street greenery landscape, ultimately enhancing the lived experiences of residents.
This research assists urban planners in maximizing greenery benefits from a human-centric standpoint, fostering the equitable distribution of greenery across extensive areas at the human perceptual scale, further enhancing the impact of green landscapes in people’s daily accessible regions, and contributing to the creation of more livable and sustainable urban environments.

2. Literature Review

2.1. Large-Scale Analysis for Street Greenery

Presently, the primary analytical methods for large-scale street greenery encompass remote sensing image analysis and street-view image analysis based on image semantic segmentation techniques.
Remote sensing technology plays a pivotal role in providing comprehensive and spatially explicit information regarding street greenery. Satellite imagery, aerial photography, and LiDAR data are commonly employed remote sensing sources, facilitating the capture of spatial distribution and extent of urban green spaces [19,20,21]. These sources enable the extraction of vegetation indices for quantifying greenery. For instance, Chinmoy Sarkar conducted a comprehensive assessment of urban greenery, street design, and walking using satellite imagery and GIS, unveiling spatial patterns and disparities in green space distribution [22]. Although these indices provide insights into the extent and distribution of urban greenery, they are limited by the satellite perspective, unable to capture the authentic visual experiences of urban residents regarding these green landscapes.
In addition to remote sensing technology, street-view images offer valuable perspectives for analyzing street greenery, with higher spatial resolution. Street-view images are captured by vehicles equipped with cameras or collected from online platforms such as Google and Baidu, providing detailed visual information about green spaces along urban streets [23]. Researchers can utilize street-view images to assess the quality, diversity, and distribution of street trees, parks, and other green features [24]. By analyzing street-view images, researchers can gain insights into the accessibility and visual perception of green spaces from pedestrians’ perspectives. In recent years, street-view images have rapidly emerged as vital data sources for geographic spatial data collection and urban analysis, offering insights and supporting informed decision-making [25,26,27]. Furthermore, image semantic segmentation technology has become a powerful tool for extracting detailed information about street greenery from image data. Image segmentation algorithms based on deep learning and convolutional neural networks make it possible to automatically segment vegetation areas in images [28,29,30]. These technologies enable the precise identification and classification of different types of vegetation in urban environments, such as trees, shrubs, and grasslands [31]. By applying image semantic segmentation, researchers can generate high-resolution maps of street greenery and quantify its spatial distribution and composition [32]. The proliferation of large-scale image platforms, advancements in computer vision and machine learning, and the availability of computing resources have significantly bolstered technical support for research in this field.

2.2. Street Accessibility and Spatial Syntax

Within the context of urban planning, accessibility refers to the ease of using a transportation system to reach desired destinations from a starting point [33,34]. It reflects the potential for social, economic, and cultural exchange between the area and other relevant locations. Urban green spaces, crucial components of urban green infrastructure, offer numerous potential benefits for public health and well-being [35]. Their accessibility has become a key research focus within environmental justice, social equity, and urban planning.
Much of the current research on green space accessibility focuses on analyzing access to park spaces, specifically examining areas within urban landscapes with limited park accessibility [36,37]. The aim is to strategically plan and develop park green spaces in these areas, ultimately fostering fairness in green space accessibility [38]. Regrettably, limited attention has been directed toward the accessibility of street vegetation, a highly visible form of urban greenery frequently encountered by residents in their daily lives. Therefore, it is imperative to acknowledge that the potential for people to interact with and be exposed to daily urban street greening should be regarded as a crucial element in the realm of human-centric urban green infrastructure development.
Within the realm of spatial accessibility and urban morphology research, spatial syntax reigns as a potent analytical tool for dissecting urban spatial accessibility [39,40]. Spatial syntax analysis is also a useful tool for understanding how streets connect within a network. It helps researchers, planners, and engineers estimate accessibility based on the network’s configuration. This makes it a popular choice for urban street network analyses. By combining spatial syntax theories with GIS, researchers can gain powerful tools for spatial data analysis and geographical modeling. This allows for a better understanding of the accessibility of green spaces within the streets that residents use most often. This fusion of approaches helps us gain deeper insights into green space accessibility, contributing to more comprehensive research on street space analysis.

2.3. Application of the Techniques with Urban Planning

The application of large-scale street greenery analysis techniques or spatial syntax technology with urban planning is of paramount significance for urban sustainable development [41,42]. By combining data-driven analysis with planning practices, researchers and practitioners can optimize urban green infrastructure and enhance the quality of the urban environment. For instance, Li proposed a framework that incorporates street greening assessment into the urban planning process, utilizing GIS-based analysis to identify priority areas for green interventions [16]. Similarly, scholars have investigated the relationship between road networks and land use patterns, as well as the relationship between facility accessibility and social inequality, aiming to further explore how to integrate spatial syntax analysis with factors such as user perception, spatial functionality, and how to apply these integrated analyses to urban planning and design practices [43,44,45]. This will provide important guidance for better understanding the complexity of urban space and designing more sustainable and human-centric urban environments.
The combination of street-view image analysis based on image semantic segmentation technology and spatial syntax technology in urban planning research will play a crucial role in shaping the future of urban sustainable development, providing a unique opportunity to bridge the gap between large-scale urban spatial analysis and high-precision human-scale green space assessment. It also provides valuable tools for researchers to assess the extent, quality, and accessibility of urban green spaces, thereby supporting evidence-based decision-making in urban planning and management.

3. Theoretical Framework

In the process of urbanization, urban green space construction is recognized as one of the key means to maintain urban ecological environments and enhance residents’ quality of life [46,47]. Green space construction plays a pivotal role in urban planning, not only concerning the improvement in urban ecological environments but also involving the rational allocation and utilization efficiency of urban resources, as well as the fair rights and interests of residents [48,49,50]. Efficiency emphasizes the optimal use of resources, while fairness focuses on the equitable distribution of resources. However, in urban green space construction, efficiency and fairness often encounter conflicts and require a delicate balance. We aim to investigate how to achieve a win–win situation in green space construction through rational planning and design.
However, achieving both efficiency and equity in urban green space construction remains a persistent challenge in urban planning. Street spaces, being the most frequently utilized areas in people’s daily lives, are directly associated with residents’ well-being regarding greenery [51,52]. Consequently, the fairness and efficiency of street greenery landscape construction have become focal points in research and practice [53]. Currently, two core issues prevail in research: Firstly, how to conduct fine-grained analysis of human-scale greenery perception efficiently and economically in large-scale urban areas. Secondly, how to integrate the visibility of street greenery with street accessibility analysis, prioritizing the enhancement of street greenery landscapes in highly accessible areas, thus balancing fairness and efficiency, and exploring tangible benefits of green landscapes at the human perception scale. Therefore, this paper aims to propose a comprehensive method for evaluating urban green space construction by considering both equity and efficiency, integrating image semantic segmentation and spatial syntax analysis techniques.
To scientifically analyze urban street greenery landscapes as perceived by people, we employed a greenery analysis method based on image semantic segmentation [54]. This method utilizes advanced image processing techniques to automatically perform semantic segmentation on urban street-view images, accurately identifying greenery areas within the images for rapid calculation of the proportion of green areas. Through this method, we can objectively assess the quality of street greenery landscapes in various urban settings, providing a scientific basis for subsequent planning and design endeavors.
Simultaneously, the potential for people to interact with and engage with daily urban street greenery should be regarded as a key factor in the development of people-centered urban green infrastructure. Therefore, considering residents’ perceptions of accessible street spaces comprehensively, we employed a spatial syntax-based accessibility analysis method [55]. This method considers various factors such as urban road networks and transportation modes, comprehensively analyzing the paths and time costs for residents to reach green spaces. By combining this method with a comprehensive analysis of current green space distribution, we can prioritize enhancing greenery landscapes in street areas with higher accessibility for residents and propose improvement suggestions.
By integrating the two analysis methods, we can comprehensively evaluate the effectiveness of urban green space construction and provide scientific support for future urban planning and design endeavors. The theoretical framework proposed in this paper not only contributes to optimizing urban green space planning but also facilitates the achievement of sustainable development goals for cities, thereby enhancing residents’ quality of life.

4. Materials and Methods

4.1. Study Area and Data Sources

4.1.1. Study Area

Nanjing, the capital of Jiangsu Province and a pivotal central city in eastern China, holds a crucial position as an economic hub (Figure 1). Nanjing’s strategic location significantly contributes to regional development, providing the city with abundant natural resources [56]. Recent assessments indicate that nearly 41% of Nanjing’s developed areas consist of green spaces, leading to its recognition as a ‘National Forest City’ due to its favorable green conditions.
In recent years, as a rapidly developing urban center [57], Nanjing’s urban planning and green space design have been crucial for residents’ quality of life and the sustainable development of the urban environment [58]. Balancing equity while maximizing the scientific enhancement of green space landscape benefits is an urgent issue that needs to be addressed. This study focuses on the five central districts within Nanjing’s inner ring road: Xuanwu, Qinhuai, Gulou, Jianye, and Yuhua, covering an area of approximately 400 square kilometers. These areas constitute the core of Nanjing, characterized by dense infrastructure and population. Currently, there is an uneven development of street greening landscapes in these areas, requiring urgent improvement. There is a need for a scientific analysis of the current distribution disparities in green environments and the effective enhancement of accessible street greenery for daily residents. Consequently, conducting research in this region, particularly against the backdrop of ongoing urban renewal efforts, can provide valuable insights into improving the quality of visible greenery in densely populated urban environments.

4.1.2. Data Sources

This research primarily utilized administrative boundary data, road data, and BSV data for measuring street greenery conditions (Table 1). BSV images, which are street-level image data, offer extensive geographic coverage, standardized urban environments, geographic coding, and high-resolution images. They serve as a readily accessible resource for urban imagery.

4.2. Methodology

4.2.1. Extracting the GVI of the Street through Image Semantic Segmentation

The image segmentation algorithm based on deep learning enables automatic segmentation of vegetation regions within the image. It facilitates the extraction of detailed information regarding street green spaces from street image data. Employing machine learning, it comprehends and segments the semantic content of the image, representing a fundamental aspect of computer vision [54]. The objective is to assign a category label to each pixel in the image. Scene and image segmentation can be viewed as extensions of object detection, aiming to identify specific objects within an image and classify image pixels into discrete categories describing the image [59]. The application of image semantic segmentation utilizing deep convolutional neural network architectures allows for the accurate and automated deep processing of street-view image data. This process enables the identification of various elements within street-view images, including roads, greenery, sky, buildings, etc. Subsequently, it allows for the extraction of green features from street-view images and the calculation of street green visibility from a human-scale perspective.
Various image semantic segmentation models have been developed in recent years, predominantly based on deep convolutional neural networks. These models include FCN [60], SegNet [61], PSPNet [62], and the DeepLabV3 series [63]. Among them, DeepLabV3+ stands out for its exceptional segmentation performance, leading to widespread adoption in research endeavors. Consequently, this study selected the widely used DeepLabv3+ semantic segmentation model, as commonly applied in similar studies. Scholars have extensively investigated various landscape elements of urban streets using this model. Following the segmentation of the street-view image using the model, we performed calculations and statistical analyses of the GVI for each photo based on the obtained semantic segmentation results. Detailed operational procedures and calculation formulas will be elucidated in subsequent chapters. Finally, to validate the accuracy of the model segmentation, we randomly selected 100 segmented photos and compared them with manually segmented photos for precision verification.

4.2.2. Accessibility Analysis Based on Spatial Syntax

Spatial syntax focuses on open space systems to achieve a spatial representation of connectivity and understand how these spatial features influence behavior [64]. It establishes a model to describe spatial relationships between entities, utilizing methods such as network analysis, path analysis, and graph theory to analyze connectivity and accessibility. Employing spatial syntax for accessibility analysis is a method of studying relationships and accessibility between objects in a spatial environment, commonly applied in fields like urban planning, transportation planning, and environmental management. In this study, we will utilize spatial syntax to measure street accessibility.
A range of distance metrics, including the closeness, mean geodesic length, and mean crow flight, have been developed to represent accessibility [65,66]. Analyzing street accessibility through spatial syntax typically involves the use of ArcGIS software and programming tools for practical analysis such as data processing, model construction, and accessibility analysis. The accessibility results derived from this analysis can elucidate differences in accessibility between various entities, explore factors influencing accessibility, and propose corresponding conclusions and suggestions.
This study will utilize the sDNA 4.0.3 spatial syntax software based on the ArcGIS 10.6 [66], along with the angular betweenness metric to describe accessibility. Detailed calculation formulas and operational procedures will be provided in subsequent chapters.

4.3. Research Design

The research design utilizes a three-step approach:
(1) Street green visibility analysis: Average green visibility of streets in the study area is analyzed through the collection and processing of street images, categorized into different levels.
(2) Street accessibility analysis: Street pedestrian and commuting accessibility is evaluated using spatial syntax, assigning levels based on the degree of accessibility.
(3) Integrated analysis: A comprehensive analysis is conducted that integrates both green visibility and accessibility metrics for each street. This identification helps pinpoint areas where daily accessibility is high but there is a lack of sufficient greenery.

4.4. Research Process

The three-step research design outlined above translates into four specific phases in practice (Figure 2). The initial phase involves data preprocessing, which includes extracting coordinates of street-view sampling points from OSM to collect street-view images for each point. Simultaneously, the road network is organized to facilitate subsequent accessibility analysis. The second stage involves collecting panoramic street photos for street greening analysis. The Baidu Application Programming Interface (API) is utilized to gather street scenery images from various points, employing machine learning algorithms for data processing. These algorithms conduct image semantic segmentation and extract the GVI, aiding in the measurement of street greening. The third step involves street accessibility analysis. Spatial syntax tools, specifically sDNA spatial network analysis, are employed to quantitatively measure daily and commuting behavior accessibility within the street network. Finally, a comprehensive analysis integrates visibility and accessibility data. This analysis assesses the alignment between how easily residents can reach streets and how much greenery they can see from those streets, essentially quantifying ‘visible greening’. This reveals priority streets for potential greening interventions within urban renewal and construction efforts across the city.

4.4.1. Data Preprocessing

The data preprocessing comprises two essential components. The first component involves extracting sampling points from street network data. Initially, the line shapefiles of streets from five urban areas in Nanjing are acquired using OSM. Subsequently, utilizing ArcGIS, the street network within administrative boundaries is clipped, and sampling points are extracted from the street shapefile at intervals of 300 m. These sampling points encompass attribute data of the original OSM streets, along with longitude and latitude coordinates. A total of 8330 street sampling points were extracted for this study. Figure 3 illustrates the distribution of all sampling points across the OSM street network. For a detailed view of each sampling point’s precise location, longitude and latitude coordinates are acquired using ArcGIS, establishing the groundwork for subsequent batch retrieval of street-view images.
The second part focuses on organizing and refining the street shapefiles, following the prescribed steps outlined in the sDNA document. This stage involves the systematic arrangement and cleansing of the street vector data, ensuring adherence to the specific procedures stipulated by the sDNA document methodology [66].

4.4.2. Measurement Process of Street Green Visibility

To comprehensively assess street greening levels, this study captured a 360-degree horizontal perspective around specific sampling points. Using the longitude and latitude coordinates from these sampling points, we accessed the BSV API and configured parameters. The vertical line of sight for each sampling point was uniformly set at 0°, while the horizontal angle remained fixed at 90°. Subsequently, images were captured at specific angles of 0°, 90°, 180°, and 270°, which were then stitched together to create a cohesive 360-degree horizontal street view, providing a comprehensive panorama of the surroundings. We input the coordinates of the 8330 sampling points mentioned earlier into the BSV API using a Python 3.7 program to download BSV images in bulk. This study obtained BSV images from 7272 sampling points, as some of these points lacked corresponding BSV data. Key parameters are shown in Table 2.
Utilizing a Deeplabv3+ model-based image semantic segmentation system and machine learning techniques with the cityscapes dataset, we applied pre-trained weights to perform image semantic segmentation on the gathered street-view images within the study area. This process involved accurately identifying green areas and representing plant regions, using machine learning algorithms. Statistical analysis of these green areas within the images, along with a specific formula, allowed us to compute the street GVI. Spatial statistical methods were then applied to determine the GVI for each sampling point within the study area (Figure 4).
The formula for the GVI is as follows:
G V I n = G n A n = i = 1 4   g i i = 1 4   a i ,
GVIn represents the GVI for a specific sampling point n; Gn denotes the sum of the green areas in the four captured images around the sampling point; An signifies the sum of the total areas in the four captured images around the sampling point; gi represents the green area in each individual image (0°, 90°, 180°, 270°) around the sampling point; ai’ denotes the total area in each individual image (0°, 90°, 180°, 270°) around the sampling point. To validate the automated greenery extraction method, the green plant proportion in each of the 100 randomly selected BSV images was manually calculated. A high correlation (r = 0.90, p < 0.01) was found between the GVI extracted by the image semantic segmentation method and the manual extraction, demonstrating strong agreement between the automated and manual methods. Simultaneously, we associated the GVI data analyzed at each point with the ArcGIS spatial database, facilitating the creation of a distribution map for street sampling points categorized by their high and low GVI values. Utilizing the street shapefile, we computed the average GVI value of sampling points along the road and classified them into three distinct categories.

4.4.3. Measurement Process of Street Accessibility

In this study, street accessibility was assessed using spatial syntax, which delves into open space systems, emphasizing spatial connectivity and exploring the impact of such spatial characteristics on behavior. The analysis utilized spatial design network analysis software sDNA integrated with the ArcGIS platform. sDNA encompasses assessments of the shortest path, considering topology, angles, or metric distance variations. Given the established strong correlation between angular distance-based accessibility values and observed human and vehicular behavior distribution, angular betweenness was employed as a metric for road network accessibility. It assists in identifying the most accessible streets within the study area. Specifically, sDNA tools were applied to compute accessibility values. Two accessibility values, 500 m and 5000 m, represented pedestrian and vehicular accessibility, respectively. Here, the radius signifies the metric distance from each segment to the radius along all available streets and roads. Thus, the smaller radius (e.g., 500 m) primarily identifies local-scale street relationships, often associated with pedestrian behavior. Meanwhile, the larger radius (e.g., 5000 m) encompasses a wider area, emphasizing major streets used in vehicular commuting behavior.
The angular betweenness formula can be represented as follows [65]:
A B ( i ) = s i t   σ s t ( i ) σ s t ,
AB(i) represents the angular betweenness of node i (node i is a node in the measured network); σst denotes the number of shortest paths from node s to node t; σst(i) indicates the number of shortest paths from node s to node t that pass through node i.
This formula computes the angular betweenness of node i by calculating the proportion of shortest paths that pass through this node among all the shortest paths. It considers the role of the node in connecting other nodes via shortest paths; the higher the number of shortest paths passing through the node, the higher its angular betweenness, indicating greater importance in the network. After analysis, the sDNA software will directly generate a shapefile and display the angular betweenness value under the set parameters in ArcGIS.

4.4.4. Combined Assessment Measure of Visible Street Greenery and Street Accessibility

Through an analysis of GVI and accessibility in this study, we divided the streets into three levels, high, medium, and low, based on the two attributes of GVI value and angular betweenness. We delineated the spatial domains and prioritization levels for enhancing urban street greening. Specifically, we pinpointed areas requiring immediate greening enhancement within street landscapes, focusing on streets characterized by high accessibility but limited green coverage. These thoroughfares, extensively used by pedestrians or commuters but lacking sufficient greenery, demand immediate comprehensive greening improvements. They were categorized as the primary level, consisting of two types: streets with high pedestrian accessibility but insufficient streetscape greening and streets with high commuting accessibility yet inadequate streetscape greening. The secondary level incorporates streets with low green coverage, excluding those previously mentioned. These streets fall within the broader category necessitating greening enhancements and have been classified as secondary priority areas in our study. Finally, the tertiary level encompasses streets with moderate-to-high green coverage. Irrespective of their accessibility levels, these streets do not require further greening enhancements and have been categorized as the third priority in our research.

5. Results

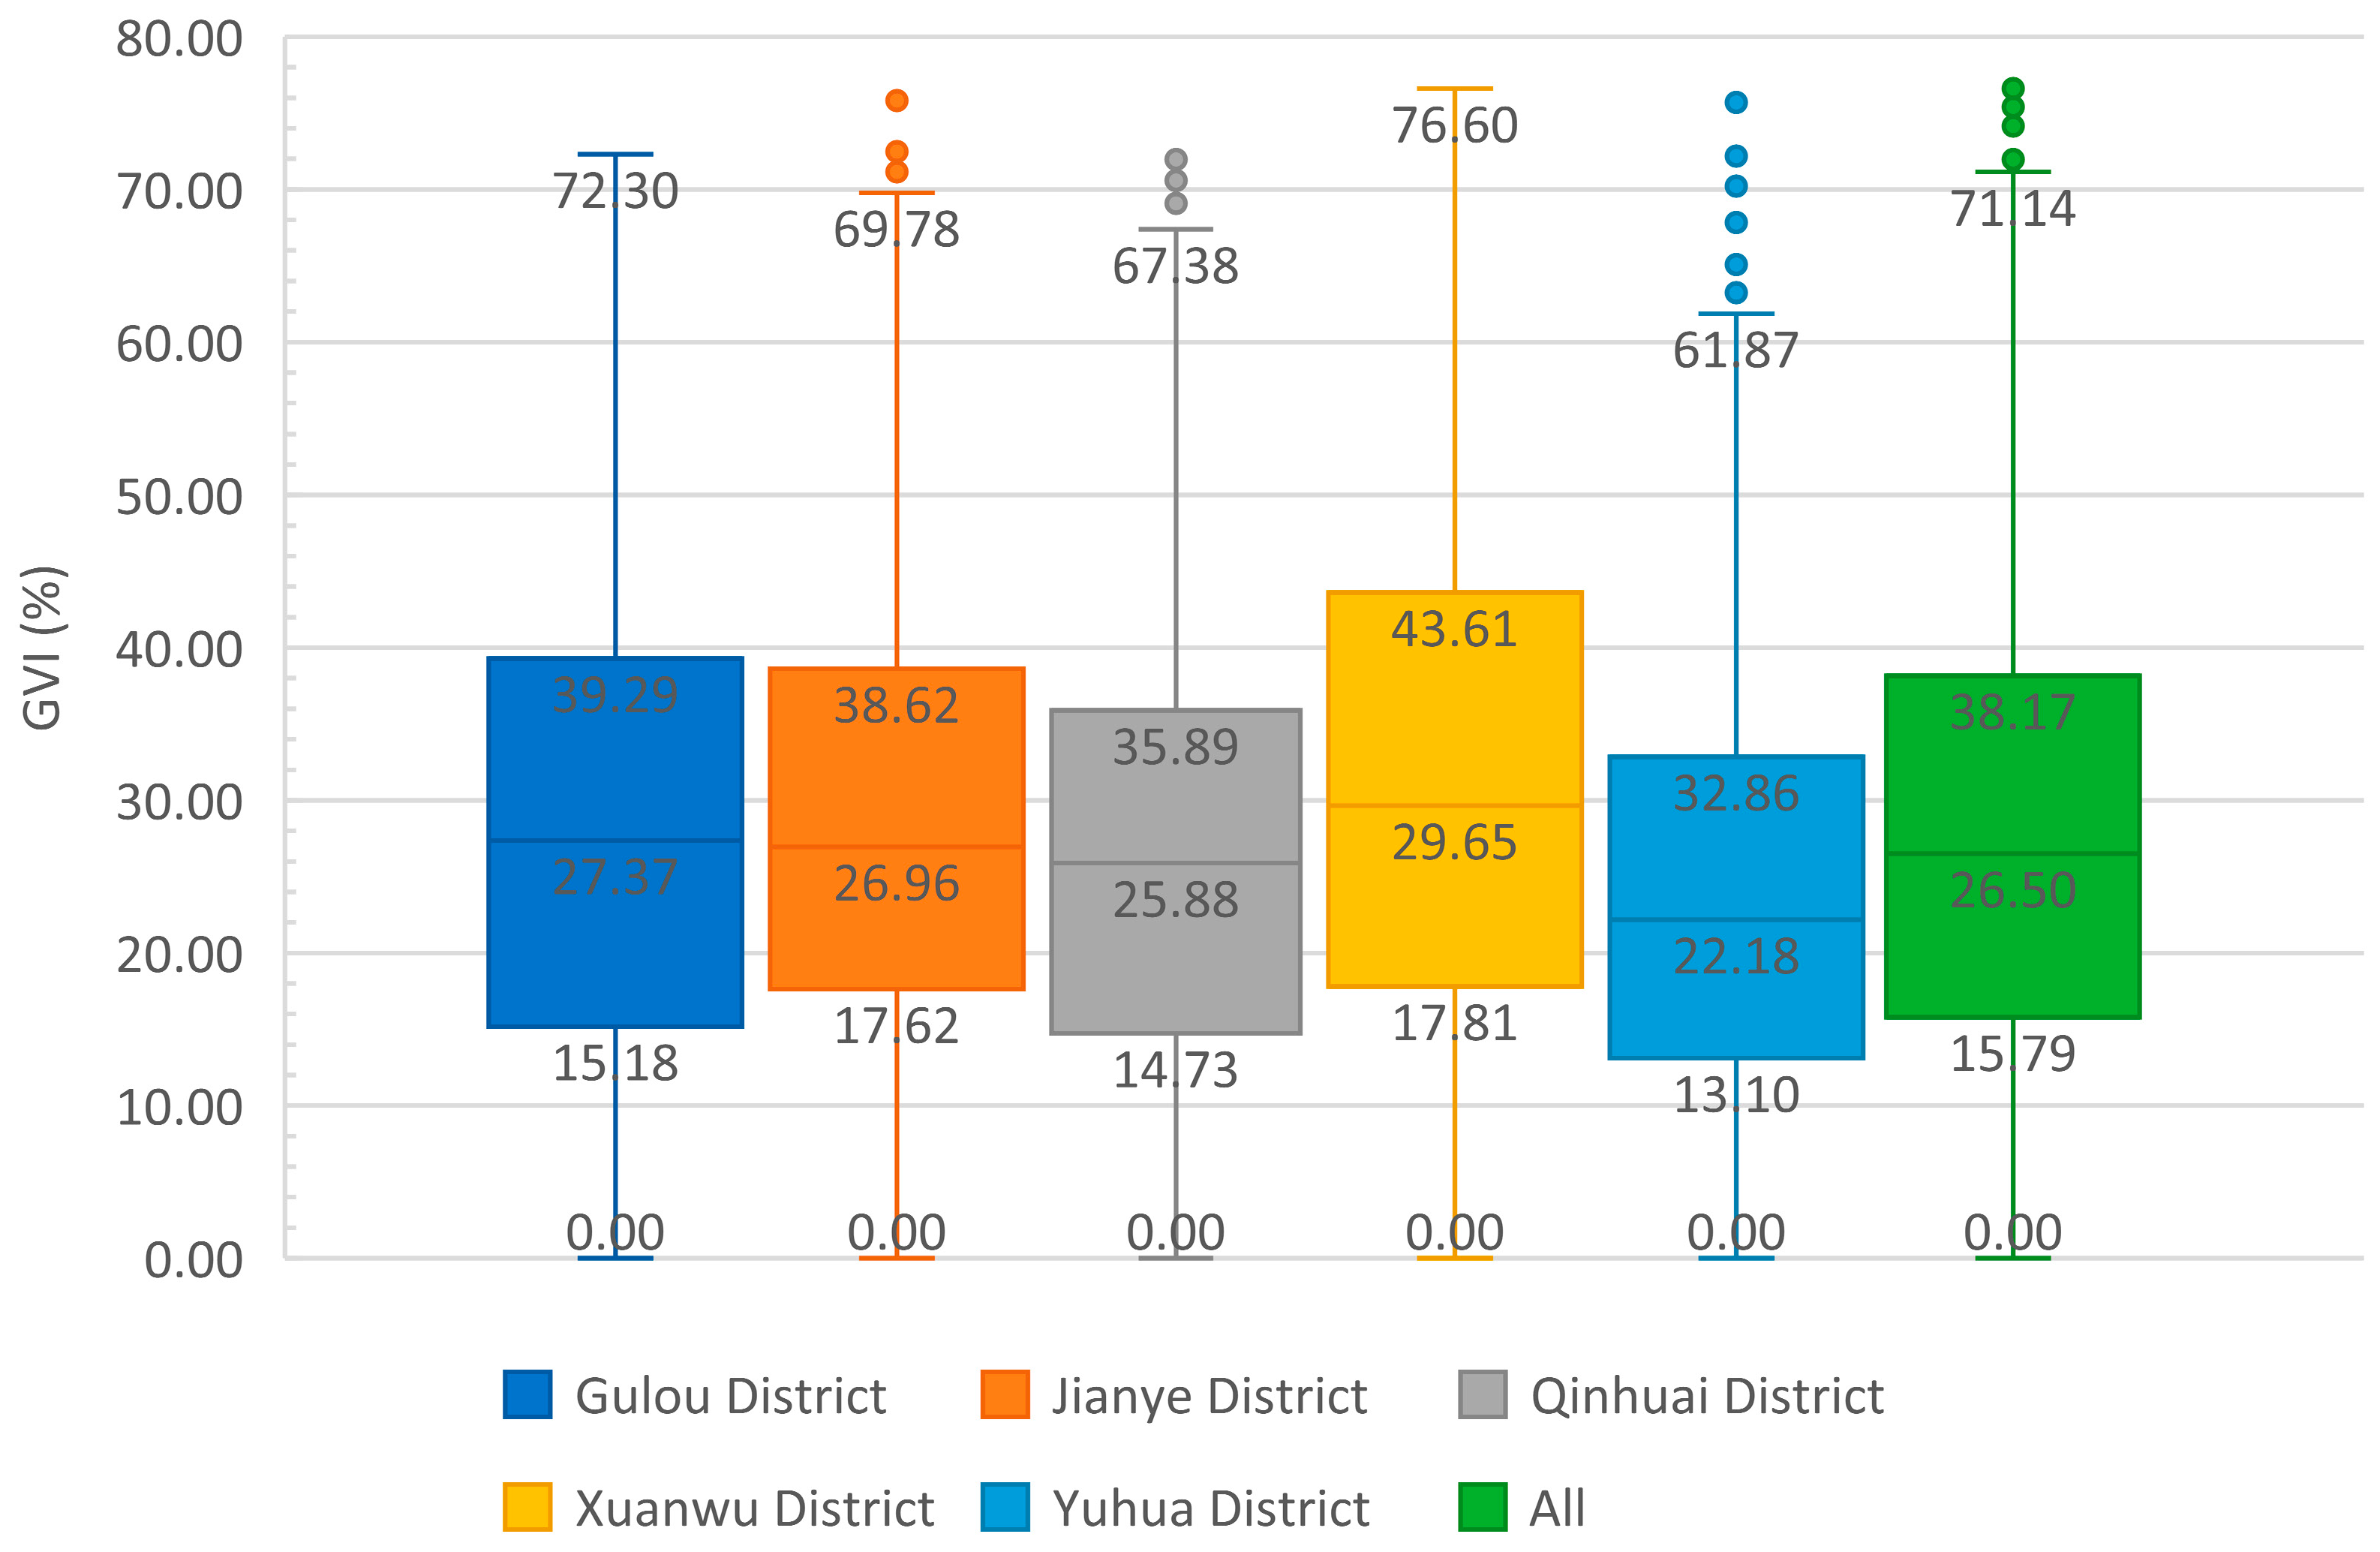
5.1. Street Greenery Visibility Analysis

Figure 5a illustrates the GVI values across various sampling points within the research area. This study conducted a statistical analysis of the GVI values across distinct zones. As demonstrated by the boxplot (Figure 6), the GVI values of the sampling points in the research area predominantly fall within the range of 15.79% to 38.17%, with a median value of 26.50%. Overall, the median values of street greening in the five zones are relatively consistent, varying between 22.18% and 29.65%. Specifically, the median GVI of the Xuanwu District’s street sampling points is at 29.65%, with lower and upper quartiles at 17.81% and 43.61%, respectively. In comparison to other regions, this area displays a relatively higher GVI among the sampling points. Conversely, the Yuhua District’s median GVI stands at 22.18%, with the majority of its sampling points ranging between 13.10% and 32.86%. In relative terms, this area demonstrates a comparatively lower GVI among the sampled points.
At the same time, the GVI value of each sampling point is associated with its corresponding adjacent street segment, so that the average GVI value of each street segment can be calculated. Furthermore, streets with available greening data were classified into three categories based on the volume of greening data: low, medium, and high green visibility streets (Figure 5b). Subsequent analysis within the research domain aimed to quantify the lengths of streets in different districts necessitating urgent greening enhancements. As outlined in Table 3, the Yuhua District demonstrates an average GVI value of 24.05%, with streets categorized as having low green visibility spanning a length of 286.53 km, indicative of inadequate greening conditions. In contrast, the Xuanwu District exhibits an average GVI of 30.75%, signifying a relatively superior greening environment compared to others.
If the urgency of street greening construction in the study area is based on the average level of street GVI value, Yuhua District and Qinhuai District emerge as the areas requiring immediate attention (Figure 5c). Similarly, when prioritizing based on the lowest level of the street GVI value, these two districts also rank as priorities for construction (Figure 5d).

5.2. Street Accessibility Analysis

Figure 7 presents the street accessibility across the five urban districts of Nanjing. This study assesses the road network accessibility in Nanjing’s research area using two analysis radii for daily walking and commuting. Within the 500 m radius, roads with higher accessibility concentrate primarily in the core urban regions characterized by shorter streets and a higher intersection density. Conversely, within the 5000 m radius, higher accessibility roads are evenly dispersed across the entire area, predominantly encompassing the main and secondary arteries traversing these districts. Both radii’s results suggest a differentiation in traffic potential concerning travel distances: shorter distances favor residential streets, commonly utilized for daily walking, while longer distances for commuting tend toward major express routes. Generally, pedestrian accessibility across the studied area’s streets remains relatively low. Certain zones within the central area display commendable pedestrian accessibility (Figure 7a). Additionally, Figure 7b highlights major highways and primary streets denoted with high accessibility (highlighted in red), while streets exhibiting lower accessibility, especially in the context of daily commuting, are depicted in blue.
In this study, the first one-third of street segments were classified as highly accessible streets based on their angular betweenness values. As detailed in Table 4, within the Xuanwu District, streets characterized by high pedestrian and commuting accessibility span lengths of 155.86 km and 249.15 km, respectively, accounting for 5.24% and 8.38% of the total street length analyzed. Similarly, in the Yuhua District, streets exhibiting high pedestrian and commuting accessibility encompass lengths of 89.3 km and 115.48 km, respectively, representing 3.00% and 3.88% of the total street length examined. In comparison, Xuanwu District and Gulou District exhibit relatively good levels of both walkability and vehicular accessibility (Figure 7c,d).

5.3. Combined Analyses between Visible Street Greenery and Street Accessibility

To unify pedestrian accessibility, commuting accessibility, and street greening values into a cohesive framework, these metrics are stratified into three levels based on street quantity: high, medium, and low. Spatial areas characterized by low greening but high accessibility fall under the primary level, while other areas exhibiting low greening are categorized into the secondary level, leaving the remainder of street spaces in the tertiary level. Figure 8a illustrates the landscape improvements in three levels of street greening, highlighted from red to blue. The primary level, frequently accessed yet lacking in street greening, denotes areas in urgent need of substantial greening landscape enhancement. Approximately 139.62 km of streets in the study area fall into the primary level, constituting 4.69% of the measured street length, while approximately 739.20 km are categorized as the secondary level, representing 24.85% of the measured street length (Table 5). Among these, the Gulou District features the longest length of spaces needing improvement in the primary level, totaling 38.93 km (1.31%), while the Jianye District showcases the shortest length requiring enhancement in the primary level, totaling 13.57 km (0.46%). The Yuhua District displays a higher length of secondary-level street spaces at 263.80 km (8.87%) compared to the secondary-level spaces in other districts.

5.4. Research Findings

This study highlights the importance of considering both street greening visibility and accessibility for a comprehensive understanding of urban green space distribution. An initial analysis of street greenery visibility reveals relatively favorable conditions in Xuanwu (29.65% median GVI) and Gulou (27.37% median GVI) Districts compared to Yuhua (22.18% median GVI). Therefore, solely based on the street GVI values, both Yuhua District and Qinhuai District emerge as areas urgently requiring street greening initiatives (Figure 5c,d). However, when considering accessibility, a contrasting picture emerges. Xuanwu (37.95 km) and Gulou (38.93 km) have the most primary-level streets in urgent need of greenery improvement, constituting 1.28% and 1.31% of the total, respectively. Conversely, Yuhua has a smaller proportion of streets needing improvement (22.73 km, 0.76%); under these conditions, Xuanwu District and Gulou District are areas that urgently need street greening construction (Figure 8b).
Despite favorable baseline greenery, Xuanwu and Gulou Districts, located in the city center, boast high accessibility due to their central location. In contrast, Yuhua’s streets lie primarily in the outskirts, resulting in lower daily accessibility. This explains why Yuhua, despite lower baseline greenery, requires less urgent improvement in the primary-level streets compared to the centrally located districts.
Based on these findings, prioritizing street greenery improvement in highly accessible areas with a low GVI is recommended. This approach maximizes the benefit of street greenery for residents in areas they frequent most easily and efficiently, ultimately creating a better balance between green visibility and accessibility. Meanwhile, it is worth noting that in densely populated urban spaces such as the main urban area of Nanjing, high-density urban construction limits the street space available for tree planting, resulting in high accessibility and limited visible street greening. Therefore, in the process of strengthening the urban greening landscape in the future and further improving road greening, other forms of urban greening can also be considered, such as integrating vertical greening on building facades.

6. Discussion

6.1. Fine-Grained Analysis of Human-Scale Greening Perception in Large-Scale Urban Areas

Previous practices and research in urban street greenery planning have often focused on field surveys or measurements of visible greenery, often within limited geographical areas such as neighborhoods [67,68]. With the advancement in large-scale remote sensing data, scholars have begun utilizing remote sensing imagery for greening assessments. While high-resolution images offer a useful tool for depicting green spaces at a fine level, objective greenness derived from remote sensing imagery often lacks consistency with human perception [69]. This inconsistency arises from the failure to consider the lateral view of green coverage, representing what people actually see from ground level, which directly relates to the benefits provided by street greening [9].
However, our study integrates large-scale urban street-level data collection with a human-centric perspective. We employ machine learning-based image semantic segmentation to accurately analyze the visibility of human-scale greenery perception within urban areas. In our research, the use of machine learning-based image semantic segmentation automates the extraction of green pixel information from street images, replacing traditional manual methods [70]. This innovation significantly enhances the efficiency of data collection and processing for measuring human-scale greenery perception. By utilizing street-level imagery, our approach captures greenery from a human-scale perspective, more accurately reflecting how people experience green spaces in their daily lives.
In conclusion, our study explores fine-grained analysis of human-scale greenery perception in large-scale urban areas, revealing the research potential of new data and methods.

6.2. Examining Actual Greening Perception in Daily Street Spaces at the Human Scale

The accessibility and interaction of urban greenery by individuals should be regarded as a key concern in sustainable urban planning, particularly in themes related to environmental justice and health [50,71]. Currently, significant research has been conducted on the geographical accessibility of green spaces such as parks and woodlands using GIS applications, focusing on metrics like shortest distance or travel time [72]. However, limited attention has been given to the accessibility of roadside vegetation, which constitutes a highly visible form of urban vegetation that many residents encounter and experience daily [73]. Moreover, in contrast to recent studies solely focused on street greening, some methodologies overlook the comprehensive analysis of everyday accessible public spaces and street greening visibility [25,74]. In contrast to recent studies solely focused on street greening, our approach integrates the visibility of street greening with street accessibility, quantifying the actual benefits of green landscapes experienced within the human realm. By overlaying street accessibility with greening values, the accuracy of estimating the real benefits to urban residents is enhanced, thereby providing valuable insights for evidence-based decision-making in urban planning and design practice.
Essentially, this study prioritizes an actionable approach to measure visible street greening associated with human behavior and experience. This method swiftly and directly quantifies the greenery encountered by residents in their daily lives. The practical application of this quantitative approach offers hope for decisionmakers and urban planners to effectively identify discrepancies in greening resources. This information informs the formulation of green space optimization policies that prioritize social equity. These policies target streets with high accessibility but low green visibility, aiming to enhance green levels and improve living environments. Such a strategic approach, besides preventing the gentrification of green spaces, also contributes to the development of human-centered livable societies. Therefore, integrating quantifiable visible greening requirements into urban zoning and design guidelines, as supplementary indicators, promotes street greening from a human-centered perspective.

6.3. Future Research and Limitations

Further research could explore the relationship between residents’ daily exposure to visible street greenery and their well-being, including environmental attitudes, social cohesion, physical activity, and psychological health. This knowledge can inform planning and policy-making to promote well-being, public health, and social equity by addressing unequal green space distribution and associated health risks. Ultimately, it fosters healthy urban planning practices.
Moreover, there are practical applications and extensions in both research content and methods. For cities with multi-year street image data, continuous monitoring of the greenery at different stages can be achieved through data comparison between different years, serving as an objective basis for urban construction and management decisions. In areas lacking databases like BSV, and in sensitive areas such as historical centers, panoramic cameras can be employed for data collection, followed by data processing and analysis using the mentioned technological methods to achieve similar analytical outcomes. Likewise, in the improvement in green landscapes in certain sensitive areas, local planning authorities should review these suggestions in conjunction with various other considerations, such as land availability, preservation of historical facilities, and transportation issues, to select suitable locations for design interventions aimed at increasing greenery.
Additionally, there are also some limitations in our study. Firstly, there are areas not covered by the street image database. Similarly, the distance set for data collection points in this study was 300 m. For urban environmental studies using finer-scale street-view images, smaller distance intervals could be considered, as different distance intervals can impact the precision of street greening data analysis.

7. Conclusions

The focus of this study lies in the integration of advanced techniques such as image semantic segmentation and spatial syntax to combine street greenery visibility with street accessibility. This study has two main characteristics: Firstly, a significant achievement of this study is the meticulous measurement and analysis of human-scale greenery perception across large urban regions. Leveraging machine learning-based image semantic segmentation, this research achieves the automated segmentation of a large number of street-view images. This approach facilitates the accurate calculation of street GVI with advantages such as scalability and cost-effectiveness, effectively addressing the time–cost challenges associated with large-scale urban analysis. Secondly, this study integrates street greenery visibility with street accessibility to explore the tangible benefits of green landscapes on a human perceptual scale. By overlaying street accessibility with greenery value, it enhances the accuracy of estimating actual benefits to urban residents. This approach provides a novel perspective for the fine assessment of street greenery in barrier-free urban spaces. We aimed to balance fairness and efficiency in urban planning by comprehensively considering street accessibility and greenery visibility, thereby swiftly enhancing the visibility of green spaces in streets frequented by residents in the most efficient and cost-effective manner.
This study provides a prioritized strategy for enhancing street greening, offering valuable guidance to urban planners and policymakers for targeted interventions in critical areas. Informed by a thorough analysis of accessibility and visibility, these interventions encompass several key approaches: The implementation of targeted greening initiatives in areas characterized by high accessibility but limited green visibility is proposed. This approach is aimed at optimizing the distribution of urban green spaces and fostering residents’ well-being. Additionally, the integration of quantifiable visible greening criteria into urban zoning and design guidelines is recommended. This integration emphasizes a human-centered perspective, thereby promoting street greening effectively. Overall, these urban planning strategies are anticipated to effectively enhance urban green space planning, optimize urban space utilization, and elevate residents’ quality of life in the research area.
Future research efforts could emphasize several key areas. Firstly, investigating the correlation between residents’ exposure to visible street greenery and diverse dimensions of well-being, including environmental attitudes, social cohesion, and psychological health, would provide valuable insights. Secondly, exploring the potential of emerging technologies, such as panoramic cameras and machine learning algorithms, for ongoing monitoring of street greening and its influence on urban environments holds promise for advancing our understanding. Lastly, assessing the effectiveness of various greening interventions in improving urban livability and promoting social equity would be instrumental in guiding future urban planning endeavors.
In summary, this study not only advances our understanding of human-scale greening perception in urban areas but also provides practical guidance for urban planning and design practices. By synthesizing our findings and offering precise recommendations, we aim to contribute to the development of sustainable and livable cities.

Author Contributions

Conceptualization, Z.W. and Y.Q.; methodology, Z.W.; software, Z.W. and Y.L.; validation, Z.W., K.X. and Y.Q.; writing—original draft preparation, Z.W. and X.Z.; visualization, K.X.; supervision, Y.Q.; project administration, Z.W.; funding acquisition, Z.W. All authors have read and agreed to the published version of the manuscript.

Funding

This research was funded by Social Science Foundation of Jiangsu Province, grant number 23SHC002; Natural Science Foundation of Jiangsu Province, grant number BK20201359; and Science and Technology Plan Project of Jiangsu Provincial Department of Housing and Urban Rural Development, grant number 2019ZD007.

Data Availability Statement

The presented data are shown in this paper; more details are available from the corresponding author.

Acknowledgments

We are grateful to the editors and reviewers for their help and invaluable suggestions on our manuscript, which have significantly enhanced the quality of our work.

Conflicts of Interest

The authors declare no conflicts of interest.

References

  1. Soga, M.; Evans, M.J.; Tsuchiya, K.; Fukano, Y. A room with a green view: The importance of nearby nature for mental health during the COVID-19 pandemic. Ecol. Appl. 2021, 31, e2248. [Google Scholar] [CrossRef] [PubMed]
  2. Nutsford, D.; Pearson, A.L.; Kingham, S. An ecological study investigating the association between access to urban green space and mental health. Public Health 2013, 127, 1005–1011. [Google Scholar] [CrossRef] [PubMed]
  3. Liotta, C.; Kervinio, Y.; Levrel, H.; Tardieu, L. Planning for environmental justice—Reducing well-being inequalities through urban greening. Environ. Sci. Policy 2020, 112, 47–60. [Google Scholar] [CrossRef]
  4. Williams, T.G.; Logan, T.M.; Zuo, C.T.; Liberman, K.D.; Guikema, S.D. Parks and safety: A comparative study of green space access and inequity in five US cities. Landsc. Urban Plan. 2020, 201, 103841. [Google Scholar] [CrossRef]
  5. Pearsall, H.; Eller, J.K. Locating the green space paradox: A study of gentrification and public green space accessibility in Philadelphia, Pennsylvania. Landsc. Urban Plan. 2020, 195, 103708. [Google Scholar] [CrossRef]
  6. Ishikawa, N.; Fukushige, M. Effects of street landscape planting and urban public parks on dwelling environment evaluation in Japan. Urban For. Urban Green. 2012, 11, 390–395. [Google Scholar] [CrossRef]
  7. Stessens, P.; Khan, A.Z.; Huysmans, M.; Canters, F. Analysing urban green space accessibility and quality: A GIS-based model as spatial decision support for urban ecosystem services in Brussels. Ecosyst. Serv. 2017, 28, 328–340. [Google Scholar] [CrossRef]
  8. Cetin, M. Using GIS analysis to assess urban green space in terms of accessibility: Case study in Kutahya. Int. J. Sustain. Dev. World Ecol. 2015, 22, 420–424. [Google Scholar] [CrossRef]
  9. Yang, J.; Zhao, L.; Mcbride, J.; Gong, P. Can you see green? Assessing the visibility of urban forests in cities. Landsc. Urban Plan. 2009, 91, 97–104. [Google Scholar] [CrossRef]
  10. Kang, Y.; Fukahori, K.; Kubota, Y. Evaluation of the influence of roadside non-walking spaces on the pedestrian environment of a Japanese urban street. Sustain. Cities Soc. 2018, 43, 21–31. [Google Scholar] [CrossRef]
  11. Hu, T.; Wei, D.; Su, Y.; Wang, X.; Zhang, J.; Sun, X.; Liu, Y.; Guo, Q. Quantifying the shape of urban street trees and evaluating its influence on their aesthetic functions based on mobile lidar data. ISPRS J. Photogramm. Remote Sens. 2022, 184, 203–214. [Google Scholar] [CrossRef]
  12. Kowe, P.; Mutanga, O.; Dube, T. Advancements in the remote sensing of landscape pattern of urban green spaces and vegetation fragmentation. Int. J. Remote Sens. 2021, 42, 3797–3832. [Google Scholar] [CrossRef]
  13. Degerickx, J.; Hermy, M.; Somers, B. Mapping functional urban green types using high resolution remote sensing data. Sustainability 2020, 12, 2144. [Google Scholar] [CrossRef]
  14. Less, E.L.; McKee, P.; Toomey, T.; Nelson, T.; Erickson, D.; Xiong, S.; Jones-Webb, R. Matching study areas using Google Street View: A new application for an emerging technology. Eval. Program Plann. 2015, 53, 72–79. [Google Scholar] [CrossRef]
  15. He, N.; Li, G. Urban neighbourhood environment assessment based on street view image processing: A review of research trends. Environ. Chall. 2021, 4, 100090. [Google Scholar] [CrossRef]
  16. Li, X.; Zhang, C.; Li, W.; Ricard, R.; Meng, Q.; Zhang, W. Assessing street-level urban greenery using Google Street View and a modified green view index. Urban For. Urban Green. 2015, 14, 675–685. [Google Scholar] [CrossRef]
  17. Neis, P.; Zielstra, D. Recent developments and future trends in volunteered geographic information research: The case of OpenStreetMap. Future Internet 2014, 6, 76–106. [Google Scholar] [CrossRef]
  18. Lu, Y. Using Google Street View to investigate the association between street greenery and physical activity. Landsc. Urban Plan. 2019, 191, 103435. [Google Scholar] [CrossRef]
  19. Francis, J.; Disney, M.; Law, S. Monitoring canopy quality and improving equitable outcomes of urban tree planting using LiDAR and machine learning. Urban For. Urban Green. 2023, 89, 128115. [Google Scholar] [CrossRef]
  20. Schick, M.; Griffin, R.; Cherrington, E.; Sever, T. Utilizing LiDAR to quantify aboveground tree biomass within an urban university. Urban For. Urban Green. 2023, 89, 128098. [Google Scholar] [CrossRef]
  21. Wei, X.; Hu, M.; Wang, X.-J. The differences and influence factors in extracting urban green space from various resolutions of data: The perspective of blocks. Remote Sens. 2023, 15, 1261. [Google Scholar] [CrossRef]
  22. Sarkar, C.; Webster, C.; Pryor, M.; Tang, D.; Melbourne, S.; Zhang, X.; Jianzheng, L. Exploring associations between urban green, street design and walking: Results from the Greater London boroughs. Landsc. Urban Plan. 2015, 143, 112–125. [Google Scholar] [CrossRef]
  23. Hipp, J.R.; Lee, S.; Ki, D.; Kim, J.H. Measuring the built environment with Google Street View and machine learning: Consequences for crime on street segments. J. Quant. Criminol. 2022, 38, 537–565. [Google Scholar] [CrossRef]
  24. Liu, Y.; Pan, X.; Liu, Q.; Li, G. Establishing a reliable assessment of the green view index based on image classification techniques, estimation, and a hypothesis testing route. Land 2023, 12, 1030. [Google Scholar] [CrossRef]
  25. Chen, X.; Meng, Q.; Hu, D.; Zhang, L.; Yang, J. Evaluating greenery around streets using baidu panoramic street view images and the panoramic green view index. Forests 2019, 10, 1109. [Google Scholar] [CrossRef]
  26. Kerckhoffs, J.; Khan, J.; Hoek, G.; Yuan, Z.; Hertel, O.; Ketzel, M.; Jensen, S.S.; Al Hasan, F.; Meliefste, K.; Vermeulen, R. Hyperlocal variation of nitrogen dioxide, black carbon, and ultrafine particles measured with Google Street View cars in Amsterdam and Copenhagen. Environ. Int. 2022, 170, 107575. [Google Scholar] [CrossRef] [PubMed]
  27. Deng, M.; Yang, W.; Chen, C.; Wu, Z.; Liu, Y.; Xiang, C. Street-level solar radiation mapping and patterns profiling using Baidu Street View images. Sustain. Cities Soc. 2021, 75, 103289. [Google Scholar] [CrossRef]
  28. Herfort, B.; Lautenbach, S.; Porto de Albuquerque, J.; Anderson, J.; Zipf, A. A spatio-temporal analysis investigating completeness and inequalities of global urban building data in OpenStreetMap. Nat. Commun. 2023, 14, 3985. [Google Scholar] [CrossRef] [PubMed]
  29. Grinberger, A.Y.; Schott, M.; Raifer, M.; Zipf, A. An analysis of the spatial and temporal distribution of large-scale data production events in OpenStreetMap. Trans. GIS 2021, 25, 622–641. [Google Scholar] [CrossRef]
  30. Wang, R.; Yuan, Y.; Liu, Y.; Zhang, J.; Liu, P.; Lu, Y.; Yao, Y. Using street view data and machine learning to assess how perception of neighborhood safety influences urban residents’ mental health. Health Place 2019, 59, 102186. [Google Scholar] [CrossRef] [PubMed]
  31. Wei, J.; Yue, W.; Li, M.; Gao, J. Mapping human perception of urban landscape from street-view images: A deep-learning approach. Int. J. Appl. Earth Obs. Geoinf. 2022, 112, 102886. [Google Scholar] [CrossRef]
  32. Guo, Y.; Liu, Y.; Georgiou, T.; Lew, M.S. A review of semantic segmentation using deep neural networks. Int. J. Multimed. Inf. Retr. 2018, 7, 87–93. [Google Scholar] [CrossRef]
  33. Feng, S.; Chen, L.; Sun, R.; Feng, Z.; Li, J.; Khan, M.S.; Jing, Y. The distribution and accessibility of urban parks in Beijing, China: Implications of social equity. Int. J. Environ. Res. Public Health 2019, 16, 4894. [Google Scholar] [CrossRef]
  34. Zhang, R.; Peng, S.; Sun, F.; Deng, L.; Che, Y. Assessing the social equity of urban parks: An improved index integrating multiple quality dimensions and service accessibility. Cities 2022, 129, 103839. [Google Scholar] [CrossRef]
  35. Ekkel, E.D.; De Vries, S. Nearby green space and human health: Evaluating accessibility metrics. Landsc. Urban Plan. 2017, 157, 214–220. [Google Scholar] [CrossRef]
  36. Guo, S.; Song, C.; Pei, T.; Liu, Y.; Ma, T.; Du, Y.; Chen, J.; Fan, Z.; Tang, X.; Peng, Y.; et al. Accessibility to urban parks for elderly residents: Perspectives from mobile phone data. Landsc. Urban Plan. 2019, 191, 103642. [Google Scholar] [CrossRef]
  37. Biernacka, M.; Kronenberg, J.; Łaszkiewicz, E. An integrated system of monitoring the availability, accessibility and attractiveness of urban parks and green squares. Appl. Geogr. 2020, 116, 102152. [Google Scholar] [CrossRef]
  38. Dai, D. Racial/ethnic and socioeconomic disparities in urban green space accessibility: Where to intervene? Landsc. Urban Plan. 2011, 102, 234–244. [Google Scholar] [CrossRef]
  39. Guo, K.; Cao, Y. Application of planning evaluation of historical block based on space syntax—Case study: Third Streets and Two Alleys historical block, Nanning. IOP Conf. Ser. Earth Environ. Sci. 2021, 768, 012139. [Google Scholar] [CrossRef]
  40. Jiang, B.; Claramunt, C.; Klarqvist, B. Integration of space syntax into GIS for modelling urban spaces. Int. J. Appl. Earth Obs. Geoinf. 2000, 2, 161–171. [Google Scholar] [CrossRef]
  41. Alalouch, C.; Al-Hajri, S.; Naser, A.; Al Hinai, A. The impact of space syntax spatial attributes on urban land use in Muscat: Implications for urban sustainability. Sustain. Cities Soc. 2019, 46, 101417. [Google Scholar] [CrossRef]
  42. Hua, J.; Cai, M.; Shi, Y.; Ren, C.; Xie, J.; Chung, L.C.H.; Lu, Y.; Chen, L.; Yu, Z.; Webster, C. Investigating pedestrian-level greenery in urban forms in a high-density city for urban planning. Sustain. Cities Soc. 2022, 80, 103755. [Google Scholar] [CrossRef]
  43. Ma, F. Spatial equity analysis of urban green space based on spatial design network analysis (sDNA): A case study of central Jinan, China. Sustain. Cities Soc. 2020, 60, 102256. [Google Scholar] [CrossRef]
  44. Cooper, C.H.V.; Fone, D.L.; Chiaradia, A.J.F. Measuring the impact of spatial network layout on community social cohesion: A cross-sectional study. Int. J. Health Geogr. 2014, 13, 11. [Google Scholar] [CrossRef] [PubMed]
  45. Kang, C.-D. Measuring the effects of street network configurations on walking in Seoul, Korea. Cities 2017, 71, 30–40. [Google Scholar] [CrossRef]
  46. Miralles-Guasch, C.; Dopico, J.; Delclòs-Alió, X.; Knobel, P.; Marquet, O.; Maneja-Zaragoza, R.; Schipperijn, J.; Vich, G. Natural landscape, infrastructure, and health: The physical activity implications of urban green space composition among the elderly. Int. J. Environ. Res. Public Health 2019, 16, 3986. [Google Scholar] [CrossRef] [PubMed]
  47. Haaland, C.; Van Den Bosch, C.K. Challenges and strategies for urban green-space planning in cities undergoing densification: A review. Urban For. Urban Green. 2015, 14, 760–771. [Google Scholar] [CrossRef]
  48. Wolch, J.R.; Byrne, J.; Newell, J.P. Urban green space, public health, and environmental justice: The challenge of making cities ‘just green enough’. Landsc. Urban Plan. 2014, 125, 234–244. [Google Scholar] [CrossRef]
  49. Niemelä, J. Ecology and urban planning. Biodivers. Conserv. 1999, 8, 119–131. [Google Scholar] [CrossRef]
  50. Northridge, M.E.; Freeman, L. Urban planning and health equity. J. Urban Health 2011, 88, 582–597. [Google Scholar] [CrossRef]
  51. Panagopoulos, T.; Tampakis, S.; Karanikola, P.; Karipidou-Kanari, A.; Kantartzis, A. The usage and perception of pedestrian and cycling streets on residents’ well-being in Kalamaria, Greece. Land 2018, 7, 100. [Google Scholar] [CrossRef]
  52. Wey, W.M.; Wei, W.L. Urban street environment design for quality of urban life. Soc. Indic. Res. 2016, 126, 161–186. [Google Scholar] [CrossRef]
  53. Wright Wendel, H.E.; Zarger, R.K.; Mihelcic, J.R. Accessibility and usability: Green space preferences, perceptions, and barriers in a rapidly urbanizing city in Latin America. Landsc. Urban Plan. 2012, 107, 272–282. [Google Scholar] [CrossRef]
  54. Garcia-Garcia, A.; Orts-Escolano, S.; Oprea, S.; Villena-Martinez, V.; Martinez-Gonzalez, P.; Garcia-Rodriguez, J. A survey on deep learning techniques for image and video semantic segmentation. Appl. Soft Comput. 2018, 70, 41–65. [Google Scholar] [CrossRef]
  55. Jiang, B.; Claramunt, C.; Batty, M. Geometric accessibility and geographic information: Extending desktop GIS to space syntax. Comput. Environ. Urban Syst. 1999, 23, 127–146. [Google Scholar] [CrossRef]
  56. Luo, J.; Wei, Y.H.D. Modeling spatial variations of urban growth patterns in Chinese cities: The case of Nanjing. Landsc. Urban Plan. 2009, 91, 51–64. [Google Scholar] [CrossRef]
  57. Xu, C.; Liu, M.; Zhang, C.; An, S.; Yu, W.; Chen, J.M. The spatiotemporal dynamics of rapid urban growth in the Nanjing metropolitan region of China. Landsc. Ecol. 2007, 22, 925–937. [Google Scholar] [CrossRef]
  58. Wu, Z.; Cheng, S.; Xu, K.; Qian, Y. Ecological network resilience evaluation and ecological strategic space identification based on complex network theory: A case study of Nanjing city. Ecol. Indic. 2024, 158, 111604. [Google Scholar] [CrossRef]
  59. Lateef, F.; Ruichek, Y. Survey on semantic segmentation using deep learning techniques. Neurocomputing 2019, 338, 321–348. [Google Scholar] [CrossRef]
  60. Long, J.; Shelhamer, E.; Darrell, T. Fully convolutional networks for semantic segmentation. IEEE Trans. Pattern Anal. 2017, 4, 640–651. [Google Scholar]
  61. Badrinarayanan, V.; Kendall, A.; Cipolla, R. SegNet: A deep convolutional encoder-decoder architecture for image segmentation. IEEE Trans. Pattern Anal. Mach. Intell. 2017, 39, 2481–2495. [Google Scholar] [CrossRef] [PubMed]
  62. Zhao, H.; Shi, J.; Qi, X.; Wang, X.; Jia, J. Pyramid scene parsing network. In Proceedings of the 2017 IEEE Conference on Computer Vision and Pattern Recognition (CVPR), Honolulu, HI, USA, 21–26 July 2017; pp. 6230–6239. [Google Scholar]
  63. Hao, S.; Zhou, Y.; Guo, Y. A brief survey on semantic segmentation with deep learning. Neurocomputing 2020, 406, 302–321. [Google Scholar] [CrossRef]
  64. Teklenburg, J.A.F.; Timmermans, H.J.P.; Wagenberg, A.F.V. Space syntax: Standardised integration measures and some simulations. Environ. Plan. B Plan. Des. 1993, 20, 347–357. [Google Scholar] [CrossRef]
  65. Hillier, B.; Iida, S. Network and Psychological Effects in Urban Movement. In Proceedings of the 2005 International Conference on Spatial Information Theory, Ellicottville, NY, USA, 14–18 September 2005; Springer: Berlin/Heidelberg, Germany, 2005; pp. 475–490. [Google Scholar]
  66. Cooper, C.H.V.; Chiaradia, A.J.F. sDNA: 3-d spatial network analysis for GIS, CAD, Command Line & Python. SoftwareX 2020, 12, 100525. [Google Scholar]
  67. Ellaway, A.; Macintyre, S.; Bonnefoy, X. Graffiti, greenery, and obesity in adults: Secondary analysis of European cross sectional survey. BMJ 2005, 331, 611–612. [Google Scholar] [CrossRef]
  68. Hoehner, C.M.; Brennan Ramirez, L.K.; Elliott, M.B.; Handy, S.L.; Brownson, R.C. Perceived and objective environmental measures and physical activity among urban adults. Am. J. Prev. Med. 2005, 28, 105–116. [Google Scholar] [CrossRef]
  69. Jiang, B.; Deal, B.; Pan, H.; Larsen, L.; Hsieh, C.-H.; Chang, C.-Y.; Sullivan, W.C. Remotely-sensed imagery vs. eye-level photography: Evaluating associations among measurements of tree cover density. Landsc. Urban Plan. 2017, 157, 270–281. [Google Scholar] [CrossRef]
  70. Nordh, H.; Hartig, T.; Hagerhall, C.M.; Fry, G. Components of small urban parks that predict the possibility for restoration. Urban For. Urban Green. 2009, 8, 225–235. [Google Scholar] [CrossRef]
  71. La Rosa, D. Accessibility to greenspaces: GIS based indicators for sustainable planning in a dense urban context. Ecol. Indic. 2014, 42, 122–134. [Google Scholar] [CrossRef]
  72. Gupta, K.; Roy, A.; Luthra, K.; Maithani, S. Mahavir GIS based analysis for assessing the accessibility at hierarchical levels of urban green spaces. Urban For. Urban Green. 2016, 18, 198–211. [Google Scholar] [CrossRef]
  73. Tan, P.Y.; Wang, J.; Sia, A. Perspectives on five decades of the urban greening of Singapore. Cities 2013, 32, 24–32. [Google Scholar] [CrossRef]
  74. Long, Y.; Liu, L. How green are the streets? An analysis for central areas of Chinese cities using Tencent Street View. PLoS ONE 2017, 12, e0171110. [Google Scholar] [CrossRef] [PubMed]
Figure 1. Location of the study area.
Forests 15 00561 g001
Figure 2. Research flow.
Forests 15 00561 g002
Figure 3. Sampling points across the street network of research area.
Forests 15 00561 g003
Figure 4. Sampling point BSV collection and image semantic segmentation.
Forests 15 00561 g004
Figure 5. The analysis of street greenery in the research area. (a) Green view index of each BSV point; (b) classifying street greenery as high, medium, and low values; (c) urgent sequence of street green space construction—according to the average GVI; (d) urgent sequence of street green space construction—according to the lowest GVI.
Forests 15 00561 g005
Figure 6. The box diagram of GVI value in the research area.
Forests 15 00561 g006
Figure 7. The analysis of street accessibility at both the daily pedestrian and commuting scales. (a) Street accessibility in the radius of pedestrian distance; (b) street accessibility in the radius of commuting distance; (c) sequence of streets with high pedestrian accessibility proportion; (d) sequence of streets with high commuting accessibility proportion.
Forests 15 00561 g007
Figure 8. Identifying the street levels and urgent sequence of street green space construction for enhancing urban greening efforts. (a) The street levels for enhancing urban greening efforts; (b) the urgent sequence of street green space construction.
Forests 15 00561 g008
Table 1. Data sources.
Data NameData Source
Administrative Boundary Shapefile Datahttps://www.resdc.cn/ (accessed on 15 July 2022)
Road Shapefile Datahttps://www.openstreetmap.org/ (accessed on 15 July 2022)
Baidu Street Viewhttps://lbsyun.baidu.com/ (accessed on 15 July 2022)
Table 2. Key parameters in Baidu API.
ParameterDescriptionParameter Setting
API KeyDeveloper’s key (Baidu API key)key = our API key
LocationCoordinates of sampling point location example location = 118.672277, 31.928494
FovHorizontal angle of view of the BSV imagefov = 90, 180, 270, 360
PitchVertical angle of view of the BSV imagepitch = 10
Table 3. The GVI statistical table of the streets in the research area.
AreaAverage GVI (%)Total Length of Street (km)Street Length with Low GVI (km)Proportion of Street Length with Low GVI (%)
Gulou District27.85436.94140.624.73
Jianye District28.87718.76160.665.40
Qinhuai District26.25477.58154.255.19
Xuanwu District30.75524.4136.764.60
Yuhua District24.05816.43286.539.63
All27.742974.11878.8229.55
Table 4. The statistics table of high accessibility streets.
AreaHigh Pedestrian Accessibility StreetsHigh Commuting Accessibility Streets
Length (km)Proportion (%)Length (km)Proportion (%)
Gulou District135.64.56227.867.66
Jianye District100.233.37178.846.01
Qinhuai District126.14.24202.366.80
Xuanwu District155.865.24249.158.38
Yuhua District89.33.00115.483.88
All607.0920.41973.6932.74
Table 5. The statistics table of the street levels for enhancing urban greening efforts.
AreaThe Primary LevelThe Secondary LevelThe Tertiary Level
Length (km)Proportion (%)Length (km)Proportion (%)Length (km)Proportion (%)
Gulou District38.931.31101.69 3.42296.329.96
Jianye District13.570.46147.09 4.95558.118.77
Qinhuai District26.440.89127.81 4.30323.3310.87
Xuanwu District37.951.2898.81 3.32387.6413.03
Yuhua District22.730.76263.80 8.87529.917.82
All139.624.69739.20 24.852095.2970.45
Disclaimer/Publisher’s Note: The statements, opinions and data contained in all publications are solely those of the individual author(s) and contributor(s) and not of MDPI and/or the editor(s). MDPI and/or the editor(s) disclaim responsibility for any injury to people or property resulting from any ideas, methods, instructions or products referred to in the content.

