Article

Effects of Different Management Measures on Carbon Stocks and Soil Carbon Stocks in Moso Bamboo Forests: Meta-Analysis and Control Experiment

1
College of Environmental and Resources Science, Zhejiang A&F University, Hangzhou 311300, China
2
State Key Laboratory of Subtropical Silviculture, Zhejiang A&F University, Hangzhou 311300, China
3
Zhejiang Province Key Think Tank, Institute of Ecological Civilization, Zhejiang A&F University, Hangzhou 311300, China
4
Key Laboratory of Carbon Cycling in Forest Ecosystems and Carbon Sequestration of Zhejiang Province, Zhejiang A&F University, Hangzhou 311300, China
5
College of Forestry and Biotechnology, Zhejiang A&F University, Hangzhou 311300, China
6
Jianxing Honors College, Zhejiang University of Technology, Hangzhou 310023, China
7
College of Mathematics and Computer Science, Zhejiang A&F University, Hangzhou 311300, China
*
Author to whom correspondence should be addressed.
Forests 2024, 15(3), 496; https://doi.org/10.3390/f15030496
Submission received: 23 January 2024 / Revised: 4 March 2024 / Accepted: 5 March 2024 / Published: 7 March 2024

Abstract

:
As a crucial forest resource in southern China and a significant economic forest species for forestry production, moso bamboo has a notable influence on carbon stocks across the entire bamboo forest ecosystem. Studying the impact of different management measures on carbon stocks in moso bamboo forests and soil carbon stocks can assist bamboo forest operators in incorporating the carbon sequestration capacity of bamboo into forest production and management decisions, which can contribute to achieving carbon sequestration, emission reduction, and sustainable development in the decision-making processes of forest production and management. In this study, we utilized a randomized block design to investigate the changes in moso bamboo forests’ carbon stocks and soil carbon stocks under different management measures across three intensities: high-intensity intensive management (HT), moderate-intensity intensive management (MT), and regular management (CK). Additionally, we employed meta-analysis methods to enhance the accuracy of our conclusions. The experimental results showed that MT increased the carbon storage in moso bamboo forests by 19.86%, which was significantly different from CK (p < 0.05), while there was no significant difference between the HT group and the MT and CK groups. For soil carbon stocks, in the 10–30 m and 0–50 m soil layers, HT decreased soil carbon storage by 29.89% and 22.38%, while MT increased soil carbon storage by 64.15% and 31.02%, respectively. Both HT and MT were significantly different from CK (p < 0.05). However, for the soil layers of 0–10 m and 30–50 m, there was no significant difference between the treatments within the experimental group. The results of the meta-analysis indicate that, compared to traditional regular management, intensive management, especially high-intensity intensive management, can significantly increase the carbon storage in bamboo forests (p < 0.05). However, it will significantly reduce soil carbon storage (p < 0.05). Moreover, a significant difference in soil carbon storage is observed only within the 0–20 cm soil layer group. Therefore, from the perspective of the long-term ecological benefits of bamboo forest management, the selection of management measures should prioritize reasonable and moderate-intensity intensive management. Additionally, adopting appropriate and moderate-intensity fertilization, ploughing, and other management methods is recommended to enhance the productivity of moso bamboo forests while concurrently protecting the natural environment and improving the carbon sequestration capacity of moso bamboo forests.

1. Introduction

In recent years, the global discourse on climate change and environmental conservation has been intensifying. In March 2023, the Synthesis Report of the Sixth Assessment Report (AR6) from the United Nations Intergovernmental Panel on Climate Change (IPCC) comprehensively delineated the current state of climate change. The report explicitly underscored that human activities constitute a substantial contributing factor to the sustained escalation of global warming [1,2]. From 2011 to 2020, the global surface temperature rose by 1.1 °C, compared to the period from 1850 to 1900. In 2019, global net greenhouse gas emissions experienced a significant rise, increasing by 12% compared to the levels recorded in 2010, registering a substantial 54% surge compared to the levels of 1990 [3]. The imperative to curtail carbon content in the atmosphere and alleviate climate change is pressing. Forest ecosystems, constituting the primary component of terrestrial ecosystems, represent the most extensive carbon reservoir among Earth’s terrestrial ecosystems [4,5], boasting significant potential for emission reduction [6]. The forest carbon pool comprises the vegetation carbon pool, litter fall carbon pool, and soil carbon pool, playing a distinctive role in regulating atmospheric greenhouse gas concentrations and addressing climate change [7]. International measures aimed at safeguarding forests have been proposed, with REDD+ emerging as a frontrunner in global climate change mitigation strategies [8]. As a prominent forest type, bamboo forests hold substantial economic and ecological value, concurrently functioning as a reliable carbon sink throughout the entire year [9,10].
Moso bamboo (Phyllostachys heterocycla) constitutes a vital forest resource in southern China, with a bamboo coverage exceeding 6.01 million hectares, representing 74% of the total bamboo forest area in China [11]. The investigation into the carbon sequestration and sink enhancement potentials of bamboo forest ecosystems holds considerable scientific significance [12,13]. Moso bamboo exhibits a broad and extensive distribution range, characterized by a rapid growth rate that enables alternating-year harvests and perpetual utilization [14]. Moreover, moso bamboo demonstrates a robust carbon sequestration capacity, playing a pivotal role in mitigating climate change [15]. In recent years, there has been a growing global research focus on carbon sinks in bamboo forests, drawing increasing attention from scholars [16]. In this context, research on the management measures of moso bamboo forests has been initiated. Lacerda, A.E.B. [17], conducted a comparative study of forest dynamics over a 14-year period, analyzing the development of unmanaged bamboo forests and the effects of bamboo removal in Southern Brazil. The study presented a direct analysis of the influence of bamboo on forest succession. Ma et al. [18] investigated the variations in soil organic carbon in moso bamboo forests during the summer. They pointed out that under intensive management, moso bamboo forests can be effectively managed by integrating bamboo forest management techniques, including soil reclamation, weeding, judicious bamboo plant retention, and harvesting. These measures contribute to enhancing soil quality and achieving the sustainable management of moso bamboo forests. Over the past two years, numerous scholars have persistently conducted comprehensive and in-depth studies on soil carbon stocks in Chinese moso bamboo forests. Zhang et al. [19] discovered that soil management techniques employed in bamboo forests exert a notable influence on enzyme activity and microbial nutrient limitation within the soil. Moreover, total nitrogen levels and pH values are identified as the primary factors influencing microbial carbon and nitrogen limitation. In a related study, Ni et al. [20] investigated the impact of management intensity (including fertilization and reclamation frequency) on soil aggregates in moso bamboo forest. They highlighted that appropriately reducing soil disturbance was conducive to the accumulation of large aggregates and the fixation of organic carbon in the surface soil. Also, this measure would promote the fixation of nitrogen and phosphorus in micro-aggregates. In the investigation of moso bamboo forest carbon storage and soil carbon storage, deriving comprehensive and accurate conclusions from individual traditional studies often poses challenges. Therefore, we chose to employ meta-analysis to analyze the data, aiming to produce more thorough and precise findings.
Meta-analysis is an analytical tool to integrate and compare multiple studies, and it is also a systematic evaluation method. This approach involves quantifying the results of numerous independent studies by statistically merging them into a single effect size or effect scale to comprehensively reflect the results of these independent studies [21]. The synthesis of responses from these independent studies enhances the credibility of this study and addresses the issue of inconsistent results obtained from individual studies [22,23]. Moreover, meta-analysis enables the establishment of relatively generalized conclusions at regional, national, or even global scales [24,25]. In recent years, meta-analysis has gained prominence. In 2016, meta-analysis was employed to investigate soil carbon changes at various depths and time points. The findings indicated that the conversion of farmland to perennial crops resulted in a slight increase in soil carbon levels at depths of 0–30 cm compared to depths of 0–100 cm [26]. In 2020, it was utilized to assess the impact of different tillage practices on the carbon footprints of wheat and maize in the Loess Plateau region [27]. In 2021, Wang et al. [28] integrated and analyzed data from 845 studies across 214 articles to compare the differential response behaviors of soil carbon cycling processes to precipitation changes in arid and humid zones within terrestrial ecosystems. In the same year, Dong et al. [29] delved into the effects of farmland management practices on soil organic carbon (SOC) in China spanning from 1980 to 2019. Subsequently, in 2022, meta-analysis methods were employed to systematically investigate the impacts of forest harvesting, a significant forest management practice, on soil N2O fluxes. The results derived from the study indicated that heavy logging led to increased soil N2O emissions [30]. And in 2023, Siddique et al. [31] employed meta-analysis methods to examine the effect of perennialization on organic carbon accumulation in soil. Their research findings indicate that the duration since conversion from an annual to a perennial system significantly increased soil organic carbon stock by 16.6% and 23.1% at depths of 0–30 cm compared with monoculture and crop rotation, respectively.
In this study, we employed meta-analysis to systematically synthesize information from the published literature, facilitating a comprehensive comparison of the impacts of various management measures on the carbon stocks of both moso bamboo forests and soil carbon stocks. We focus on contrasting the distribution characteristics of soil carbon stocks in moso bamboo forests under different treatments, including regular management (CK) and intensive management with varying intensities (HT, MT). Furthermore, we conducted subgroup analyses to assess the significance of differences in soil organic carbon stocks within each soil layer under distinct management measures. Through this study, we aim to establish a scientific foundation for determining the appropriate intensity of bamboo forest management measures with careful consideration given to the carbon storage within bamboo forests and soils. By leveraging meta-analysis advantages, we seek to offer valuable insights for determining management intensity in future studies exploring innovative bamboo forest management techniques. This effort is intended to establish a scientific foundation for bamboo forest management, foster the sustainable development of bamboo forest ecosystems, and make contributions to climate change mitigation and ecological environment preservation.

2. Materials and Methods

2.1. General Situation of Study Area

The study area is situated in the moso bamboo forest base in Taihuyuan town, Lin’an district (Figure 1), Hangzhou city, with geographical coordinates at 30°15′58″ N and 119°35′50″ E. Located at the southern foot of East Tianmu Mountain, the research site features higher elevations in the northwest and lower elevations in the southeast. The region falls within the mid-latitude north subtropical monsoon climate, characterized by an annual average temperature of approximately 16.4 °C and a mild, humid climate. Over the years, the region has experienced an annual average of 1847.3 h of sunshine and a frost-free period spanning 237 days, and the average annual precipitation is measured at 1628.6 mm. The soil class of the study area is classified as red soil, with a subclass of yellow-red soil. It belongs to the soil genus of yellowish-brown soil, specifically categorized as the soil type of yellow sandy soil. The soil-forming parent material primarily consists of sand shale residual slope deposits.

2.2. Sample Plot Setting

To mitigate interference arising from the spread of bamboo rattan in adjacent sample plots [32], following the principle of partial control, we established three kinds of sample plots with varying management modes and intensities in the bamboo forest base for the experiment: the high-intensity treatment group (HT group), moderate treatment group (MT group), and regular management group (CK group). Each sample plot and each kind of management measure was repeated 3 times, resulting in a total of 9 control samples (Figure 2) with a size of 30 m × 30 m.
At each sample plot, the fertilizer was administered via furrow application, utilizing a specialized fertilizer tailored for moso bamboo containing 13% nitrogen (N), 3% phosphorus (P), 2% potassium (K), and over 15% organic matter. In addition, one-year-old bamboo (classified as one-degree bamboo) and two-to-three-year-old bamboo (classified as two-degree bamboo) were retained, while bamboo aged six years or above (classified as four-degree bamboo) was not retained. The treatments applied to three-year-old bamboo (classified as three-degree bamboo) as well as the fertilization applications under various operation modes are detailed in Table 1 below.
A five-meter-wide square strip was designated around the sample plot as a buffer zone where no samples or determination data were collected. Measuring the carbon emission data of the moso bamboo forest was undertaken in the middle of the sample plot, with dimensions of 20 m × 20 m as the boundary [32].

2.3. Data Source

The literature search was conducted across various databases, including CNKI, Wan fang, Web of Science, Google Scholar, and others. Publications from April 2006 to May 2018 were retrieved using the following keywords: “Management measures/bamboo forest management/verification measures” + “Carbon storage/carbon footprint/soil greenhouse gases”. Relevant studies investigating the influence of different management measures on bamboo forests and soil carbon storage were collected. The retrieved literature was subsequently screened based on the following evaluation criteria:
(1)
The sample focused on moso bamboo forests.
(2)
The study included different management measures (intensive management (Group T) and regular management (Group CK)).
(3)
The study included soil organic carbon storage data from underground layers of 0–20 cm, 20–40 cm, and 40–60 cm.
(4)
In experiments involving intensive management with varying intensity levels, data from the highest intensity level were uniformly adopted.
(5)
The experimental results presented carbon storage data along with standard deviations, either explicitly or in the form of charts.
After applying the aforementioned evaluation criteria, a total of 19 papers were included in the study. Among them, 11 papers investigated the impact of different management measures on carbon stocks in moso bamboo forests, while the remaining 8 papers focused on the influence of various management measures on soil carbon storage. We extracted data from the included documents, recording details such as document name, document author, publication year, soil depth, sample number, average value, and standard deviation for both the control and experimental groups. This information was meticulously documented using Excel 2021, and the experimental research areas of each document are shown in Figure 3 and Figure 4 below.

2.4. Data Calculation

2.4.1. Calculation of Carbon Stocks in Bamboo Forests

The total carbon stock of the vegetation in moso bamboo forests was mainly determined by the total carbon stock in the arbor layer of the moso bamboo forests, and the average change in the carbon stock of the vegetation under moso bamboo forests accounted for 4.24% of the average change in the total carbon stock of the vegetation in moso bamboo forests [33]. Therefore, the calculation of the carbon stock in moso bamboo forests in our study mainly concerned the arbor layer of moso bamboo forests. In the 9 standard sample plots, we firstly conducted a survey of each standing bamboo plant, recorded the diameter at breast height and age of each bamboo plant, and then summed up the biomass of each individual plant in the sample plots to obtain the aboveground biomass using the binary biomass model of the single moso bamboo plant. After that, we utilized the biomass multiplied by the conversion coefficient of 0.5042 to obtain the aboveground carbon stock in the arbor layer. The calculation model for the binary biomass of a single moso bamboo plant [34] is as follows:
M = 747.787   D 2.771 0.148   A 0.028 + A 5.555 + 3.772
where M is the biomass of the single moso bamboo plant in kg, D is the diameter at breast height in cm, and A is the age in degrees. The calculation model of the carbon stock of biomass per unit area within the sample plot (tC·ha−1) is as follows:
C A B = f A B D B H ,   A × C F × 10,000 A P
where C A B is the aboveground biomass carbon stock per unit area within the sample plot in tC·ha−1; f A B D B H ,   A is the binary anisotropic growth equation for aboveground biomass of moso bamboo in t d.m. per plant; C F is the average carbon content rate (unitless); and A P is the area of the sample plot in m2.

2.4.2. Calculation of Soil Carbon Stocks

Soil organic carbon content was measured utilizing the potassium dichromate oxidation–external heating method [35]. The calculation of soil organic carbon storage per unit area in the sample plot is as follows:
C s o c = l = 1 l C S O C , l × B D l × h l
where C s o c is the soil organic carbon storage per unit area of the sample plot in tC·ha−1; C S O C , l is the soil organic carbon content of each soil layer in gC·(per 100 g of soil)−1; B D l is the bulk density of the soil layer in g·cm−3; and h l is the thickness of each soil layer in cm.

2.5. Meta-Analysis

In this study, meta-analysis was used to analyze the effects of different management measures on bamboo forests and soil carbon stocks, and subgroup analyses of soil depth were conducted to improve the scientific validity and accuracy of the experimental results.

2.5.1. Calculation of Standard Deviation

The standard deviation of an experiment is an important metric in meta-analysis. In this study, the standard deviation was calculated by Formula (4) for data whose standard deviations were not provided in the literature but standard errors were provided [36].
S D = S E × n
where SD is standard deviation, SE is standard error, and n is number of replicates. For cases where standard deviation and standard error are not explicitly given in the literature but original data graphs are available, we used Plot Digitizer to extract the data and recalculate the mean and standard deviation after redefining the coordinate system. For data with missing SD values, the proportion of the overall SD value to the mean value can be estimated based on the existing SD, and the proportion is then multiplied by the mean value of the missing SD indicator to obtain the estimated SD value [37].

2.5.2. Establishment of the Analytical Model

The study utilized R for meta-analysis. For continuous variable data, we applied the continuous variable analysis model [38]. Then, we entered the sample size, mean, and standard deviation of the corresponding intensive management group (TREAT, referred to as Group T) and the rough management group (CK control group, referred to as Group C), respectively. We chose a random effects model for the analytical model of cumulative effect values, and the parameters were estimated using the restricted maximum likelihood (REML) method [39] with a confidence level interval set as 95%.

2.5.3. Meta-Analysis Process

SMD (Hedges’ d) is the most widely used effect size for meta-analyses [40]. Considering the limited sample size in the single-case study, we employed Hedges’ d for the calculation of effect values and weights of individual study cases. Let Y e be the mean value of the experimental group (T group) and Y c be the mean value of the control group (CK group). The Hedges’ d effect value is calculated as Formula (5):
y i = d = Y e Y c N e 1 S e 2 + N c 1 S c 2 N e + N c 2   J
where J is calculated as Formula (6):
J = 1 3 4 N e + N c 2 1
The within-case variance is calculated as Formula (7):
v i = v d = N e + N c N e N c + d 2 2 ( N e + N c
We selected the random effects model to calculate the cumulative effect values for the experimental group, and the parameter estimation of the between-case variance ( τ 2 ) was performed using the REML method, which is directly computed from R language. We then calculated the weights for the individual studies as Formula (8) and the cumulative effect values as Formula (9):
w i * = 1 / ( v i + τ 2
y ¯ = i = 1 k w i * y i i = 1 k w i *
The identification and treatment of publication bias are crucial steps in the meta-analysis process [41,42]. We used R Studio to generate funnel plots for the selected literature after screening, and the results of the meta-analysis in this study were scrutinized for potential biases by assessing the symmetry of the funnel plots. The funnel plots of the meta-analysis are shown in Appendix A.

2.6. Data Processing

In this study, Excel 2021 was utilized for data collection and dataset establishment. For graphical data included in the literature, Web Plot Digitizer v4.5 aided in data extraction. SPSS Statistics 26 was employed to analyze the significance of differences in the carbon stocks of bamboo forests and soil carbon stocks across various soil layers under different management modes using one-way ANOVA. Origin 2023b was used for visualizing the results of the difference analysis. Meta-analysis was conducted using R language, and the results were graphed using R Studio v2023.09.1. ArcGIS 10.4 was utilized for data visualization.

3. Results

3.1. Effects of Different Management Measures on Bamboo Forest Carbon Stocks in Measured Data

The effects on the organic carbon stock of moso bamboo forests under different management measures in the experiment (unit: tC·ha−1) are depicted in Figure 5. The results of the one-way ANOVA indicated that the organic carbon stock of moso bamboo forests was significantly influenced by different management measures and management intensity. Under HT, MT and CK, the mean values of the organic carbon stock in the moso bamboo forests were 35.3786, 39.1931 and 32.69938 tC·ha−1, respectively. There was a significant difference in the organic carbon stock of the moso bamboo forests between MT and CK (p < 0.05), with the MT group increasing the carbon stock of the moso bamboo forests by 19.86%, compared to CK. However, there was no significant difference between the HT group and the MT and CK groups.

3.2. Effects of Different Management Measures on Soil Carbon Stocks in the Measured Data

The effects of different management measures on soil organic carbon stock (unit: tC·ha−1) in the experiment are depicted in Figure 6. At the soil depth of 10–30 m and across the combined soil layer of 0–50 m, the results of the one-way ANOVA for each soil layer indicated a significant impact on the soil organic carbon stock under different management measures and management intensities. At the soil depth of 10–30 m, there were significant differences in soil organic carbon stocks between the HT, MT, and CK groups (p < 0.05), with the mean values of soil organic carbon stocks under HT, MT, and CK being 15.9000, 37.2300, and 22.6767 tC·ha−1, respectively. In comparison to CK, HT decreased the soil carbon stock by 29.89%, while MT increased the soil carbon stock by 64.15%.
In the overall soil layer of the experiment, the soil organic carbon stocks in moso bamboo forests under HT and MT were significantly different from those under CK (p < 0.05), and the mean values of soil organic carbon stocks under the HT, MT, and CK treatments were 15.8733, 26.7922, and 20.4489 tC·ha−1, respectively. Compared with CK, the HT group decreased the soil carbon stocks of moso bamboo forests by 22.38%, while the MT group increased the soil carbon stocks of moso bamboo forests by 31.02%. We also found that at the soil depths of 0–10 m and 30–50 m, there were no significant differences between the treatments in the experimental groups.

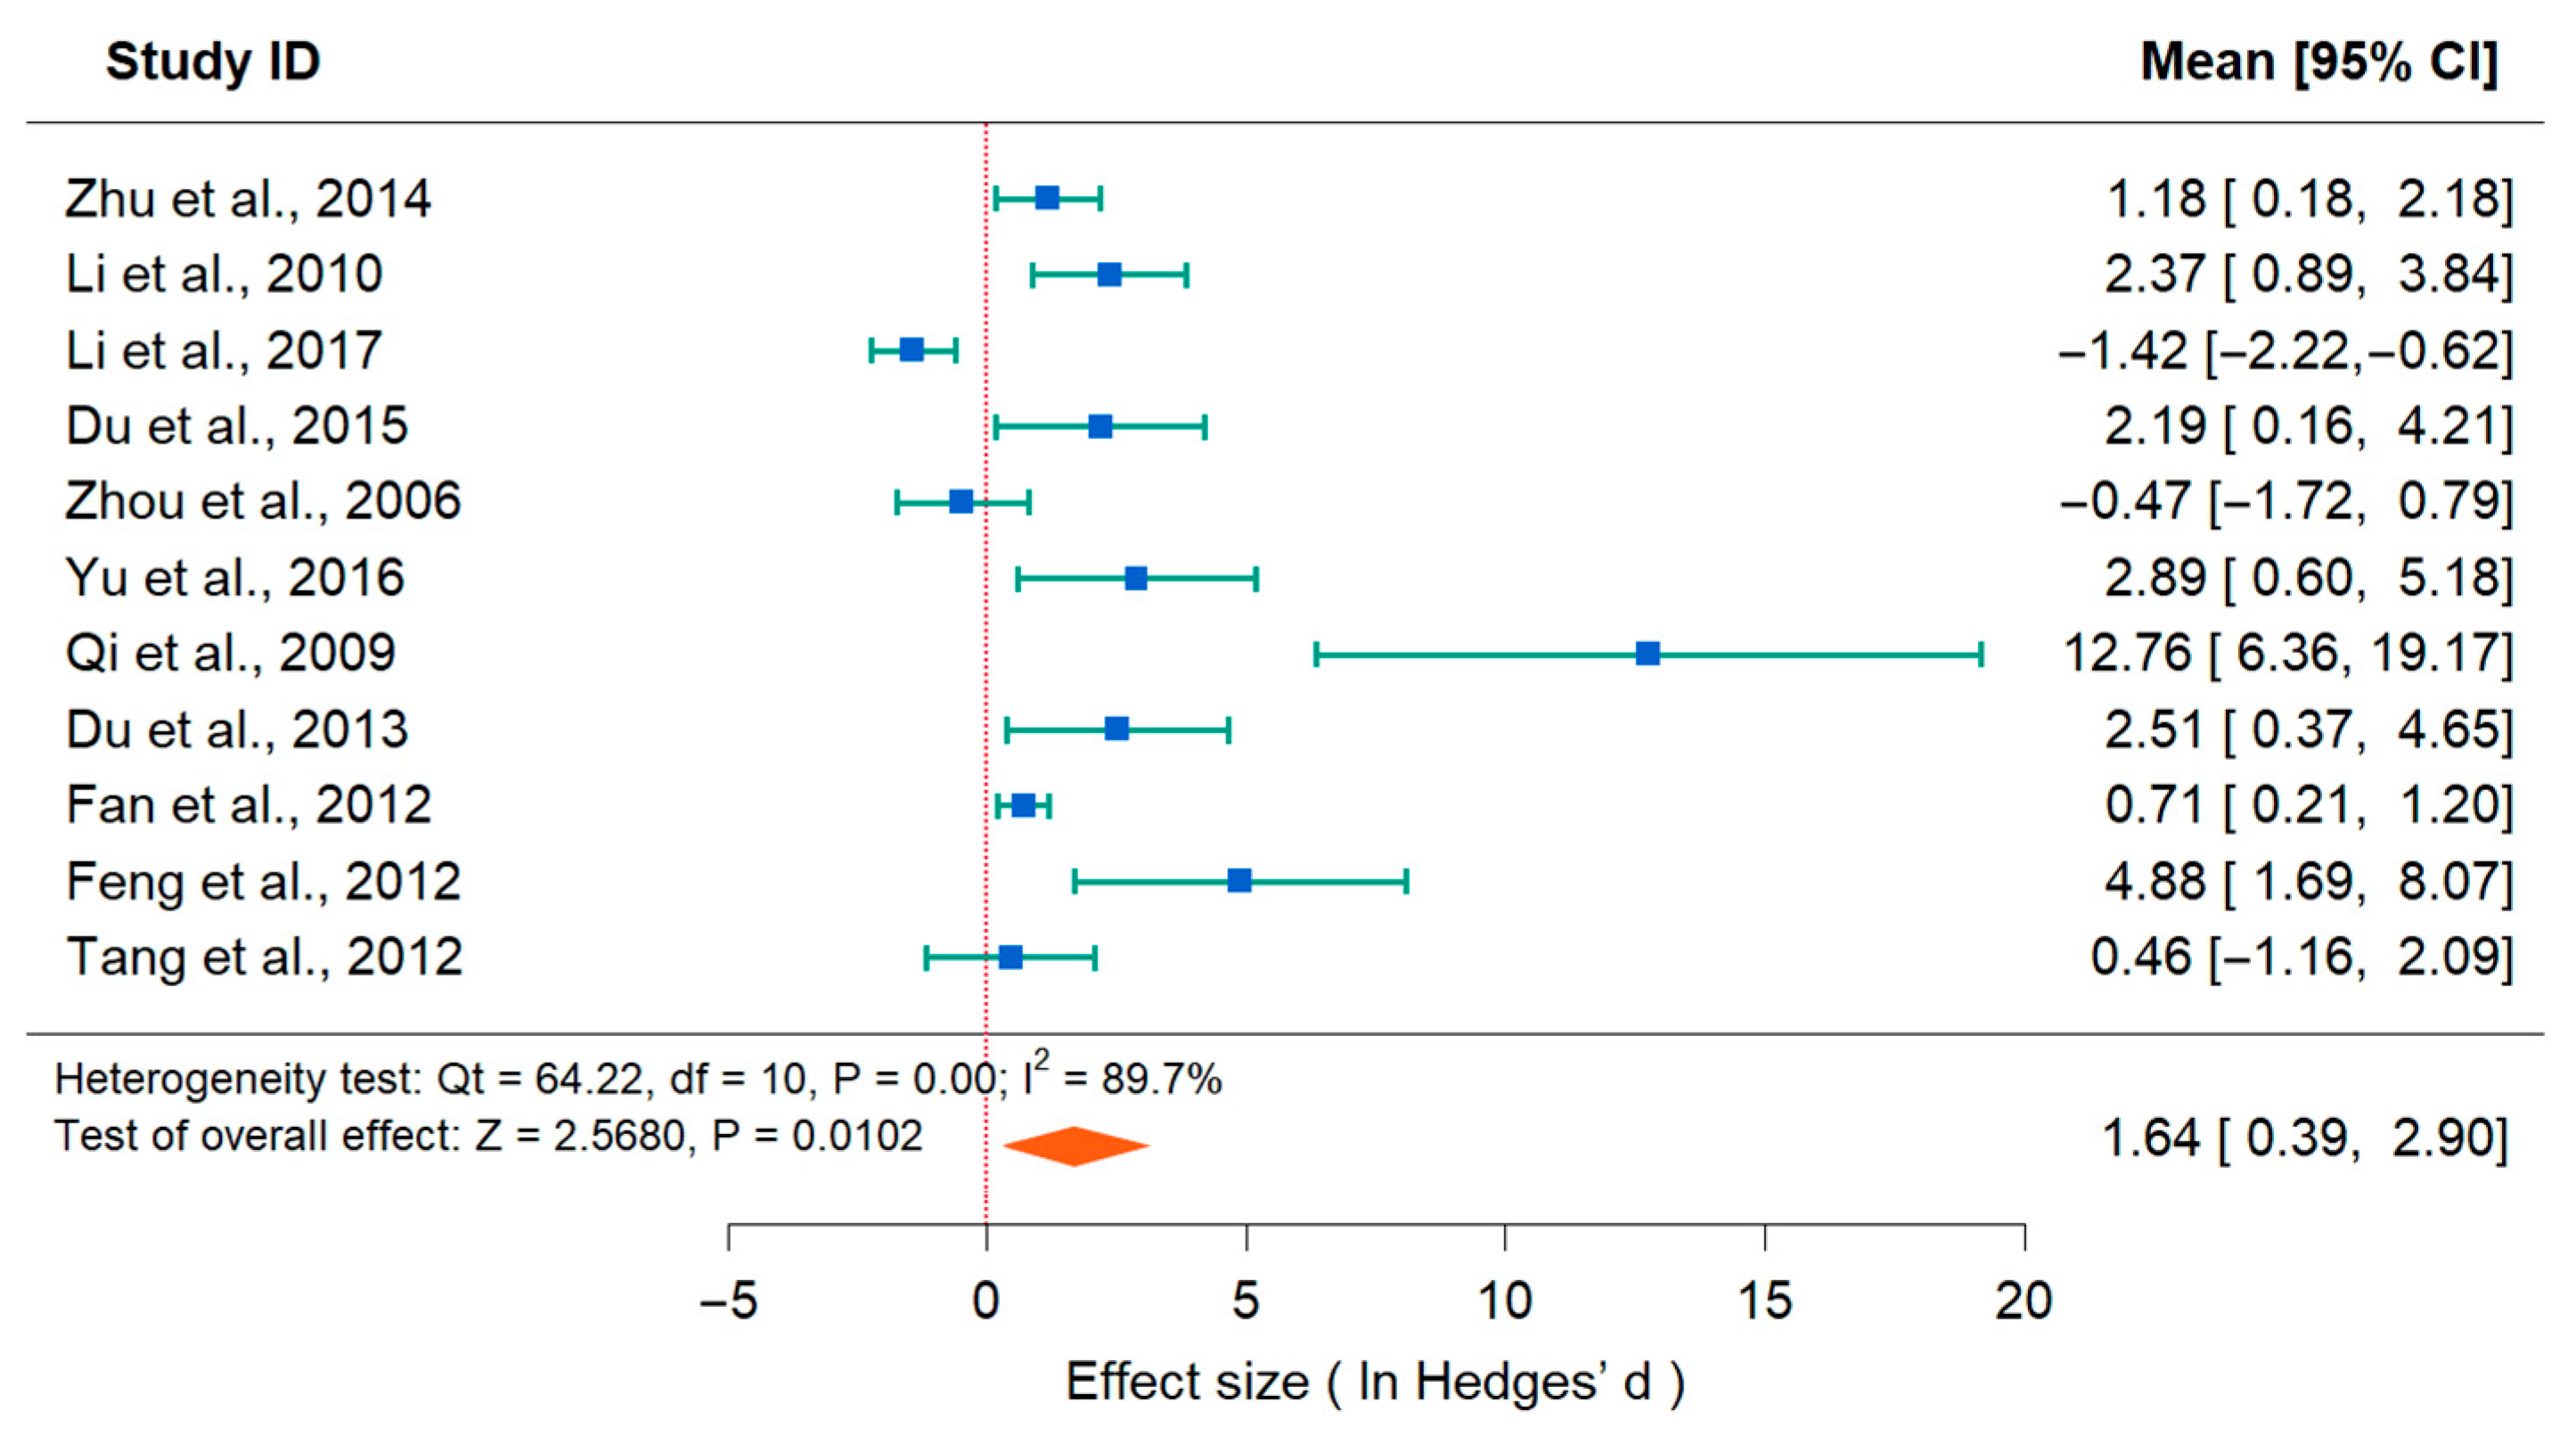
3.3. Meta-Analysis Results of the Effects of Different Management Practices on Carbon Stocks in Moso Bamboo Forests

In comparison to regular management (CK group), intensive management (T group) resulted in a higher carbon stock in moso bamboo forests, with a mean difference (MD) of 1.64, combined effect size Z of 2.5680, and a 95% confidence interval (CI) ranging from 0.39 to 2.90. The meta-analysis results indicated that intensive management significantly increased the carbon stock of bamboo forests (p < 0.05) compared to regular management (Figure 7).

3.4. Meta-Analysis Results of the Effects of Different Management Practices on Soil Carbon Stocks

In comparison to rough management (CK group), the soil carbon storage mean difference (MD) of intensive management (T Group) was −2.90, the combined effect Z was −2.1371, and the 95% confidence interval (CI) ranged from −5.56 to −0.24. The results of the meta-analysis indicate that intensive management can significantly reduce soil carbon storage (p < 0.05) compared with regular management (Figure 8).
The results of the subgroup analyses of the soil layers, as determined through the establishment of a meta-analysis model, are depicted in Figure 9 below. The results of the meta-analysis indicated significant differences in the study groups with soil depths of 0–20 m (p < 0.05), while there were no significant differences in the study groups with soil depths of 20–40 m and 40–60 m. This suggests that, in all the study cases, the effects of different management practices on soil carbon stocks were primarily observed in the top soil layer.

4. Discussion

4.1. Impacts of Different Management Practices on Carbon Stocks in Moso Bamboo Forests

For moso bamboo forest carbon stock, the meta-analysis results revealed that intensive management significantly increases carbon stock (p < 0.05). Comparing this with our measured data, medium-intensity intensive treatment (MT) also significantly increased carbon stock (p < 0.05), while high-intensity intensive treatment (HT) did not show a significant increase. The results of this study are consistent with those of Zhou et al. [34] in terms of the differences in carbon storage in the arbor layer in the ecosystems of moso bamboo forests of different management types, and Zhu et al. [43] in terms of the stand structure of moso bamboo forests and the soil nutrient status of the forest floor under different management measures.
Studies have shown that nitrogen is the nutrient with the highest demand during plant growth and influences the photosynthetic assimilation of crops [55]. Fertilizer application provides a rich source of nitrogen, resulting in an increase in the number of bamboo leaves per plant, and an increase in overall chlorophyll content. Photosynthesis uses sunlight to convert water and carbon dioxide into biomass and oxygen [56]. Suitable irrigation and tillage in MT provided sufficient water, increased the air permeability of soil, and provided sufficient raw materials for photosynthesis, which in turn increased the photosynthetic rate of moso bamboo, resulting in a significantly higher carbon stock in bamboo forests under MT than those under CK. Reclamation changes soil porosity and permeability, which prompts the release of unstable organic matter from the interior, leading to soil organic matter loss [57,58]. The excessive addition of nitrogen fertilizer leads to the rapid decomposition of soil organic matter, making the soil susceptible to mineralization [59,60]. In the HT group, intensive fertilizer application and tillage contributed to a rapid decrease in soil organic matter content. Despite the supplementation of the soil with a certain amount of organic matter through fertilizer application, the rate of organic matter loss remained higher than that of supplementation. Compared to the MT group, the HT group exhibited a more significant loss of organic matter. This condition facilitated soil sloughing, negatively affecting the uptake of soil organic matter and minerals by the moso bamboo root system. Consequently, the photosynthetic rate of moso bamboo decreased; thus, the HT group did not significantly contribute to the augmentation of carbon stock in moso bamboo forests.

4.2. Effects of Different Management Practices on Soil Carbon Stocks in Bamboo Forests

Comparing the self-measured data with the meta-analysis reveals that intensive management, particularly under high-intensity treatment (HT), leads to a significant decrease in soil carbon stock (p < 0.05). Conversely, medium-intensity intensive treatment (MT) results in a significant increase in soil carbon stock (p < 0.05). This aligns with the observations made by Yang et al. [61] on the effects of management practices on the soil organic carbon of moso bamboo and Fan et al. [62] on the effects of management intensity and topography on the differences in moso bamboo forest carbon stocks.
A certain amount of organic fertilizer was applied during the intensive management process of bamboo forest production and management. This application facilitates the growth of fine roots and enhances the ability of moso bamboo forests to invade the surrounding native forest stands, which in general decreased soil total organic carbon by 2%, total nitrogen by 15.9%, and nitrate nitrogen by 21.7%, while it increased ammonium nitrogen and effective phosphorus by 14.7% and 54.9%, respectively [63]. Roots invaded the forest stand, increased soil bacterial and fungal diversity, and fixed more airborne carbon with the assistance of microorganisms. However, as the activity and diversity of these microorganisms increase, the decomposition of organic matter also accelerates accordingly. In the HT group, roots displayed vigorous growth and a more pronounced invasion of the forest structure. This enhances the activity and diversity of soil microorganisms, thereby facilitating the decomposition of more carbon-containing organic matter in the soil. Consequently, the soil carbon stock for the moso bamboo forest was lower compared to the CK group, while the moso bamboo forest exhibited a limited invasion of the forest structure in the MT group, and the decomposition of carbon-containing organic matter made by soil microorganisms was less pronounced compared to HT, allowing the soil carbon stock to be maintained at a higher level.
The change in soil respiration rate is jointly regulated by temperature and moisture, and soil respiration rate is positively correlated with temperature [64,65]. Tilling not only destroys the soil aggregation structure to a certain extent, so that the soil organic matter is fully exposed to the loss of protection and decomposition, but also changes the original temperature, humidity, porosity, and other related conditions of the soil, which enhances the respiration of microorganisms [66]. The application of organic fertilizer accelerates the growth of the root system, resulting in an increase in the number of fine roots per unit area of the soil. This, in turn, accelerates the autotrophic respiration of the root system. In addition, intensive management measures such as fertilizer application and tilling intensified soil disturbance and stimulated the mineralization of soil organic carbon, consequently leading to a reduction in soil organic carbon content [67]. Therefore, in comparison to the CK treatment, the intensive management process, particularly under the high-intensity treatment mode, with measures such as fertilizing, irrigating, tilling, and mulching, enhanced both the autotrophic respiration of the root system and the heterotrophic respiration of soil animals and microorganisms. Simultaneously, it disrupted the soil aggregation structure, which plays a crucial role in protecting soil organic matter, and accelerated the rate of mineralization of soil organic carbon. This led to a rapid depletion of organic matter, ultimately resulting in a lower soil carbon stock for the moso bamboo forest under the HT group compared to the CK group. However, in the MT group, the intensity of heterotrophic respiration was moderate, and the rate of organic matter depletion was slower compared to the HT group. Moreover, appropriate tillage practices protected soil aggregation and mitigated carbon loss. This is highly likely to be the reason for the highest average soil carbon stock under MT.

4.3. Effects of Different Management Practices on Subgroup Differences in Soil Carbon Stocks

The analysis of soil depth subgroups reveals a significant difference in soil carbon storage within the 0–20 m soil layer group (p < 0.05), while the 20–40 m and 40–60 m soil layer groups show no significant difference. This is consistent with the results of Qi et al. [68] on the distribution of soil organic carbon in pure stands of moso bamboo, and Chen at al. [52] on the effects of different fertilization methods on soil chemical properties. The measured results indicated a significant difference in soil carbon stocks between the samples within the soil depth of 10–30 m and the overall 0–50 m sample group (p < 0.05). However, there was no significant difference observed in the 0–10 m and 30–50 m sample groups.
The primary absorbing root system of moso bamboo tends to be distributed in the surface layer [69]. As various management measures directly affect the surface soil, their impact is more pronounced on the top layer. This observation aligns with the significant differences observed within the 0–20 m soil layer group in the meta-analysis. The root system of moso bamboo is primarily concentrated in the soil layer of 0–20 m. Therefore, there may be no significant difference within the group in the 0–10 m soil layer in this experiment, while significant differences may also exist in the 10–30 m soil layer.
Soil aggregates in moso bamboo forests are mainly dominated by large aggregates, accounting for 67.1%–98.1%. The proportion and distribution characteristics of these large aggregates, defined as aggregates with a size of 250 μm or larger, can serve as indicators of the soil structure’s quality. In general, a higher presence of large soil aggregates correlates with increased stability and an enhanced erosion resistance of the soil [70,71]. Some studies have indicated that, compared with rough management, medium- and high-intensity intensive management decreased the proportion of macroaggregates and aggregate stability in the 0–10 m soil layer. Conversely, they increased the proportion of macroaggregates and aggregate stability in the 20–30 m soil layer [20]. Therefore, the absence of significant differences in the 0–10 m soil layer is most likely due to the low proportion of large aggregates in the soil layer and the unstable soil structure. In contrast, the 10–30 m soil layer had a higher proportion of macroaggregates and a more stable soil structure, resulting in more pronounced differences in soil carbon stocks under varying management intensities. Additionally, the significant difference in the overall samples from 0 to 50 m could be attributed to the cumulative effect of insignificant differences among the various soil layer groups.

5. Conclusions

This experimental data study demonstrated that, compared with traditional regular management, the increase in carbon stock in moso bamboo forests under strong intensive management was not significant and would lead to a significant decrease in soil carbon stock (p < 0.05), while medium-intensity intensive management would lead to a significant increase in carbon stock for moso bamboo forests (p < 0.05) and, concurrently, a noteworthy elevation in soil carbon stock (p < 0.05). Therefore, in order to sustain the carbon stock of moso bamboo forests and soil carbon stock at a high level, a reasonable, medium-intensity intensive management mode should be adopted in the selection of management measures.
Comprehensive analysis showed that, among the different management measures, fertilization, irrigation, and tilling in intensive management could accelerate the rate of organic matter conversion and thus increase the bamboo forest carbon stock. Nevertheless, high-intensity fertilization and tilling in intensive management had little effect on increasing the carbon stock in bamboo forests; instead, it significantly reduced the soil carbon stock. Therefore, suitable and medium-intensity fertilization and tilling measures should be adopted.
Combined with the measured data and the results of the meta-analysis, we suggest further subdividing management measures into additional gradients and exploring diverse management methods to delve into the specific implementation methods of medium-intensity intensive management. As the timeframe for setting sample plots extends, experimental data should be collected over multiple years and gradients, along with obtaining more experimental samples within the same plots each year, to improve the precision of experimental outcomes and establish a more scientifically robust groundwork for the cultivation and administration of moso bamboo forests, as well as the carbon sequestration potential of bamboo ecosystems.

Author Contributions

Conceptualization, Z.Z., X.L., Y.Z., C.L. and G.T.; methodology, X.L., X.C., C.L. and Z.Z.; software, Z.Z. and Q.Z.; validation, C.T., X.L., S.H. and B.H.; formal analysis, X.L., X.C. and Z.Z.; investigation, X.C., X.L., C.Z. and Z.Z.; data curation, Z.Z., C.T. and M.S.; writing—original draft, Z.Z. and C.T.; writing—review and editing, X.C., C.T., M.S., Q.Z., B.H., C.Z. and S.H.; visualization, Z.Z.; supervision, X.C.; project administration Y.Z. and G.T.; funding acquisition, Y.Z.; The paper was written by Z.Z. All authors have read and agreed to the published version of the manuscript.

Funding

This research was funded by the Joint Research Fund of Department of Forestry of Zhejiang Province and Chinese Academy of Forestry (Grant No. 2022SY05); the National Innovation and Entrepreneurship Training Project (Grant No. 202210341028); the Key Research and Development Program of Zhejiang Province (Grant No. 2021C02005).

Data Availability Statement

The data that support the findings of this study are available from the corresponding author upon reasonable request.

Acknowledgments

The authors would like to thank Chong Li, Guoqing Tu, and Yufeng Zhou for their guidance and help on topic selection and manuscript writing. We are grateful to the handling editor and anonymous reviewers for their valuable comments.

Conflicts of Interest

The authors declare that they have no competing interests.

Correction Statement

This article has been republished with a minor correction to the Funding statement. This change does not affect the scientific content of the article.

Appendix A

Appendix A presents additional figures for Section 3. Funnel plots for bamboo forest carbon stocks and soil carbon stocks are shown as follows. They can be considered as a supplement to meta-analysis.
Figure A1. Funnel Plots for Bamboo Forest Carbon stocks.
Forests 15 00496 g0a1
Figure A2. Funnel Plots for Soil Carbon stocks (Including subgroups).
Forests 15 00496 g0a2

References

  1. Calvin, K.; Dasgupta, D.; Krinner, G.; Mukherji, A.; Thorne, P.W.; Trisos, C.; Romero, J.; Aldunce, P.; Barrett, K.; Blanco, G.; et al. IPCC, 2023: Climate Change 2023: Synthesis Report. Contribution of Working Groups I, II and III to the Sixth Assessment Report of the Intergovernmental Panel on Climate Change; Lee, H., Romero, J., Eds.; IPCC: Geneva, Switzerland, 2023. [Google Scholar]
  2. Meyer, L.; Brinkman, S.; van Kesteren, L.; Leprince-Ringuet, N.; van Boxmeer, F. IPCC, 2014: Climate Change 2014: Synthesis Report. Contribution of Working Groups I, II and III to the Fifth Assessment Report of the Intergovernmental Panel on Climate Change; Pachauri, R.K., Meyer, L.A., Eds.; IPCC: Geneva, Switzerland, 2014. [Google Scholar]
  3. Intergovernmental Panel on Climate Change (IPCC); Masson-Delmotte, V.; Zhai, P.; Pirani, A.; Connors, S.L.; Péan, C.; Berger, S.; Caud, N.; Chen, Y.; Goldfarb, L.; et al. Climate Change 2021—The Physical Science Basis: Working Group I Contribution to the Sixth Assessment Report of the Intergovernmental Panel on Climate Change, 1st ed.; Cambridge University Press: Cambridge, UK, 2023.
  4. Anderson-Teixeira, K.J.; Wang, M.M.H.; McGarvey, J.C.; LeBauer, D.S. Carbon Dynamics of Mature and Regrowth Tropical Forests Derived from a Pantropical Database (TropForC-Db). Glob. Chang. Biol. 2016, 22, 1690–1709. [Google Scholar] [CrossRef] [PubMed]
  5. Beer, C.; Reichstein, M.; Tomelleri, E.; Ciais, P.; Jung, M.; Carvalhais, N.; Rödenbeck, C.; Arain, M.A.; Baldocchi, D.; Bonan, G.B.; et al. Terrestrial Gross Carbon Dioxide Uptake: Global Distribution and Covariation with Climate. Science 2010, 329, 834–838. [Google Scholar] [CrossRef]
  6. Smith, P.; Bustamante, M.; Ahammad, H.; Clark, H.; Haberl, H.; Harper, R.; House, J.; Jafari, M.; Masera, O.; Mbow, C.; et al. Agriculture, Forestry and Other Land Use (AFOLU). In Climate Change 2014: Mitigation of Climate Change. Contribution of Working Group III to the Fifth Assessment Report of the Intergovernmental Panel on Climate Change; Cambridge University Press: Cambridge, UK, 2014; pp. 811–922. [Google Scholar]
  7. Ping, X.; Chang, Y.; Liu, M.; Hu, Y.; Huang, W.; Shi, S.; Jia, Y.; Li, D. Carbon Emission and Redistribution among Forest Carbon Pools, and Change in Soil Nutrient Content after Different Severities of Forest Fires in Northeast China. Forests 2022, 13, 110. [Google Scholar] [CrossRef]
  8. Andoh, J.; Lee, Y. National REDD+ Strategy for Climate Change Mitigation: A Review and Comparison of Developing Countries. Sustainability 2018, 10, 4781. [Google Scholar] [CrossRef]
  9. Li, X.; Du, H.; Mao, F.; Zhou, G.; Han, N.; Xu, X.; Liu, Y.; Zhu, D.; Zheng, J.; Dong, L.; et al. Assimilating Spatiotemporal MODIS LAI Data with a Particle Filter Algorithm for Improving Carbon Cycle Simulations for Bamboo Forest Ecosystems. Sci. Total Environ. 2019, 694, 133803. [Google Scholar] [CrossRef] [PubMed]
  10. Kang, F.; Li, X.; Du, H.; Mao, F.; Zhou, G.; Xu, Y.; Huang, Z.; Ji, J.; Wang, J. Spatiotemporal Evolution of the Carbon Fluxes from Bamboo Forests and Their Response to Climate Change Based on a BEPS Model in China. Remote Sens. 2022, 14, 366. [Google Scholar] [CrossRef]
  11. SFAPRC. Forest Resources in China—The 8th National Forest Inventory; State Forestry Administration: Beijing, China, 2015. [Google Scholar]
  12. Lu, X.; Jiang, H.; Liu, J.; Sun, C.; Wang, Y.; Jin, J. Comparing Simulated Carbon Budget of a Lei Bamboo Forest with Flux Tower Data. Terr. Atmos. Ocean. Sci. 2014, 25, 359. [Google Scholar] [CrossRef]
  13. Chen, X.; Zhang, X.; Zhang, Y.; Booth, T.; He, X. Changes of Carbon Stocks in Bamboo Stands in China during 100 Years. For. Ecol. Manag. 2009, 258, 1489–1496. [Google Scholar] [CrossRef]
  14. Wang, B.; Wei, W.; Liu, C.; You, W.; Niu, X.; Man, R. Biomass and Carbon Stock in Moso Bamboo Forests in Subtropical China: Characteristics and Implications. J. Trop. For. Sci. 2013, 25, 137–148. [Google Scholar]
  15. Xu, L.; Fang, H.; Deng, X.; Ying, J.; Lv, W.; Shi, Y.; Zhou, G.; Zhou, Y. Biochar Application Increased Ecosystem Carbon Sequestration Capacity in a Moso Bamboo Forest. For. Ecol. Manag. 2020, 475, 118447. [Google Scholar] [CrossRef]
  16. Zhang, H.; Zhou, Y.; Zhang, Y.; Xu, X.; Li, C.; Xu, L. Research Progress of International Bamboo Forest Carbon Sequestration in the Last 30 Years Based on Bibliometric Analysis. J. Bamboo Res. 2020, 39, 13–23. (In Chinese) [Google Scholar] [CrossRef]
  17. Lacerda, A.E.B. Understanding the Long-Term Impact of Bamboos on Secondary Forests: A Case for Bamboo Management in Southern Brazil. Diversity 2021, 13, 567. [Google Scholar] [CrossRef]
  18. Ma, S.; Li, Z.; Wang, B.; Liu, R.; Ge, R.; Wang, G. Effects of Different Management Modes on Soil Reactive Organic Carbon of Moso Bamboo. Soil Bull. 2012, 43, 674–679. (In Chinese) [Google Scholar] [CrossRef]
  19. Zhang, X.; Li, Q.; Zhong, Z.; Huang, Z.; Wen, X.; Bian, F.; Yang, C. Determining Changes in Microbial Nutrient Limitations in Bamboo Soils under Different Management Practices via Enzyme Stoichiometry. Catena 2023, 223, 106939. [Google Scholar] [CrossRef]
  20. Ni, H.; Chu, H.; Su, W.; Fan, S. Effects of Management Intensities on Soil Aggregate Stability and Carbon, Nitrogen, Phosphorus distribution in Phyllostachys edulis forests. J. Appl. Ecol. 2023, 34, 928–936. (In Chinese) [Google Scholar] [CrossRef]
  21. Fox, J.W. How Much Does the Typical Ecological Meta-analysis Overestimate the True Mean Effect Size? Ecol. Evol. 2022, 12, e9521. [Google Scholar] [CrossRef]
  22. Grammatikopoulou, I.; Vačkářová, D. The Value of Forest Ecosystem Services: A Meta-Analysis at the European Scale and Application to National Ecosystem Accounting. Ecosyst. Serv. 2021, 48, 101262. [Google Scholar] [CrossRef]
  23. Mason, S.C.; Shirey, V.; Ponisio, L.C.; Gelhaus, J.K. Responses from Bees, Butterflies, and Ground Beetles to Different Fire and Site Characteristics: A Global Meta-Analysis. Biol. Conserv. 2021, 261, 109265. [Google Scholar] [CrossRef]
  24. Vander Werf, E. Lack’s Clutch Size Hypothesis: An Examination of the Evidence Using Meta-Analysis. Ecology 1992, 73, 1699–1705. [Google Scholar] [CrossRef]
  25. Bender, D.J.; Contreras, T.A.; Fahrig, L. Habitat Loss and Population Decline: A Meta-Analysis of the Patch Size Effect. Ecology 1998, 79, 517–533. [Google Scholar] [CrossRef]
  26. Manevski, K.; Lærke, P.E.; Jiao, X.; Santhome, S.; Jørgensen, U. Biomass Productivity and Radiation Utilisation of Innovative Cropping Systems for Biorefinery. Agric. For. Meteorol. 2017, 233, 250–264. [Google Scholar] [CrossRef]
  27. Du, J.; Wang, L.; Xie, J.; Peng, Z.; Li, L. Effect of Tillage Practices on the Carbon Footprint of Wheat and Maize in the Loess Plateau of China: A Meta Analysis. J. Yunnan Agric. Univ. (Nat. Sci.) 2020, 35, 906–918. (In Chinese) [Google Scholar]
  28. Wang, B.; Chen, Y.; Li, Y.; Zhang, H.; Yue, K.; Wang, X.; Ma, Y.; Chen, J.; Sun, M.; Chen, Z.; et al. Differential Effects of Altered Precipitation Regimes on Soil Carbon Cycles in Arid versus Humid Terrestrial Ecosystems. Glob. Chang. Biol. 2021, 27, 6348–6362. [Google Scholar] [CrossRef] [PubMed]
  29. Dong, L.; Shi, X.; Xu, S.; Wang, M. Effects of Different Management Measures on the Organic Carbon of Farmland Soil Profile in China Based on Meta analysis. Soil 2021, 53, 1290–1298. (In Chinese) [Google Scholar] [CrossRef]
  30. Zhang, H.; Tang, C.; Berninger, F.; Bai, S.; Wang, H.; Wang, Y. Intensive Forest Harvest Increases N2O Emission from Soil: A Meta-Analysis. Soil Biol. Biochem. 2022, 172, 108712. [Google Scholar] [CrossRef]
  31. Siddique, I.A.; Grados, D.; Chen, J.; Lærke, P.E.; Jørgensen, U. Soil Organic Carbon Stock Change Following Perennialization: A Meta-Analysis. Agron. Sustain. Dev. 2023, 43, 58. [Google Scholar] [CrossRef]
  32. Li, C.; Zhou, G.; Shi, Y.; Zhou, Y.; Zhang, Y.; Shen, L.; Fan, Y.; Shen, Z. Effects of Different Management Measures on Soil Carbon in Bamboo Forest Ecosystems. For. Sci. 2015, 51, 26–35. (In Chinese) [Google Scholar]
  33. Li, C. Effects Research of Different Management Approaches on Net Carbon Sequestration Capacity in Moso Bamboo Forest. Master’s Thesis, Zhejiang A&F University, Hangzhou, China, 2016. (In Chinese). [Google Scholar]
  34. Zhou, G. Research on Carbon Stocks, Fixation, Allocation and Distribution in Bamboo Forest Ecosystems. Ph D. Thesis, Zhejiang University, Hangzhou, China, 2006. (In Chinese). [Google Scholar]
  35. Lu, R.; Zhu, H.; He, P. Methods for Agrochemical Analysis of Soil; China Agricultural Science and Technology Press: Beijing, China, 2004; ISBN 7-80119-925-1. (In Chinese) [Google Scholar]
  36. Sandercock, G. The Standard Error/Standard Deviation Mix-Up: Potential Impacts on Meta-Analyses in Sports Medicine. Sports Med. 2024; Online ahead of print. [Google Scholar] [CrossRef] [PubMed]
  37. Zhou, G.; Zhou, X.; He, Y.; Shao, J.; Hu, Z.; Liu, R.; Zhou, H.; Hosseinibai, S. Grazing Intensity Significantly Affects Belowground Carbon and Nitrogen Cycling in Grassland Ecosystems: A Meta-Analysis. Glob. Chang. Biol. 2017, 23, 1167–1179. [Google Scholar] [CrossRef]
  38. Jacobs, P.; Viechtbauer, W. Estimation of the Biserial Correlation and Its Sampling Variance for Use in Meta-analysis. Res. Synth. Methods 2017, 8, 161–180. [Google Scholar] [CrossRef]
  39. Kontopantelis, E.; Reeves, D. Pairwise Meta-Analysis of Aggregate Data Using Metaan in Stata. Stata J. 2020, 20, 680–705. [Google Scholar] [CrossRef]
  40. Nakagawa, S.; Noble, D.W.A.; Lagisz, M.; Spake, R.; Viechtbauer, W.; Senior, A.M. A Robust and Readily Implementable Method for the Meta-analysis of Response Ratios with and without Missing Standard Deviations. Ecol. Lett. 2023, 26, 232–244. [Google Scholar] [CrossRef]
  41. Lin, L. Hybrid Test for Publication Bias in Meta-Analysis. Stat. Methods Med. Res. 2020, 29, 2881–2899. [Google Scholar] [CrossRef]
  42. Higgins, J.; Thomas, J.; Chandler, J.; Cumpston, M.; Li, T.; Page, M.; Welch, V. Cochrane Hand-Book for Systematic Reviews of Interventions: Version 6.3; Cochrane: London, UK, 2023. [Google Scholar]
  43. Zhu, L.; Zhang, M.; Zhao, H.; Zhao, Y.; Xu, X. Effects of different management practices on biomass and carbon stock of moso bamboo forests. Econ. For. Res. 2014, 32, 58–64. (In Chinese) [Google Scholar] [CrossRef]
  44. Li, Z.; Yang, X.; Cai, X.; Sun, J.; Ge, R.; Sun, X.; Fu, M. Effects of bamboo cultivation on the carbon storage. J. Nanjing For. Univ. 2010, 34, 24–28. (In Chinese) [Google Scholar]
  45. Li, C.; Zhou, G.; Shi, Y.; Zhou, Y.; Xu, L.; Fan, Y.; Shen, Z.; Li, S.; Lv, L. Effects of Different Management Measures on the Net Carbon Sequestration Capacity of Moso bamboo Forest Ecosystem. Sci. Silvae Sin. 2017, 53, 1–9. (In Chinese) [Google Scholar]
  46. Du, M.; Liu, G.; Fan, S.; Feng, H.; Tang, X.; Mao, C. Effects of Fertilization on the Distribution Patterns of Biomass and Carbon Storage in Moso Bamboo Forest, Western Fuiian Province, China. Chin. J. Trop. Crops 2015, 36, 872–877. (In Chinese) [Google Scholar]
  47. Yu, L.; Zhang, K.; Liu, X.; Xiao, F.; Xu, H.; Zeng, W. Effects of fertilization on biomass and carbon sequestration potential of Phyllostachy edulis forests. South China For. Sci. 2016, 44, 9–12+22. (In Chinese) [Google Scholar] [CrossRef]
  48. Qi, L.; Liu, G.; Fan, S.; Yue, X.; Zhang, H.; Du, M. Effects of different tending measures on carbon density, storage, and alocation pattern of Phyllostachy edulis forests in western Fujian Province. Chin. J. Ecol. 2009, 28, 1482–1488. (In Chinese) [Google Scholar]
  49. Du, M. Study on Carbon Balance of Moso Bamboo (Phyllostachys edulis) Forest Ecosystem under Different Fertilization Treatment, Northwestern Fujian, China. Ph.D. Thesis, Chinese Academy of Forestry, Beijing, China, 2013. (In Chinese). [Google Scholar]
  50. Feng, G. Study on the Relationship of the Characteristic of Phyllostachys pubescens Rhizosphere Soil Microbial Biomass and Carbon Storage in Different Fertilizer Processing. Master’s Thesis, Jiangxi Agricultural University, Nanchang, China, 2013. (In Chinese). [Google Scholar]
  51. Tang, X.; Fan, S.; Qi, L.; Liu, G.; Guan, F.; Du, M.; Sheng, C. Effect of Different Managements on Carbon Storage and Carbon Allocation in Moso Bamboo Forest (Phyllostachys pubescen). Acta Agric. Univ. Jiangxiensis 2012, 34, 736–742. (In Chinese) [Google Scholar] [CrossRef]
  52. Chen, B.; Liu, G.; Cai, C.; Li, Y. Effects of Fertilization Modes on Carbon Reserves and Soil Physi-Chemical Properties in a Phyllostachys edulis Forest. J. Sichuan Agric. Univ. 2018, 36, 323–328. (In Chinese) [Google Scholar] [CrossRef]
  53. Li, C.; Shi, Y.; Zhou, G.; Zhou, Y.; Xu, L.; Tong, L.; Liu, X. Effects of Different Management Approaches on Soil Carbon Dynamics in Moso Bamboo Forest Ecosystems. CATENA 2018, 169, 59–68. [Google Scholar] [CrossRef]
  54. Li, Y.; Zhang, J.; Chang, S.X.; Jiang, P.; Zhou, G.; Fu, S.; Yan, E.; Wu, J.; Lin, L. Long-Term Intensive Management Effects on Soil Organic Carbon Pools and Chemical Composition in Moso Bamboo (Phyllostachys pubescens) Forests in Subtropical China. For. Ecol. Manag. 2013, 303, 121–130. [Google Scholar] [CrossRef]
  55. Kurmi, B.; Nath, A.J.; Lal, R.; Das, A.K. Water Stable Aggregates and the Associated Active and Recalcitrant Carbon in Soil under Rubber Plantation. Sci. Total Environ. 2020, 703, 135498. [Google Scholar] [CrossRef]
  56. Pinnola, A.; Bassi, R. Molecular Mechanisms Involved in Plant Photoprotection. Biochem. Soc. Trans. 2018, 46, 467–482. [Google Scholar] [CrossRef]
  57. Qin, H.; Chen, J.; Wu, Q.; Niu, L.; Li, Y.; Liang, C.; Shen, Y.; Xu, Q. Intensive Management Decreases Soil Aggregation and Changes the Abundance and Community Compositions of Arbuscular Mycorrhizal Fungi in Moso Bamboo (Phyllostachys pubescens) Forests. For. Ecol. Manag. 2017, 400, 246–255. [Google Scholar] [CrossRef]
  58. Six, J.; Bossuyt, H.; Degryze, S.; Denef, K. A History of Research on the Link between (Micro)Aggregates, Soil Biota, and Soil Organic Matter Dynamics. Soil Tillage Res. 2004, 79, 7–31. [Google Scholar] [CrossRef]
  59. Mahal, N.K.; Osterholz, W.R.; Miguez, F.E.; Poffenbarger, H.J.; Sawyer, J.E.; Olk, D.C.; Archontoulis, S.V.; Castellano, M.J. Nitrogen Fertilizer Suppresses Mineralization of Soil Organic Matter in Maize Agroecosystems. Front. Ecol. Evol. 2019, 7, 59. [Google Scholar] [CrossRef]
  60. Mulvaney, R.L.; Khan, S.A.; Ellsworth, T.R. Synthetic Nitrogen Fertilizers Deplete Soil Nitrogen: A Global Dilemma for Sustainable Cereal Production. J. Environ. Qual. 2009, 38, 2295–2314. [Google Scholar] [CrossRef]
  61. Yang, C.; Ni, H.; Su, W.; Zhong, Z.; Zhang, X.; Bian, F.; Li, W. Effects of management measures on organic carbon, nitrogen and chemical structure of different soil fractions in Phyllostachys edulis plantations. J. Appl. Ecol. 2020, 31, 25–34. (In Chinese) [Google Scholar] [CrossRef]
  62. Fan, Y. An Analysis on the Differences of Carbon Storage of Phyllostachys edulis Ecosystem under the Terrain Conditions and Management Intensity. Master’s Thesis, Zhejiang A&F University, Hangzhou, China, 2016. (In Chinese). [Google Scholar]
  63. Shi, Y.; Wang, S.; Fang, W.; Zhen, M.; Jiang, B.; Shao, S.; Ma, X.; Xu, Q. Bamboo Invades Surrounding Forest Increased Soil pH, Changed Soil Chemical Nutrient and Microbial Community: A Meta Analysis. Acta Pedol. Sin. 2023, 6, 1–17. (In Chinese) [Google Scholar] [CrossRef]
  64. Davidson, E.A.; Trumbore, S.E.; Amundson, R. Soil Warming and Organic Carbon Content. Nature 2000, 408, 789–790. [Google Scholar] [CrossRef]
  65. Miao, Y.; Liu, M.; Xuan, J.; Xu, W.; Wang, S.; Miao, R.; Wang, D.; Wu, W.; Liu, Y.; Han, S. Effects of Warming on Soil Respiration during the Non-Growing Seasons in a Semiarid Temperate Steppe. J. Plant Ecol. 2020, 13, 288–294. [Google Scholar] [CrossRef]
  66. Liu, L.; Xing, S.; Gao, C. Research methods and influencing factors of soil carbon storage. Wuyi Sci. 2007, 23, 219–226. (In Chinese) [Google Scholar] [CrossRef]
  67. Means, M.M.; Ahn, C.; Noe, G.B. Planting Richness Affects the Recovery of Vegetation and Soil Processes in Constructed Wetlands Following Disturbance. Sci. Total Environ. 2017, 579, 1366–1378. [Google Scholar] [CrossRef]
  68. Qi, L.; Ai, W.; Fan, S.; Yang, M.; Meng, Y.; Du, M.; Mao, C. Dynamics and Influencing Factors of Soil Readily Oxidizable Carbon of Moso bamboo Stands under Different Management Patterns in the Hilly Region of Central Hunan. For. Sci. Res. 2013, 26, 655–660. (In Chinese) [Google Scholar] [CrossRef]
  69. Ni, H.; Su, W.; Fan, S.; Chu, H. Effects of Intensive Management Practices on Rhizosphere Soil Properties, Root Growth, and Nutrient Uptake in Moso Bamboo Plantations in Subtropical China. For. Ecol. Manag. 2021, 493, 119083. [Google Scholar] [CrossRef]
  70. Liu, D.; Ju, W.; Jin, X.; Li, M.; Shen, G.; Duan, C.; Guo, L.; Liu, Y.; Zhao, W.; Fang, L. Associated Soil Aggregate Nutrients and Controlling Factors on Aggregate Stability in Semiarid Grassland under Different Grazing Prohibition Timeframes. Sci. Total Environ. 2021, 777, 146104. [Google Scholar] [CrossRef]
  71. Huang, R.; Lan, M.; Liu, J.; Gao, M. Soil Aggregate and Organic Carbon Distribution at Dry Land Soil and Paddy Soil: The Role of Different Straws Returning. Environ. Sci. Pollut. Res. 2017, 24, 27942–27952. [Google Scholar] [CrossRef]
Figure 1. Geographical location of the study area.
Forests 15 00496 g001
Figure 2. Setting of sample plots in the study area, where HT represents sample plots under high-intensity treatment, MT represents sample plots under moderate treatment, and CK represents sample plots under regular management.
Forests 15 00496 g002
Figure 3. Distribution of literature research sites for carbon stocks in moso bamboo forests.
Forests 15 00496 g003
Figure 4. Distribution of literature research sites for soil carbon stocks.
Forests 15 00496 g004
Figure 5. Carbon stocks in moso bamboo forests under different treatments of management measures. Values in the graphs are (mean ± standard deviation). Different lowercase letters in the graphs indicate significant differences (p < 0.05). HT represents the high-intensity treatment group, MT represents the moderate treatment group, and CK represents the regular management group.
Forests 15 00496 g005
Figure 6. Soil carbon stock in each soil layer under different treatment and management measures. Values in the graphs are (mean ± standard deviation). Different lowercase letters in the graphs indicate significant differences (p < 0.05) HT represents the high-intensity treatment group, MT represents the moderate treatment group, and CK represents the regular management group.
Forests 15 00496 g006
Figure 7. Forest plot of the effects of different management measures on carbon stock in moso bamboo forests [34,43,44,45,46,47,48,49,50,51].
Forests 15 00496 g007
Figure 8. Forest plot of the effects of different management measures on soil carbon stocks [32,33,43,48,49,52,53,54].
Forests 15 00496 g008
Figure 9. Effectiveness of different management practices on soil carbon stocks in different soil layers. Different colors represent different subgroups.
Forests 15 00496 g009
Table 1. Specific measures operated under different management modes and intensities.
ModesTreatmentSpecific Measures
HTIntensive Fertilization Fertilize 1800 kg·ha−1 per two years in two applications
Intensive HarvestingTotal harvesting of three-degree bamboo
MTMedium Fertilization Fertilize 900 kg·ha−1 per two years in two applications
Medium HarvestingHalf harvesting of three-degree bamboo
CKNo FertilizationNo fertilization is applied
Weak HarvestingNo harvesting of three-degree bamboo
Disclaimer/Publisher’s Note: The statements, opinions and data contained in all publications are solely those of the individual author(s) and contributor(s) and not of MDPI and/or the editor(s). MDPI and/or the editor(s) disclaim responsibility for any injury to people or property resulting from any ideas, methods, instructions or products referred to in the content.

