Article

Ipomoea cairica (L.) from Mangrove Wetlands Acquired Salt Tolerance through Phenotypic Plasticity

1
Guangdong Provincial Key Laboratory of Biotechnology for Plant Development, School of Life Science, South China Normal University, Guangzhou 510631, China
2
Guangzhou Key Laboratory of Subtropical Biodiversity and Biomonitoring, School of Life Science, South China Normal University, Guangzhou 510631, China
3
Key Laboratory of Vegetation Restoration and Management of Degraded Ecosystems, South China Botanical Garden, Chinese Academy of Sciences, Guangzhou 510650, China
*
Authors to whom correspondence should be addressed.
These authors contributed equally to this work.
Forests 2024, 15(2), 358; https://doi.org/10.3390/f15020358
Submission received: 31 December 2023 / Revised: 6 February 2024 / Accepted: 8 February 2024 / Published: 12 February 2024
(This article belongs to the Topic Plant Invasion)

Abstract

:
Palmate-leaved morning glory (Ipomoea cairica (L.) Sweet) is a fast-growing perennial herbaceous twining vine that was recently discovered to invade mangrove wetlands in China. To understand the mechanism of its successful invasion, the salt tolerance of a coastal ecotype from Zhuhai and a terrestrial ecotype from Guangzhou were compared under salt stress. The morphological, physiological, and biochemical parameters related to growth, ion homeostasis, photosynthetic pigments, chlorophyll fluorescence parameters, oxidative stress, and apoptosis were measured in both ecotypes. Monitoring apoptosis showed that the protoplasts of the coastal ecotype underwent apoptosis and were later compared with those of the terrestrial ecotype. The coastal ecotype was also found to have higher regenerated stems; less water loss, sodium (Na+) uptake, and membrane damage; higher salt gland density and area; and better photosynthetic performance than the terrestrial ecotype. The coastal ecotype probably prevented salt-related damage by reducing its water loss and secreting excess Na+ through its lower stomatal density and higher density and area of salt glands. The coastal ecotype also maintained a better balance of Na+, potassium ions, nitrogen, and phosphorus under salt stress. Moreover, the coastal ecotype had higher activities of antioxidant enzymes, including superoxide dismutase, peroxidase, and catalase, and a higher content of non-enzymatic antioxidants, including proline and anthocyanins, which indicate a stronger antioxidant ability. Our results suggest that the coastal ecotype adapts to a higher salt tolerance than the terrestrial ecotype by enhancing its exclusion of salt, adjusting its osmolytes, and through photosynthetic efficiency, which could explain its successful invasion in the mangrove wetland ecosystem.

1. Introduction

A rapidly growing number of alien invasive species is causing increasing damage to Chinese agriculture, forestry, and livestock industries [1], with annual economic losses that exceed USD 100 billion [2]. In the hotspots of the introduced species, such as coastal zones, biological invasions are becoming a major driver of the decline in biodiversity and loss of ecological services in communities, such as coastal forests [3,4]. Mangroves are unique higher plant communities that are widely distributed in the intertidal zones of tropical and subtropical regions. They are unique wetland forest ecosystems in the coastal zone. Owing to their high productivity and biodiversity, the abundance of biological resources and species in the mangrove wetland ecosystem is among the highest in the natural environment [5,6]. However, the mangrove wetland ecosystem has been severely degraded, and one of the reasons for the degradation is the invasion of alien species, including smooth cordgrass (Spartina alterniflora) and bitter vine (Mikania micrantha) [7,8]. Palmate-leaved morning glory (Ipomoea cairica) is a typical invasive plant in south China, which has caused severe damage to ecosystems and local economies [9]. This plant has been listed as one of the worst invasive alien species in China [10]. In some previous studies, I. cairica was reported to invade mangroves along the southeastern coast of China [9,11]. The vine that invades mangrove wetlands in Zhuhai is a potential salt-tolerant plant. Compared with other habitats, the soil of mangroves is more saline [12]. Therefore, salt tolerance is a limiting factor for invasive plants to invade mangroves.
The most extensive and profound effect of an external salt environment on plants is its inhibition of plant growth and development [13]. For example, salt alters many functional and biochemical processes in plants, which can lead to reduced growth, productivity, and even death. Tissue dehydration, ion-specific toxicity, nutrient shortages, and hormonal/enzymatic imbalances are the primary mechanisms that are affected by salt stress [13,14]. As a result, salt stress leads to a variety of physiological and molecular changes and impedes the growth of plants by impairing photosynthesis, which reduces the availability of resources and suppresses cell division and expansion [15]. Photosynthesis is the primary driver for plant growth and development and is one of the physiological processes of plants that are the most sensitive to stress [16]. Changes in photosynthesis are directly related to the chlorophyll fluorescence parameters of Photosystem II (PSII) [17]. Analyses of the chlorophyll fluorescence parameters can rapidly determine the photochemical efficiency of the plant PSII without damaging the plant, and it is an important method to diagnose whether PSII is functional and analyze the mechanism of the plant’s response to stress [18,19]. Therefore, monitoring different chlorophyll fluorescence parameters can provide important information on the changes in plant photosynthetic dynamics under a wide range of environmental stresses [19]. The osmotic potential is another important indicator that is related to salt stress [20]. When the osmotic potential in a plant exceeds that of the external environment, it is difficult for the plant to absorb enough water, which causes a physiological water shortage in the plant; this is also known as osmotic stress [21]. Salt tolerance in plants is implemented at both the organ and cellular levels. The stomata play key roles in the survival of plants in adverse environments. A reduction in the stomatal density may delay the accumulation of toxic ions and signaling molecules that inhibit growth in the leaves by reducing the transpiration flow under salt stress, thus facilitating the adaptation to salinity stress [22,23]. Salt glands actively secrete excessive amounts of ions from the plant cells to avoid toxicity [24].
Previous research on I. cairica has primarily focused on its invasion in terrestrial ecosystems. I. cairica has high rates of stem growth and photosynthesis, and it can reproduce asexually [9,25,26]. Compared with native companion species, I. cairica is more resistant to abiotic stressors, such as heat and drought, which enables it to rapidly invade tropical and subtropical terrestrial ecosystems [27,28]. The resistance of I. cairica to stress primarily originates from its high antioxidant capacity and the stability of its photosynthetic system. The levels of expression of IcSRO1 (SIMILAR TO RCD-One) and IcOr (ORANGE) in I. cairica under unfavorable conditions were higher than those in the non-invaded plants [11,28]. However, the mechanism of its invasion in coastal wetland ecosystems remains unknown. Therefore, understanding the responses of I. cairica to salt stress and its associated mechanisms of tolerance may help to explain its adaptation to mangrove wetlands.
This study investigated coastal ecotypes in the mangrove wetland ecosystem and terrestrial ecotypes in the inland ecosystem and compared their responses to salt stress. The results provide evidence for how I. cairica maintains its ability to invade during the process of diffusing from non-salt to salty habitats.

2. Materials and Methods

2.1. Plant Material and Growth Conditions

The terrestrial ecotype of I. cairica was collected from the Biological Park of South China Normal University, Tianhe District, Guangzhou City, China (23.13° N, 113.35° E). The coastal ecotype of I. cairica was collected from the Qi’ao Mangrove Wetland Park in the Gaoxin District, Zhuhai City, China (22.43° N, 113.62° E). Stems of I. cairica that were 10 cm long and had two nodes were selected for cultivation in one-half Hoagland nutrient solution (pH = 5.7) that contained 0.48 mmol/L, 50 mmol/L, and 100 mmol/L of Na+ [29]. NaCl was used to provide sodium (Na+) for both control and treatment groups. The solution was changed every 4 days(d). The root lengths were measured after 2 weeks of cultivation. Seedlings that had been cultivated in 0.48 mmol/L Na+ were transplanted into flowerpots that contained clean sand that had been filtered through a 10-mesh sieve. Solely during the root growth experiment, a medium that contained 0.48 mmol/L Na+ was used for the control, while media that contained 50 mmol/L and 100 mmol/L Na+ were used for the treatment. For the other experiments, one-half Hoagland nutrient solution (150 mmol/L Na+) was used for the salt treatments, while 0.48 mmol/L Na+ was used for the control.

2.2. Plant Harvest and Growth Parameters

Nondestructive growth parameters, including the root length, tendency of the main stem to grow, leaf number during the salt treatment, branch number, and number of flowers, were measured every 10 d for a total of 60 d. In addition, the growth of the main stem was measured with a tape measure (cm), and the root length was measured with a straight edge ruler (cm). The plant harvest and growth parameters were measured as described by Luo et al. [30] and Kumar et al. [31]. After the harvest, the roots were carefully rinsed with tap water; the stems and roots were separated with scissors; the surface water was wiped off with absorbent paper; and the fresh weights of the aboveground parts and roots were measured using an electronic balance. Moreover, two leaves in each replicate were selected and immediately weighed as the fresh weight (FW). The leaves were then immersed in distilled water for 24 h in the dark and weighed to obtain the turgid weight (TW) after the superficial moisture had been dried. The leaves were subsequently placed in a kraft bag, oven-dried at 70 °C for 48 h, and measured as the dry weight (DW). The leaf relative water content (%) was measured as described by Kumar et al. [31] using the following formula:
LRWC = [(FW − DW)/(TW − DW)] × 100
Furthermore, the root-to-shoot ratio was calculated using the root dry weight/shoot dry weight as previously described [30]. Each treatment had 12 replicates.

2.3. Salt Rejection and Ionic Balance

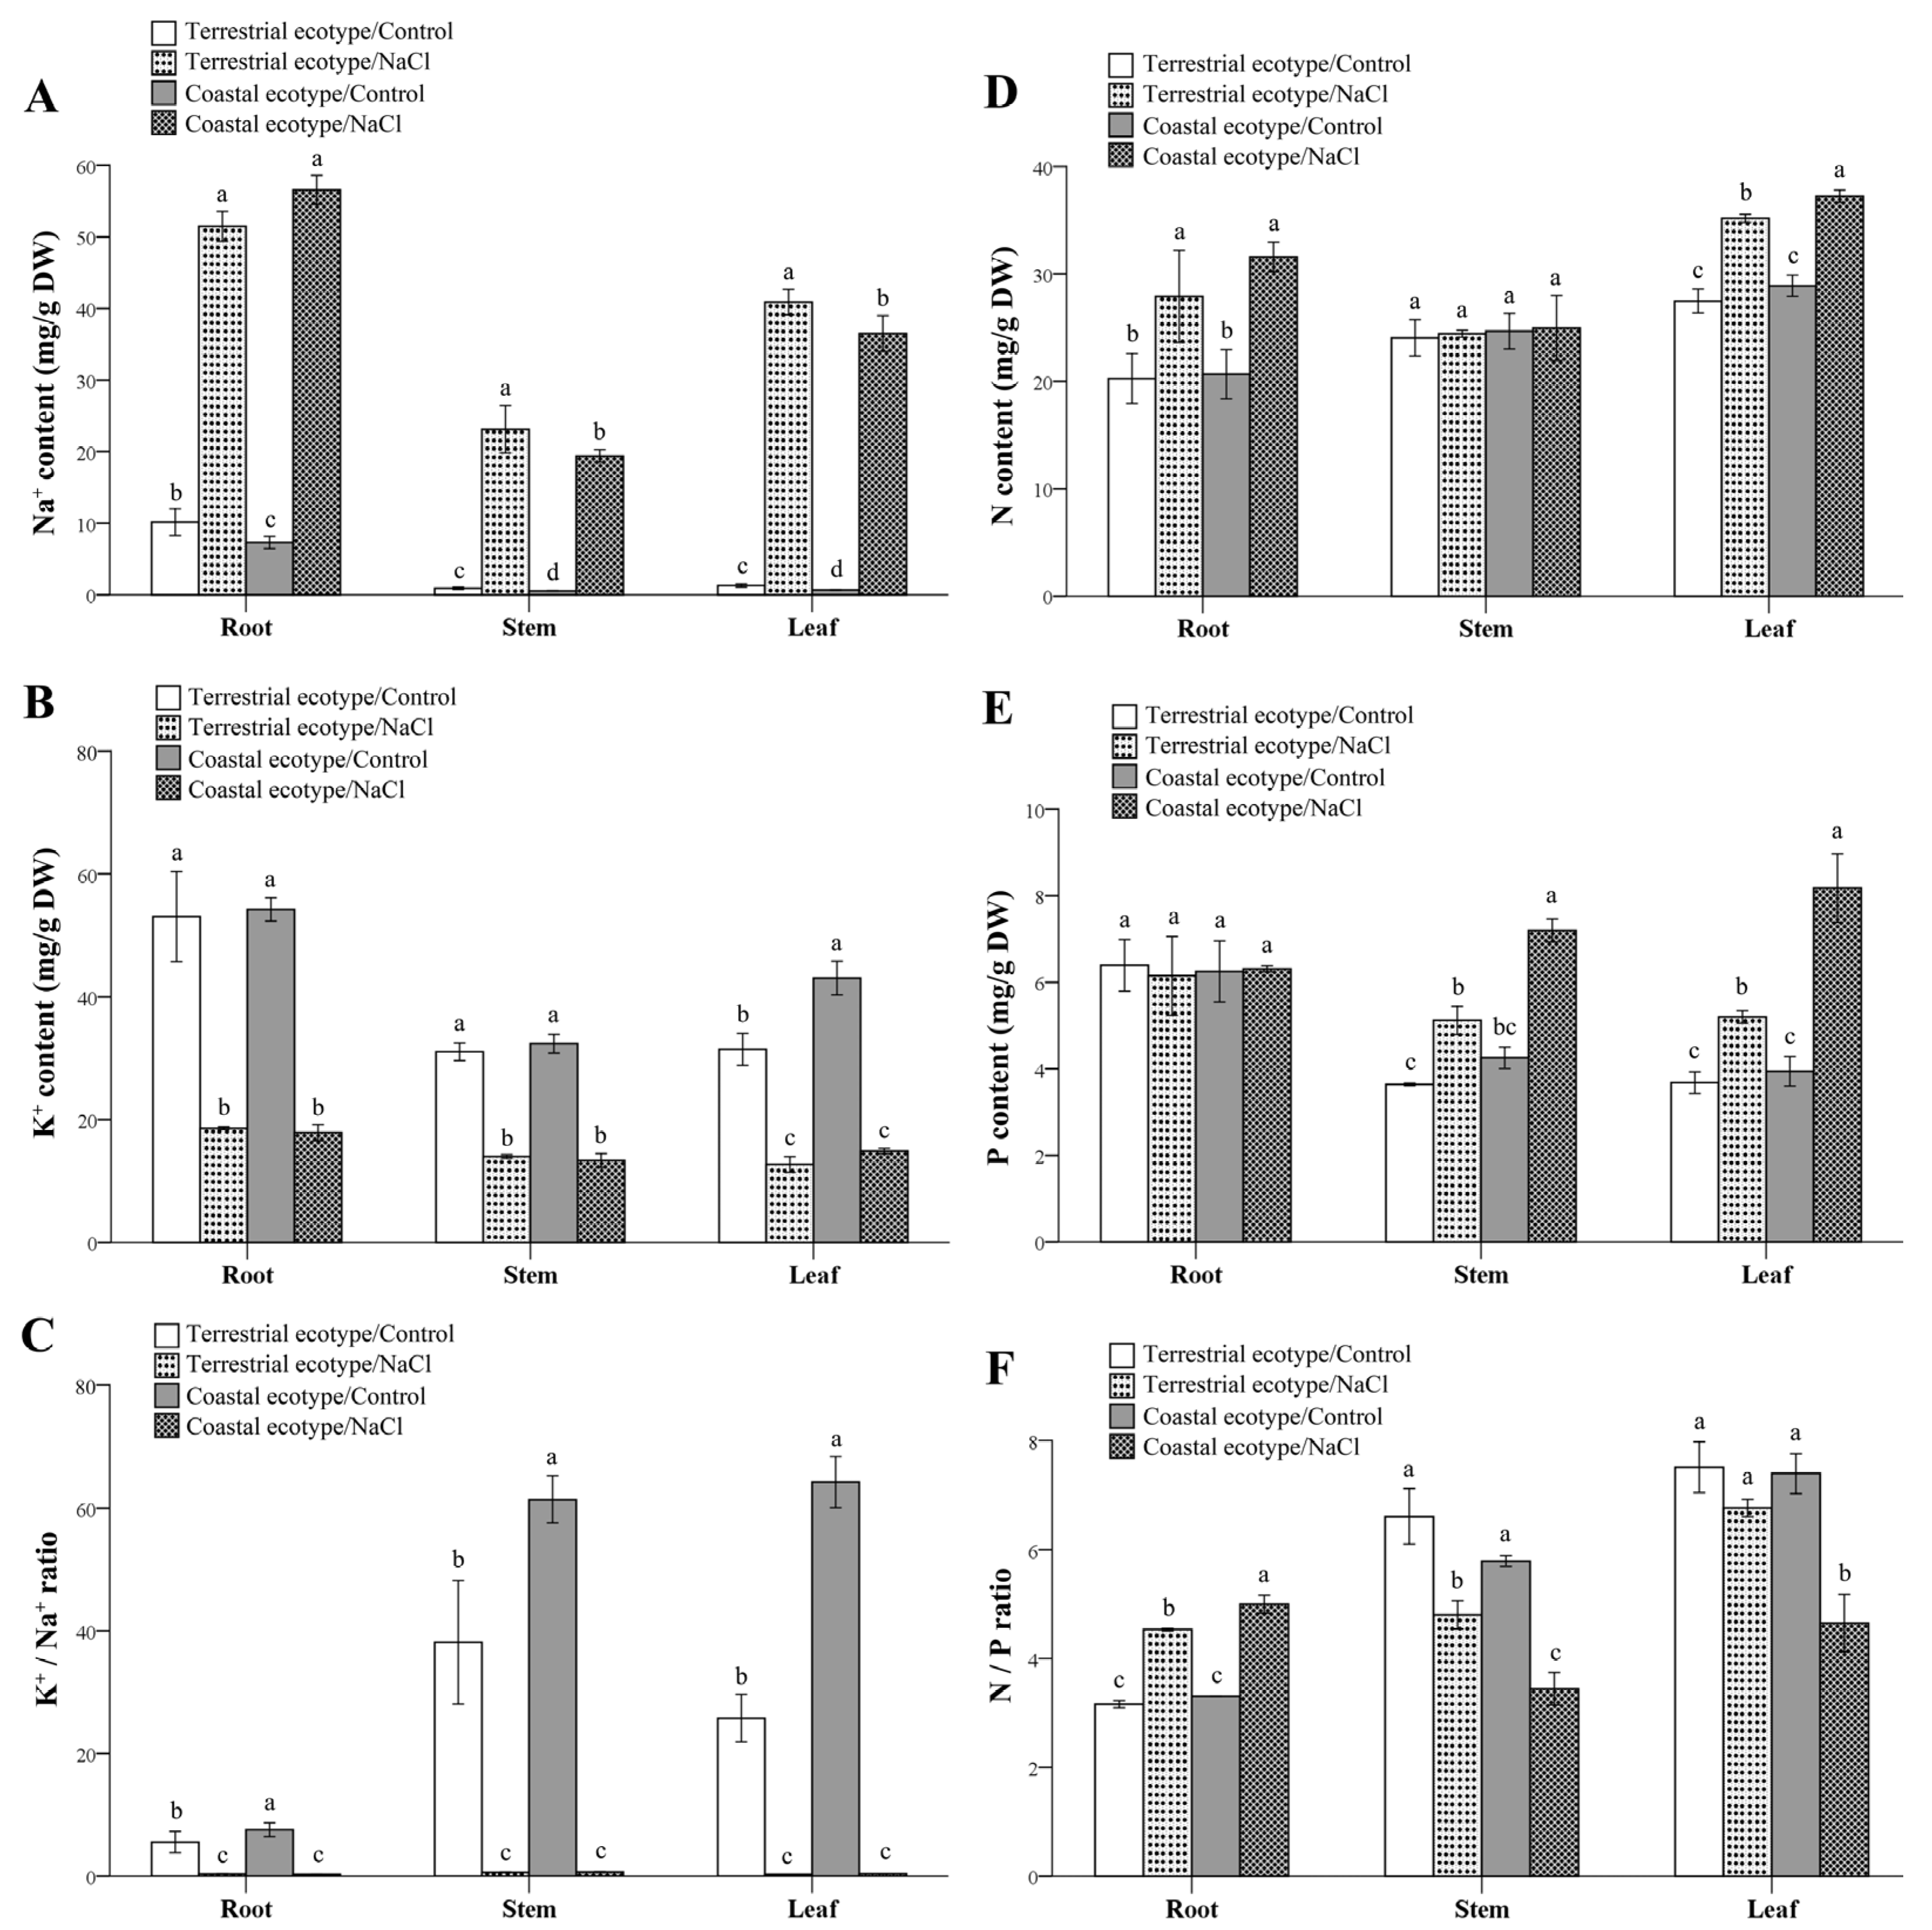
2.3.1. Determination of the Contents of Nitrogen, Phosphorus, Potassium, and Sodium in the Roots, Stems, and Leaves

After 60 d of cultivation, the plants were harvested and divided into three parts, including the roots, stems, and leaves. All of the materials were heated at 110 °C for 1.5 h and at 75 °C for 2 d until stable. The shoots and roots were crushed and passed through a 20-mesh sieve. After dehydration, carbonization, and oxidation by digestion with sulfuric acid·hydrogen peroxide (H2SO4·H2O2) as previously described [32], the organic matter in the sample was destroyed and transformed to inorganic salts. After dilution with acid, an atomic absorption spectrophotometer (AA-7000; Shimadzu, Kyoto, Japan) was used to measure the contents of nitrogen (N), phosphorus (P), potassium (K), and Na+ in each sample. Each treatment had 12 replicates.

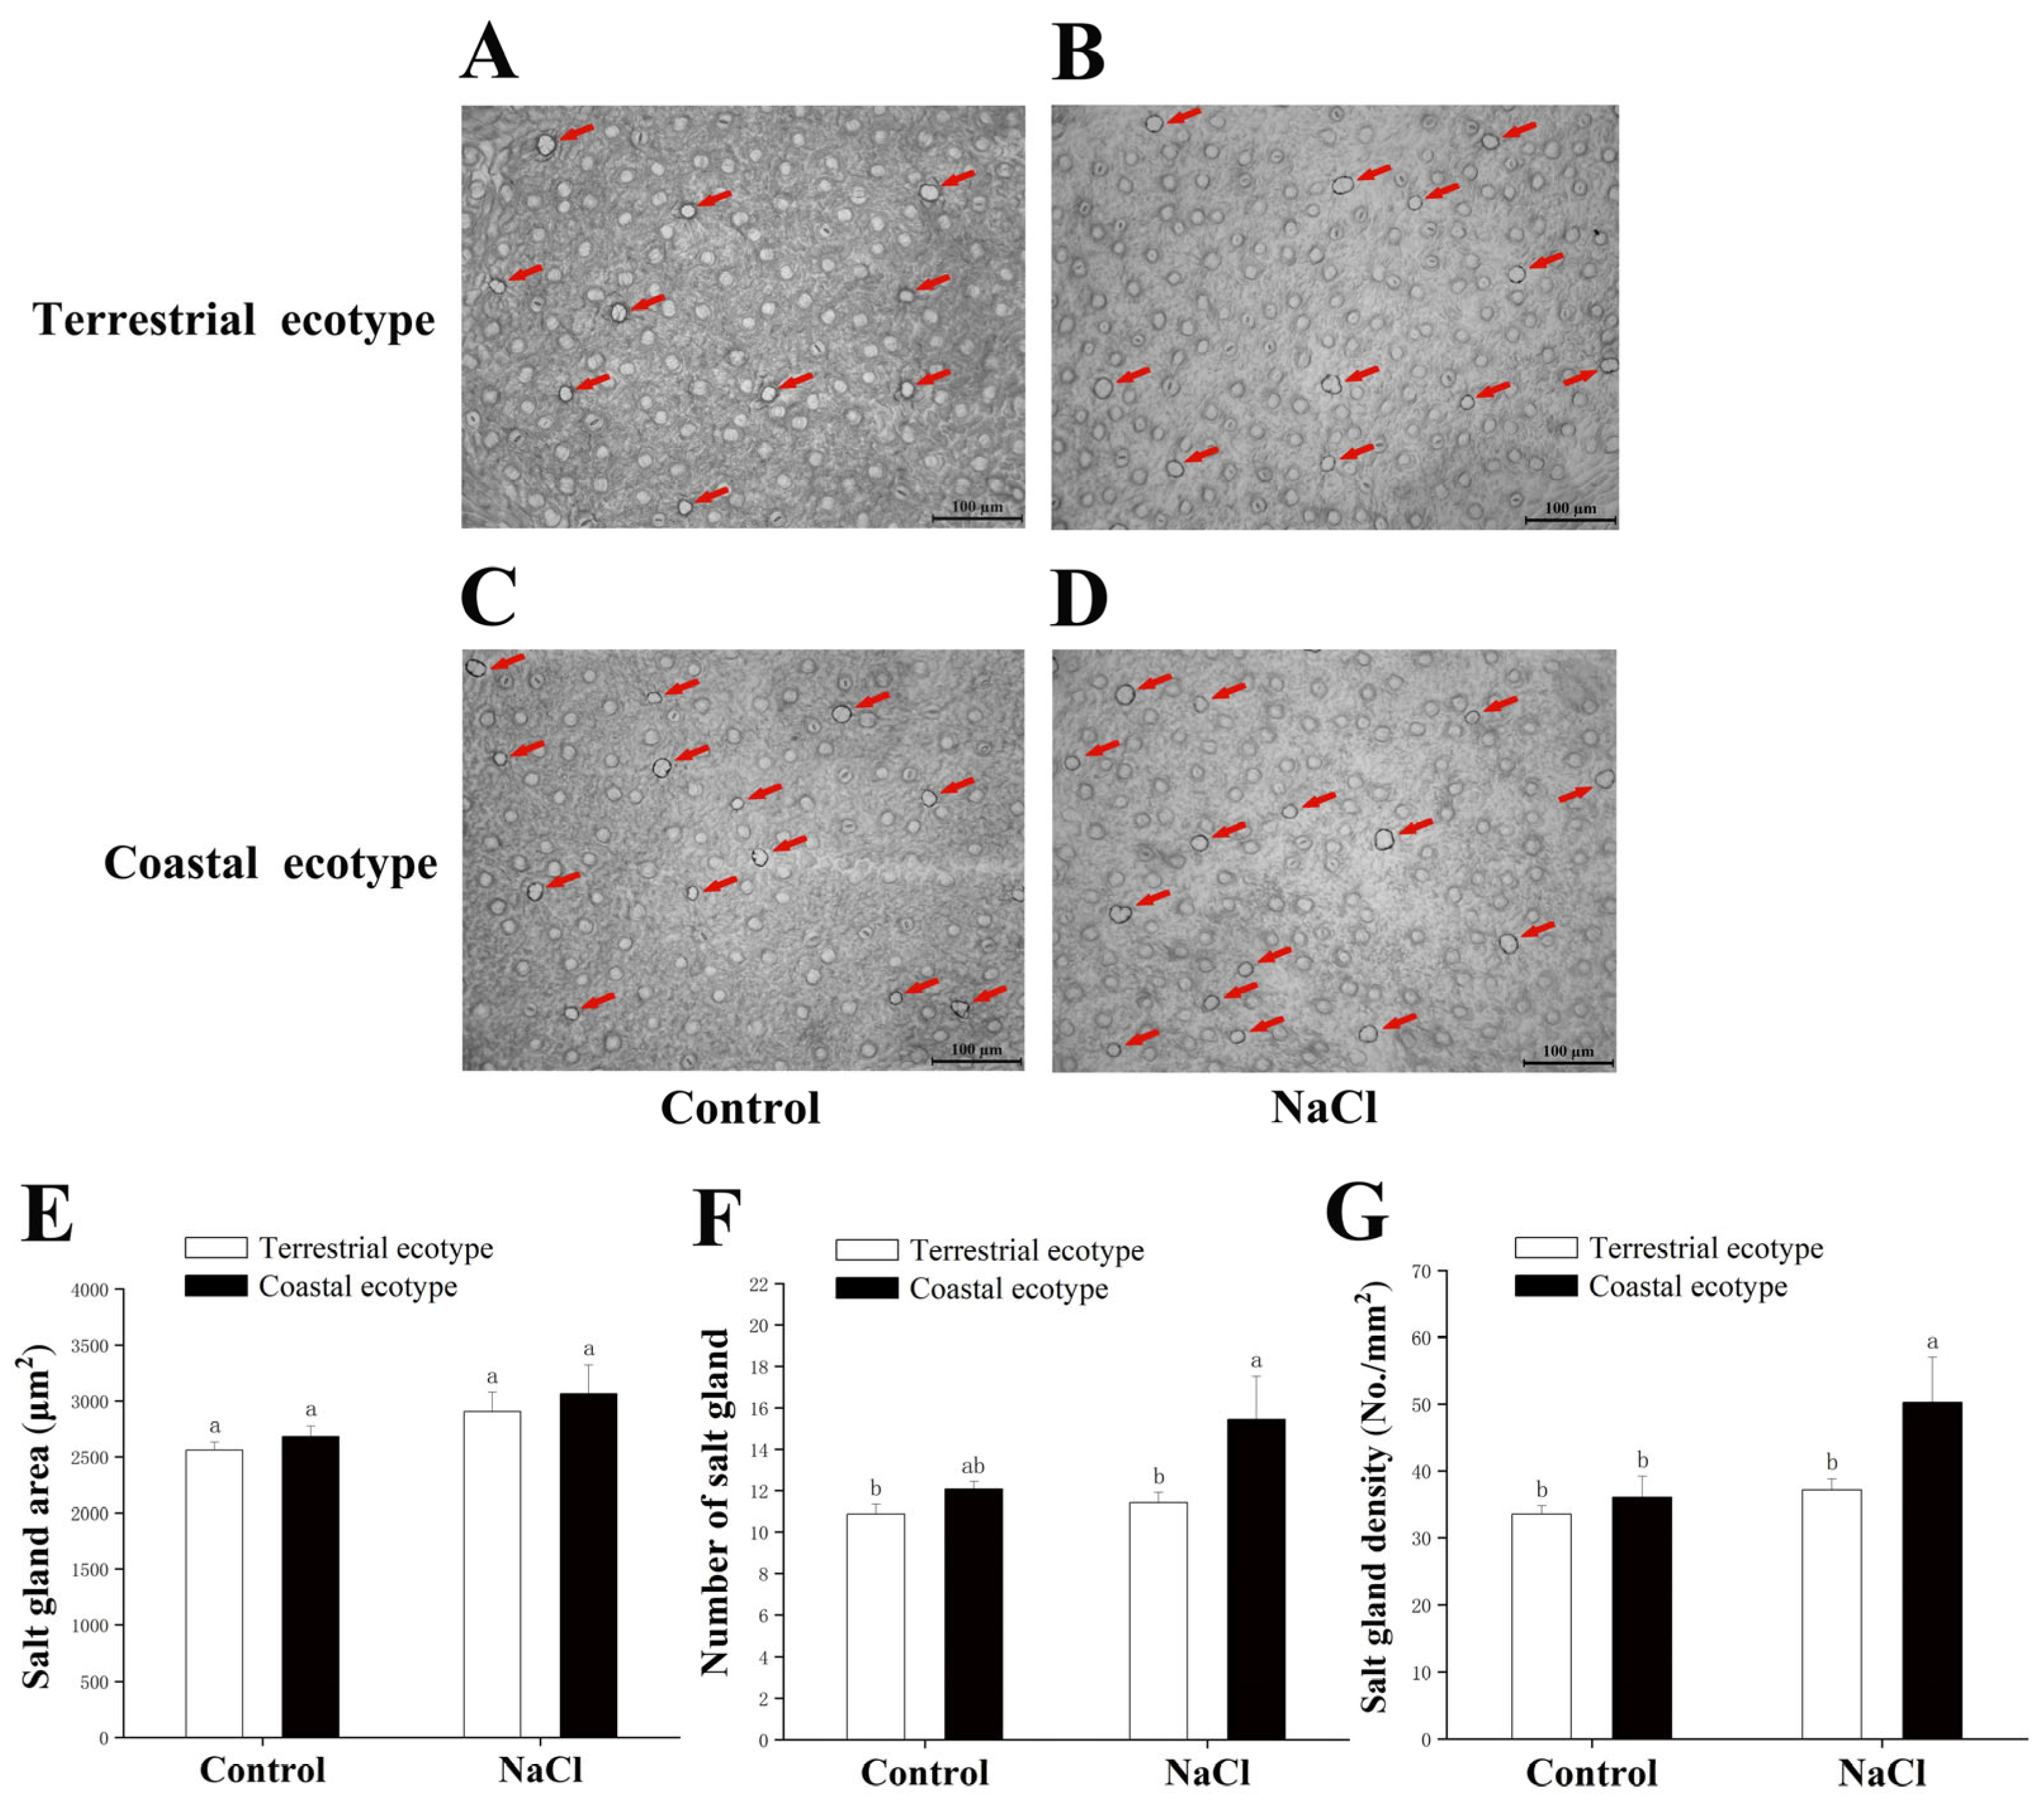
2.3.2. Measurement of the Density and Area of the Salt Glands

In combination with a slight modification of a previous method [33], the back of the leaf blade was coated with clear nail polish. The dried nail polish layer was then peeled off with tweezers and placed on a glass slide. These blotches were then observed under a 5× objective light microscope, and the field of view was photographed numerous times. The number of all the salt glands in the field of view and the area of the salt glands were calculated using ImageJ (NIH, Bethesda, MD, USA), which were used to calculate the density of the salt glands (the total number of salt glands per unit leaf area in the field of view) and their area as previously described [34,35]. The density of salt glands was calculated as the total number of salt glands divided by the per unit leaf area of 10 replicate observations as described by Ding et al. [36] and Leng et al. [37]. There were 150 samples per treatment and line (three epidermal samples per leaf × five fields of view per sample ×10 biological replicates). The total area of at least 10 salt glands at different locations in the field of view was measured using ImageJ. Each treatment had 10 replicates, including three epidermal samples per replicate, five fields of view per sample, and at least 10 salt glands per field of view.

2.4. Determination of the Relative Electrical Conductivity (REC) and Content of Malondialdehyde (MDA)

2.4.1. Determination of the Relative Electrical Conductivity

The REC was measured using a DJS-1D conductivity meter (Leica, Shanghai, China). A total of 0.1 g of fresh leaf samples were cut into approximate squares, immersed in 10 mL of deionized water in a test tube, and soaked for 2 h at 25 °C to measure the electrical conductivity, R1. After this, the sample was boiled for 30 min, and once the temperature dropped to room temperature, the conductivity of R2 was measured. The REC was used to represent the cell membrane permeability. The content of REC was calculated using the following formula: R1/R2 × 100% [38]. Each treatment had 12 replicates.

2.4.2. Determination of the Relative Content of Malondialdehyde (MDA)

The content of MDA was measured as described by Hodges et al. [39] with slight modifications. Briefly, 0.1 g of fresh leaves was ground in 2 mL of 5% (w/v) trichloroacetic acid (TCA) on ice. The extract was transferred to an Eppendorf centrifuge tube and then centrifuged at 8000 rpm for 15 min at 4 °C. A volume of 1 mL of supernatant was mixed with 1 mL of 0.6% (w/v) thiobarbituric acid (TBA) and heated in boiling water for 30 min. After cooling, the mixture was centrifuged at 6000 rpm for 10 min. The supernatant was extracted, and the values of absorbance were measured at three different wavelengths, 600, 532, and 450 nm, using a DU730 UV/Vis Spectrophotometer (Beckman Coulter, Inc., Brea, CA, USA). The concentration of MDA in the mixture (μmol/L) = 6.45 × (A532 − A600) − (0.56 × A450). Each treatment had 12 replicates.

2.5. Detection of Apoptosis and the Integrity of Root Cell Membranes

Four-week-old leaves of I. cairica were obtained and cut into strips of 0.74–1.25 mm, immersed in an enzymolysis solution, and digested for 5–6 h. The digestive solution that was obtained was passed through a 50 μm sieve, transferred to a 10 mL centrifuge tube, and centrifuged at 100 rpm for 5 min at 4 °C. After the supernatant was removed, the precipitate was washed with 0.5 M mannitol, purified by resuspension in 15% (w/(v) sucrose, and centrifuged at 178 rpm for 3 min at 4 °C to obtain the protoplasts. The enzyme solution contained the following compounds and enzymes: 2.0% (w/(v) cellulase R-10 (Yakult Honsha Co., Ltd., Tokyo, Japan), 0.1% (w/(v) macerozyme R-10 (Yakult Honsha Co., Ltd.), 0.5 M mannitol, 20 mM KCl, and 5 mM CaCl2. The pH was adjusted to 5.5 with KOH. The protoplasts were then resuspended in modified KM8P liquid media [40]. The apoptosis of cells was detected using Annexin V-FITC/PI (Sangon Biotech [Shanghai] Co., Ltd., Shanghai, China) double-staining flow cytometry [41]. Each treatment had 12 replicates.
The membrane integrity in the I. cairica root cells was detected using a slight modification of a method described by Lequeux et al. [42]. The roots of both I. cairica lines in Guangzhou and Zhuhai were treated with 100 mmol/L NaCl for 12 h, stained with 0.25% Evans blue for 15 min, and then washed three times with ultrapure water before they were photographed. The surfaces of these roots were observed under a microscope (DM3000; Leica, Wetzlar, Germany) after they had been stained with Evans blue. The roots were immersed in 3 mL of pure N,N-dimethylformamide (N,N-dimethylformamide, DMF, analytical grade) (Sigma-Aldrich, St. Louis, MO, USA) for 30 min, and the extract was obtained by filtering the roots. The absorbance of the extract at 600 nm was measured by spectroscopy on a DU730 UV/Vis spectrophotometer (Beckman Coulter, Inc.). Each treatment had 12 replicates.

2.6. Determination of the Anthocyanin Content and Antioxidant Enzyme Activities

2.6.1. Assays of the Antioxidant Enzymes

The antioxidant enzymes were extracted as described by Khalid et al. [43], with brief modifications. The main veins of the fresh leaves were removed, and 0.1 g of the sample was weighed and placed in a cold mortar. A volume of 1 mL of grinding buffer (50 mM PBS [pH = 7.8], 0.1 M EDTA-2Na, 0.1% [v/v] Triton X-100, and 2% [w/v] polyvinylpyrrolidone [PVP]) and a small amount of quartz sand were added to the mortar, and the samples were ground to a homogenous paste. The homogenate was then transferred to a centrifuge tube, and the mortar was washed with 1 mL of grinding buffer. The homogenate was centrifuged for 15 min (12,000× g, 4 °C), and the supernatant was used for the subsequent enzyme assays. Each treatment had 12 replicates.
The activity of superoxide dismutase (SOD) was assayed as described by Liu et al. [44] and Khalid et al. [43], with minor modifications. A volume of 0.1 mL of the extract was pipetted into a 4 mL centrifuge tube that contained 2.6 mL of the mixture (0.3 mL of 130 mM Met, 1.7 mL of 50 mM PBS [pH = 7.8], 0.3 mL of 750 µmol L−1 nitroblue tetrazolium [NBT], and 0.3 mL of 100 µmol L−1 EDTA-2Na). Finally, 0.3 mL of 20 µM riboflavin was added. Two negative controls and one positive control were prepared. In the negative control, the enzyme extract was replaced with 50 mm of PBS (pH = 7.8), and the tube was placed in the dark. The positive control entailed the exposure of 50 mm of PBS (pH = 7.8), and the sample tubes were exposed to a 4000 lux fluorescent lamp for 20 min, followed by incubation in the dark. The absorbance of the reaction mixture at 560 nm was measured by spectrophotometry and set to zero by the negative control. A unit of SOD was defined as 50% inhibition of the blue-light chemical reduction in tetrazole min−1 g−1 of the leaf. Each treatment had 12 replicates.
The activity of peroxidase (POD) was assayed using the guaiacol method [45]. Briefly, 0.1 mL of enzyme and 2.9 mL of reaction mixture (1.875 mL of 50 mM PBS [pH = 7.0], 1 mL of 30 mM H2O2, and 0.025 mL of guaiacol) were pipetted into a cuvette, and 50 mM PBS (pH = 7.0) was used as the blank control. Measurements were taken 15 s after the reaction and then every 20 s for a total of nine measurements. Each treatment had 12 replicates.
The catalase (CAT) was assayed as described by Ghalati et al. [46]. The reaction mixture (3 mL) contained 2.9 mL of 30 mM H2O2 (Guangzhou Chemical Reagent Factory, Guangzhou, China) and 0.1 mL of enzyme extract. The decrease in absorbance was recorded at 240 nm. One unit of enzyme activity was defined as 1 nmol H2O2 dissociated·min−1. Each treatment had 12 replicates.

2.6.2. Determination of the Anthocyanin Content

The anthocyanin content was determined by washing fresh leaves of I. cairica with ultrapure water and blotting them with filter paper. A total of 0.1 g of leaves were extracted in 10 mL tubes that contained 4 mL of 1% HCl-methanol at 4 °C for 24 h. The supernatant was then centrifuged at 4500 rpm for 5 min and collected for testing. The absorbance of the supernatant at 530 nm was measured using a DU730 UV/Vis Spectrophotometer (Beckman Coulter, Inc.). The content of anthocyanin was calculated using a standard curve of cornflower-3-O-glucoside [47]. Each treatment had 12 replicates.

2.7. Determination of the Osmotic Adjustment Indicators

2.7.1. Determination of the Content of Proline

The content of Pro was measured as described by Shi et al. [48]. A total of 0.1 g of sample was added to 3 mL of 3% sulfosalicylic acid, incubated for 10 min in a boiling water bath, and then cooled and centrifuged at 6000× g for 10 min. A volume of 1 mL of the supernatant was then collected and mixed with 4 mL of extraction buffer (distilled water/glacial acetic acid/acidic ninhydrin = 1:1:2). The mixture was boiled for 1 h and cooled at room temperature. After that, 2 mL of toluene was added, and the phases were left to separate for 2 h. After full extraction, the red toluene phase was subjected to a colorimetric analysis at 520 nm. The content of Pro was calculated from a standard curve. Each treatment had 12 replicates.

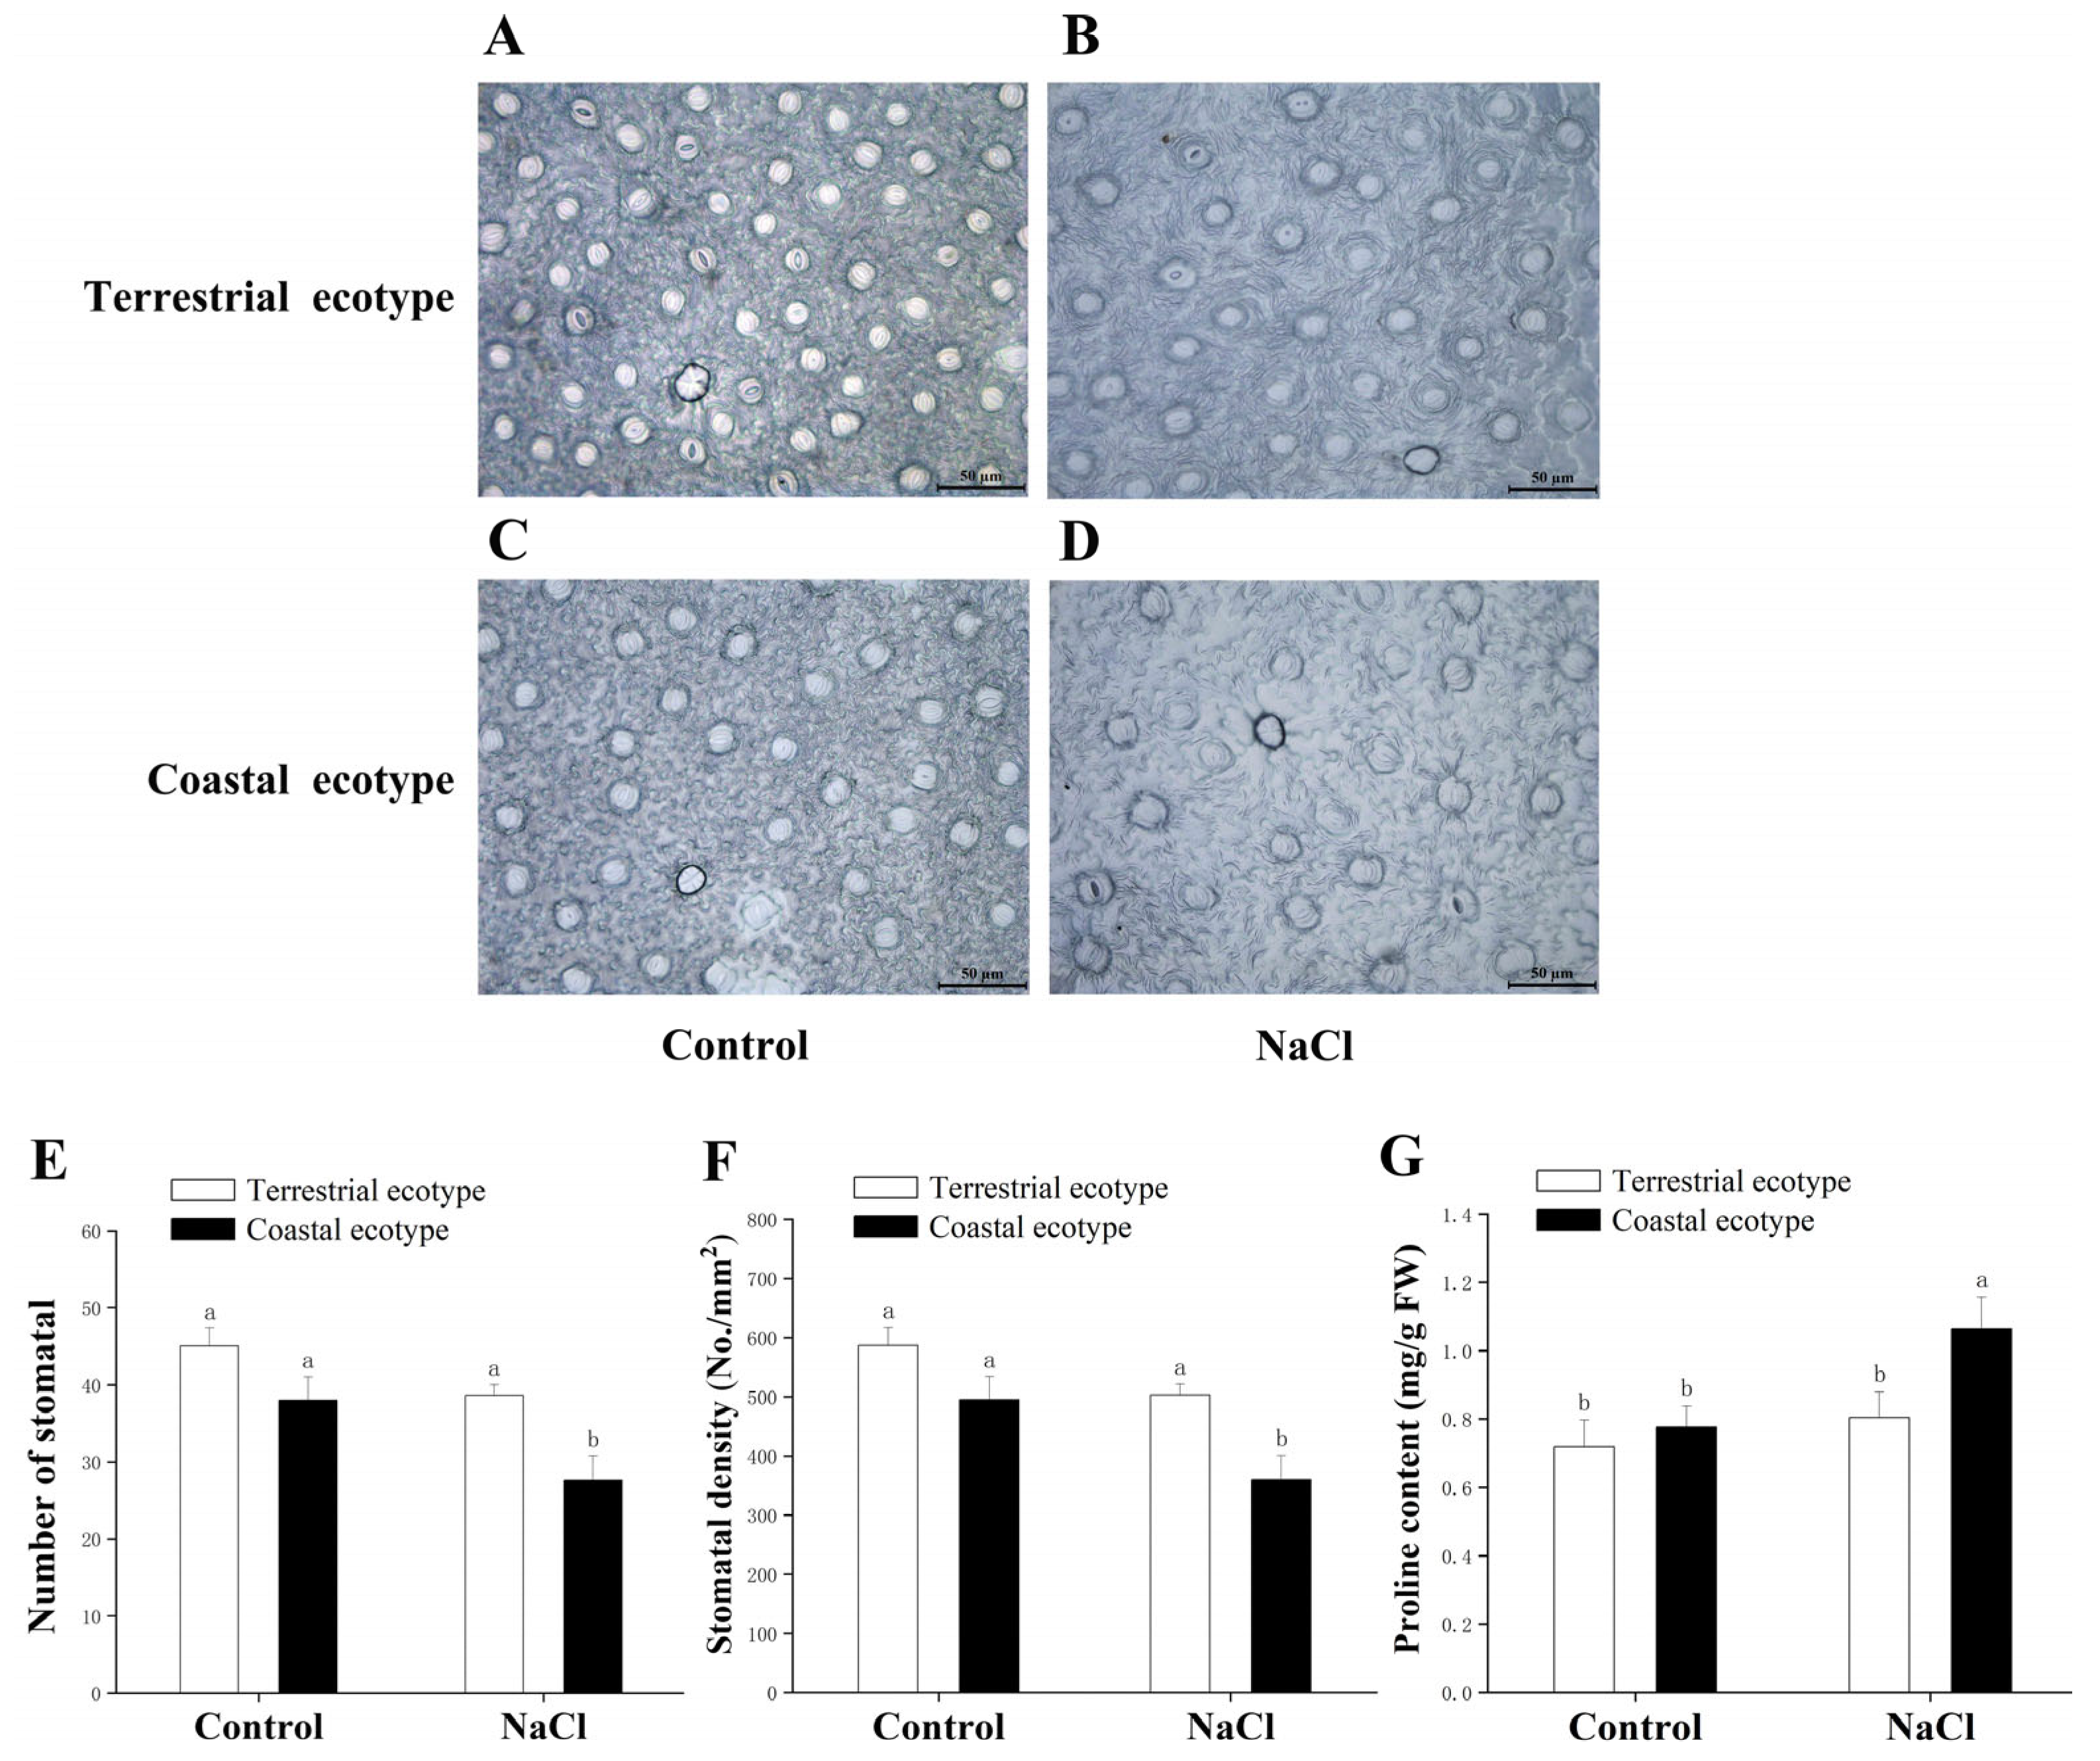
2.7.2. Measurement of Stomatal Density

The stomatal density was determined as described by Tao et al. [33]. Clear nail varnish was applied to the abaxial surface of the leaves. The dried layer of the nail varnish was then peeled off using tweezers and placed on a glass slide. The imprints were subsequently observed under an optical microscope with a 10× objective. A certain number of pictures of the field of view were taken, and the number of all the stomata in the field of view was counted using ImageJ. This program was used to calculate the stomatal density (the number of stomata per unit of leaf area in the field of view) with the number of stomata/the area of the field of view. The sample size for each treatment and line was 150 (three epidermal samples per leaf × five fields of view per sample × ten biological replicates). Each treatment had 10 replicates.

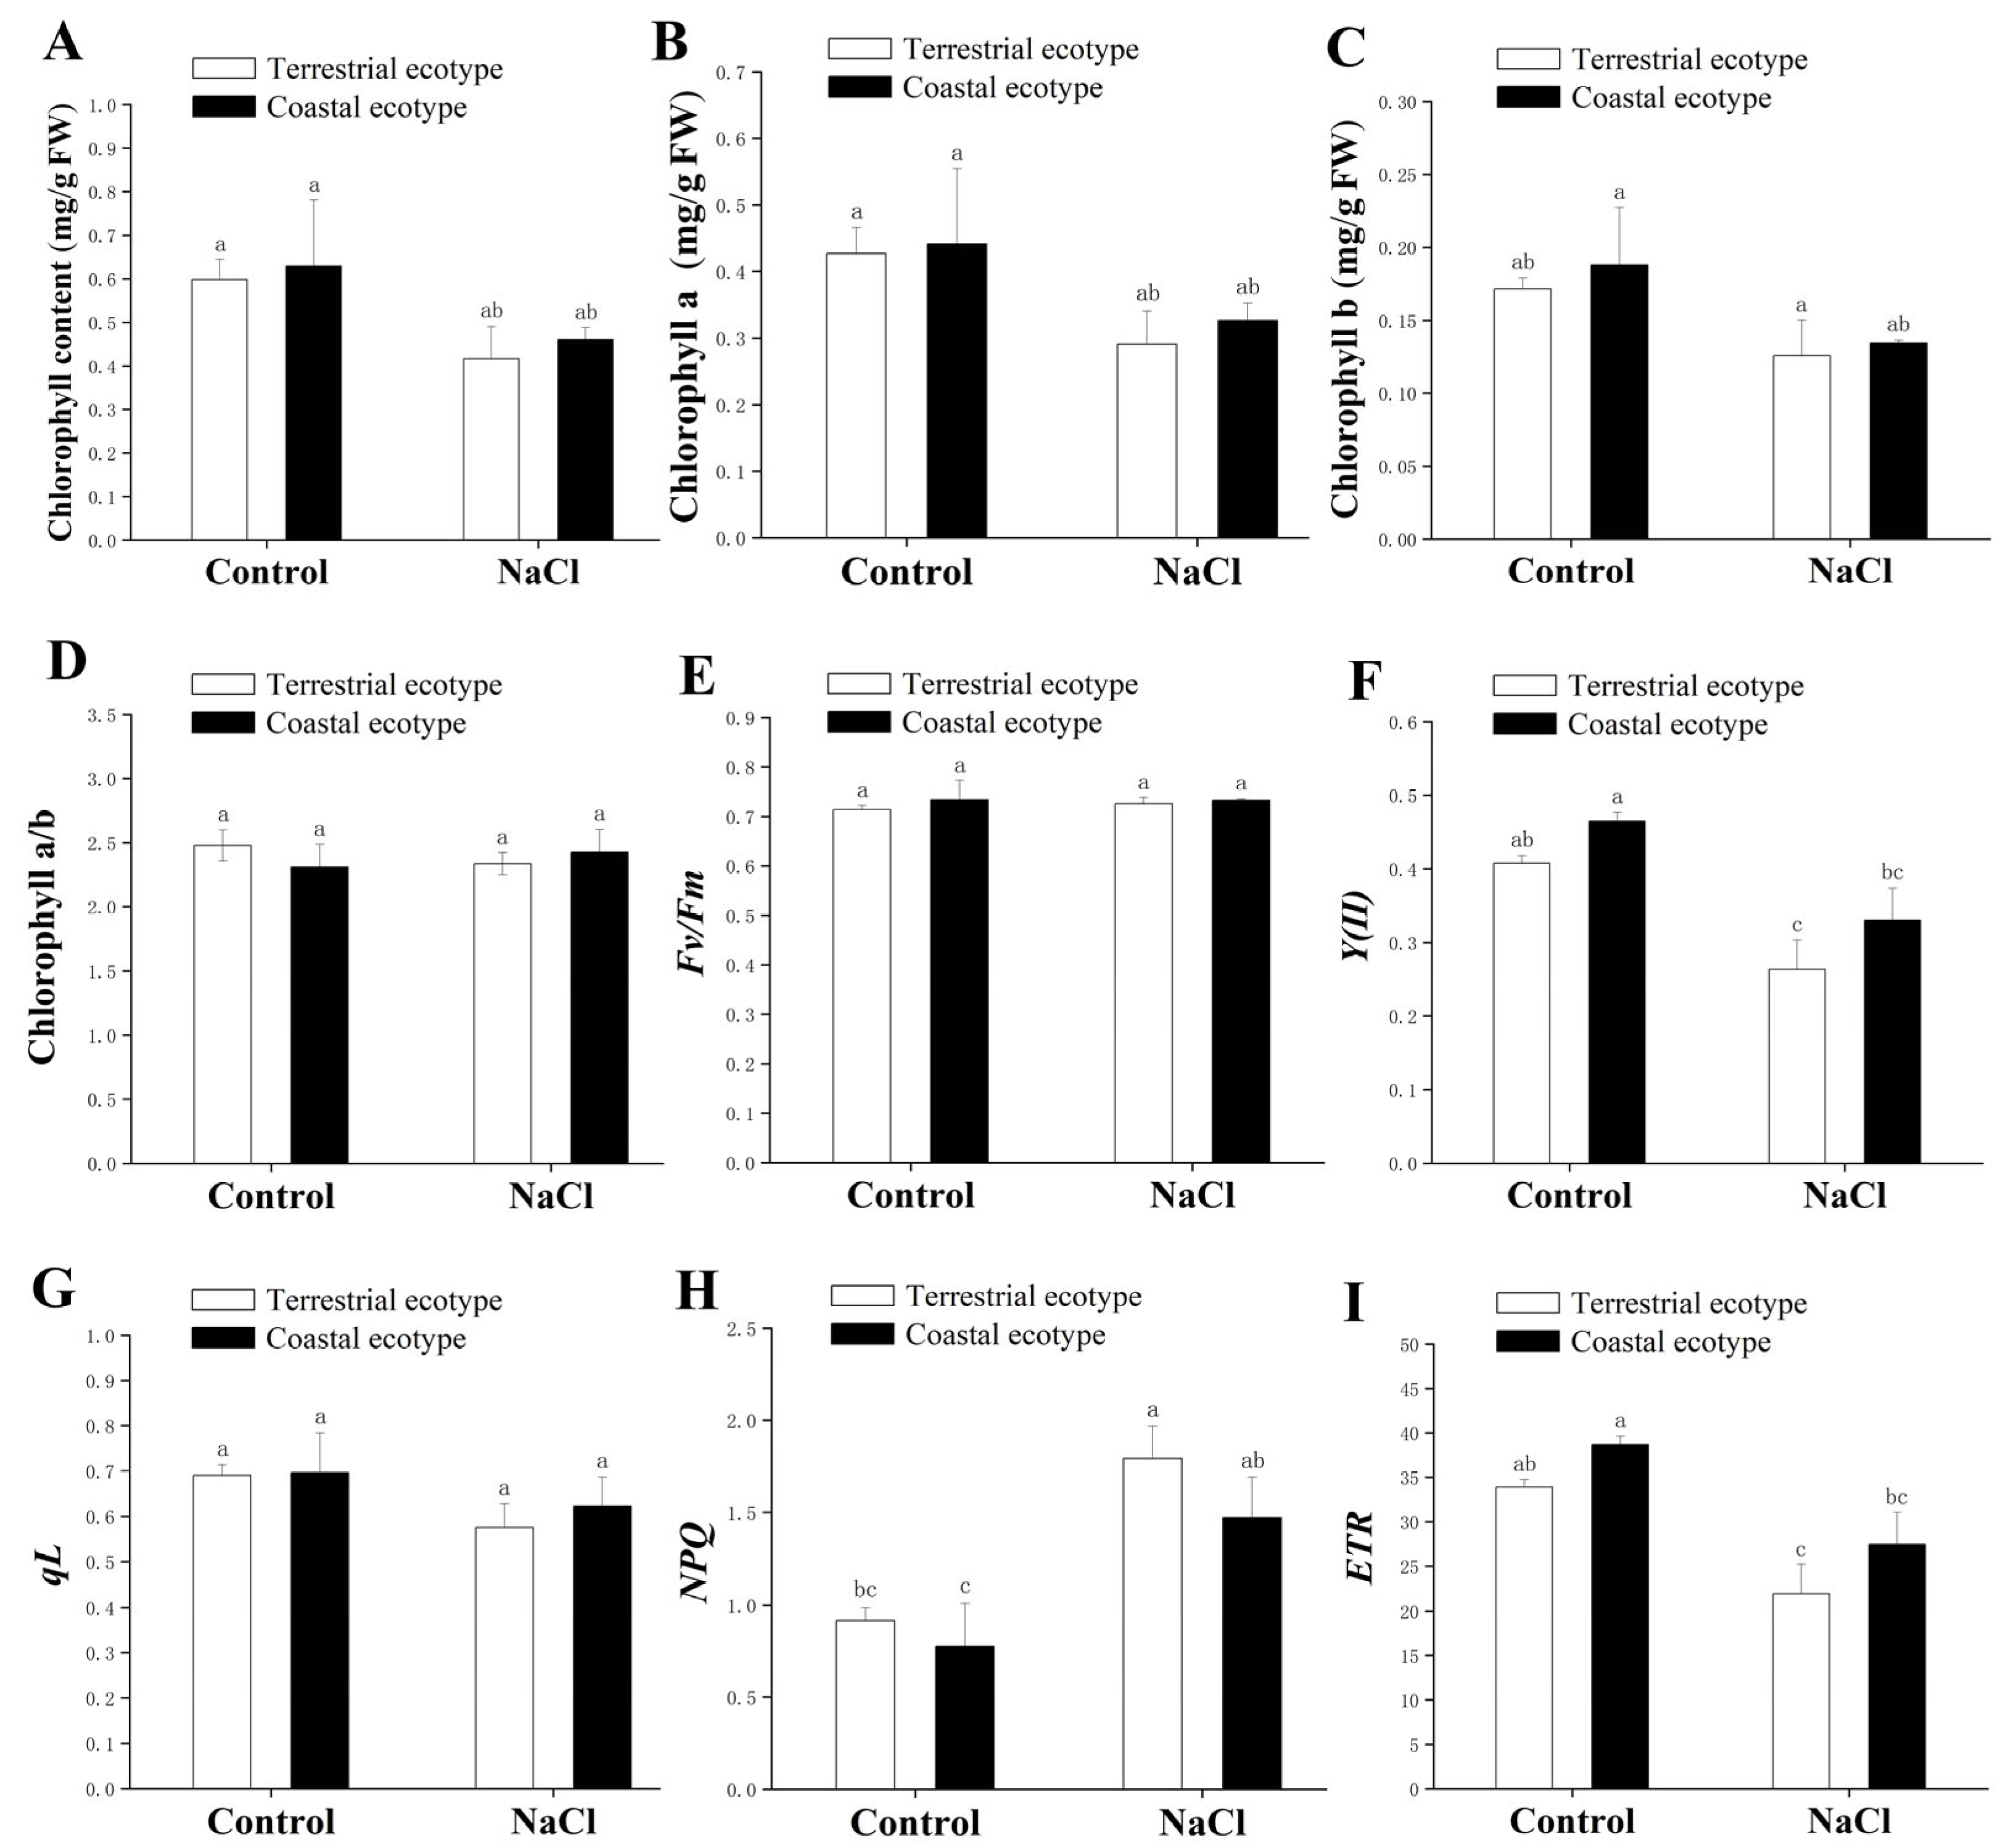
2.8. Measurement of the Content of Chlorophyll and Parameters of Chlorophyll Fluorescence

The contents of chlorophyll a (Chl a), chlorophyll b (Chl b), and total chlorophyll were determined as described by Wang and Huang [49]. Approximately 0.1 g of fresh leaves were placed in a 2 mL centrifuge tube and crushed into powder with a small amount of liquid nitrogen. A volume of 2 mL of 80% acetone was then added to the centrifuge tube and extracted for 24 h at 4 °C in the dark. The absorbance of the extracts was measured at 663 nm, 645 nm, and 470 nm using a DU730 UV/Vis spectrophotometer, Beckman Coulter, Inc.), and the concentration and content of each pigment were calculated as described by Wang and Huang [49]. Each treatment had 12 replicates.
After 30 d of treatment, the chlorophyll fluorescence parameters were measured using a portable modulating chlorophyll fluorescence instrument, a PAM-2500 fluorometer (Heinz Walz GmbH, Effeltrich, Germany), as described by Chen et al. [28]. The third and fourth pairs of leaves in the upper part of the plant were acclimated in the dark for at least 20 min before the chlorophyll fluorescence was assessed. The initial fluorescence (F0) was measured in the dark (light intensity < 0.1 μmol m−2 s−1). Under saturating light intensity (200 μmol m−2 s−1), the stable fluorescence (Fs) and maximum fluorescence (Fm) were measured. The parameters included the maximum efficiency of PSII photochemistry (Fv/Fm), effective quantum yield of PSII (Y[II]), photochemical quenching coefficient (qL), electron transport rate (ETR), and non-photochemical chlorophyll fluorescence quenching (NPQ), which were calculated and processed as described by Baker and Rosenqvis [19]. Each treatment had 12 replicates.

2.9. Statistical Analysis

The data were analyzed using a one-way analysis of variance (ANOVA) or two-way ANOVA. The subsequent multiple comparisons were examined based on the least significant difference (LSD) test, p < 0.05 was considered the level of significance. The data were analyzed using SPSS 21.0 (IBM, Inc., Armonk, NY, USA), and all the values were expressed as the mean ± standard error (SE). The figures were prepared using Origin 2019 (OriginLab, Northampton, MA, USA).

3. Results

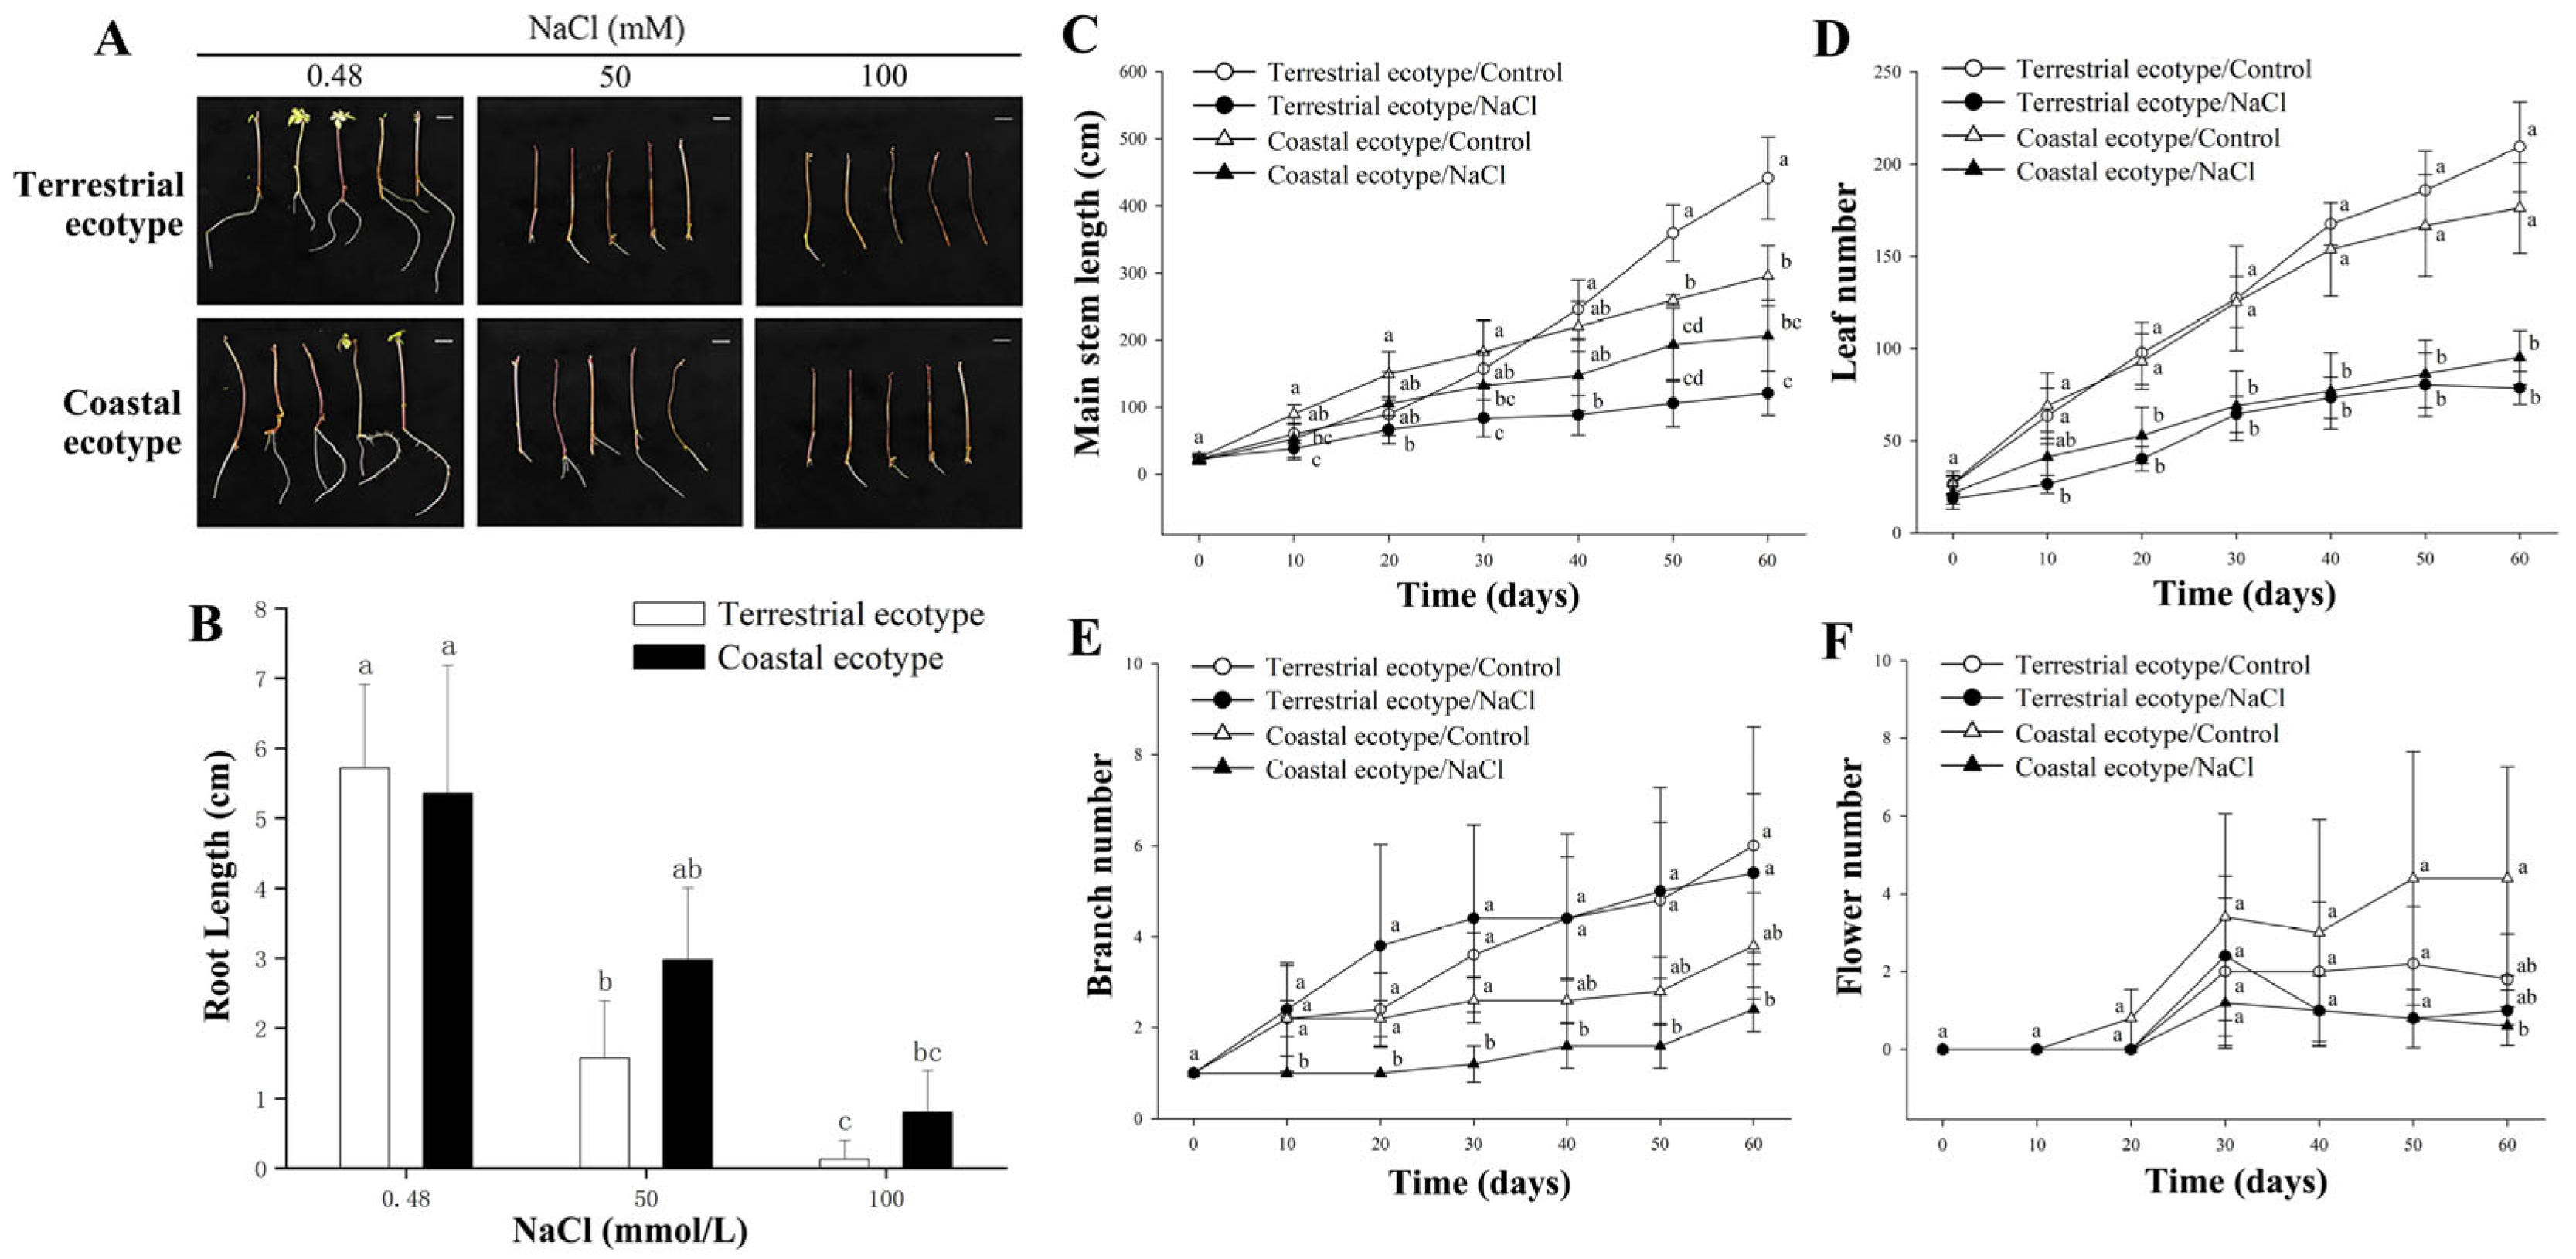
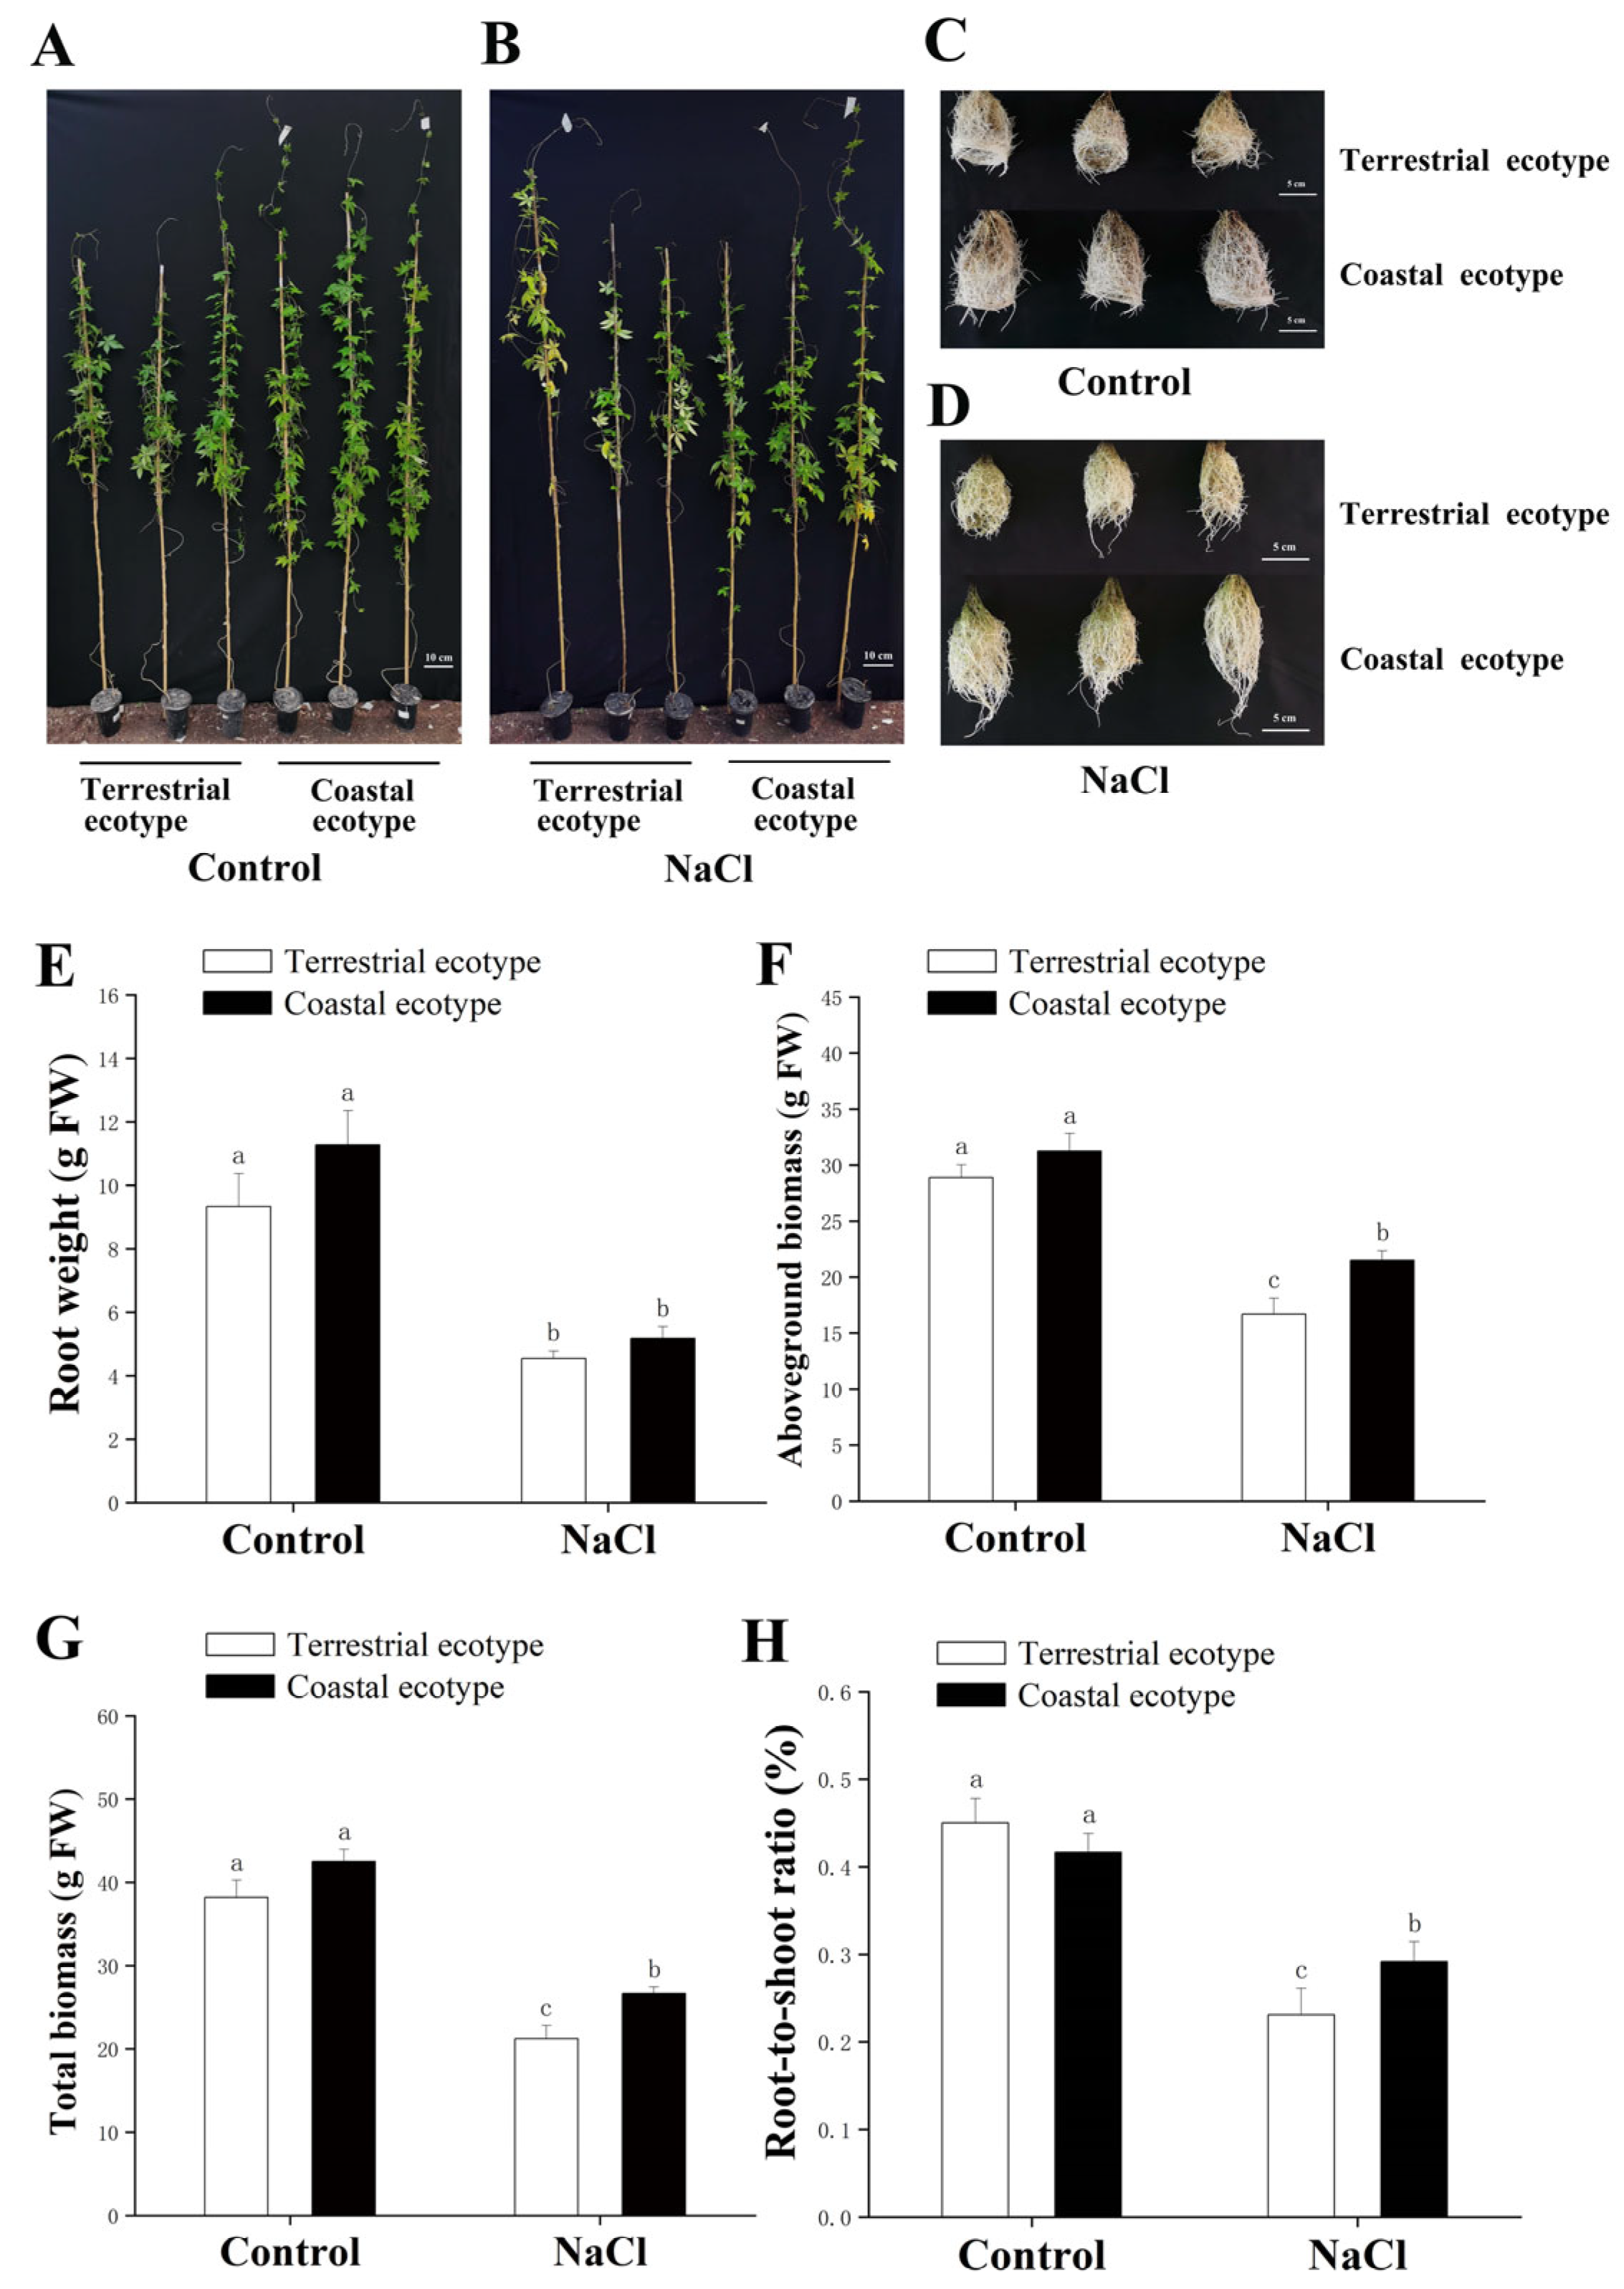
3.1. Growth of Both Lines under Salt Stress

With the increase in the concentration of salt, the lengths of the roots of the terrestrial ecotype decreased significantly (Figure 1A,B). To track the growth of both ecotypes under salt stress, the seedlings were treated with salt after transplantation, and the stem length, number of leaves, number of branches, and number of flowers of each plant were measured (Figure 1C–F). After 10 d, the stems of the coastal ecotype under the salt treatment were significantly shorter than those in the control. In the control, the stems of the terrestrial ecotype gradually grew longer. At 50 d, the main stem length from longest to shortest was the terrestrial ecotype of the control, the coastal ecotype of the control, the coastal ecotype under the NaCl treatment, and the terrestrial ecotype under the NaCl treatment. Among them, there was a significant difference between the terrestrial ecotype and the coastal ecotype in the control (Figure 1C). After 20 d, there were significantly more leaves in the control than in the salt treatment, but there was no significant difference between the terrestrial ecotype and the coastal ecotype in both the control and salt treatments (Figure 1D). At 20 d, the coastal ecotype in the control flowered first. At the end of the experiment, there were significantly more flowers in the control of the coastal ecotypes than in the salt treatment. In contrast, there was no difference in the number of flowers between the control and salt treatment in the terrestrial ecotype (Figure 1F). There were significantly more branches in the terrestrial ecotype under the salt treatment than in the coastal ecotype. However, there was no significant difference between these two ecotypes in the control (Figure 1E). The results of this analysis indicated that the coastal ecotype and terrestrial ecotype may have adapted to their respective habitats. The terrestrial ecotype is more adapted to the non-salt environment, while the coastal ecotype is more adapted to the saline environment.
The elevated concentration of NaCl significantly inhibited the growth of the terrestrial ecotype and coastal ecotype (Figure 2A–D). The coastal ecotype grew better than the terrestrial ecotype in both the control and treatment groups. Compared with the control, the root FW was significantly reduced in both ecotypes under the salt treatment (Figure 2E). In addition, the elevated concentration of NaCl had a more substantial impact on the aboveground biomass and total biomass of the terrestrial ecotype, with rates of inhibition of 43% and 45%, respectively. In contrast, the rates of inhibition of the aboveground biomass and total biomass of the coastal ecotype due to the elevated concentration of NaCl were 31% and 37%, respectively (Figure 2F,G). The coastal ecotype had a significantly higher root/shoot ratio than the terrestrial ecotype after exposure to salt stress. In contrast, there were no detectable differences in the control groups (Figure 2H).

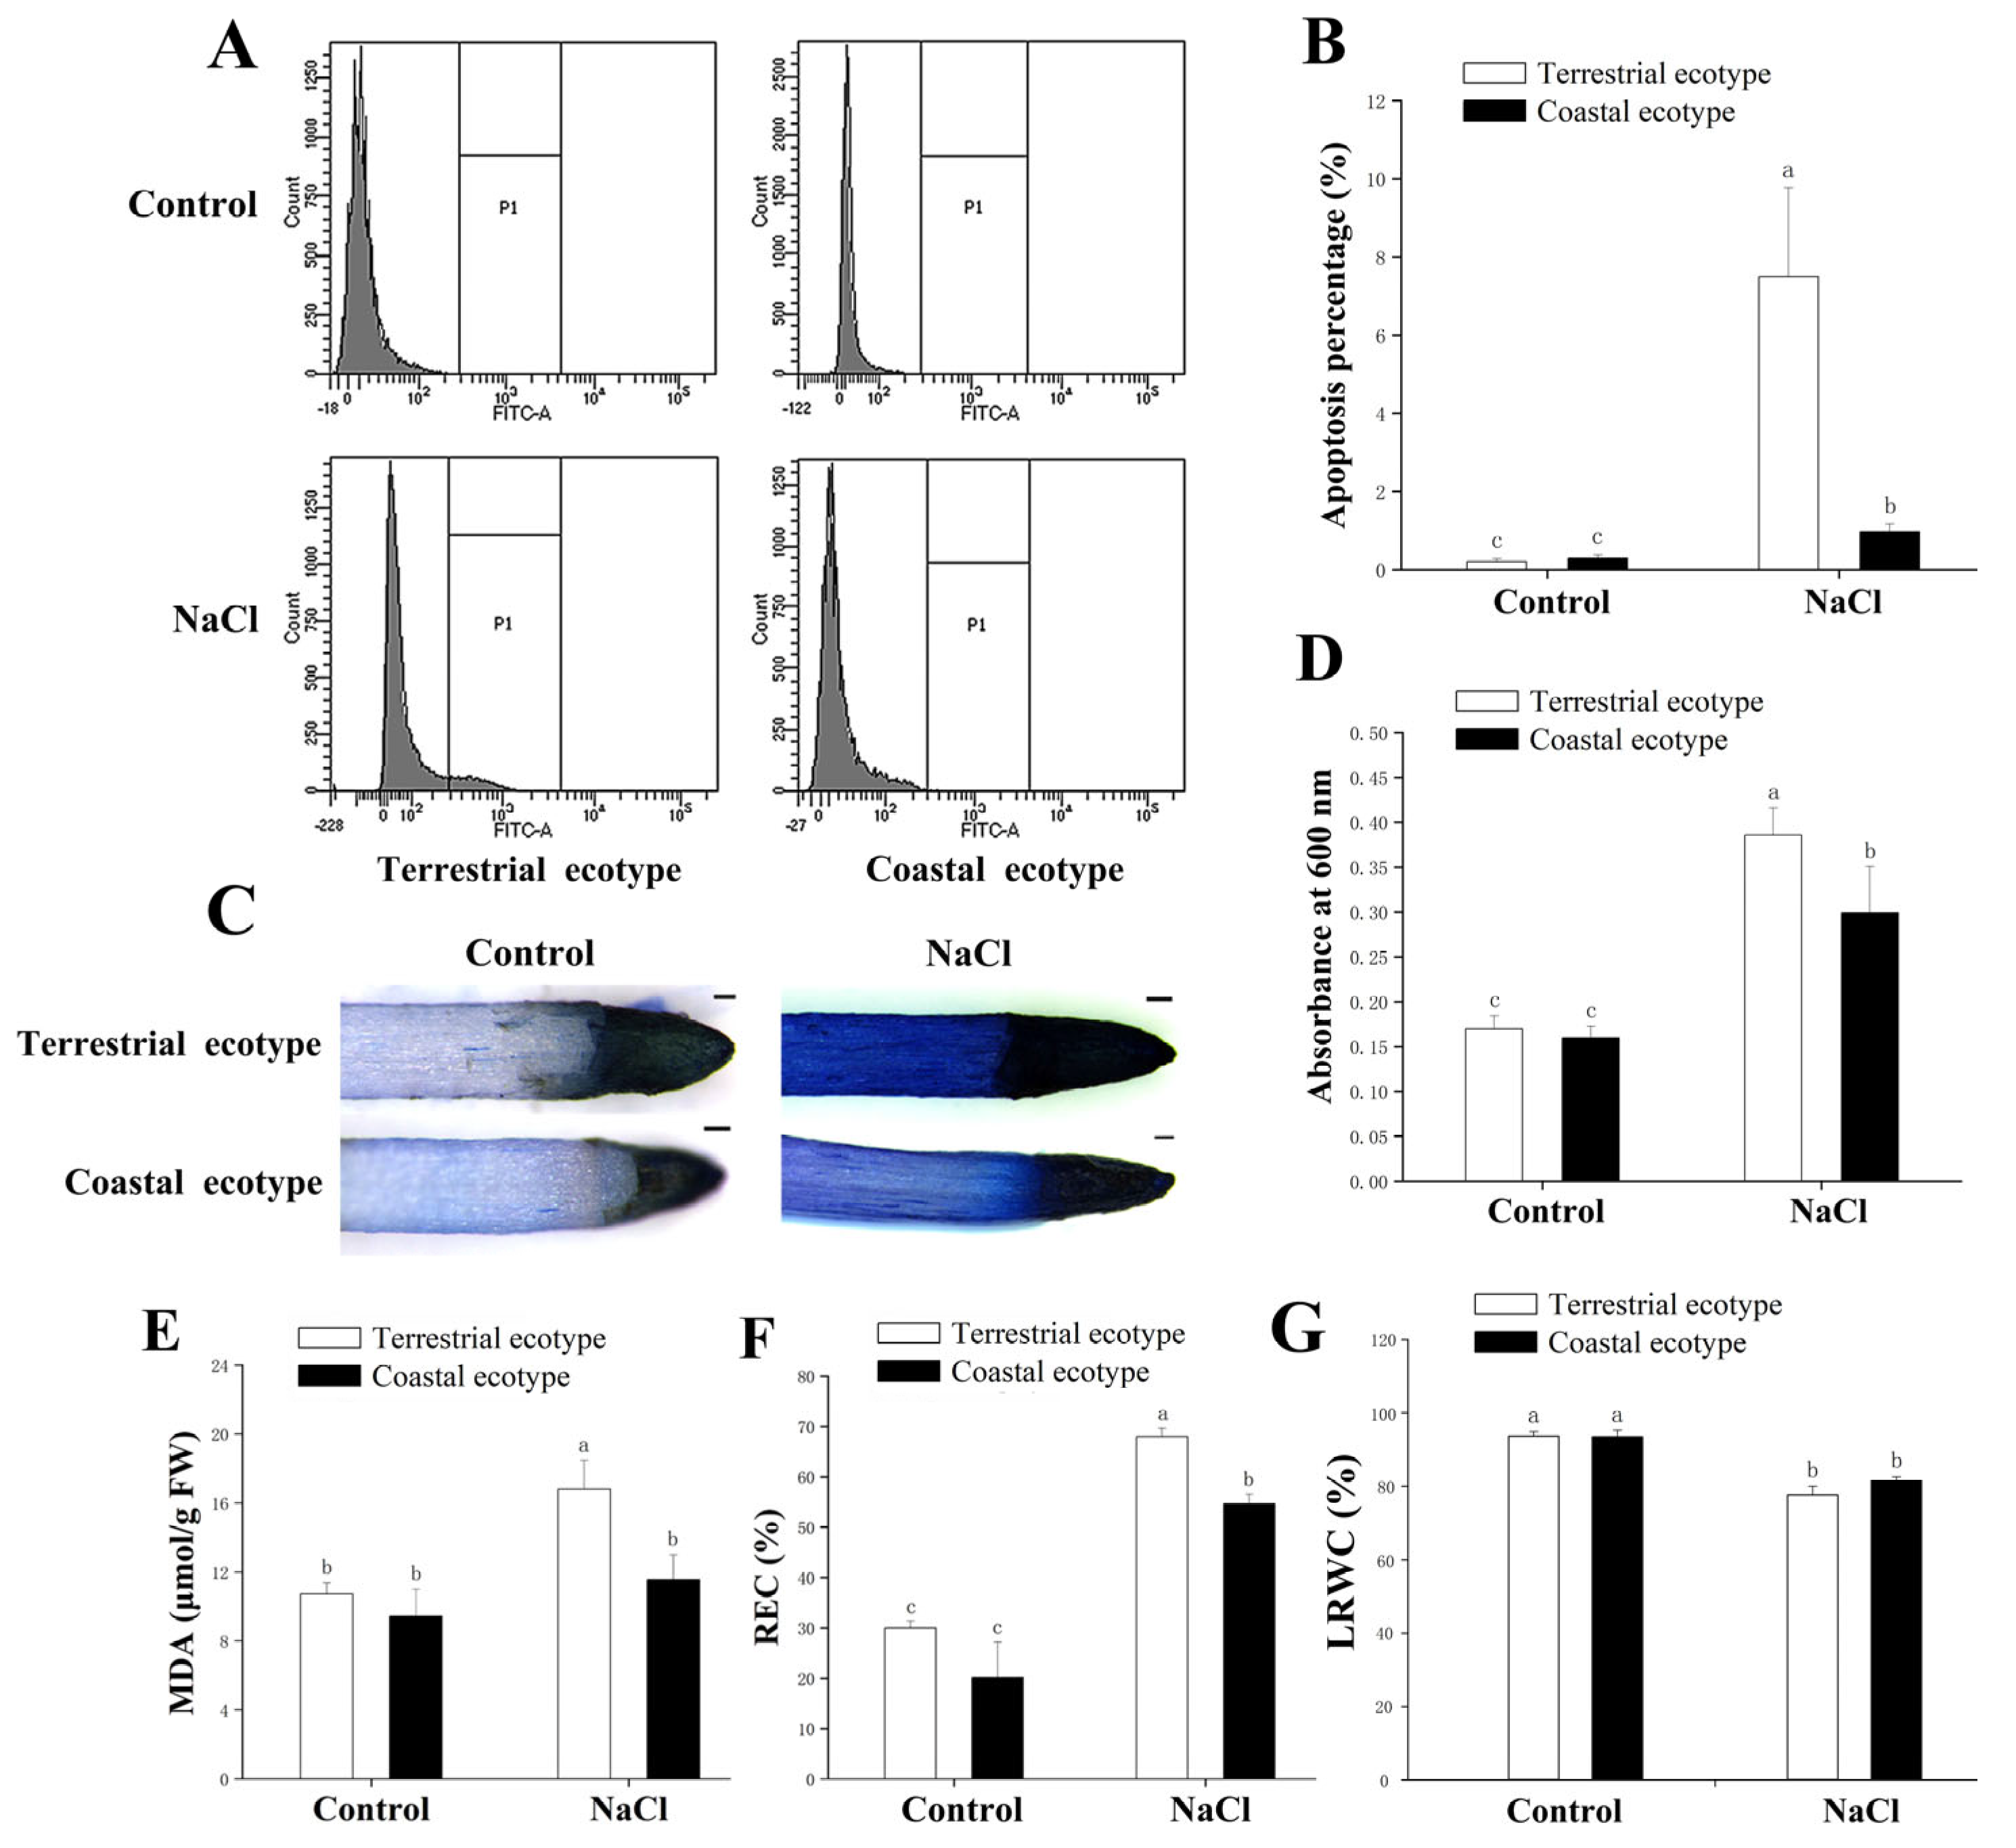
3.2. Cell Damage of Both Ecotypes under Salt Stress

Apoptosis of the leaf protoplasts was induced under salt stress in both ecotypes. The terrestrial ecotype entered the apoptosis stage earlier than the coastal ecotype (Figure 3A,B). Evans blue staining was used to explore the effect of salt stress on the membrane integrity of the root cells. After 12 h of treatment, the terrestrial ecotype displayed a darker blue stain on the root tip than the coastal ecotype, which suggested that there was more severe cell damage. The values of absorbance of the decolorizing solution at 600 nm indicated that the terrestrial ecotype suffered greater damage to the cell membrane than the coastal ecotype under salt stress (Figure 3C,D). The contents of MDA and REC of the terrestrial ecotype were higher than those of the coastal ecotype under both the control and salt treatments. Furthermore, the contents of MDA and REC of the terrestrial ecotype were significantly higher than those of the coastal ecotype in the salt treatment (Figure 3E,F). The leaf relative water content was significantly lower in both ecotypes after the salt treatment compared with that of the control (Figure 3G).

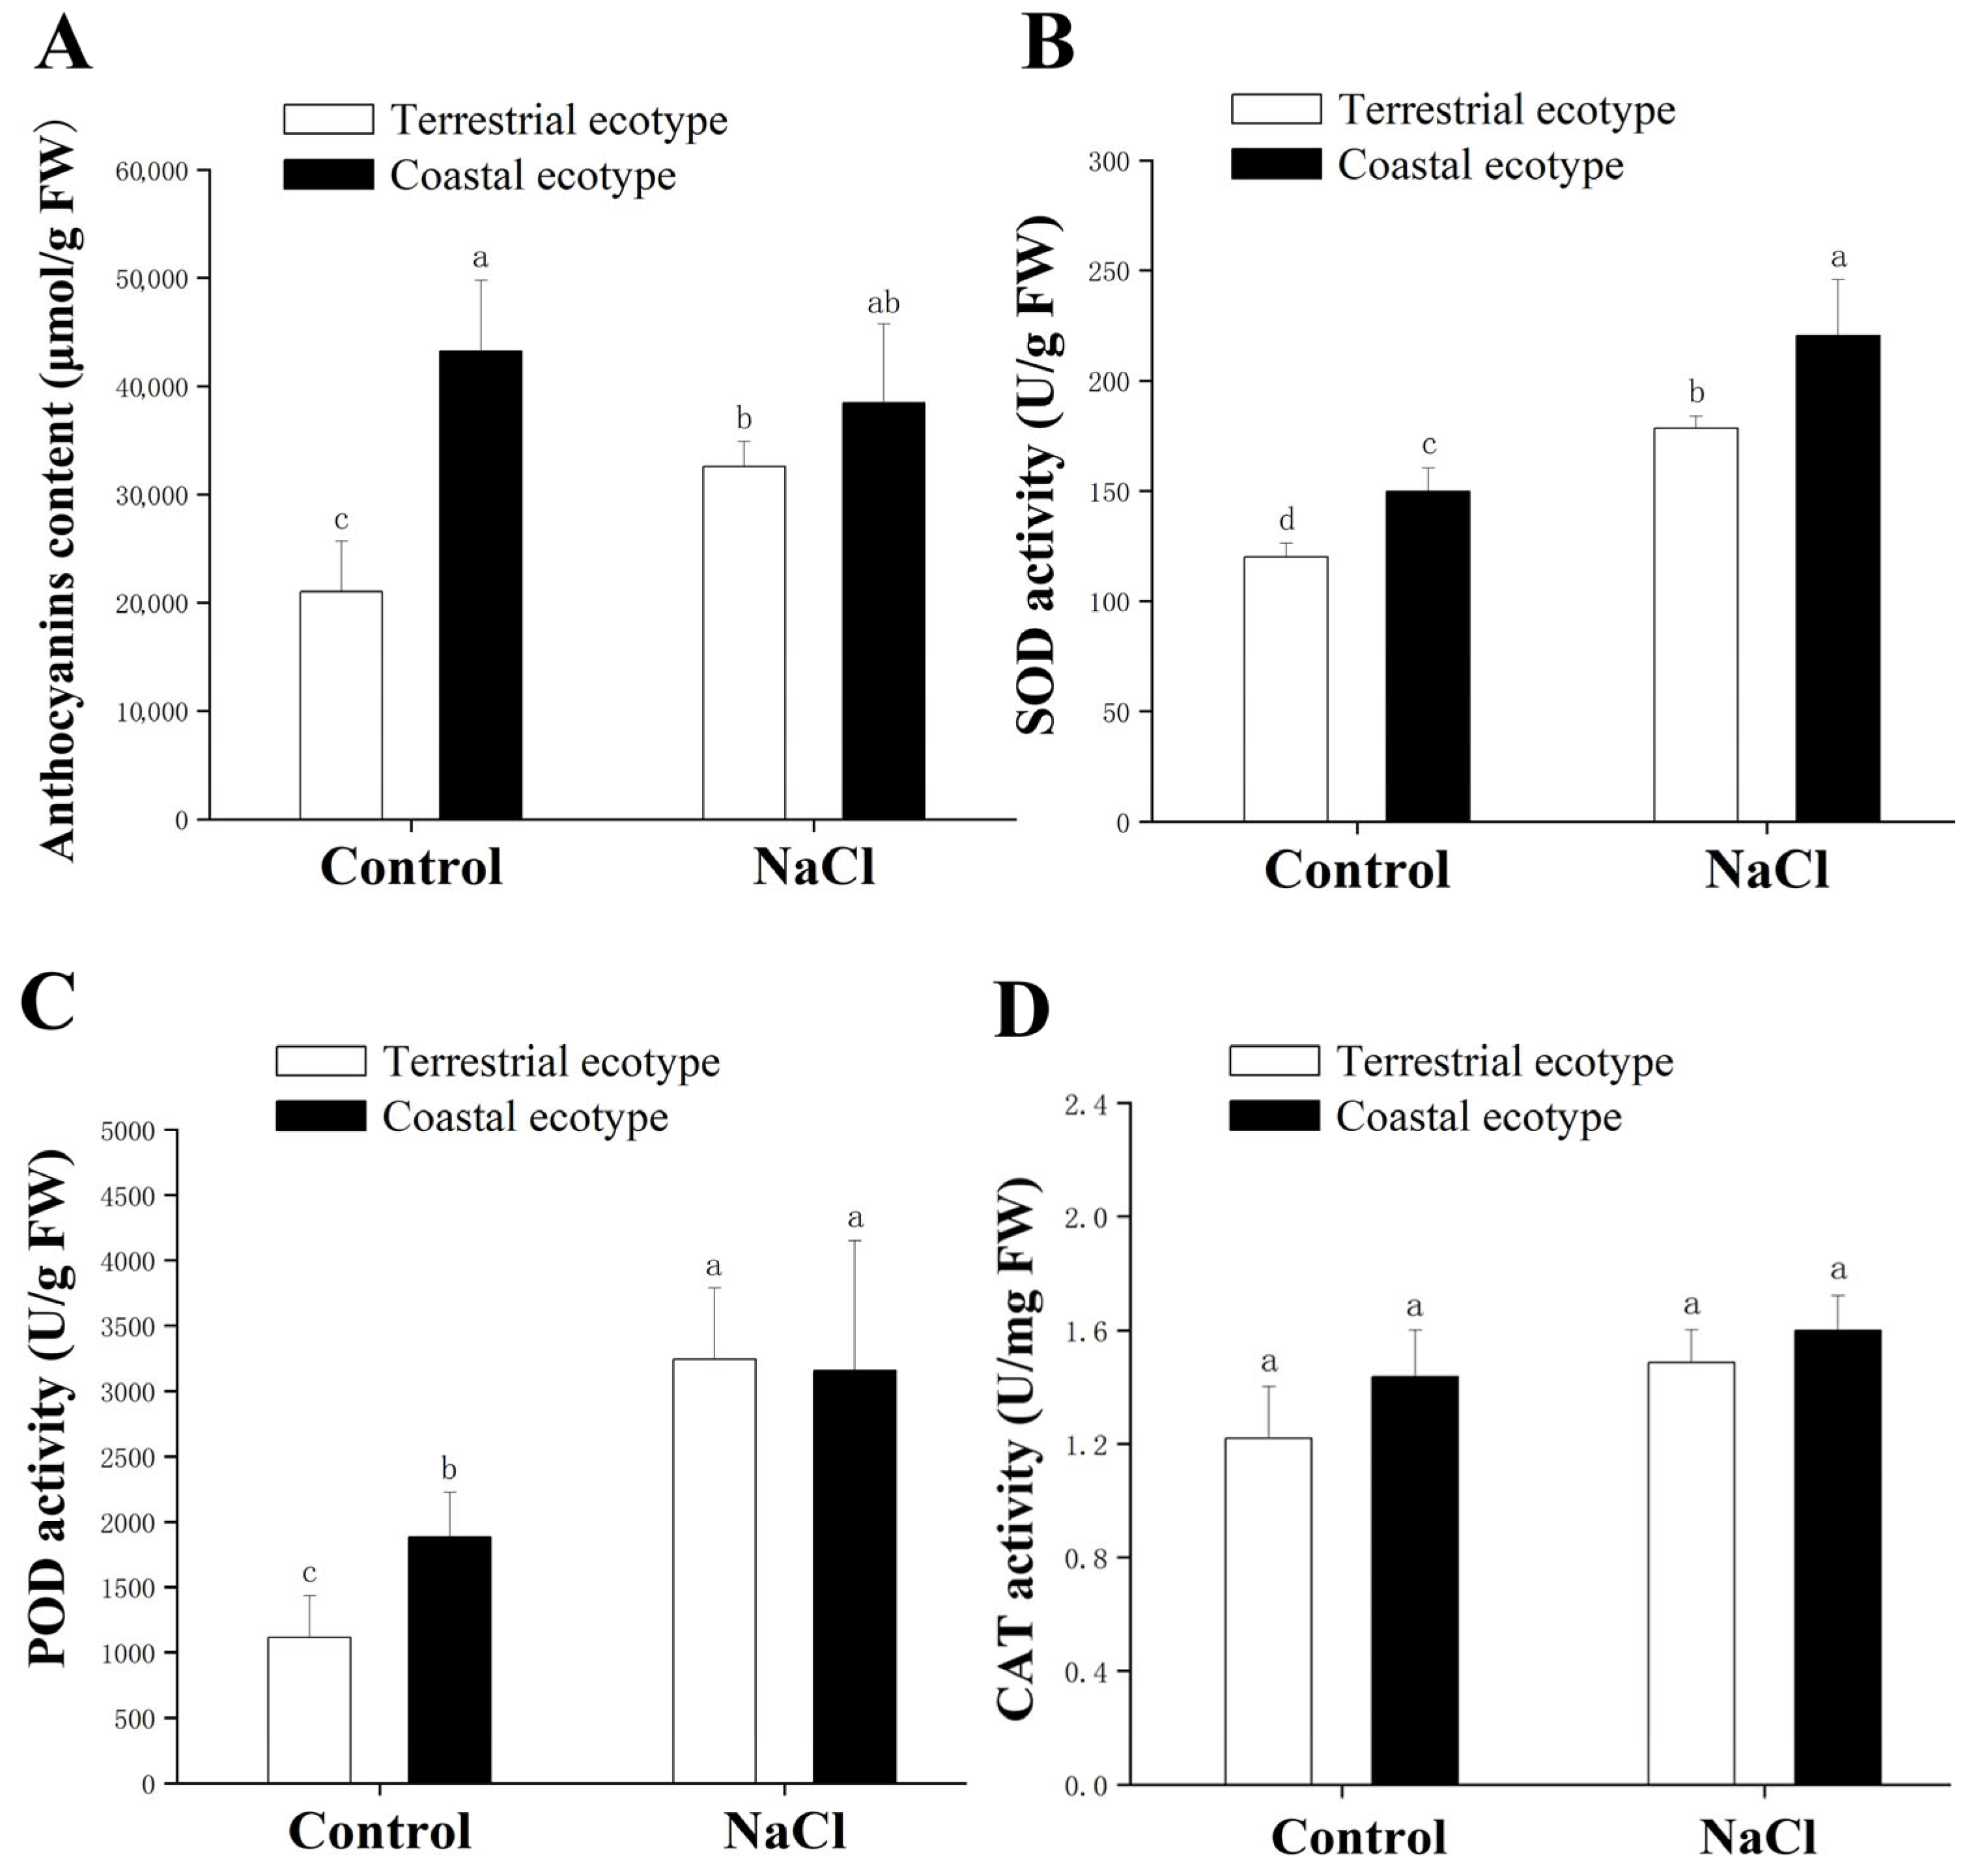
3.3. Antioxidant Capacity of I. cairica in Response to Salt Stress

Under the control treatment, the coastal ecotype appeared to accumulate significantly more anthocyanins than the terrestrial ecotype. The coastal ecotype had a concentration of anthocyanins that was approximately twice as high. However, there was no significant difference between the two ecotypes under the salt treatment since the anthocyanin content of the terrestrial ecotype increased significantly compared with its control (Figure 4A). The SOD activity of the coastal ecotype under both the control and salt treatment was significantly higher than that of the terrestrial ecotype. However, the activity of both ecotypes increased under the salt treatment (Figure 4B). The POD activity of the coastal ecotype in the control group was significantly higher than that of the terrestrial ecotype, and the activity in the salt treatment group increased in both ecotypes (Figure 4C). The CAT activity increased in the salt treatment. The activity of the coastal ecotype was higher in the control and salt treatments than in the terrestrial ecotype, but the difference was not significant (Figure 4D).

3.4. Salt Rejection and Transport

The appearance of the salt glands of the two ecotypes was examined in detail, and their associated metrics were determined (Figure 5A–D). There was no significant difference in the area of the salt glands between the two ecotypes in either the control or treatments. However, the areas of the salt glands in both ecotypes increased under the salt treatments and were approximately 1.13- and 1.14-fold that of the control, respectively (Figure 5E). The number and density of the salt glands increased in both ecotypes compared with the control. There was a significant difference in these values between the two ecotypes under the salt treatment, with the coastal ecotype being approximately 1.36- and 1.4-fold higher than that of the terrestrial ecotype, respectively. Furthermore, in the control, there was no significant difference in the number and density of salt glands between the two ecotypes, but the values of the coastal ecotype were higher than those of the terrestrial ecotype (Figure 5F,G).
Under non-saline conditions, significantly less Na+ accumulated in the roots, stems, and leaves of the coastal ecotype compared with the terrestrial ecotype. When plants were exposed to salinity, excess Na+ was taken up by the roots and transported upwards to the stems and leaves, which significantly increased the concentration of Na+ in the roots, stems, and leaves in both ecotypes. Compared to the control, the K+ contents in the roots, stems, and leaves were significantly reduced in both ecotypes, and the trend was the opposite for Na+. In the control, the K+ contents in the leaves and the K+: Na+ ratio in the roots, stems, and leaves of the coastal ecotype were significantly higher than those of the terrestrial ecotype. The K+: Na+ ratios of the roots, stems, and leaves of the two ecotypes decreased significantly after the salt treatment, but those of the stems and leaves of the coastal ecotype were marginally higher than those of the terrestrial ecotype. Under salt stress, there was a slightly higher content of K+ in the leaves of the coastal ecotype, while there were lower contents of Na+ in the stems and leaves (Figure 6A–C).
Salt stress also enhanced the accumulation of N and P in I. cairica. Compared with the control, the concentrations of N in the roots and leaves were significantly increased in both ecotypes under the salt treatment. There were significantly higher concentrations of N in the leaves of the coastal ecotype than in the terrestrial ecotype when exposed to salt. The concentrations of P in the stems and leaves were significantly increased in both ecotypes under the salt treatment when compared with the control. And the concentrations of P in the stems and leaves of the coastal ecotype were significantly higher than those of the terrestrial ecotype, respectively. After the salt treatment, the N: P ratio in the stems and leaves of both ecotypes decreased slightly, while that in the roots increased significantly (Figure 6D–F).

3.5. Osmotic Regulation

The appearance of the stomata of the two ecotypes was studied in detail, and their relevant indices were determined (Figure 7A–D). In both the control and salt treatments, the number of stomata and stomatal density were higher in the terrestrial ecotype than in the coastal ecotype, and a significant difference was observed in the salt treatment group (Figure 7E,F). The content of Pro in the coastal ecotype was higher than that of the terrestrial ecotype under both the control and salt treatments, while the content in the coastal ecotype was significantly higher than that of the terrestrial ecotype in the salt treatment (Figure 7G).

3.6. Photosynthetic Performance

Compared with the control, the content of total Chl decreased by 31% in the terrestrial ecotype and by 27% in the coastal ecotype; the content of Chl a decreased by 33% in the terrestrial ecotype and by 26% in the coastal ecotype, and that of Chl b decreased by 27% in the terrestrial ecotype and by 29% in the coastal ecotype under the salt treatment, respectively (Figure 8A–C). The Chl a/Chl b ratios of both ecotypes were not significantly different under either the control treatment or salt treatment (Figure 8D). As shown in Figure 8E,G, the Fv/Fm and qL of both ecotypes remained stable under the two treatments. Compared with the control, the Y[II] of the terrestrial ecotype and the coastal ecotype decreased by 35.54% and 29.03%, respectively, and the ETR decreased by 35.31% and 28.97%, respectively, under the salt treatment (Figure 8F,I). Compared to the control, the NPQ of both ecotypes increased under the salt treatment (Figure 8H).

4. Discussion

In most cases, alien species tend to invade and colonize habitats that resemble their native environments [50]. Interestingly, as a species that is generally considered to be a terrestrial ecotype, I. cairica was found to invade the saline environment. In this study, by comparing the responses of the coastal ecotype and the terrestrial ecotype of I. cairica to salt stress, the coastal ecotype of I. cairica was shown to have obtained salt tolerance. To our knowledge, this is the first observation of salt tolerance in this species.

4.1. Morphological Changes in the Two Lines under Salt Stress

Salt tolerance in plants is related to various aspects of plant physiology, biochemistry, morphology, and molecular mechanisms, which are all related to osmosis, photosynthesis, and nutrient imbalances that limit plant growth through salt stress and reduce the biomass of all parts of the plant [51,52]. These results indicate that the coastal ecotype is more effective at growing in saline habitats compared with the terrestrial ecotype. The stems of the coastal ecotype appeared to regenerate more strongly, which suggested that they were more effective at reproducing asexually; this may play a key role in its invasion in saline habitats [53]. The decrease in the number of branches and the advance of the flowering period indicate that the coastal ecotype allocates more energy to stem growth and sexual reproduction for both escape and adaptation [54,55]. Under the salt treatment, the biomass of the terrestrial ecotype was reduced more than that of the coastal ecotype, which indicated that the coastal ecotype was better adapted to salt stress. This result was supported by previous similar studies on different plants [56,57].

4.2. Osmotic Adjustment Responses to Salt Stress

The accumulation of proline is an important adaptive strategy under salt stress that contributes to the increase in salt tolerance [58]. Sweet potato (Ipomoea batatas (L.) Lam) plants that accumulated more Pro significantly improved their degree of salt tolerance [59]. An increase in the accumulation of Pro has been associated with the enhancement of salt tolerance in Arabidopsis [60]. In this study, the coastal ecotype had significantly higher contents of Pro under salt stress. The accumulation of more Pro in the coastal ecotype treated with salt may have maintained the osmotic balance between the intracellular and extracellular environments and protected the membrane integrity, which enhanced the degree of salt tolerance. There have also been reports of similar results in several other studies [59,61]. Both the coastal ecotype and terrestrial ecotype improved their water use efficiency by reducing the number and density of stomata under salt stress [33]. The coastal ecotype reduced the density of stomata, decreased their number, reduced water loss, and maintained a higher leaf water content, thereby increasing their tolerance to salt and preserving the water potential and water status in the cells under osmotic stress conditions [62,63]. This is also supported by findings in wheat (Triticum aestivum L.) [33] and cogon grass (Imperata cylindrica (L.) Raeuschel) [64]. These observations emphasize the importance of reducing the stomatal density as a strategy to minimize the stress of saline conditions. Therefore, it is hypothesized that the coastal ecotype, through the reduction in the stomatal density and the accumulation of more proline, may maintain the osmotic balance between the intracellular and extracellular environments, thereby increasing its tolerance to salt.

4.3. Salt Exclusion and Nutrient Management

Salt glands play a pivotal role in the secretion of salt in recretohalophytes that secrete excess Na+ to prevent damage from salt [65]. The coastal ecotype appeared to have more salt glands, a higher density, and a larger area of these glands, which enabled the coastal ecotype to secrete excess salt through its salt glands to adapt to saline environments [34,35,66].
Salt stress disturbs the ionic balance of cells and activates the ion channels in the cell membranes, which causes an efflux of K+ [67]. Therefore, maintaining high levels of K+ and ensuring that the Na+ in the cytoplasm remains low is a common strategy to facilitate the proper function of enzymes and metabolic activities [68]. The coastal ecotype line exhibits its advantages in terms of a balance of the elements by maintaining a high K+: Na+ ratio, which is necessary to maintain enzymatic activity, and is even more important than maintaining low levels of Na+ [69,70]. With a higher K+: Na+ ratio than the terrestrial ecotype, the coastal ecotype obtained a more balanced content of ions and more stable growth [71,72]. Moreover, the coastal ecotype transports large amounts of salt ions into its stems and leaves, thereby reducing the negative impacts of excessive ions on the root system [73]. These findings have led to suggestions to improve salt tolerance by removing Na+ from the stems and leaves, providing K+ to the stems, and retaining K+ in the leaf tissues to maintain an optimal K+: Na+ ratio in the stems and leaves.
The accumulation of N, P, and K+ in the leaves promotes the growth and development of plants [74], while the maintenance of the K+: Na+ ratio and N: P ratio in the leaves, the selective transport of K+, N, and P from the roots to the leaves, and the accumulation of Pro in the leaves helps to reduce the toxic effects of Na+ and the damage caused by osmotic stress [75,76]. After acclimating to the salt environment, the coastal ecotype allocated more nutrient resources to the leaves for morphogenesis and, ultimately, the enhancement of photosynthesis [77]. P is also related to the structural composition and protein activity of plants [78]. The accumulation of P may improve the integrity of the leaf cells in the coastal ecotype, thereby accelerating the biosynthesis of photosynthetic products.

4.4. Salt Stress Response to the Cell Damage and Antioxidant Capacity

The antioxidant system, which has developed during the evolution of plants, contributes to the homeostasis of reactive oxygen species (ROS) metabolism, which directly reflects the salt tolerance of plants [79]. Under the salt treatment, the lower degree of cell damage of the coastal ecotype was associated with a higher antioxidant capacity. Anthocyanins are natural pigments that protect antioxidant enzymes, scavenge free radicals, regulate cellular osmotic pressure, and stabilize the photosynthetic structure, thus limiting the inhibition of plant growth [80,81]. Antioxidant enzymes are other tools that plants can use to scavenge reactive oxygen species and resist oxidative damage, and they include SOD, POD, and CAT [82]. Increased antioxidant defenses have been positively correlated with a reduction in the oxidative damage in plants under abiotic stress [83]. In this study, both the coastal and terrestrial ecotypes enhanced their antioxidant capacities by increasing their contents of anthocyanin and activities of POD, SOD, and CAT under salt stress. In addition, salt-tolerant plants showed a significant increase in the molecular regulation of the POD and SOD activities under the salt treatment to maintain the balance of reactive oxygen metabolism, which may be related to the high level of expression of IcSRO1 [11]. In addition, the coastal ecotype had a higher content of anthocyanin and activities of POD, SOD, and CAT under the salt treatment, enhanced ROS scavenging and osmoregulation [84], and a reduction in the levels of REC and MDA, which thereby reduced the contents of MDA and oxidative stress; this led to lipid peroxidation and cellular damage [80]. Consequently, cells of the coastal ecotype entered the apoptotic stage later than those of the terrestrial ecotype, which indicates that the coastal ecotype is better at maintaining photosynthesis and cell homeostasis in a saline environment [85,86].

4.5. Effects of Salt Stress on the Chlorophyll Content and Fluorescence Properties

Chlorophyll fluorescence parameters are often used to examine the relationship between the photosynthesis of plants and the environment in which they live and are important indicators that reflect the physiology of photosynthesis [87]. The Fv/Fm indicates the level of photoinhibition [88]. In this study, the Fv/Fm remained stable across both ecotypes under the two treatments, which indicated that there was little photoinhibition; this suggests that both ecotypes can adapt photosynthetically to salt stress [89,90]. A more substantial increase in NPQ in the terrestrial ecotype was observed under the salt treatment, which protected the photosynthetic apparatus from damage by dissipating excess light energy in the form of heat through non-photochemical processes [90]. Salt stress may disrupt the biochemistry of photosynthesis, which decreases the efficiency of Photosystem I (PSI) and PSII owing to disturbances in the integrity of chloroplasts [91]. Therefore, it can be suggested that the coastal ecotype is more tolerant to salinity stress owing to its ability to maintain the contents of chlorophyll and its fluorescence parameters.

5. Conclusions

This study investigated the growth and physiological and biochemical responses of two lines against salt stress. The results indicated that salt stress is reflected in the obvious impairment of photosynthetic performance and the inhibition of Y(II), NPQ, ETR, and chlorophyll biosynthesis. An increase in the concentration of MDA and REC highlighted the lipid peroxidation and oxidative damage caused to the cell membranes, respectively. However, the adverse effects of salt stress could be mitigated by various internal mechanisms in the cell, such as the accumulation of antioxidant enzymes (SOD, POD, and CAT) and osmolytes (Pro and anthocyanins) (Figure 9). The coastal ecotype of I. cairica in Zhuhai and the terrestrial ecotype in Guangzhou appeared to have different physiological responses to salt stress. The coastal ecotype was considerably less inhibited, which demonstrates that it rapidly adjusted to increase its adaptability to salt and enhance its invasiveness in mangrove wetland ecosystems. In addition, this adaptability might be heritable, and it will be investigated further in our subsequent research study.

Author Contributions

T.X. and M.C. conceived and designed the research; J.Z. and B.Y. conducted the experiments; T.X., W.L. and X.X. supervised the project administration.; J.Z. and M.C. wrote the manuscript; T.X. and J.Z. revised the manuscript. All authors have read and agreed to the published version of the manuscript.

Funding

This research was funded by the National Natural Science Foundation of China (grant no. 32071618) to Tiantian Xiong, and the Natural Science Foundation of Guangdong Province (grant no. 2023A1515012608) to Tiantian Xiong.

Data Availability Statement

The data that support the findings of this study are available from the corresponding author upon reasonable request.

Acknowledgments

We are grateful for every reviewer’s helpful comments. In addition, we thank Paul Giller from the School of Biological, Earth and Environmental Sciences, University College of Cork, Ireland for carrying out English language editing.

Conflicts of Interest

The authors declare that they have no known competing financial interests or personal relationships that could have appeared to influence the work reported in this paper.

References

  1. Ding, H.; Xu, H.G.; Wu, J. Status and trends of invasive alien species in China. World Environ. 2009, 3, 39–40. [Google Scholar]
  2. Gu, Z.Y.; Wu, X.H.; Yang, G.; Chen, J.D. Status and Countermeasures against Invasion of Exotic Organisms in China. Jiangsu Agric. Sci. 2006, 6, 418–421. [Google Scholar]
  3. Bellard, C.; Cassey, P.; Blackburn, T.M. Alien species as a driver of recent extinctions. Biol. Lett. 2016, 12, 20150623. [Google Scholar] [CrossRef] [PubMed]
  4. Slingsby, J.A.; Merow, C.; Aiello-Lammens, M.; Allsopp, N.; Hall, S.; Kilroy Mollmann, H.; Turner, R.; Wilson, A.M.; Silander, J.A. Intensifying postfire weather and biological invasion drive species loss in a Mediterranean-type biodiversity hotspot. Proc. Natl. Acad. Sci. USA 2017, 114, 4697–4702. [Google Scholar] [CrossRef] [PubMed]
  5. Saenger, P.; Ragavan, P.; Sheue, C.R.; López-Portillo, J.; Yong, J.W.H.; Mageswaran, T. Mangrove biogeography of the Indo-Pacific. Sabkha Ecosyst. 2019, 43, 379–400. [Google Scholar]
  6. Wang, C.W.; Wong, S.L.; Liao, T.S.; Weng, J.H.; Chen, M.N.; Huang, M.Y.; Chen, C.I. Photosynthesis in response to salinity and submergence in two Rhizophoraceae mangroves adapted to different tidal elevations. Tree Physiol. 2022, 42, 1016–1028. [Google Scholar] [CrossRef]
  7. Ren, H.; Guo, Q.; Liu, H.; Li, J.; Zhang, Q.; Xu, H.; Xu, F. Patterns of alien plant invasion across coastal bay areas in southern China. J. Coast. Res. 2014, 295, 448–455. [Google Scholar] [CrossRef]
  8. Zhang, Z.; Li, J.; Li, Y.; Liu, W.W.; Chen, Y.X.; Zhang, Y.H.; Li, Y.F. Spatially discontinuous relationships between salt marsh invasion and mangrove forest fragmentation. For. Ecol. Manag. 2021, 499, 0378–1127. [Google Scholar] [CrossRef]
  9. Liu, G.; Huang, Q.Q.; Lin, Z.G.; Huang, F.F.; Liao, H.X.; Peng, S.L. High tolerance to salinity and herbivory stresses may explain the expansion of Ipomoea cairica to salt marshes. PLoS ONE 2012, 7, e48829. [Google Scholar] [CrossRef] [PubMed]
  10. Bai, F.; Chisholm, R.; Sang, W.; Dong, M. Spatial risk assessment of alien invasive plants in China. Environ. Sci. Technol. 2013, 47, 7624–7632. [Google Scholar] [CrossRef] [PubMed]
  11. Yuan, B.; Chen, M.; Li, S. Isolation and Identification of Ipomoea cairica (L.) Sweet Gene IcSRO1 Encoding a SIMILAR TO RCD-ONE Protein, Which Improves Salt and Drought Tolerance in Transgenic Arabidopsis. Int. J. Mol. Sci. 2020, 21, 1017. [Google Scholar] [CrossRef] [PubMed]
  12. Morimaru, K.; Mitsutoshi, T.; Yasuo, I.; Kazutoshi, K.; Toshiyuki, O.; Nobuhide, F. High salinity leads to accumulation of soil organic carbon in mangrove soil. Chemosphere 2017, 177, 51–55. [Google Scholar] [CrossRef]
  13. Polash, M.A.S.; Sakil, M.A.; Hossain, M.A. Plants responses and their physiological and biochemical defense mechanisms against salinity: A review. Trop. Plant Res. 2019, 6, 250–274. [Google Scholar] [CrossRef]
  14. Wei, L.; Zhang, J.; Wei, S.; Hu, D.; Liu, Y.; Feng, L.; Li, C.; Qi, N.; Wang, C.; Liao, W. Nitric Oxide Enhanced Salt Stress Tolerance in Tomato Seedlings, Involving Phytohormone Equilibrium and Photosynthesis. Int. J. Mol. Sci. 2022, 23, 4539. [Google Scholar] [CrossRef]
  15. Hao, S.; Wang, Y.; Yan, Y.; Liu, Y.; Wang, J.; Chen, S. A Review on Plant Responses to Salt Stress and Their Mechanisms of Salt Resistance. Horticulturae 2021, 7, 132. [Google Scholar] [CrossRef]
  16. Allakhverdiev, S.I. Optimising photosynthesis for environmental fitness. Funct Plant Biol. 2020, 47, iii–vii. [Google Scholar] [CrossRef]
  17. Guo, S.; Zhao, K. Possible Mechanism of NaCl Stress Inhibiting Photosynthesis of Maize Seedlings. Acta Plant Physiol. 2001, 27, 461–466. [Google Scholar]
  18. Baker, N.R. Chlorophyll fluorescence: A probe of photosynthesis in vivo. Annu. Rev. Plant Biol. 2008, 59, 89–113. [Google Scholar] [CrossRef]
  19. Baker, N.R.; Rosenqvist, E. Applications of chlorophyll fluorescence can improve crop production strategies: An examination of future possibilities. J. Exp. Bot. 2004, 55, 1607–1621. [Google Scholar] [CrossRef] [PubMed]
  20. Hessini, K.; Issaoui, K.; Ferchichi, S.; Saif, T.; Abdelly, C.; Siddique, K.H.M.; Cruz, C. Interactive effects of salinity and nitrogen forms on plant growth, photosynthesis and osmotic adjustment in maize. Plant Physiol. Biochem. 2019, 139, 171–179. [Google Scholar] [CrossRef] [PubMed]
  21. Zhu, J. Abiotic stress signaling and responses in plants. Cell 2016, 167, 313–324. [Google Scholar] [CrossRef]
  22. Barbieri, G.; Vallone, S.; Orsini, F.; Paradiso, R.; De Pascale, S.; Negre-Zakharov, F.; Maggio, A. Stomatal density and metabolic determinants mediate salt stress adaptation and water use efficiency in basil (Ocimum basilicum L.). J. Plant Physiol. 2012, 169, 1737–1746. [Google Scholar] [CrossRef] [PubMed]
  23. Hasanuzzaman, M.; Zhou, M.; Shabala, S. How Does Stomatal Density and Residual Transpiration Contribute to Osmotic Stress Tolerance? Plants 2023, 12, 494. [Google Scholar] [CrossRef] [PubMed]
  24. Yuan, F.; Leng, B.; Wang, B. Progress in Studying Salt Secretion from the Salt Glands in Recretohalophytes: How Do Plants Secrete Salt? Front. Plant Sci. 2016, 7, 977. [Google Scholar] [CrossRef] [PubMed]
  25. Shen, X.Y.; Peng, S.L.; Chen, B.M.; Pang, J.X.; Chen, L.Y.; Xu, H.M.; Hou, Y.P. Do higher resource capture ability and utilization efficiency facilitate the successful invasion of native plants. Biol. Invasions 2011, 13, 869–881. [Google Scholar] [CrossRef]
  26. Hou, Y.P.; Peng, S.L.; Lin, Z.G.; Huang, Q.Q.; Ni, G.Y.; Zhao, N. Fast-growing and poorly shade-tolerant invasive species may exhibit higher physiological but not morphological plasticity compared with non-invasive species. Biol. Invasions 2014, 17, 1555–1567. [Google Scholar] [CrossRef]
  27. Tognon, G.B.; Petry, C.; Cuquel, F.L. Response to water deficit of Ipomoea cairica (L.) Sweet. Cienc. E Agrotecnolgia 2012, 36, 318–324. [Google Scholar] [CrossRef]
  28. Chen, M.H.; Mingling Cai, M.L.; Xiang, P.; Qin, Z.F.; Peng, C.L.; Li, S.S. Thermal adaptation of photosynthetic physiology of the invasive vine Ipomoea cairica (L.) enhances its advantage over native Paederia scandens (Lour.) Merr. in South China. Tree Physiol. 2023, 43, 575–586. [Google Scholar] [CrossRef] [PubMed]
  29. Hoagland, D.; Arnon, D. The Water-Culture Method for Growing Plants without Soil; University of California: Berkeley, CA, USA, 1950; pp. 13–57. [Google Scholar]
  30. Luo, B.; Wang, C.; Wang, X.; Zhang, H.; Zhou, Y.; Wang, W.; Song, P. Changes in photosynthesis and chlorophyll fluorescence in two soybean (Glycine max) varieties under NaCl stress. Int. J. Agric. Biol. Eng. 2021, 14, 76–82. [Google Scholar] [CrossRef]
  31. Marriboina, S.; Sengupta, D.; Kumar, S.; Reddy, A.R. Physiological and molecular insights into the high salinity tolerance of Pongamia pinnata (L.) Pierre, a potential biofuel tree species. Plant Sci. 2017, 258, 102–111. [Google Scholar] [CrossRef]
  32. Smith, V.R. A comparison between the H2SO4-H2O2-Li2SO4-Se oxidation method and alternative digestion procedures for plant nutrient analysis. Commun. Soil Sci. Plan 1979, 10, 1067–1077. [Google Scholar] [CrossRef]
  33. Tao, R.; Ding, J.; Li, C.; Zhu, X.; Guo, W.; Zhu, M. Evaluating and Screening of Agro-Physiological Indices for Salinity Stress Tolerance in Wheat at the Seedling Stage. Front. Plant Sci. 2021, 12, 646175. [Google Scholar] [CrossRef]
  34. Yuan, F.; Wang, X.; Zhao, B.; Xu, X.; Shi, M.; Leng, B.; Dong, X.; Lu, C.; Feng, Z.; Guo, J.; et al. The genome of the recretohalophyte Limonium bicolor provides insights into salt gland development and salinity adaptation during terrestrial evolution. Mol. Plant 2022, 15, 1024–1044. [Google Scholar] [CrossRef]
  35. Zhao, B.; Zhou, Y.; Jiao, X.; Wang, X.; Wang, B.; Yuan, F. Bracelet salt glands of the recretohalophyte Limonium bicolor: Distribution, morphology, and induction. J. Integr. Plant Biol. 2023, 65, 950–966. [Google Scholar] [CrossRef]
  36. Ding, F.; Chen, M.; Sui, N.; Wang, B.S. Ca2+ significantly enhanced development and salt-secretion rate of salt glands of Limonium bicolor under NaCl treatment. S. Afr. J. Bot. 2010, 76, 95–101. [Google Scholar] [CrossRef]
  37. Leng, B.Y.; Yuan, F.; Dong, X.X.; Wang, J.; Wang, B.S. Distribution pattern and salt excretion rate of salt glands in two recretohalophyte species of Limonium (Plumbaginaceae). S. Afr. J. Bot. 2018, 115, 74–80. [Google Scholar] [CrossRef]
  38. Fan, S.; Wu, H.; Gong, H.; Guo, J. The salicylic acid mediates selenium-induced tolerance to drought stress in tomato plants. Sci. Hortic. 2022, 300, 111092. [Google Scholar] [CrossRef]
  39. Hodges, D.M.; DeLong, J.M.; Forney, C.F.; Prange, R.K. Improving the thiobarbituric acid-reactive substances assay for estimating lipid peroxidation in plant tissues containing anthocyanin and other interfering compounds. Planta 1999, 207, 604–611. [Google Scholar] [CrossRef]
  40. Kao, K.; Michayluk, M. A method for high-frequency intergeneric fusion of plant protoplasts. Planta 1974, 115, 355–367. [Google Scholar] [CrossRef] [PubMed]
  41. Dong, X.Y.; Fu, J.; Yin, X.B.; Qu, C.H.; Yang, C.J.; Li, H.Y.; He, G.Q.; Ni, J. Induction of Apoptosis in HepaRG Cell Line by Aloe-Emodin through Generation of Reactive Oxygen Species and the Mitochondrial Pathway. Cell. Physiol. Biochem. 2017, 42, 685–696. [Google Scholar] [CrossRef]
  42. Lequeux, H.; Hermans, C.; Lutts, S.; Verbruggen, N. Response to copper excess in Arabidopsis thaliana: Impact on the root system architecture, hormone distribution, lignin accumulation and mineral profile. Plant Physiol. Bioch. 2010, 48, 673–682. [Google Scholar] [CrossRef] [PubMed]
  43. Khalid, M.F.; Hussain, S.; Anjum, M.A.; Ahmad, S.; Ali, M.A.; Ejaz, S.; Morillon, R. Better salinity tolerance in tetraploid vs. diploid volkamer lemon seedlings is associated with robust antioxidant and osmotic adjustment mechanisms. J. Plant Physiol. 2020, 244, 153071. [Google Scholar] [CrossRef]
  44. Liu, C.; Yan, M.; Huang, X.; Yuan, Z. Effects of salt stress on growth and physiological characteristics of pomegranate (Punica granatum L.) cuttings. Pak. J. Bot. 2018, 50, 457–464. [Google Scholar]
  45. Shahid, M.A.; Balal, R.M.; Khan, N.; Simón-Grao, S.; Alfosea-Simón, M.; Cámara-Zapata, J.M.; Mattson, N.S.; Garcia-Sanchez, F. Rootstocks influence the salt tolerance of Kinnow mandarin trees by altering the antioxidant defense system, osmolyte concentration, and toxic ion accumulation. Sci. Hortic. 2019, 250, 1–11. [Google Scholar] [CrossRef]
  46. Ghalati, R.E.; Shamili, M.; Homaei, A. Effect of putrescine on biochemical and physiological characteristics of guava (Psidium guajava L.) seedlings under salt stress. Sci. Hortic. 2020, 261, 108961–108967. [Google Scholar] [CrossRef]
  47. Hoch, W.; Singsaas, E.; Mccown, B. Anthocyanins facilitate nutrient recovery in autumn by shielding leaves from potentially damaging light levels. Plant Physiol. 2003, 133, 12961305. [Google Scholar] [CrossRef] [PubMed]
  48. Shi, Y.; Zhang, Y.; Han, W.; Feng, R.; Hu, Y.; Guo, J.; Gong, H. Silicon enhances water stress tolerance by improving root hydraulic conductance in Solanum lycopersicum L. Front. Plant Sci. 2016, 7, 196. [Google Scholar] [CrossRef] [PubMed]
  49. Wang, X.K.; Huang, J.L. Principles and Techniques of Plant Physiological Biochemical Experiment, 3rd ed.; Higher Education Press: Beijing, China, 2015. [Google Scholar]
  50. Van Kleunen, M.; Schlaepfer, D.R.; Glaettli, M.; Fischer, M. Preadapted for invasiveness: Do species traits or their plastic response to shading differ between invasive and non-invasive plant species in their native range? J. Biogeogr. 2011, 38, 1294–1304. [Google Scholar] [CrossRef]
  51. Flowers, T.J.; Colmer, T.D. Salinity tolerance in halophytes. New Phytol. 2008, 179, 945–963. [Google Scholar] [CrossRef]
  52. Chourasia, K.N.; More, S.J.; Kumar, A.; Kumar, D.; Singh, B.; Bhardwaj, V.; Kumar, A.; Das, S.K.; Singh, R.K.; Zinta, G.; et al. Salinity responses and tolerance mechanisms in underground vegetable crops: An integrative review. Planta 2022, 255, 68. [Google Scholar] [CrossRef]
  53. Wang, Y.J.; Müller-Schärer, H.; van Kleunen, M.; Cai, A.M.; Zhang, P.; Yan, R.; Dong, B.C.; Yu, F.H. Invasive alien plants benefit more from clonal integration in heterogeneous environments than natives. New Phytol. 2017, 216, 1072–1078. [Google Scholar] [CrossRef] [PubMed]
  54. Amasino, R. Seasonal and developmental timing of flowering. Plant J. 2010, 61, 10011013. [Google Scholar] [CrossRef] [PubMed]
  55. Liu, G.; Guan, R.; Chang, R.; Qiu, L. Correlation between Na+ Contents in Different Organs of Soybean and Salt Tolerance at the Seedling Stage. Acta Agron. Sin. 2011, 37, 1266–1273. [Google Scholar] [CrossRef]
  56. Menezes, R.V.; Azevedo Neto, A.D.D.; Ribeiro, M.D.O.; Cova, A.M.W. Growth and contents of organic and inorganic solutes in amaranth under salt stress. Pesqui. Agropecuária Trop. 2017, 47, 22–30. [Google Scholar] [CrossRef]
  57. Sahin, U.; Ekinci, M.; Ors, S.; Turan, M.; Yildiz, S.; Yildirim, E. Effects of individual and combined effects of salinity and drought on physiological, nutritional and biochemical properties of cabbage (Brassica oleracea var. capitata). Sci. Hortic. 2018, 240, 196–204. [Google Scholar] [CrossRef]
  58. Shirazi, M.; Khan, M.; Mahboob, W.; Khan, M.A.; Shereen, A.; Mujtaba, S.; Asad, A. Inconsistency in salt tolerance of some wheat (Triticum aestivium L.) genotypes evaluated under various growing environments. Pak. J. Bot. 2018, 50, 471–479. [Google Scholar]
  59. Zhang, H.; Gao, X.R.; Zhi, Y.H.; Li, X.; Zhang, Q.; Niu, J.B.; Wang, J.; Zhai, H.; Zhao, N.; Li, J.G.; et al. A non-tandem CCCH-type zinc-finger protein, IbC3H18, functions as a nuclear transcriptional activator and enhances abiotic stress tolerance in sweet potato. New Phytol. 2019, 223, 1918–1936. [Google Scholar] [CrossRef]
  60. Li, G.; Ye, Y.X.; Ren, X.Q.; Qi, M.Y.; Zhao, H.Y.; Zhou, Q.; Chen, X.H.; Wang, J.; Yuan, C.Y.; Wang, F.B. The rice Aux/IAA transcription factor gene OsIAA18 enhances salt and osmotic tolerance in Arabidopsis. Biol. Plant 2020, 64, 454–464. [Google Scholar] [CrossRef]
  61. Kang, C.; He, S.Z.; Zhai, H.; Li, R.J.; Zhao, N.; Liu, Q.C. A sweetpotato auxin response factor gene (IbARF5) is involved in carotenoid biosynthesis and salt and drought tolerance in transgenic Arabidopsis. Front. Plant Sci. 2018, 9, 1307. [Google Scholar] [CrossRef]
  62. Munns, R.; Passioura, J.B.; Colmer, T.D.; Byrt, C.S. Osmotic adjustment and energy limitations to plant growth in saline soil. New Phytol. 2020, 225, 1091–1096. [Google Scholar] [CrossRef]
  63. Zhao, J.; Zhang, W.; da Silva, J.A.T.; Liu, X.; Duan, J. Rice histone deacetylase HDA704 positively regulates drought and salt tolerance by controlling stomatal aperture and density. Planta 2021, 254, 79. [Google Scholar] [CrossRef]
  64. Hameed, M.; Ashraf, M.; Naz, N. Anatomical adaptations to salinity in cogon grass [Imperata cylindrica (L.) Raeuschel] from the Salt Range, Pakistan. Plant Soil 2009, 322, 229–238. [Google Scholar] [CrossRef]
  65. Yuan, F.; Wang, B. Adaptation of Recretohalophytes to Salinity. In Handbook of Halophytes; Springer: Cham, Switzerland, 2020; pp. 1–21. [Google Scholar]
  66. Wei, X.; Yan, X.; Yang, Z. Salt glands of recretohalophyte Tamarix under salinity: Their evolution and adaptation. Ecol. Evol. 2020, 10, 9384–9395. [Google Scholar] [CrossRef]
  67. Shabala, S.; Demidchik, V.; Shabala, L.; Cuin, T.; Smith, S.; Miller, A.; Davies, J.; Newman, I. Extracellular Ca2+ ameliorates NaCl-induced K+ loss from Arabidopsis root and leaf cells by controlling plasma membrane K+-permeable channels. Plant Physiol. 2006, 141, 1653–1665. [Google Scholar] [CrossRef]
  68. Zhang, Y.; Fang, J.; Wu, X.; Dong, L. Na+/K+ balance and transport regulatory mechanisms in weedy and cultivated rice (Oryza sativa L.) under salt stress. BMC Plant Biol. 2018, 18, 375. [Google Scholar] [CrossRef]
  69. Fang, S.; Hou, X.; Liang, X. Response mechanisms of plants under saline-alkali stress. Front. Plant Sci. 2021, 12, 667458. [Google Scholar] [CrossRef]
  70. Chen, H.N.; Tao, L.Y.; Shi, J.M.; Han, X.R.; Cheng, X.G. Exogenous salicylic acid signal reveals an osmotic regulatory role in priming the seed germination of Leymus chinensis under salt-alkali stress. Environ. Exp. Bot. 2021, 188, 104498. [Google Scholar]
  71. Rahman, A.; Nahar, K.; Hasanuzzaman, M.; Fujita, M. Calcium Supplementation Improves Na+/K+ Ratio, Antioxidant Defense and Glyoxalase Systems in Salt-Stressed Rice Seedlings. Front. Plant Sci. 2016, 7, 609. [Google Scholar] [CrossRef] [PubMed]
  72. Wu, G.Q.; Li, H.; Zhu, Y.H.; Li, S.J. Comparative physiological response of sainfoin (Onobrychis viciaefolia) seedlings to alkaline and saline-alkaline stress. J. Anim. Plant Sci. 2021, 31, 1028–1035. [Google Scholar]
  73. Qin, Y.; Bai, J.; Wang, Y.; Liu, J.; Hu, Y.; Dong, Z.; Ji, L. Comparative effects of salt and alkali stress on photosynthesis and root physiology of oat at anthesis. Arch. Biol. Sci. 2018, 70, 329–338. [Google Scholar] [CrossRef]
  74. Wang, R.; Wang, C.; Feng, Q.; Liou, R.M.; Lin, Y.F. Biological inoculant of salt-tolerant bacteria for plant growth stimulation under different saline soil conditions. J. Microbiol. Biotechnol. 2021, 31, 398–407. [Google Scholar] [CrossRef]
  75. Zelm, E.V.; Zhang, Y.; Testerink, C. Salt Tolerance Mechanisms of Plants. Annu. Rev. Plant Biol. 2020, 71, 403–433. [Google Scholar] [CrossRef] [PubMed]
  76. Pan, J.; Xue, X.; Huan, C.; Peng, F.; Liao, J.; Ma, S.; You, Q.; Wang, T. Salt Tolerance Strategies of Nitraria tangutorum Bobr. and Elaeagnus angustifolia Linn. Determine the Inoculation Effects of Microorganisms in Saline Soil Conditions. Agronomy 2022, 12, 913. [Google Scholar] [CrossRef]
  77. Umar, S.; Diva, I.; Anjum, N.A.; Iqbal, M.; Ahmad, I.; Pereira, E. Potassium-induced alleviation of salinity stress in Brassica campestris L. Cent. Eur. J. Biol. 2011, 6, 1054–1063. [Google Scholar] [CrossRef]
  78. Ratnayake, M.; Leonard, R.; Menge, J. Root exudation in relation to supply of phosphorus and its possible relevance to mycorrhizal formation. New Phytol. 1978, 81, 543–552. [Google Scholar] [CrossRef]
  79. Yang, Z.; Li, J.L.; Liu, L.N. Photosynthetic regulation under salt stress and salt-tolerance mechanism of sweet sorghum. Front. Plant Sci. 2020, 10, 1722. [Google Scholar] [CrossRef] [PubMed]
  80. Sun, M.; Feng, X.X.; Gao, J.J.; Peng, R.H.; Yao, Q.H.; Wang, L.J. VvMYBA6 in the promotion of anthocyanin biosynthesis and salt tolerance in transgenic Arabidopsis. Plant Biotechnol. Rep. 2017, 11, 299–314. [Google Scholar] [CrossRef]
  81. Naing, A.H.; Kim, C.K. Abiotic stress-induced anthocyanins in plants: Their role in tolerance to abiotic stresses. Physiol. Plant 2021, 172, 1711–1723. [Google Scholar] [CrossRef]
  82. Wu, Z.; Wang, J.; Yan, D.; Yuan, H.; Wang, Y.; He, Y.; Wang, X.; Li, Z.; Mei, J.; Hu, M. Exogenous spermidine improves salt tolerance of pecan-grafted seedlings via activating antioxidant system and inhibiting the enhancement of Na+/K+ ratio. Acta Physiol. Plant 2020, 42, 83. [Google Scholar] [CrossRef]
  83. Banu, M.N.A.; Hoque, M.A.; Watanabe-Sugimoto, M. Proline and glycinebetaine induce antioxidant defense gene expression and suppress cell death in cultured tobacco cells under salt stress. J. Plant Physiol. 2009, 166, 146–156. [Google Scholar] [CrossRef]
  84. Naing, A.H.; Park, K.I.; Ai, T.N.; Chung, M.Y.; Han, J.S.; Kang, Y.W.; Lim, K.B.; Kim, C.K. Overexpression of snapdragon Delila (Del) gene in tobacco enhances anthocyanin accumulation and abiotic stress tolerance. BMC Plant Biol. 2017, 17, 65. [Google Scholar] [CrossRef] [PubMed]
  85. Katsuhara, M.; Kawasaki, T. Salt Stress Induced Nuclear and DNA Degradation in Meristematic Cells of Barley Roots. Plant Cell Physiol. 1996, 37, 169–173. [Google Scholar] [CrossRef]
  86. Ameisen, J. On the origin, evolution, and nature of programmed cell death: A timeline of four billion years. Cell Death Differ. 2002, 9, 367–393. [Google Scholar] [CrossRef]
  87. Zhao, Y.; Wu, M.; Deng, P.; Zhou, X.W.; Huang, S.Y. Effects of salt stress on growth and chlorophyII fluorescence parameters of Siraitia grosvenorii seedlings. South China Fruits 2021, 50, 103–107. [Google Scholar] [CrossRef]
  88. Athar, H.R.; Ashraf, M. Photosynthesis under Drought Stress. In Handbook of Photosynthesis, 2nd ed.; Pessarakli, M., Ed.; CRC Press: Boca Raton, FL, USA, 2005; pp. 793–809. [Google Scholar]
  89. Ehsen, S.; Abideen, Z.; Rizvi, R.F.; Gulzar, S.; Aziz, I.; Gul, B.; Khan, M.A.; Ansari, R. Ecophysiological adaptations and anti-nutritive status of sustainable cattle feed Haloxylon stocksii under saline conditions. Flora 2019, 257, 151425. [Google Scholar] [CrossRef]
  90. Abideen, Z.; Koyro, H.W.; Hussain, T.; Rasheed, A.; Alwahibi, M.S.; Elshikh, M.S.; Hussain, M.I.; Zulfiqar, F.; Mansoor, S.; Abbas, Z. Biomass Production and Predicted Ethanol Yield Are Linked with Optimum Photosynthesis in Phragmites karka under Salinity and Drought Conditions. Plants 2022, 11, 1657. [Google Scholar] [CrossRef] [PubMed]
  91. Ibrahim, W.; Ahmed, I.M.; Chen, X.; Cao, F.; Zhu, S.; Wu, F. Genotypic differences in photosynthetic performance, antioxidant capacity, ultrastructure and nutrients in response to combined stress of salinity and Cd in cotton. Biometals 2015, 28, 1063–1078. [Google Scholar] [CrossRef] [PubMed]
Figure 1. The growth of different ecotypes of Ipomoea cairica under salt stress that shows the phenotypic adaptability of the coastal ecotype to salt stress. (A,B) Root growth after 2 weeks of hydroponics, including (A) the morphology of the root (Bar = 1 cm) and (B) root length. (CF) The growth trend of the two ecotypes within 60 d after transplantation, including (C) the main stem length. (D) Leaf number during the salt treatment. (E) Branch number. (F) Flower number. All the data represent the mean ± SE. The different letters in the bar graphs indicate significant differences at p < 0.05. SE, standard error.
Forests 15 00358 g001
Figure 2. Effect of 150 mmol/L NaCl on the growth of terrestrial ecotype and coastal ecotype of Ipomoea cairica (AD) after 60 d. (E) Fresh weight of the roots. (F) Fresh weight of the aboveground biomass. (G) Fresh weight of the total biomass. (H) Root/shoot ratio. All the data represent the mean ± SE. Different letters indicate a significant difference at p < 0.05. SE, standard error.
Forests 15 00358 g002
Figure 3. The terrestrial ecotype suffered more severe cellular damage under salt stress than the coastal ecotype. (A,B) Apoptosis of the protoplasts under the salt treatment detected by Annexin V-FITC/PI double staining flow cytometry. (A) Flow cytometric estimation of apoptosis. (B) Representative flow cytometry histograms of the apoptosis. (C,D) Root cell membrane integrity detected by Evans blue staining. A darker stain, lower integrity. (C) Dead cells that were stained blue. (D) The degree of damage to the cell membrane. (E) Malondialdehyde (MDA). (F) Relative electrical conductivity (REC). (G) Leaf relative water content. Bar = 1 μm. All the data represent the mean ± SE. The different letters in the bar graphs indicate significant differences at p < 0.05. SE, standard error.
Forests 15 00358 g003
Figure 4. Physiological changes induced by salt in Ipomoea cairica leaves. (A) Anthocyanin content. (B) Superoxide dismutase (SOD). (C) Peroxidase (POD). (D) Catalase (CAT). All the data represent the mean ± SE. The different letters in the bar graphs indicate significant differences at p < 0.05. SE, standard error.
Forests 15 00358 g004
Figure 5. Effect of NaCl concentrations on the salt glands of the two ecotypes after 60 d. (AD) Salt glands, red arrows. (E) Salt gland area. (F) Number of salt glands. (G) Salt gland density. All the data represent the mean ± SE. The different letters in the bar graphs indicate significant differences at p < 0.05. SE, standard error.
Forests 15 00358 g005
Figure 6. The contents of elements and their allocations in the roots, stems, and leaves of the coastal ecotype were more balanced and conducive to growth than those of the terrestrial ecotype under salt stress. (A) Content of sodium ion (Na+). (B) Content of potassium ion (K+). (C) K+: Na+ ratio. (D) Content of nitrogen (N). (E) Content of phosphorus (P). (F) N: P ratio. All the data represent the mean ± SE. The different letters in the bar graphs indicate significant differences at p < 0.05. SE, standard error.
Forests 15 00358 g006
Figure 7. Effect of NaCl concentrations on the stomata and proline content of the two ecotypes after 60 d. (AD) Stomata. (E) Number of stomata. (F) Stomatal density. (G) Proline. All the data represent the mean ± SE. The different letters in the bar graphs indicate significant differences at p < 0.05. SE, standard error.
Forests 15 00358 g007
Figure 8. The chlorophyll content and chlorophyll fluorescence parameters of the two ecotypes under salt stress. (A) Total chlorophyll (chl a + b). (B) Chlorophyll a. (C) Chlorophyll b. (D) Chlorophyll a/b. (E) Maximal efficiency of PSII photochemistry. (F) Actual quantum yield of PSII. (G) Photochemical quenching coefficient. (H) Non-photochemical quenching coefficient. (I) Electron transport rate. PSII, photosystem II. All the data represent the mean ± SE. The different letters in the bar graphs indicate significant differences at p < 0.05. SE, standard error.
Forests 15 00358 g008
Figure 9. Schematic representation of the inhibition of growth induced by salinity. LRWC, leaf relative water content; PFW, plant fresh weight; RFW, fresh weight of roots; RL, root length; MSL, main stem length; BN, branch number; FN, flower number; LN, leaf number; Chl a, chlorophyll a content; Chl b, chlorophyll b content; TChl, total chlorophyll content; Chl a/b, chlorophyll a/b; Fv/Fm, maximal efficiency of PSII photochemistry; qL, photochemical quenching coefficient; Y(ll), actual quantum yield of PSII; NPQ, non-photochemical quenching coefficient; ETR, electron transport rate; MDA, malondialdehyde; REC, relative electrical conductivity; Pro, proline; SOD, superoxide dismutase; POD, peroxidase. PSII, Photosystem II; Na+, sodium ion; K+, potassium ion; K+/Na+ sodium and potassium ion ratio; N, nitrogen; P, phosphorus; N/P, nitrogen and phosphorus ratio.
Forests 15 00358 g009
Disclaimer/Publisher’s Note: The statements, opinions and data contained in all publications are solely those of the individual author(s) and contributor(s) and not of MDPI and/or the editor(s). MDPI and/or the editor(s) disclaim responsibility for any injury to people or property resulting from any ideas, methods, instructions or products referred to in the content.

