Interannual Variation in Gas Exchange and Leaf Anatomy in Cenostigma pyramidale Is Exacerbated through El Niño and La Niña Climate Events

 , , ,
, , , 
Abstract
:
1. Introduction
2. Materials and Methods
2.1. Plant Species, Site Description, and Experimental Design
2.2. Leaf Area and Specific Leaf Area
2.3. Predawn and Noon Leaf Water Potential (Ψw)
2.4. Gas Exchange
2.5. Leaf Anatomy
2.6. Phenotypic Plasticity
2.7. Experimental Design and Statistical Analyses
3. Results
3.1. Leaf Area (LA) and Specific Leaf Area (SLA)
3.2. Water Potential
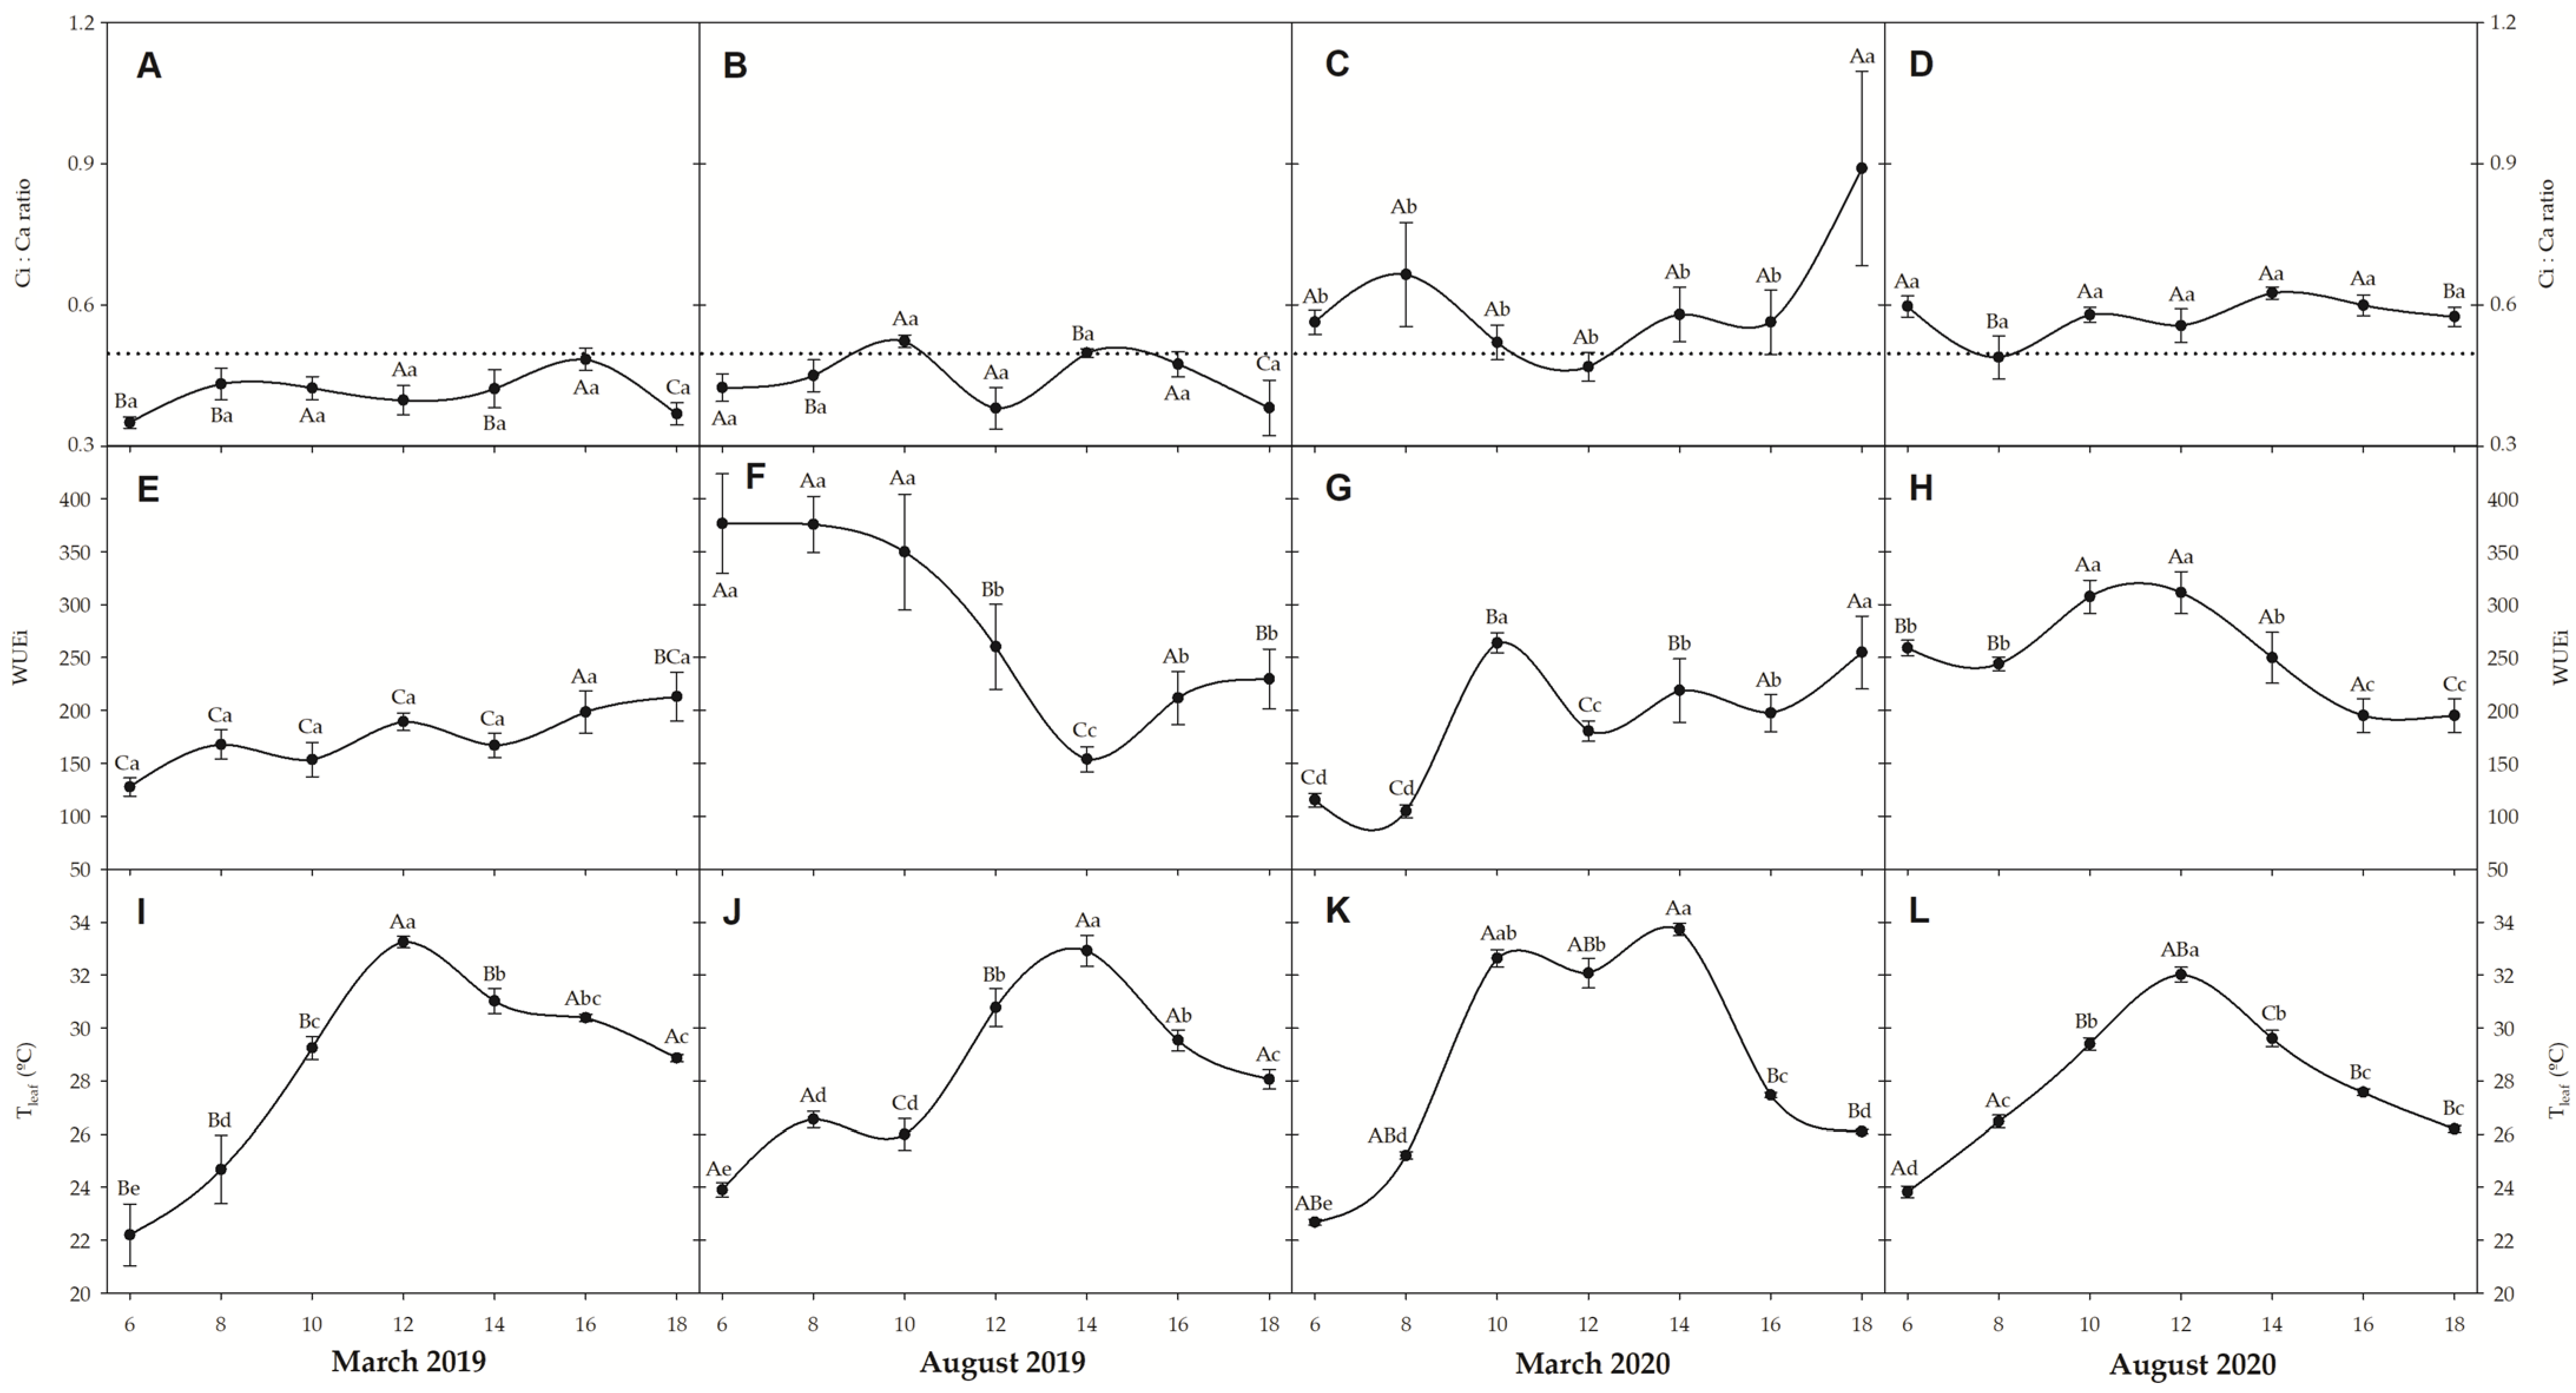
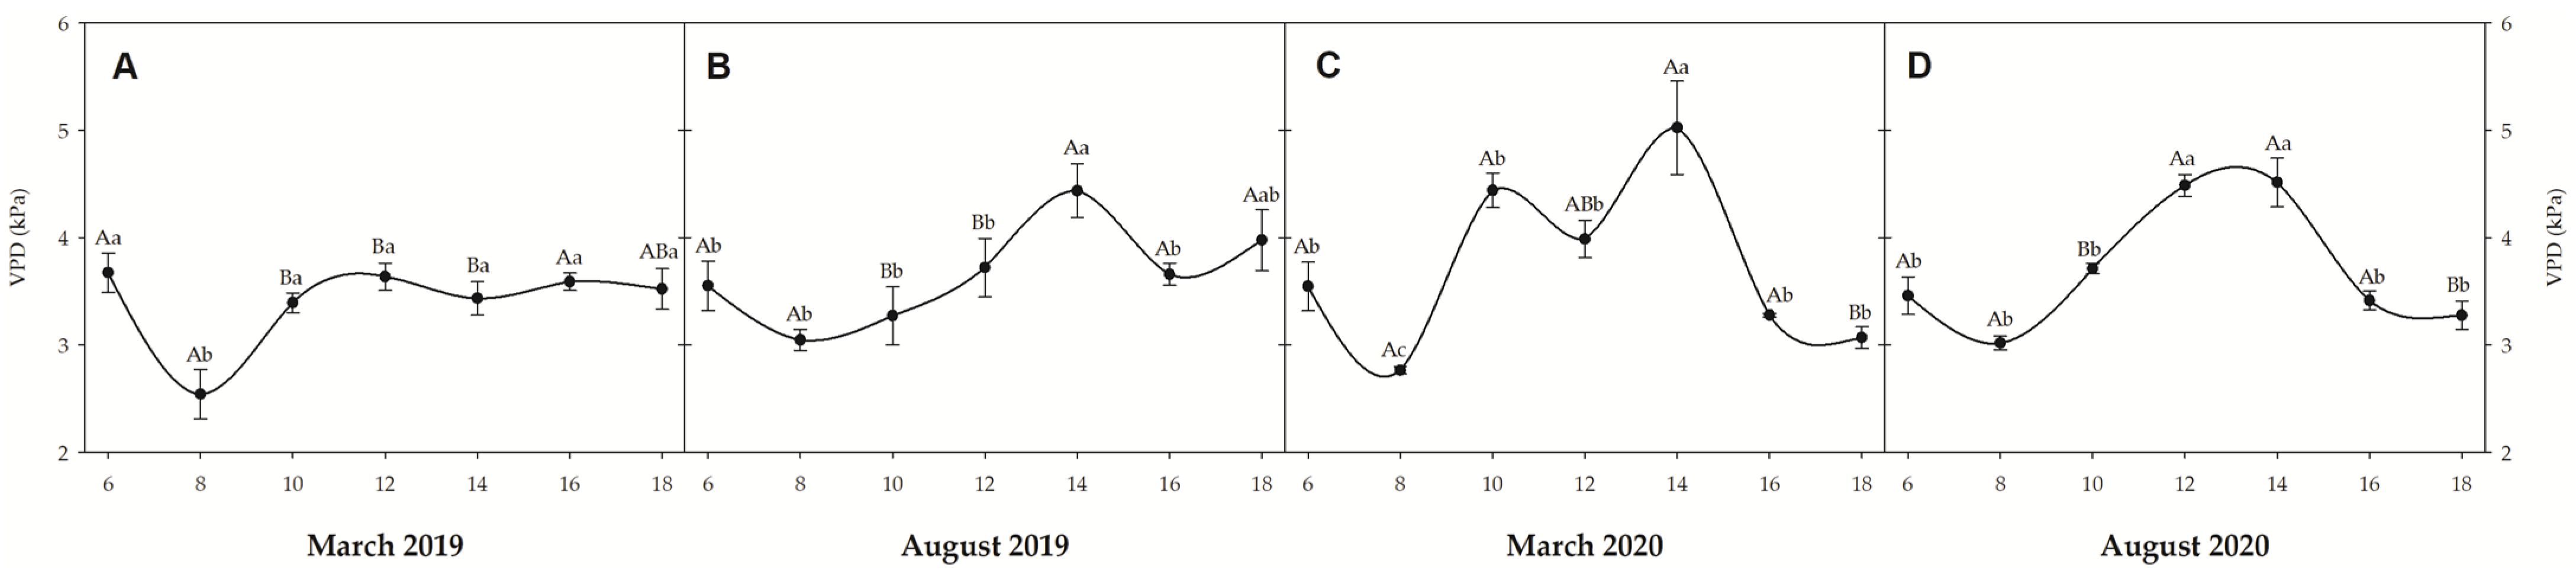
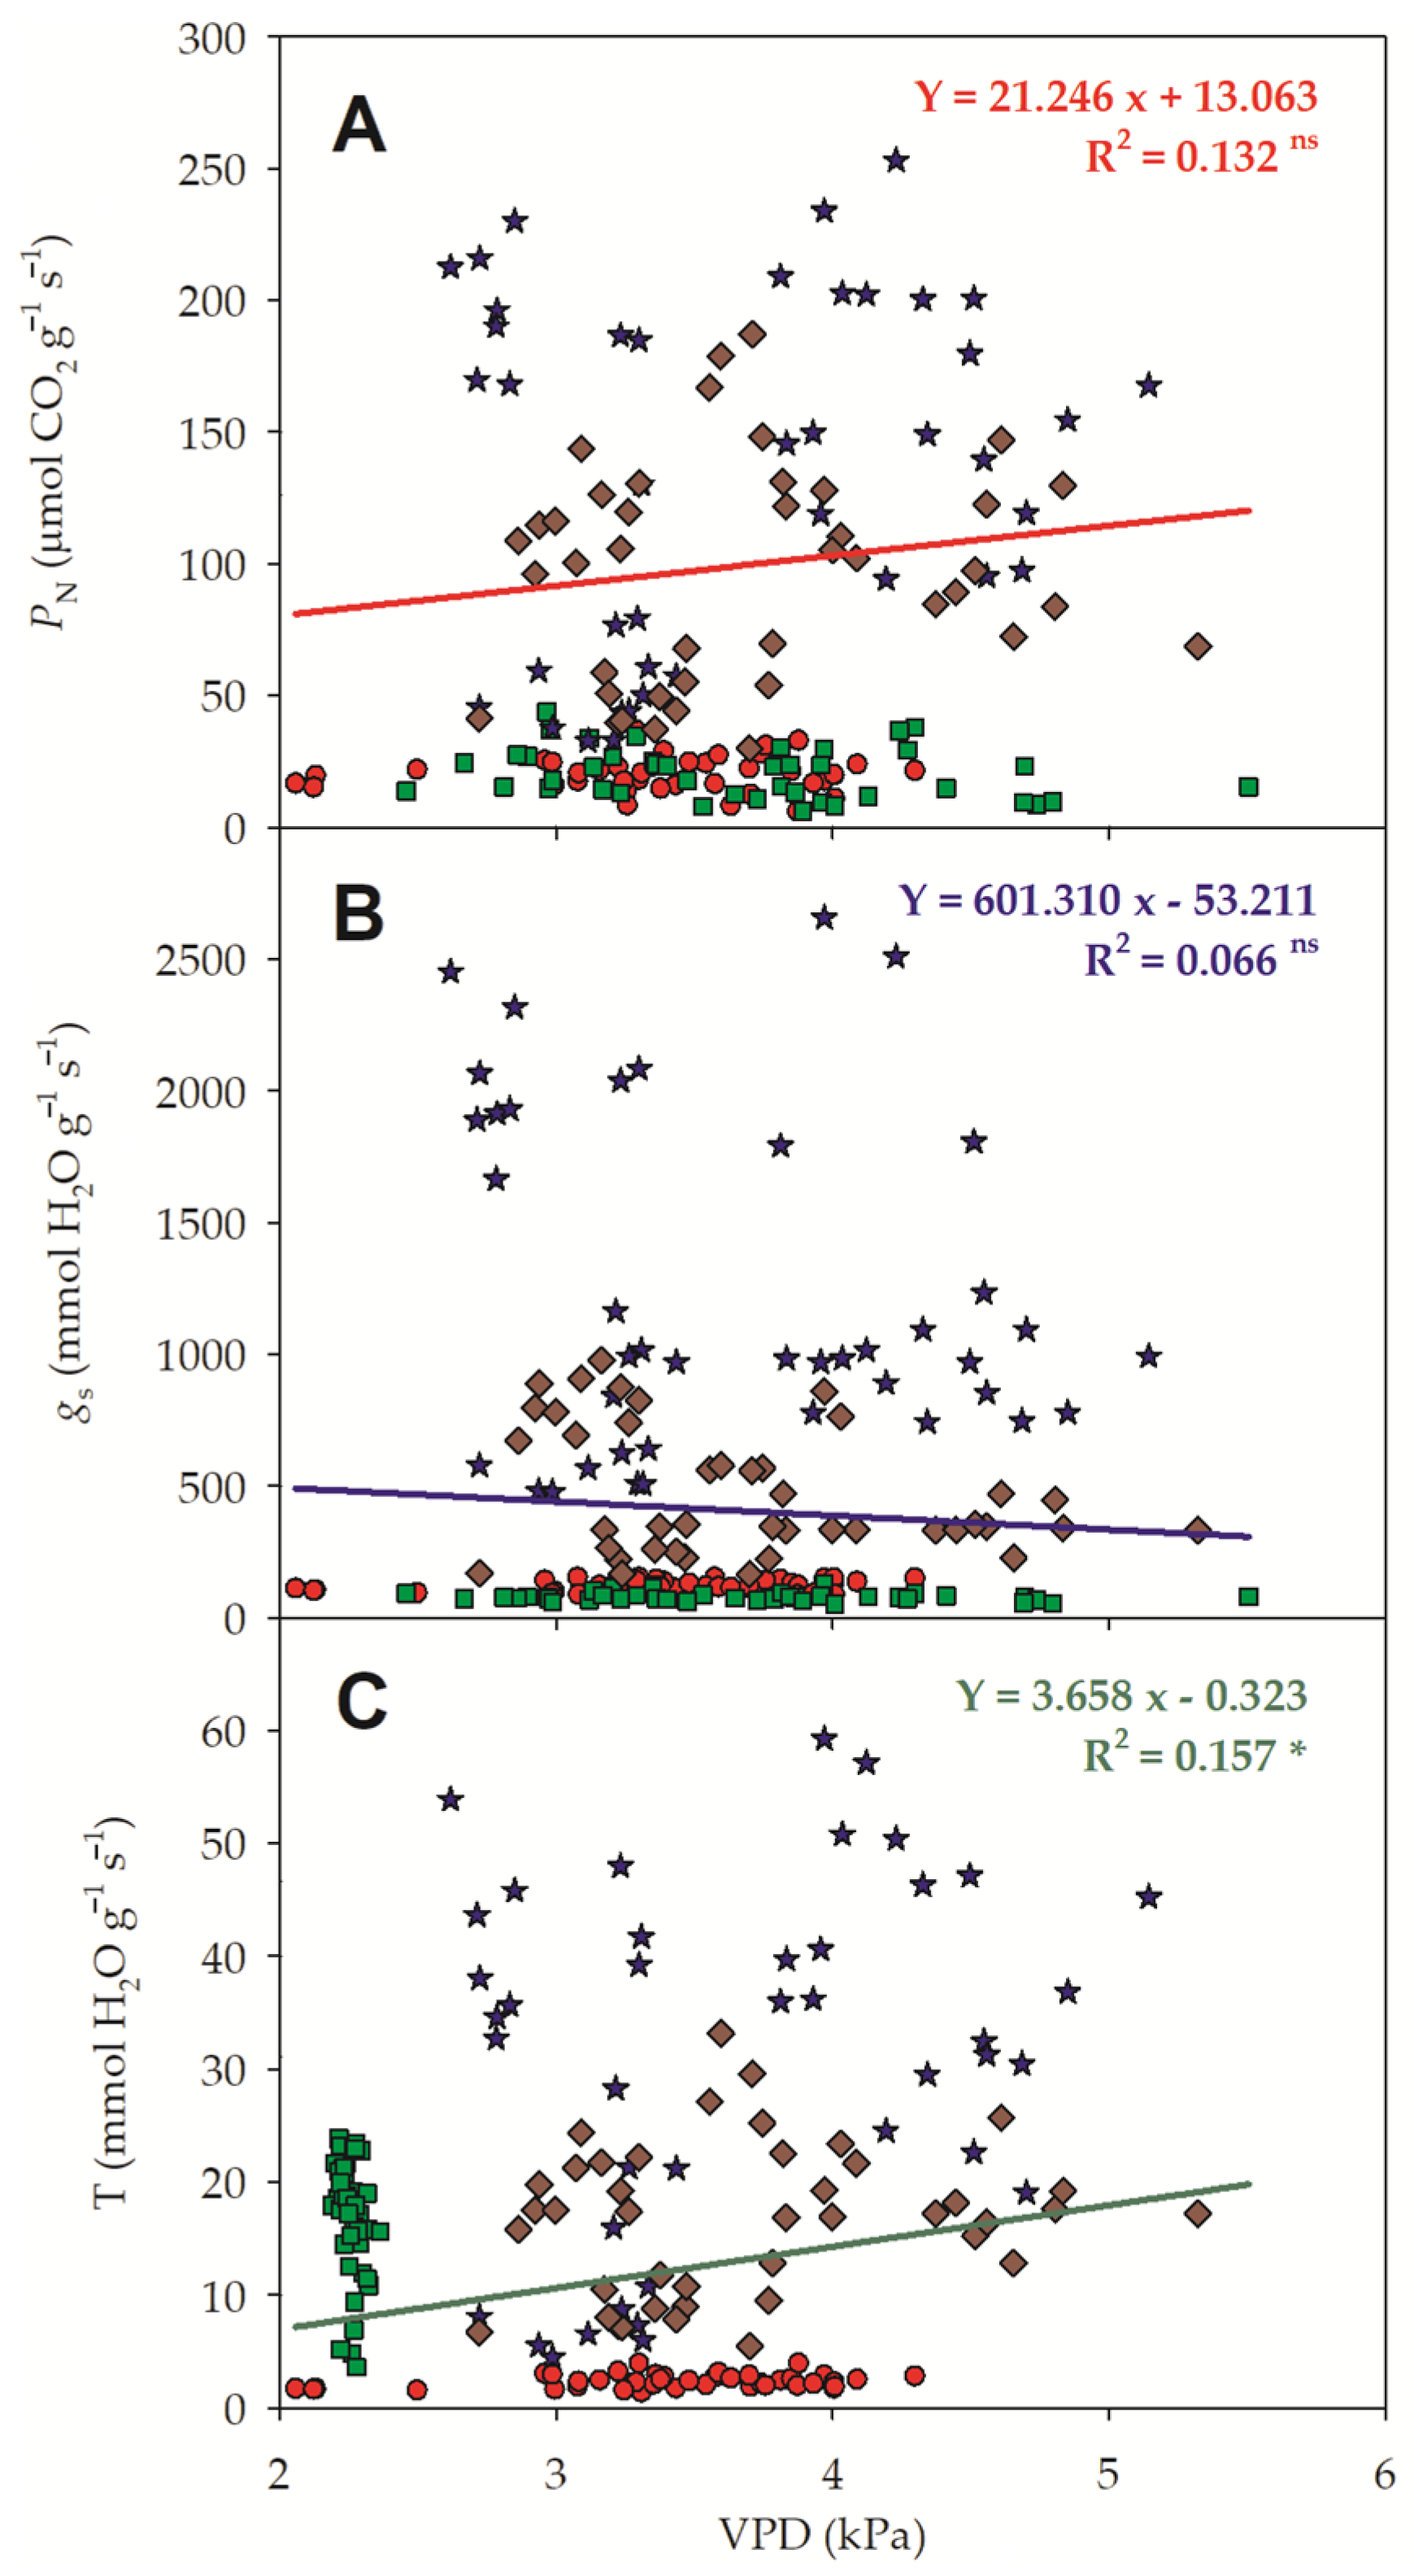
3.3. Gas Exchanges
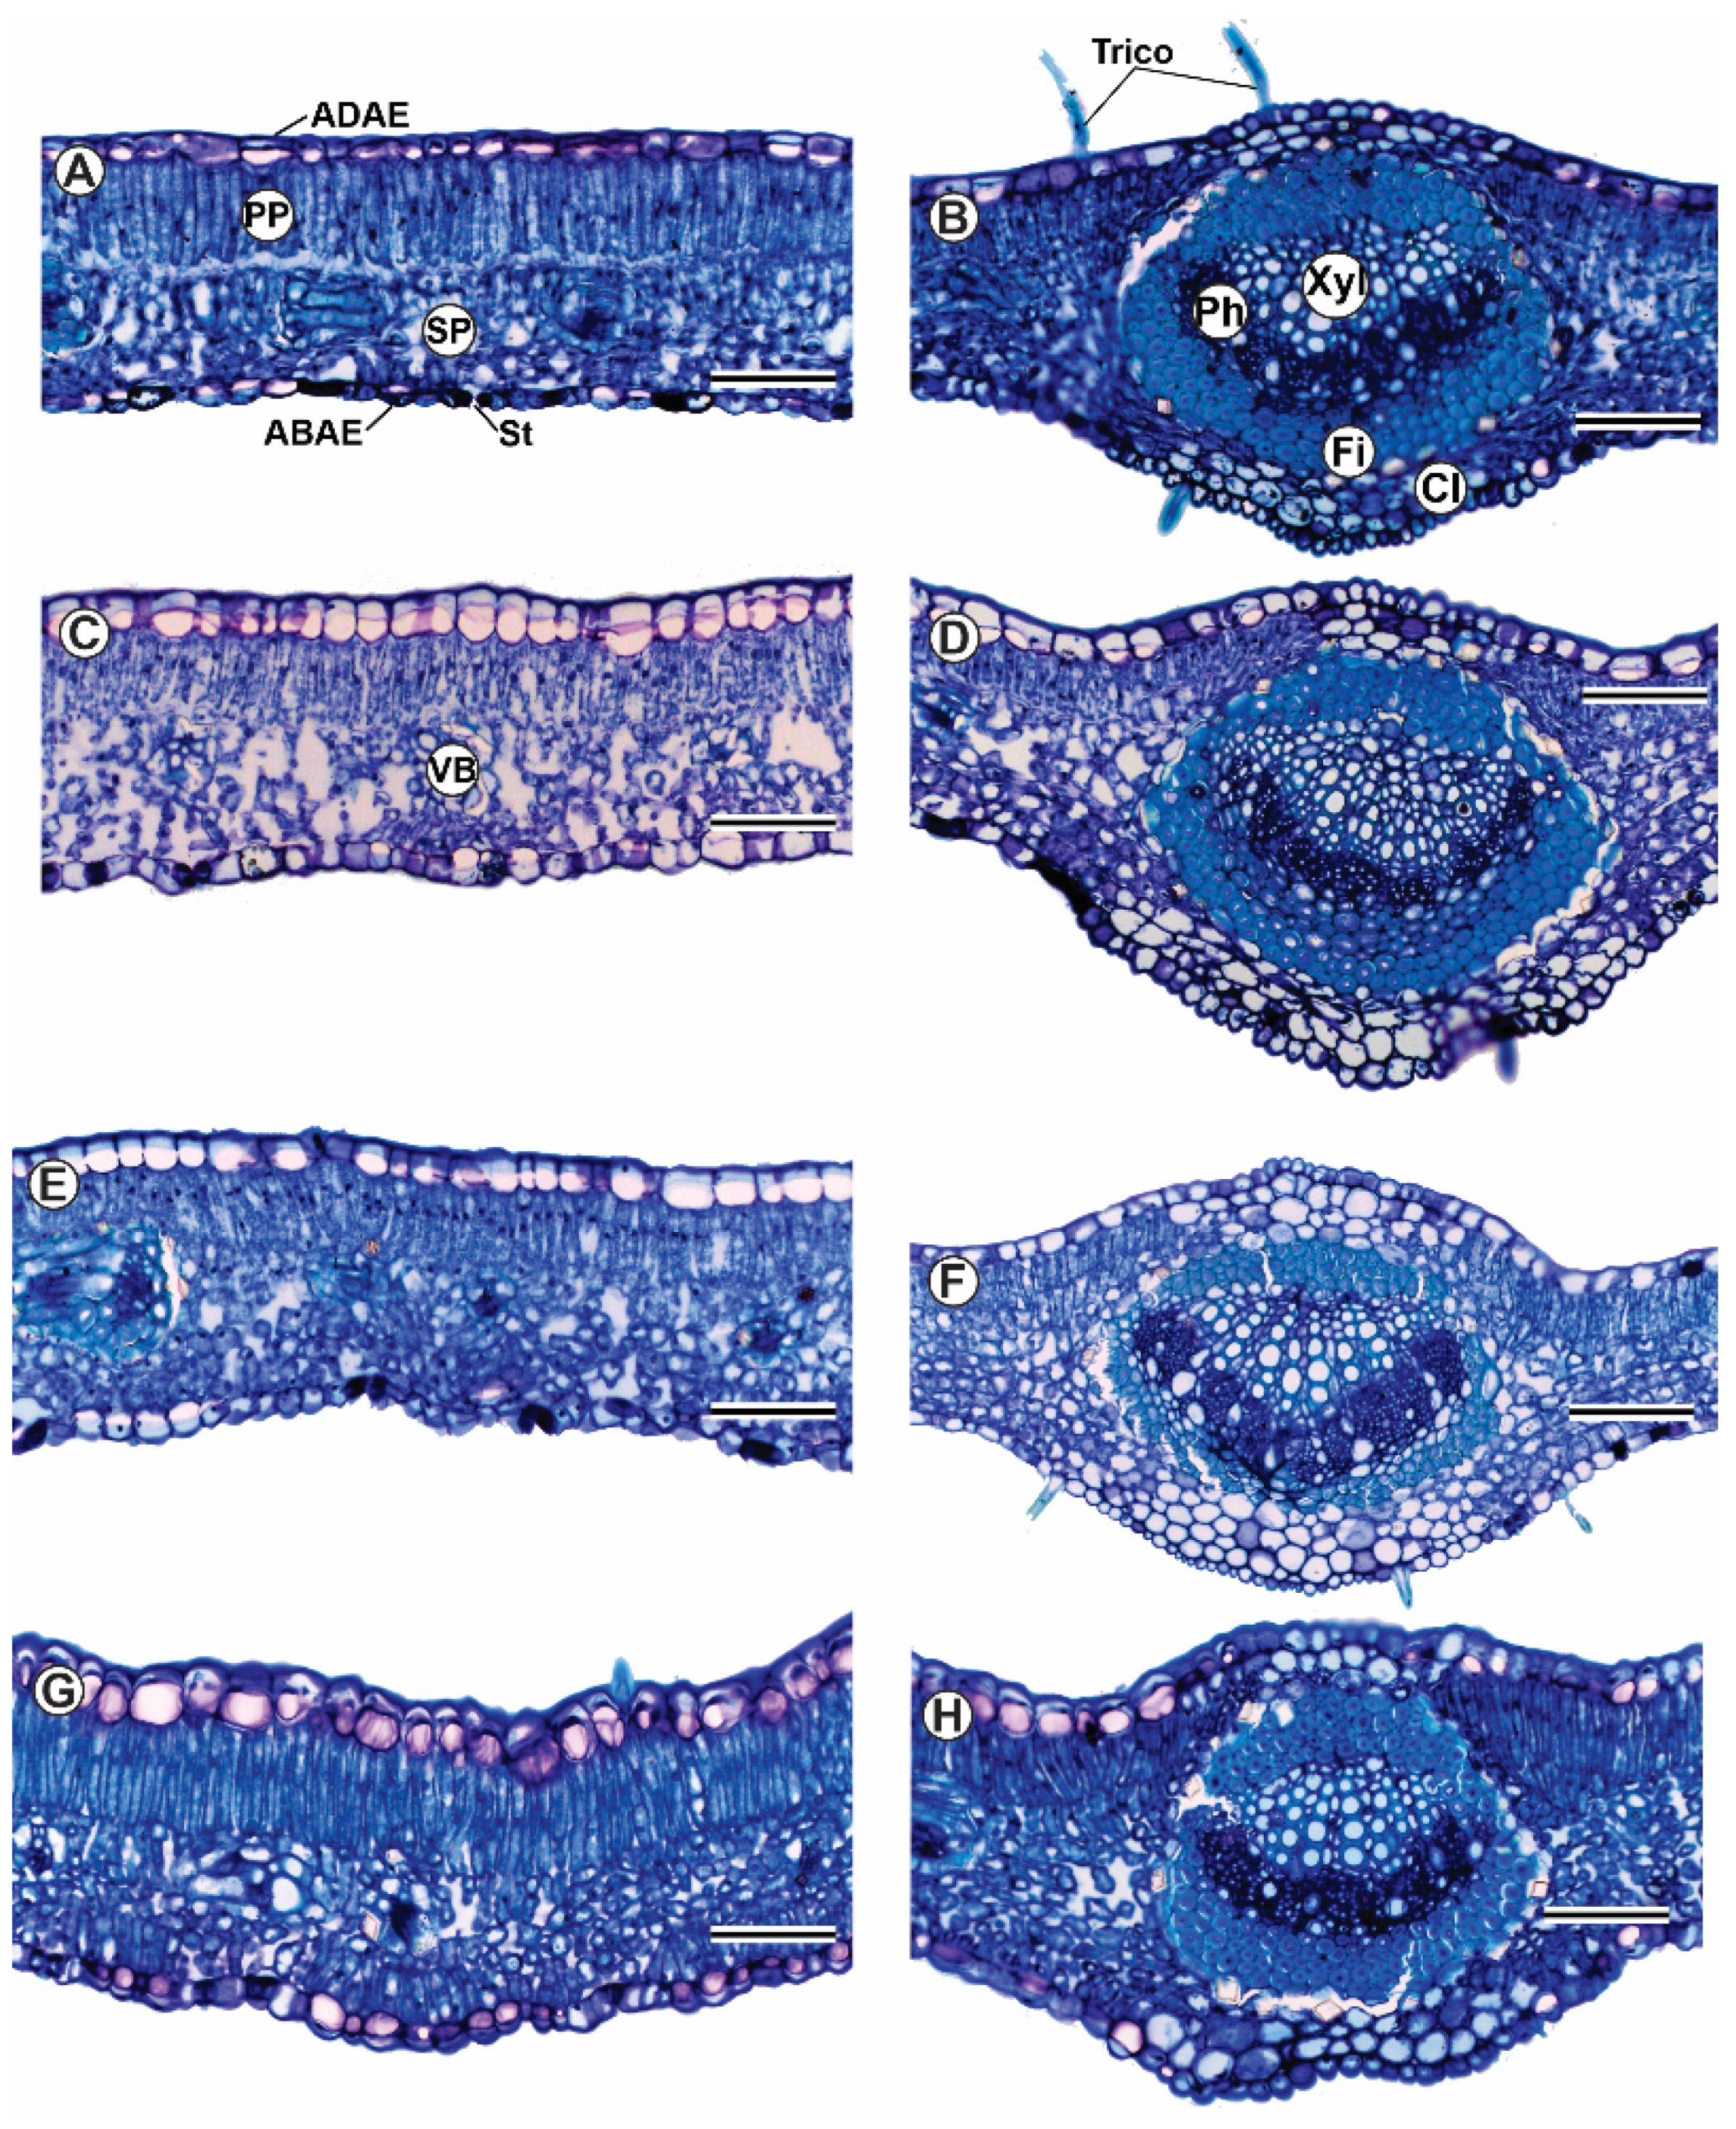
3.4. Plant Anatomy
3.5. Principal Component Analysis
3.6. Heatmap
3.7. Phenotypic Plasticity
4. Discussion
5. Conclusions
Supplementary Materials
Author Contributions
Funding
Data Availability Statement
Conflicts of Interest
References
- Haworth, M.; Marino, G.; Brunetti, C.; Killi, D.; De Carlo, A.; Centritto, M. The impact of heat stress and water deficit on the photosynthetic and stomatal physiology of olive (Olea europaea L.—A case study of the 2017 heat wave. Plants 2017, 7, 76. [Google Scholar] [CrossRef]
- Ramirez, R. Quatro Gráficos Alarmantes que Mostram o Quão Extremo o Clima Está Atualmente. CNN Brasil. 2023. Available online: https://www.cnnbrasil.com.br/internacional/quatro-graficos-alarmantes-que-mostram-o-quao-extremo-o-clima-esta-atualmente/ (accessed on 7 December 2023).
- Planelles, M. Crise Ambiental Avança e Clima Extremo Desafia o Mundo. El País. 2021. Available online: https://brasil.elpais.com/ciencia/2021-08-01/clima-extremo-desafia-o-mundo.html (accessed on 7 December 2023).
- Schleuning, M.; Fründ, J.; Schweiger, O.; Weld, E.; Albrecht, J.; Albrecht, M.; Beil, M.; Benadi, G.; Blüthgen, N.; Bruelheide, H.; et al. Ecological networks are more sensitive to plant than to animal extinction under climate change. Nat. Commun. 2016, 7, 13965. [Google Scholar] [CrossRef]
- Almar, R.; Boucharel, J.; Graffin, M.; Abessolo, G.O.; Thoumyre, G.; Papa, F.; Ranasinghe, R.; Montano, J.; Bergsma, E.W.J.; Baba, M.W. Influence of El Niño on the variability of global shoreline position. Nat. Commun. 2023, 14, 3133. [Google Scholar] [CrossRef]
- McKenna, M.; Karamperidou, C. The impacts of El Niño diversity on northern hemisphere atmospheric blocking. Geophys. Res. Lett. 2023, 50, e2023GL104284. [Google Scholar] [CrossRef]
- Glotfelty, T.; Zhang, Y. Impact of future climate policy scenarios on air quality and aerosol-cloud interactions using an advanced version of CESM/CAM5: Part II. Future trend analysis and impacts of projected anthropogenic emissions. Atmos. Environ. 2017, 152, 531–552. [Google Scholar] [CrossRef]
- Rizhsky, L.; Liang, H.J.; Mittler, R. The combined effect of drought stress and heat shock on gene expression in tobacco. Plant Physiol. 2002, 130, 1143–1157. [Google Scholar] [CrossRef]
- Rizhsky, L.; Liang, H.; Shuman, J.; Shulaev, V.; Davletova, S.; Mittler, R. When defense pathways collide: The response of Arabidopsis to a combination of drought and heat stress. Plant Physiol. 2004, 134, 1683–1696. [Google Scholar] [CrossRef]
- Sun, S.; Jung, E.; Gaviria, J.; Engelbrecht, B.M.J. Drought survival is positively associated with high turgor loss points in temperate perennial grassland species. Funct. Ecol. 2020, 34, 788–798. [Google Scholar] [CrossRef]
- Pompelli, M.F.; Martins, S.C.V.; Antunes, W.C.; Chaves, A.R.M.; DaMatta, F.M. Photosynthesis and photoprotection in coffee leaves is affected by nitrogen and light availabilities in winter conditions. J. Plant Physiol. 2010, 167, 1052–1060. [Google Scholar] [CrossRef] [PubMed]
- Pompelli, M.F.; Ferreira, P.P.B.; Chaves, A.R.M.; Figueiredo, R.C.Q.Q.; Martins, A.O.; Jarma-Orozco, A.; Batista-Silva, W.; Endres, L.; Araújo, W.L. Physiological, metabolic, and stomatal adjustments in response to salt stress in Jatropha curcas. Plant Physiol. Biochem. 2021, 168, 116–127. [Google Scholar] [CrossRef] [PubMed]
- Ronchi, C.P.; DaMatta, F.M.; Batista, K.D.; Moraes, G.A.B.K.; Loureiro, M.E.; Ducatti, C. Growth and photosynthetic down-regulation in Coffea arabica in response to restricted root volume. Funct. Plant Biol. 2006, 33, 1013–1023. [Google Scholar] [CrossRef]
- Praxedes, S.C.; DaMatta, F.M.; Loureiro, M.E.; Ferrão, M.A.G.; Cordeiro, A.T. Effects of long-term soil drought on photosynthesis and carbohydrate metabolism in mature robusta coffee (Coffea canephora Pierre var. kouillou) leaves. Environ. Exp. Bot. 2006, 56, 263–273. [Google Scholar] [CrossRef]
- Arcoverde, G.B.; Rodrigues, B.M.; Pompelli, M.F.; Santos, M.G. Water relations and some aspects of leaf metabolism of Jatropha curcas young plants under two water deficit levels and recovery. Braz. J. Plant Physiol. 2011, 23, 123–130. [Google Scholar] [CrossRef]
- Lawlor, D.W.; Tezara, W. Causes of decreased photosynthetic rate and metabolic capacity in water-deficient leaf cells: A critical evaluation of mechanisms and integration of processes. Ann. Bot. 2009, 103, 561–579. [Google Scholar] [CrossRef]
- Pompelli, M.F.; Barata-Luís, R.M.; Vitorino, H.S.; Gonçalves, E.R.; Rolim, E.V.; Santos, M.G.; Almeida-Cortez, J.S.; Endres, L. Photosynthesis, photoprotection and antioxidant activity of purging nut under drought deficit and recovery. Biomass Bioenergy 2010, 34, 1207–1215. [Google Scholar] [CrossRef]
- Smirnoff, N. Antioxidant systems and plant response to the environment. In Environment and Plant Metabolism: Flexibility and Acclimation; Smirnoff, N., Ed.; Bios Scientific: Oxford, UK, 1995; pp. 217–243. [Google Scholar]
- Krieger-Liszkay, A.; Fufezan, C.; Trebst, A. Singlet oxygen production in photosystem II and related protection mechanism. Photosynth. Res. 2008, 98, 551–564. [Google Scholar] [CrossRef]
- Antunes, W.C.; Mendes, K.R.; Chaves, A.R.M.; Ometto, J.P.; Jarma-Orozco, A.; Pompelli, M.F. Spondias tuberosa trees grown in tropical, wet environments are more susceptible to drought than those grown in arid environments. Rev. Col. Ciên. Hortic. 2016, 10, 9–27. [Google Scholar] [CrossRef]
- Gatti, L.V.; Gloor, M.; Miller, J.B.; Doughty, C.E.; Malhi, Y.; Domingues, L.G.; Basso, L.S.; Martinewski, A.; Correia, C.S.C.; Borges, V.F.; et al. Drought sensitivity of Amazonian carbon balance revealed by atmospheric measurements. Nature 2014, 506, 76–83. [Google Scholar] [CrossRef] [PubMed]
- Mendes, K.R.; Granja, J.A.A.; Ometto, J.P.; Antonino, A.C.D.; Menezes, R.S.C.; Pereira, E.C.; Pompelli, M.F. Croton blanchetianus modulates its morphophysiological responses to tolerate drought in a tropical dry forest. Funct. Plant Biol. 2017, 44, 1039–1051. [Google Scholar] [CrossRef]
- Ashraf, M.; Harris, P. Photosynthesis under stressful environments: An overview. Photosynthetica 2013, 51, 163–190. [Google Scholar] [CrossRef]
- Acosta-Motos, J.R.; Ortuño, M.F.; Bernal-Vicente, A.; Diaz-Vivancos, P.; Sanchez-Blanco, M.J.; Hernandez, J.A. Plant responses to salt stress: Adaptive mechanisms. Agronomy 2017, 7, 18. [Google Scholar] [CrossRef]
- Corte-Real, N.; Miranda, P.V.V.C.; Endres, L.; Souza, E.R.; Pompelli, M.F. Tolerance to salinity in Jatropha curcas are genotype-dependent. Braz. J. Dev. 2019, 5, 22169–22199. [Google Scholar] [CrossRef]
- Gomes, M.F.C.; Binneck, E.; Ferreira-Neto, J.R.C.; Luz, G.A.; Benko-Iseppon, A.M.; Pompelli, M.F.E.L.; Kido, É.A. Transcriptome analysis uncovers the Jatropha curcas L. transportome after NaCl (150 mM) exposure. Physiol. Plant 2021, in press. [Google Scholar]
- Cao, H.; Han, Y.; Cheng, Z.; Lv, Q.; Pompelli, M.F.; Pereira, J.D.; Araújo, W.L. Long exposure to salt stress in Jatropha curcas leads to stronger damage to the chloroplast ultrastructure and its functionality than the stomatal function. Forest 2023, 14, 1868. [Google Scholar] [CrossRef]
- Fernández-Marín, B.; Gulías, J.; Figueroa, C.M.; Iñiguez, C.; Clemente-Moreno, M.J.; Nunes-Nesi, A.; Fernie, A.R.; Cavieres, L.A.; Bravo, L.A.; García-Plazaola, J.I.; et al. How do vascular plants perform photosynthesis in extreme environments? An integrative ecophysiological andbiochemical story. Plant J. 2020, 101, 979–1000. [Google Scholar] [CrossRef]
- Ennajeh, M.; Vadel, A.M.; Cochard, H.; Khemira, H. Comparative impacts of water stress on the leaf anatomy of a drought-resistant and a drought-sensitive olive cultivar. J. Hortic. Sci. Biotechem. 2010, 85, 289–294. [Google Scholar] [CrossRef]
- Tomás, M.; Medrano, H.; Brugnoli, E.; Escalona, J.M.; Martorell, S.; Pou, A.; Ribas-Carbó, M.; Flexas, J. Variability of mesophyll conductance in grapevine cultivars under water stress conditions in relation to leaf anatomy and water use efficiency. Aust. J. Grape Wine Res. 2014, 20, 272–280. [Google Scholar] [CrossRef]
- Santos, M.G.; Oliveira, M.T.; Figueiredo, K.V.; Falcão, H.M.; Arruda, E.C.P.; Almeida-Cortez, J.S.; Sampaio, E.V.S.B.; Ometto, J.P.H.B.; Menezes, R.S.C.; Oliveira, A.F.M.; et al. Caatinga, the Brazilian dry tropical forest: Can it tolerate climate changes? Theor. Exp. Plant Physiol. 2014, 26, 83–99. [Google Scholar] [CrossRef]
- Ribeiro, I.M.C.; Arruda, E.C.P.; Oliveira, A.F.M.; Almeida, J.S. Physical and chemical defenses of Cenostigma pyramidale (Fabaceae): A pioneer species in successional caatinga areas. Rev. Caatinga 2021, 34, 398–409. [Google Scholar] [CrossRef]
- Almazroui, M.; Islanm, M.N.; Saeed, F.; Alkhalaf, A.K.; Dambul, R. Assessing the robustness and uncertainties of projected changes in temperature and precipitation in AR5 Global Climate Models over the Arabian Peninsula. Atmos. Res. 2017, 194, 202–213. [Google Scholar] [CrossRef]
- Angulo-Brown, F.; Sánchez-Salas, N.; Barranco-Jiménez, M.A.; Rosales, M.A. Possible future scenarios for atmospheric concentration of greenhouse gases: A simplified thermodynamic approach. Renew. Energy 2009, 34, 2344–2352. [Google Scholar] [CrossRef]
- O’Neill, B.C.; Oppenheimer, M.; Warren, R.; Hallegatte, S.; Kopp, R.E.; Pörter, H.O.; Scholes, R.; Birkmann, J.; Foden, W.; Licker, R.; et al. IPCC reasons for concern regarding climate change risks. Nat. Clim. Chang. 2017, 7, 28–37. [Google Scholar] [CrossRef]
- Pinho-Pessoa, A.C.B.; Mendes, K.R.; Jarma-Orozco, A.; Pereira, M.P.S.; Santos, M.A.; Menezes, R.S.C.; Ometto, J.P.; Pereira, E.C.; Pompelli, M.F. Interannual variation in temperature and rainfall can modulate the physiological and photoprotective mechanisms of a native semiarid plant species. Ind. J. Sci. Technol. 2018, 11, 1–17. [Google Scholar] [CrossRef]
- Dombroski, J.L.D.; Praxedes, S.C.; Freitas, R.M.O.; Pontes, F.M. Water relations of Caatinga trees in the dry season. S. Afr. J. Bot. 2011, 77, 430–434. [Google Scholar] [CrossRef]
- Pompelli, M.F.; Mendes, K.R.; Ramos, M.V.; Santos, J.N.B.; Youssef, D.T.A.; Pereira, J.D.; Endres, L.; Jarma-Orozco, A.; Solano-Gomes, R.; Jarma-Arroyo, B.; et al. Mesophyll thickness and sclerophylly among Calotropis procera morphotypes reveal water-saved adaptation to environments. J. Arid Land 2019, 11, 795–810. [Google Scholar] [CrossRef]
- Mendes, K.R.; Campos, S.; Mutti, P.R.; Ferreira, R.R.; Ramos, T.M.; Marques, T.V.; Dos Reis, J.S.; Vieira, M.M.L.; Silva, A.C.N.; Marques, A.M.S.; et al. Assessment of SITE for CO2 and energy fluxes simulations in a seasonally dry tropical forest (Caatinga Ecosystems). Forests 2021, 12, 86. [Google Scholar] [CrossRef]
- Mendes, K.R.; Batista-Silva, W.; Dias-Pereira, J.; Pereira, M.P.S.; Souza, E.V.; Serrão, J.E.; Granja, J.A.A.; Pereira, E.C.; Gallacher, D.J.; Mutti, P.R.; et al. Leaf plasticity across wet and dry seasons in Croton blanchetianus (Euphorbiaceae) at a tropical dry forest. Sci. Rep. 2022, 12, 954. [Google Scholar] [CrossRef]
- IBGE. Biomas e Sistema Costeiro-Carinho do Brasil: Compatível com a Escala 1:250.000 v.45; Instituto Brasileiro de Geografia e Estatística: Rio de Janeiro, Brazil, 2019; p. 168. [Google Scholar]
- Holzman, B.A. Tropical Forest Biomes; Greenwood Press: Westport, CT, USA, 2008. [Google Scholar]
- INMET. Estações Climáticas, Gráficos. diário. 2023. Available online: https://portal.inmet.gov.br/dadoshistoricos (accessed on 10 August 2023).
- Scholander, P.F.; Bradstreet, E.d.; Hemmingsen, E.A.; Hammel, H.T. Sap pressure in vascular plants negative hydrostatic pressure can be measures in plants. Science 1965, 148, 339–346. [Google Scholar] [CrossRef]
- Sterck, F.J.; Zweifel, R.; Sass-Klaassen, U.; Chowdhury, Q. Persisting soil drought reduces leaf specific conductivity in Scots pine (Pinus sylvestris) and pubescent oak (Quercus pubescens). Tree Physiol. 2008, 28, 529–536. [Google Scholar] [CrossRef]
- Scholz, A.; Klepsch, M.; Karimi, Z.; Jansen, S. How to quantify conduits in wood? Front. Plant Sci. 2013, 4, 56. [Google Scholar] [CrossRef]
- Valladares, F.; Balaguer, L.; Martinez-Ferri, E.; Perez-Corona, E.; Manrique, E. Plasticity, instability and canalization: Is the phenotypic variation in seedlings of sclerophyll oaks consistent with the environmental unpredictability of Mediterranean ecosystems? New Phytol. 2002, 156, 457–467. [Google Scholar] [CrossRef]
- Reddy, T.; Reddy, V.; Anbumozhi, V. Physiological responses of groundnut (Arachis hypogea L.) to drought stress and its amelioration: A critical review. Plant Growth Regul. 2003, 41, 75–88. [Google Scholar] [CrossRef]
- Leigh, A.; Sevanto, S.; Close, J.D.; Nicotra, A.B. The influence of leaf size and shape on leaf thermal dynamics: Does theory hold up under natural conditions? Plant Cell Environ. 2016, 40, 237–248. [Google Scholar] [CrossRef]
- Markesteijn, L.; Poorter, L.; Bongers, F. Light-dependent leaf trait variation in 43 tropical dry forest tree species. Am. J. Bot. 2007, 94, 515–525. [Google Scholar] [CrossRef]
- Falcão, H.M.; Medeiros, C.D.; Silva, B.L.R.; Sampaio, E.V.S.B.; Almeida-Cortez, J.; Santos, M.G. Phenotypic plasticity and ecophysiological strategies in a tropical dry forest chronosequence: A study case with Poincianella pyramidalis. For. Ecol. Manag. 2015, 340, 62–69. [Google Scholar] [CrossRef]
- Pagotto, M.A.; Roig, F.A.; Ribeiro, A.S.; Lisi, C.S. Influence of regional rainfall and Atlantic sea surface temperature on tree-ring growth of Poincianella pyramidalis, semiarid forest from Brazil. Dendrochronologia 2018, 35, 14–23. [Google Scholar] [CrossRef]
- Onoda, Y.; Wright, I.J.; Evans, J.R.; Hikosaka, K.; Kitajima, K.; Niinemets, Ü.; Poorter, H.; Tosens, T.; Westoby, M. Physiological and structural tradeoffs underlying the leaf economics spectrum. New Phytol. 2017, 214, 1447–1463. [Google Scholar] [CrossRef]
- Evert, R.F. Esau’s Plant Anatomy—Meristems, Cells, and Tissues of Tre Plant Body—Their Structures, Function and Development, 3rd ed.; John Wiley & Sons, Inc.: Hoboken, NJ, USA, 2013; p. 624. [Google Scholar]
- Wright, C.L.; West, J.B.; de Lima, A.L.A.; Souza, E.S.; Medeiros, M.; Wilcox, B.P. Contrasting water use strategies revealed by species-specific transpiration dynamics in the Caatinga dry forest. Tree Physiol. 2023, in press. Available online: https://pubmed.ncbi.nlm.nih.gov/37935389/ (accessed on 1 December 2023). [CrossRef]
- Warren, C.R.; Adams, M.A. Evergreen trees do not maximize instantaneous photosynthesis. Trends Plant Sci. 2004, 9, 270–274. [Google Scholar] [CrossRef]
- Falcão, H.M.; Medeiros, C.D.; Almeida-Cortez, J.; Santos, M.G. Leaf construction cost is related to water availability in three species of different growth forms in a Brazilian tropical dry forest. Theor. Exp. Plant Physiol. 2017, 29, 95–108. [Google Scholar] [CrossRef]
- Costa Júnior, E.O.; Silva-Oliveira, E.C.; Moura, J.C.M.; Melo, T.H.L. Photochemical quantum efficiency of Aspidosperma pyrifolium (Mart) and Poincianella pyramidalis (Tul.) L. P. Queiroz in an area of semiarid tropics (Soledade City, Paraíba, Northeast Brazil). Braz. J. Biol. Sci. 2014, 1, 59–65. [Google Scholar] [CrossRef]
- Barros, V.; Frosi, G.; Santos, M.; Ramos, D.G.; Falcao, H.M.; Santos, M.G. Arbuscular mycorrhizal fungi improve photosynthetic energy use efficiency and decrease foliar construction cost under recurrent water deficit in woody evergreen species. Plant. Physiol. Bioch. 2018, 127, 469–477. [Google Scholar] [CrossRef]
- Valladares, F.; Pearcy, R.W. Interactions between water stress, sunshade acclimation, heat tolerance and photoinhibition in the sclerophyll Heteromeles arbutifolia. Plant Cell Environ. 1997, 20, 25–36. [Google Scholar] [CrossRef]
- Bernacchi, C.J.; Portis, A.R.; Nakano, H.; von Caemmerer, S.; Long, S.P. Temperature response of mesophyll conductance. Implications for the determination of Rubisco enzyme kinetics and for limitation to photosynthesis in vivo. Plant Physiol. 2002, 130, 1992–1998. [Google Scholar] [CrossRef]
- Asargew, M.F.; Masutomi, Y.; Kobayashi, K.; Aono, M. Water stress changes the relationship between photosynthesis and stomatal conductance. Sci. Total Environ. 2024, 907, 167886. [Google Scholar] [CrossRef]
- Huang, G.; Zeng, Y. Increased stomatal conductance and leaf biochemical capacity, not mesophyll conductance, contributing to the enhanced photosynthesis in Oryza plants during domestication. Planta 2024, 259, 28. [Google Scholar] [CrossRef]
- Dunford, S. Translocation in the Phloem. In Plant Physiology, 5th ed.; Taiz, L., Zeiger, E., Eds.; Sinauer Associates Inc.: Sunderland, MA, USA, 2010; pp. 271–303. [Google Scholar]
- Buchanan, B.B.; Wolosiuk, R.A. Photosynthesis: The carbon reactions. In Plant Physiology, 5th ed.; Taiz, L., Zeiger, E., Eds.; Sinauer Associates Inc.: Sunderland, MA, USA, 2010; pp. 199–242. [Google Scholar]
- Tyree, M. Dynamic measurements of root hydraulic conductance using a high pressure flowmeter in the laboratory and field. J. Exp. Bot. 1995, 46, 83–94. [Google Scholar] [CrossRef]
- North, G.B.; Brinton, E.K.; Browne, M.G.; Gillman, M.G.; Roddy, A.B.; Kho, T.L.; Wang, E.; Fung, V.A.; Brodersen, C.R. Hydraulic conductance, resistance, and resilience: How leaves of a tropical epiphyte respond to drought. Am. J. Bot. 2019, 106, 943–957. [Google Scholar] [CrossRef]
- Roach, T.; Neuner, G.; Kranner, I.; Buchner, O. Heat acclimation under drought stress induces antioxidant enzyme activity in the alpine plant Primula minima. Antioxidants 2023, 12, 1093. [Google Scholar] [CrossRef]
- Woodward, F.I. Do plants really need stomata? J. Exp. Bot. 1998, 49, 471–480. [Google Scholar] [CrossRef]
- Hsie, B.S.; Mendes, K.R.; Antunes, W.C.; Endres, L.; Campos, M.L.O.; Souza, F.C.; Santos, N.D.; Singh, B.; Arruda, E.C.P.; Pompelli, M.F. Jatropha curcas L. (Euphorbiaceae) modulates stomatal traits in response to leaf-to-air vapor pressure deficit. Biomass Bioenerg 2015, 81, 273–281. [Google Scholar] [CrossRef]
- Drake, P.L.; Froend, R.H.; Franks, P.J. Smaller, faster stomata: Scaling of stomatal size, rate of response, and stomatal conductance. J. Exp. Bot. 2013, 64, 495–505. [Google Scholar] [CrossRef]
- Santos, M.; Barros, V.; Lima, L.; Frosi, G.; Santos, M.G. Whole plant water status and non-structural carbohydrates under progressive drought in a Caatinga deciduous woody species. Trees 2021, 35, 1257–1266. [Google Scholar] [CrossRef]
- Maherali, H.; DeLucia, E.H. Xylem conductivity and vulnerability to cavitation of ponderosa pine growing in contrasting climates. Tree Physiol. 2000, 20, 859–868. [Google Scholar] [CrossRef]
- Tsuda, M.; Tyree, M.T. Plant hydraulic conductance measured by the high pressure flow meter in crop plants. J. Exp. Bot. 2000, 51, 823–828. [Google Scholar] [CrossRef]
- Yuksel, M.; Al-agele, H.A.; Nackley, L.; Higgins, C.W. Hydraulic Conductivity of The Hemp Stems Under Water Stress. bioRxiv 2023. [Google Scholar] [CrossRef]
- Oliveira, P.S.; Pereira, L.S.; Silva, D.C.; Souza Júnior, J.O.; Laviola, B.G.; Gomes, F.P. Hydraulic conductivity in stem of young plants of Jatropha curcas L. cultivated under irrigated or water deficit conditions. Ind. Crops Prod. 2018, 116, 15–23. [Google Scholar] [CrossRef]
- Krieger, L.; Schymanski, S.J. A new experimental setup to measure hydraulic conductivity of plant segments. AoB Plants 2023, 15, plad024. [Google Scholar] [CrossRef]
- McDowell, N. Mechanisms of plant survival and mortality during drought: Why do some plants survive while others succumb to drought? New Phytol. 2008, 178, 719–739. [Google Scholar] [CrossRef]
- Sevanto, S.; McDowell, N.G.; Dickman, L.T.; Pangle, R.; Pockman, W.T. How do trees die? A test of the hydraulic failure and carbon starvation hypotheses. Plant Cell Environ. 2014, 37, 153–161. [Google Scholar] [CrossRef]
- Poorter, L.; McDonald, I.; Alarcón, A.; Fichtler, E.; Licona, J.-C.; Peña-Claros, M.; Sterck, F.; Villegas, Z.; Sass-Klaassen, U. The importance of wood traits and hydraulic conductance for the performance and life history strategies of 42 rainforest tree species. New Phytol. 2010, 185, 481–492. [Google Scholar] [CrossRef]
- Dodd, I.C. Abscisic acid and stomatal closure: A hydraulic conductance conundrum? New Phytol. 2013, 197, 6–8. [Google Scholar] [CrossRef]
- Ladjal, M.; Huc, R.; Ducrey, M. Drought effects on hydraulic conductivity and xylem vulnerability to embolism in diverse species and provenances of Mediterranean cedars. Tree Physiol. 2005, 25, 1109–1117. [Google Scholar] [CrossRef]
- Linton, M.J.; Sperry, J.S.; Williams, D.G. Limits to water transport in Juniperus osteosperma and Pinus edulis: Implications for drought tolerance and regulation of transpiration. Funct. Ecol. 1998, 12, 906–911. [Google Scholar] [CrossRef]
- Xu, T.; Zhang, L.; Li, Z. Computational fluid dynamics model and flow resistance characteristics of Jatropha curcas L xylem vessel. Sci. Rep. 2020, 10, 14728. [Google Scholar] [CrossRef]
- Pompelli, M.F.; Jarma-Orozco, A.; Rodríguez-Paéz, L.A. Screening of morphophysiological, anatomical, and ultrastructural traits to improve the elite genotype selection in sugarcane (Saccharum officinarum L.). Horticulturae 2022, 8, 1069. [Google Scholar] [CrossRef]
- Bhatt, A.; Gallacher, D.; Jarma-Orozco, A.; Fernandes, D.; Pompelli, M.F. Seed provenance selection of wild halophyte seeds improves coastal rehabilitation efficiency. Estuar Coast. Shelf Sci. 2022, 265, 107657. [Google Scholar] [CrossRef]
- Bhatt, A.; Chen, X.; Pompelli, M.F.; Jamal, A.; Mancinelli, R.; Radicetti, E. Characterization of invasiveness, thermotolerance and light requirement of nine invasive species in China. Plants 2023, 12, 1192. [Google Scholar] [CrossRef]
- Glover, B.J. Differentiation in plant epidermal cells. J. Exp. Bot. 2000, 51, 497–505. [Google Scholar] [CrossRef]
- Oliveira, J.A.B.; Almeida, J.S. Do the successional stage and plant architecture influence herbivory by insects in Cenostigma pyramidale in a dry tropical forest? J. Environ. Anal. Progr. 2021, 6, 352–362. [Google Scholar] [CrossRef]
- Taratima, W.; Samattha, C.; Maneerattanarungroj, P.; Trunjaruen, A. Physiological and anatomical response of rice (Oryza sativa L.) ‘Hom Mali Daeng’ at different salinity stress levels. Acta Agrobot. 2023, 76, 764. [Google Scholar] [CrossRef]
- Taratima, W.; Ritmaha, T.; Jongrungklang, N.; Maneerattanarungroj, P.; Kunpratum, N. Effect of stress on the leaf anatomy of sugarcane cultivars with different drought tolerance (Saccharum officinarum, Poaceae). Rev. Biol. Trop. 2020, 68, 1159–1170. [Google Scholar] [CrossRef]
- El-Banna, M.F.; Abdelaal, K.A.A. Response of strawberry plants grown in the hydroponic system to pretreatment with H2O2 before exposure to salinity stress. J. Plant Prod. 2018, 9, 989–1001. [Google Scholar] [CrossRef]
- Toscano, S.; Ferrante, A.; Tribulato, A.; Romano, D. Leaf physiological and anatomical responses of Lantana and Ligustrum species under different water availability. Plant Physiol. Biochem. 2018, 127, 380–392. [Google Scholar] [CrossRef]
- Vogelman, T.; Nishio, J.; Smith, W.K. Leaves and light capture: Light propagation and gradients of carbon fixation within leaves. Trends Plant Sci. 1996, 1, 65–70. [Google Scholar] [CrossRef]
- Sack, L.; Scoffoni, C. Leaf venation: Structure, function, development, evolution, ecology and applications in the past, present and future. New Phytol. 2013, 198, 983–1000. [Google Scholar] [CrossRef]
- Scoffoni, C.; Chatelet, D.S.; Pasquet-Kok, J.; Rawls, M.; Donoghue, M.J.; Edwards, E.J.; Sack, L. Hydraulic basis for the evolution of photosynthetic productivity. Nat. Plants 2016, 2, 16072. [Google Scholar] [CrossRef]
- Nardini, A.; Pedà, G.; Rocca, N. Trade-offs between leaf hydraulic capacity and drought vulnerability: Morpho-anatomical bases, carbon costs and ecological consequences. New Phytol. 2012, 196, 788–798. [Google Scholar] [CrossRef]
- Gratani, L. Plant phenotypic plasticity in response to environmental factors. Adv. Bot. 2014, 2014, 208747. [Google Scholar] [CrossRef]
- Valladares, F.; Sanchez-Gomez, D.; Zavala, M.A. Quantitative estimation of phenotypic plasticity: Bridging the gap between the evolutionary concept and its ecological applications. J. Ecol. 2006, 94, 1103–1116. [Google Scholar] [CrossRef]
- Valladares, F.; Arrieta, S.; Aranda, I.; Lorenzo, D.; Sanchez-Gomez, D.; Tena, D.; Suárez, F.; Pardos, J.A. Shade tolerance, photoinhibition sensitivity and phenotypic plasticity of Ilex aquifolium in continental Mediterranean sites. Tree Physiol. 2005, 25, 1041–1052. [Google Scholar] [CrossRef]


| Source of Variation | DF | SS | MS | F | p |
|---|---|---|---|---|---|
| Year | 1 | 28.415 | 28.415 | 219.490 | <0.0001 |
| Month | 1 | 13.831 | 13.831 | 106.835 | <0.0001 |
| Year × Month | 1 | 6.030 | 6.030 | 46.575 | <0.0001 |
| Residual | 20 | 2.589 | 0.129 | ||
| Total | 23 | 50.865 | 2.212 |
| Year/Month | LA (cm2) | SLA (SE) (cm2 g−1) |
|---|---|---|
| March 2019 | 2.435 ± 0.014 Ba | 15.068 ± 0.127 Aa |
| August 2019 | 1.741 ± 0.029 Ab | 14.552 ± 0.056 Ab |
| March 2020 | 2.656 ± 0.021 Aa | 13.894 ± 0.234 Ba |
| August 2020 | 1.588 ± 0.043 Bb | 11.373 ± 0.110 Bb |
| Parameters | 2019 | 2020 | ||
|---|---|---|---|---|
| March | August | March | August | |
| Total leaf thickness (TLT; μm) | 146.6 ± 3.3 Aa | 141.4 ± 3.1 Ba | 126.1 ± 3.2 Bb | 157.5 ± 3.5 Aa |
| Adaxial epidermis thickness (ADAE; μm) | 21.5 ± 0.5 Ab | 23.8 ± 1.1 Aa | 20.6 ± 0.6 Ab | 24.7 ± 0.8 Aa |
| Abaxial epidermis thickness (ABAE; μm) | 13.2 ± 0.3 Ab | 15.4 ± 0.6 Ba | 14.0 ± 0.4 Ab | 17.9 ± 0.5 Aa |
| Palisade mesophyll thickness (PP; μm) | 57.0 ± 2.6 Aa | 58.2 ± 3.0 Ba | 44.8 ± 2.1 Bb | 76.4 ± 2.5 Aa |
| Spongy mesophyll thickness (SP; μm) | 58.5 ± 1.5 Aa | 43.2 ± 2.0 Ab | 50.8 ± 1.5 Ba | 43.0 ± 1.7 Ab |
| Parameters | 2019 | 2020 | ||
|---|---|---|---|---|
| March | August | March | August | |
| Midrib thickness (MT; μm) | 297.6 ± 8.6 Ba | 333.7 ± 23.7Aa | 340.2 ± 16.8 Aa | 287.1 ± 7.6Ab |
| Midrib length (ML; μm) | 332.5 ± 20.9 Ba | 341.3 ± 24.5 Aa | 402.1 ± 19.0 Aa | 332.6 ± 16.0 Ab |
| Midrib area (MA; μm2) | 70,285.0 ± 2947.4 Bb | 80,763.9 ± 4436.7 Ba | 152,425.5 ± 7897.2 Aa | 93,033.1 ± 4956.5 Ab |
| Midrib xylem thickness (MXT; μm) | 45.0 ± 2.3 Ba | 40.9 ± 3.4 Ba | 64.4 ± 1.9 Aa | 45.5 ± 1.7 Ab |
| Midrib xylem area (MXA; μm2) | 8353.8 ± 621.3 Ba | 8001.4 ± 496.6 Bb | 17,095.0 ± 1142.2 Aa | 10,012.0 ± 978.7 Ab |
| Vessel area (VA; μm2) | 36.9 ± 1.6 Ba | 32.8 ± 3.0 Ba | 65.7 ± 3.4 Aa | 37.1 ± 1.5 Ab |
| Number of vessels (NV) | 36.3 ± 2.3 Ba | 34.8 ± 3.1Ba | 54.6 ± 1.7 Aa | 45.1 ± 3.5 Ab |
| Potential specific stem conductivity (Kp; kg m−1 MPa−1 s−1) | 316.3 ± 60.1 Ba | 282.2 ± 34.6 Ba | 923.3 ± 84.1 Aa | 489.2 ± 84.8 Ab |
| Physiological Features | March 2019 | Aug 2019 | March 2020 | Aug 2020 | Mean Value |
|---|---|---|---|---|---|
| Ψw(pd) | 0.300 | 0.975 | 0.333 | 0.905 | 0.628 |
| Ψw(md) | 0.077 | 0.250 | 0.200 | 0.156 | 0.171 |
| Net photosynthesis | 0.831 | 0.862 | 0.871 | 0.841 | 0.851 |
| Daily Net Photosynthesis | 0.221 | 0.390 | 0.194 | 0.171 | 0.244 |
| Stomatal conductance | 0.437 | 0.592 | 0.962 | 0.830 | 0.705 |
| Transpiration | 0.637 | 0.847 | 0.947 | 0.834 | 0.816 |
| Internal CO2 concentration | 0.449 | 0.632 | 0.793 | 0.510 | 0.596 |
| Internal to ambient [CO2] | 0.449 | 0.632 | 0.793 | 0.510 | 0.596 |
| Leaf temperature | 0.445 | 0.328 | 0.351 | 0.293 | 0.354 |
| Intrinsic water use efficiency | 0.633 | 0.786 | 0.783 | 0.683 | 0.721 |
| Vapor pressure deficit | 0.521 | 0.553 | 0.634 | 0.489 | 0.549 |
| Mean Value | 0.455 ± 0.208 a | 0.622 ± 0.233 a | 0.624 ± 0.298 a | 0.565 ± 0.275 a | 0.567 ± 0.223 A |
| Anatomical features | |||||
| Leaf area | 0.085 | 0.237 | 0.123 | 0.337 | 0.195 |
| Specific leaf area | 0.055 | 0.025 | 0.101 | 0.059 | 0.060 |
| Total leaf thickness | 0.248 | 0.329 | 0.384 | 0.294 | 0.314 |
| Adaxial epidermis thickness | 0.298 | 0.553 | 0.410 | 0.459 | 0.430 |
| Abaxial epidermis thickness | 0.316 | 0.420 | 0.450 | 0.414 | 0.400 |
| Palissade parenchyma thickness | 0.509 | 0.623 | 0.512 | 0.411 | 0.514 |
| Spongy parencchyma thickness | 0.412 | 0.605 | 0.395 | 0.422 | 0.458 |
| Midrib thickness | 0.333 | 0.620 | 0.582 | 0.299 | 0.459 |
| Midrib length | 0.548 | 0.594 | 0.499 | 0.531 | 0.543 |
| Midrib area | 0.540 | 0.666 | 0.506 | 0.540 | 0.563 |
| Midrib xylem thickness | 0.507 | 0.664 | 0.350 | 0.456 | 0.494 |
| Midrib xylem area | 0.694 | 0.663 | 0.633 | 0.771 | 0.690 |
| Vessel area | 0.517 | 0.652 | 0.624 | 0.440 | 0.558 |
| Number of vessel elements | 0.632 | 0.712 | 0.408 | 0.632 | 0.596 |
| Pot. specific stem conductivity | 0.867 | 0.852 | 0.679 | 0.900 | 0.825 |
| Mean Value | 0.437 ± 0.220 a | 0.548 ± 0.211 a | 0.444 ± 0.167 a | 0.464 ± 0.201 a | 0.473 ± 0.187 B |
Disclaimer/Publisher’s Note: The statements, opinions and data contained in all publications are solely those of the individual author(s) and contributor(s) and not of MDPI and/or the editor(s). MDPI and/or the editor(s) disclaim responsibility for any injury to people or property resulting from any ideas, methods, instructions or products referred to in the content. |
© 2024 by the authors. Licensee MDPI, Basel, Switzerland. This article is an open access article distributed under the terms and conditions of the Creative Commons Attribution (CC BY) license (https://creativecommons.org/licenses/by/4.0/).
Share and Cite
Pompelli, M.F.; Jarma-Orozco, A.; Jaraba-Navas, J.d.D.; Pineda-Rodriguez, Y.Y.; Rodríguez-Páez, L.A. Interannual Variation in Gas Exchange and Leaf Anatomy in Cenostigma pyramidale Is Exacerbated through El Niño and La Niña Climate Events. Forests 2024, 15, 346. https://doi.org/10.3390/f15020346
Pompelli MF, Jarma-Orozco A, Jaraba-Navas JdD, Pineda-Rodriguez YY, Rodríguez-Páez LA. Interannual Variation in Gas Exchange and Leaf Anatomy in Cenostigma pyramidale Is Exacerbated through El Niño and La Niña Climate Events. Forests. 2024; 15(2):346. https://doi.org/10.3390/f15020346
Chicago/Turabian StylePompelli, Marcelo F., Alfredo Jarma-Orozco, Juan de Dios Jaraba-Navas, Yirlis Yadeth Pineda-Rodriguez, and Luis Alfonso Rodríguez-Páez. 2024. "Interannual Variation in Gas Exchange and Leaf Anatomy in Cenostigma pyramidale Is Exacerbated through El Niño and La Niña Climate Events" Forests 15, no. 2: 346. https://doi.org/10.3390/f15020346