Article

Mountain Taiga in a Warming Climate: Contrast of Siberian Pine Growth along an Elevation Gradient

by
Viacheslav I. Kharuk
1,2,3,*,
Il’ya A. Petrov
1,2,3,
Alexey S. Golyukov
1,2,3,
Sergei T. Im
1,2,3,4 and
Alexander S. Shushpanov
1,3,4
1
Sukachev Institute of Forests, Federal Scientific Center, Russian Academy of Science, Siberian Branch, Academgorodok 50/28, Krasnoyarsk 660036, Russia
2
Institute of Space and Information Technologies, Institute of Ecology and Geography, Siberian Federal University, Svobodny Str. 79, Krasnoyarsk 660041, Russia
3
Laboratory of Biodiversity and Ecology, Tomsk State University, Lenina Str. 36, Tomsk 634050, Russia
4
Institute of Space Research and High Technologies, Reshetnev Siberian State University of Science and Technology, Krasnoyarsky Rabochy Str. 31, Krasnoyarsk 660014, Russia
*
Author to whom correspondence should be addressed.
Forests 2024, 15(1), 50; https://doi.org/10.3390/f15010050
Submission received: 30 October 2023 / Revised: 14 December 2023 / Accepted: 22 December 2023 / Published: 26 December 2023
(This article belongs to the Special Issue Spatial Distribution and Growth Dynamics of Tree Species)

Abstract

:
The growth and survival of trees in the Siberian Mountains are experiencing a strong influence on climate warming. We analyzed Siberian pine (SP, Pinus sibirica) growth within the treeline ecotone in high (>1000 m) and low (<900 m) lands. We used ground surveys, dendrochronology, and climate variable data analysis. We found a contrasting response of SP growth with increasing air temperature and moisture parameters along the elevation gradient. In the treeline ecotone and highlands, the tree’s growth has been increasing since warming onset in the 1970s, whereas in the lowlands, the initial growth increase switched to a growth drop since the beginning of the 2000s, with a consequent partial mortality of the Siberian pine forest caused by warming-driven water stress in combination with bark borers’ attacks. This mortality suggests the retraction of the Siberian pine range in the lowlands of the Siberian Mountains. The projected drought increase will likely lead to the substitution of Siberian pine with drought-tolerant species. The tree’s growth index (GI) dependence on air temperature and moisture variables includes two phases. In the first phase (since the warming onset in the 1970s), the trees’ GI was positively correlated with elevated temperature, whereas correlations with precipitation and soil moisture were negative. During the second phase (since the increase in warming in the 2000s), negative correlations between the GI and moisture variables switched to positive ones. The correlations of the GI with air temperature switched from positive to mostly insignificant. The wind’s influence on the trees’ growth changed from negative to insignificant since the 2000s within all elevation belts. Afforestation within the areas of Siberian pine mortality should not be based on the planting of Siberian pine but on drought-tolerant species such as larch (Larix sibirica) and Scots pine (Pinus sylvestris).

1. Introduction

Current climate change leads to both positive and negative consequences in the Siberian taiga. Warming, together with droughts, caused an increase in fire frequency and area burned (mostly in larch-dominant communities growing in the zone of permafrost) as well as an increase in the tree’s water stress and pest-outbreaks frequency with consequent conifer species mortality. An increased burning rate, together with biotic-caused mortality of trees, leads to potential changes in the conifers range within its southern margins [1]. Alongside that, an increase in the growth of tree species has been observed, and a northward and uphill migration of conifer species (Siberian pine, Pinus sibirica Du Tour, Larix spp.) was documented, as well as a general increase in gross and net primary productivity within the Siberian forests and forest-tundra zones [2,3,4,5,6].
In general, warming and droughts are driving conifer species decline and mortality observed within the complete boreal biome [7]. Conifers’ decreased survival and increased mortality were described within North America [8,9,10], Western and Eastern Europe [11,12,13,14], and Russia [6,15].
Among the principal causes of that phenomenon, multi-year low precipitation and root-zone drying [16,17] in combination with increasing adverse insect attacks [18,19] are considered. Together, the warming-driven activation of biotic stressors is seen as a factor in the increased mortality of trees [20].
In Siberia, the “dark-needle conifers” part of the taiga forests (i.e., composed of Siberian pine, Du Tour., fir, Abies sibirica Ledeb. and spruce, Picea obovata Ledeb.) has experienced a decrease in trees’ survival and an increase in trees’ mortality since the 1990s. Periodic large-scale outbreaks of defoliators (mostly Dendrolimus sibiricus Tschetv. in 1990–1994 and 2014–2018 in combination with bark borers (e.g., Monochamus urussovi (Fischer, 1806)) attacks caused coniferous mortality on 0.7–1.0 million ha [6].
Dark-needle conifers’ increasing mortality and decline in recent decades have been observed in the Siberian taiga. The latest high-scale pest outbreak (caused by bark-borer Polygraphus proximus Blandford was dated 2014–2018 and led to fir-dominant forest mortality in an area of about 700,000 ha [6].
The weakening of trees due to water stress caused bark beetle outbreaks; the latter was the result of increased climate aridity together with periodic acute droughts. The spatial pattern of trees’ mortality is related to topographic features; in particular, mortality is mostly associated with convex south-facing slopes [6]. However, there are no reports about the adverse influence of warming and drought on the “light-needle” forests (composed of Pinus sylvestris L. and Larix spp.) except for increasing fire rate, whereas vast mortality of similar pine species was documented in the southern European and North American forests [8,13,17,19].
The conservation of forests composed of Siberian pine (hereafter SP) is the focus of ecologists, forest service, and communities of people. Siberian pine is one of the main taiga-forming tree species. These taiga forests are the habitat of many animal species, such as bears, sables, elks, etc. They are also a source of valuable wood and nuts. Siberian pine harvesting is regulated at the governmental level. Siberian pine forests are also an essential part of the natural heritage and areas of recreation and hunting. The SP is a zoochoric “five-needle pine” species with a life span of around 400–500 years and height and diameter up to 35 m and up to 1.5 m, correspondingly. The Siberian pine is mainly found within mixed forests together with fir and spruce (so-called “dark needle conifers” (DNC) forests. The DNC is the second (after the larch-dominant communities) largest forest formation in Siberia.
The Siberian pine grows both on plains and on mountains. The range of this species spreads from the Mongolian forest-steppes to the northern latitudes. The SP is a less cold-resistant tree in comparison with larch (Larix sibirica Ledeb., L. gmelinii Rupr.). However, it can be found beyond the Polar Circle. In the mountains, the SP, fir, and spruce form the so-called “black belt” in the mountains (within elevations of 400–2400 m). The SP, together with Larix sp. and fir, form the treeline ecotone in the mountains. Within this ecotone, SP is often found in mat, prostrate, and stunted (krummholz) forms due to continual exposure to fierce, freezing winds [8]. The upper elevation limit for SP is up to 2400+ m. Because that species is moisture-sensitive and intolerant to low air humidity, it preferably occupies high-moisture areas (with precipitation up to 1000+ mm/year) but can survive in areas with lower (about 500 mm/year) precipitation. Due to relatively humid conditions in the habitat of Siberian pine, these forests burn less often in comparison with larch-dominant communities, although in the years of extreme drought, burned areas may exceed a million ha [21]. Thus, different parts of the SP range, including different elevation belts in the mountains, are associated with different environmental limitations, and the response of SP growth and survival to a warming climate may not be uniform.
In this study, we aimed to analyze the SP growth and survival within different elevation belts of the Kuznets Ala-Tau Mountains, which are the typical areas of Siberian pine habitat. In the mountains, thermal, moisture, and wind gradients are mediated by elevation. We applied combined on-ground studies along the elevation transects, dendrochronological analysis of the trees’ radial growth index (GI), and GI dependence on the eco-climate variables (air temperature, precipitation, soil moisture, air drought indexes and vapor pressure deficit, wind speed). We consider growth index dynamics as a proxy of tree vigor, as well as a predictor of potential decline and mortality of trees. We hypothesize that the response of the SP growth and survival to changing climate is significantly different along the elevation gradient. We suggest that warming may switch the limitation of trees’ growth from temperature to the limitation of moisture.
We aim to answer the following questions:
  • How does SP growth respond to changes in thermal and moisture regimes along the elevation gradient?
  • Does climate warming switch the limitation of trees’ growth by temperature to the limitation by moisture?
  • Does the survival of SP differ within different elevation belts?

2. Materials and Methods
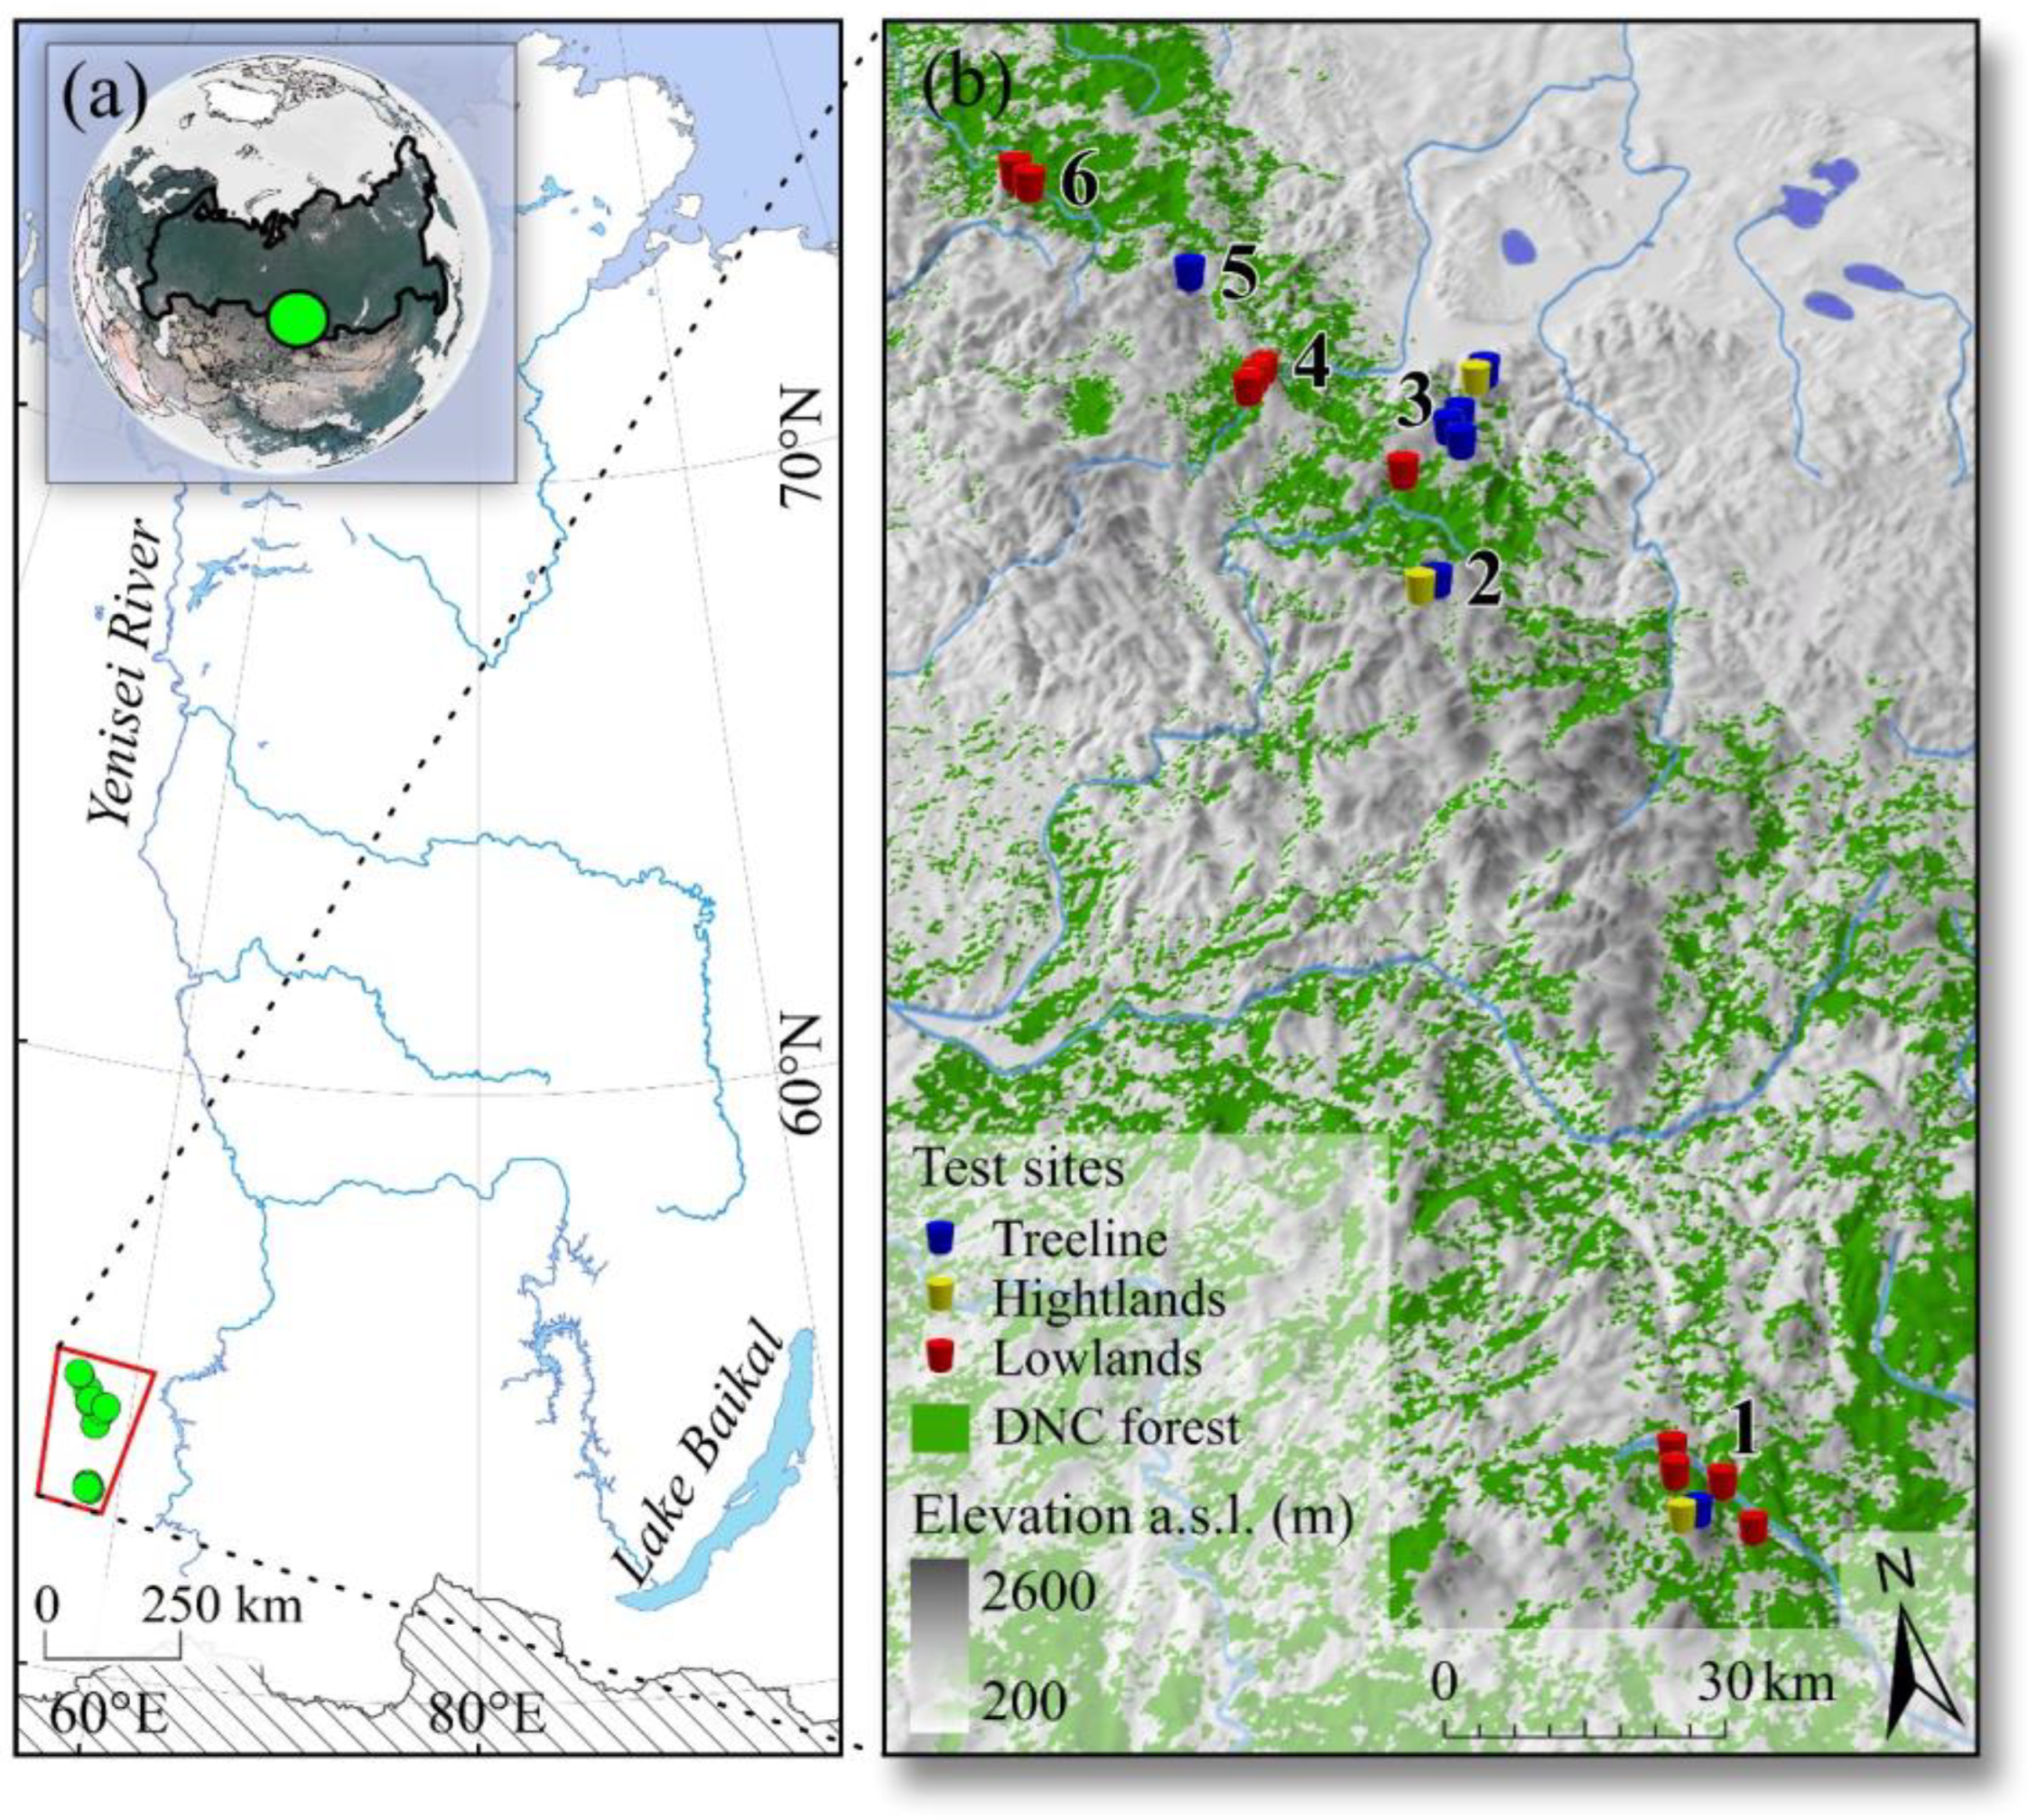
This study is based on ground survey, dendrochronology, and eco-climate variable analysis.

2.1. The Study Area

The study area is located within the Kuznets Ala-Tau Mountains, which are composed of several ridges with elevations of about 1000–1600 m; the maximum elevation is 2178 m. Mountains spread northward for about 300 km (Figure 1). Tundra communities occur mostly at elevations > 1350 m. The subalpine belt (1100–1350 m) is composed of meadows, shrubs, and sparse trees (Betula tortuosa Ledeb., Larix sibirica Ledeb. Pinus sibirica Du Tour and Abies sibirica). The middle elevations (600–1100 m) are occupied by mixed Siberian pine taiga with a small proportion of spruce; that is the so-called “dark needle conifers” belt. Elevations below 600 m are occupied mostly by SP, larch, Scotch pine (Pinus sylvestris L.), and birch (Betula pendula Roth). Patches of steppe communities are located on steep south-east slopes up to 500–600 m. Within the study area, the mean air temperatures in January and July are −18 °C and +14 °C, respectively. The mean annual precipitation is about 980 mm, which occurs mostly during the summer and fall (570 mm) (data averaged for 1970–2022).

2.2. Climate Variables

Monthly air temperature, precipitation, and soil moisture (0–28 cm depth) were obtained from the ERA5-Land dataset at a spatial resolution of 0.1° × 0.1° (https://cds.climate.copernicus.eu/cdsapp (accessed on 15 September 2023)). To analyze air drought, we used the drought index SPEI (the Standardized Precipitation Evapotranspiration Index), self-calibrating Palmer Drought Severity Index (sc-PDSI), and vapor pressure deficit (VPD) values. The SPEI monthly values were obtained from the Global Drought Monitor (https://spei.csic.es/map/maps.html (accessed on 15 September 2023)) at a spatial resolution of 1° × 1°. The SPEI is defined as the difference between total precipitation and potential evapotranspiration. The sc-PDSI monthly data were obtained from the CRU TS 4.06 database at a spatial resolution of 0.5° × 0.5° (https://crudata.uea.ac.uk/cru/data/drought/ (accessed on 15 September 2023)). The VPD data were calculated based on the ERA5-Land data (monthly air temperature, dew point temperature, and surface pressure) using the R-library (plantecophys v1.4-6) and the RStudio (version 2023.03.1, https://www.rstudio.com (accessed on 10 May 2023)). Wind speed monthly data were obtained from the nearest meteorological station (Nenastnaya, WMO # 29752; 54°8′ N/88°8′ E).

2.3. On-the-Ground Studies

We have established 38 test sites (TS) within the elevations of the treeline ecotone (>1400 m), highlands (>1000 m), and lowlands (<900 m) (Figure 1, Table 1). Each TS had a radius of 9.8 m. Within each TS, heights and diameters of trees at DBH level (h = 1.3 m) were measured for trees with heights > 2.5 m. Forest type, species composition, canopy closure, tree mortality, ground cover, soil type, and relief features (exposure, slope steepness, elevation) were determined. Within TS with insect infestations, we collected larvae, caterpillars, and imago for in-lab analysis. We randomly sampled wood cores at the DBH level using the Pressler borer. Cores of at least 20 trees were sampled around the center point of each TS within an area of about 0.5 ha. For TS located on slopes, cores were taken within the ±10 m elevation range around the center point of TS. The abundance of dead trees was determined within each TS.

2.4. Dendrochronological Analysis

For dendrochronological analysis, we used cores obtained from Siberian pine trees during fieldwork in 2012–2022. In total, 773 wood samples from dead and alive trees were collected and analyzed. Cores and disks were finely sanded and treated with contrast powder to enhance the visualization of the tree ring boundaries. Tree cores were glued onto a wooden backing. The measurements were carried out on the LINTAB-6 platform with an accuracy of 0.01 mm. The quality of cross-dating and measurement accuracy of tree-ring series was estimated by TSAP [22] and COFECHA 6.02 software (https://www.ldeo.columbia.edu/tree-ring-laboratory/resources/software, accessed on 6 February 2023) [23].
Seventeen separate tree ring chronologies were developed for different elevation belts: treeline ecotone, highlands (>1000 m), and lowlands (<900 m). Chronologies included 110, 262, and 401 samples for treeline, highlands, and lowlands, correspondingly. Within lowland sites, trees were divided into ‘decliners’ (n = 259) and ‘survivors’ (n = 142) cohorts, i.e., trees with stable decreasing and increasing growth rates, correspondingly.
Tree ring chronologies were developed using ARSTAN 6.02 software (https://www.ldeo.columbia.edu/tree-ring-laboratory/resources/software, accessed on 6 February 2023) [24]. To reduce the effect of long-term trends unrelated to the eco-climate variables, raw time series of the radial increment (in mm) were fitted with an exponential or negative linear trend line (age-related growth trend curve) and converted into a unitless growth index (GI) time series with the average of 1.0 by Equation (1) [25]:
G I t = R t [ m m ] G t [ m m ]
where GIt is the GI in the t-th year; Rt is the tree ring width measured in mm; Gt is a value of an age-related growth trend (in mm), calculated in the ARSTAN program by standard dendrochronological techniques and presented by exponential or negative linear trend line. The age-related growth trend curve was calculated for each individual tree-ring chronology by standard dendrochronological technique [25].
In statistical analysis, we used Spearman’s correlations, Statsoft Statistica v13.3, and Microsoft Excel software 2021 (https://www.statistica.com (accessed on 15 September 2023) and https://www.microsoft.com/ru-ru/microsoft-365/excel (accessed on 15 September 2023)). The piecewise regression analysis was used for the identification of the “breakpoints” in the GI chronologies [26].

3. Results

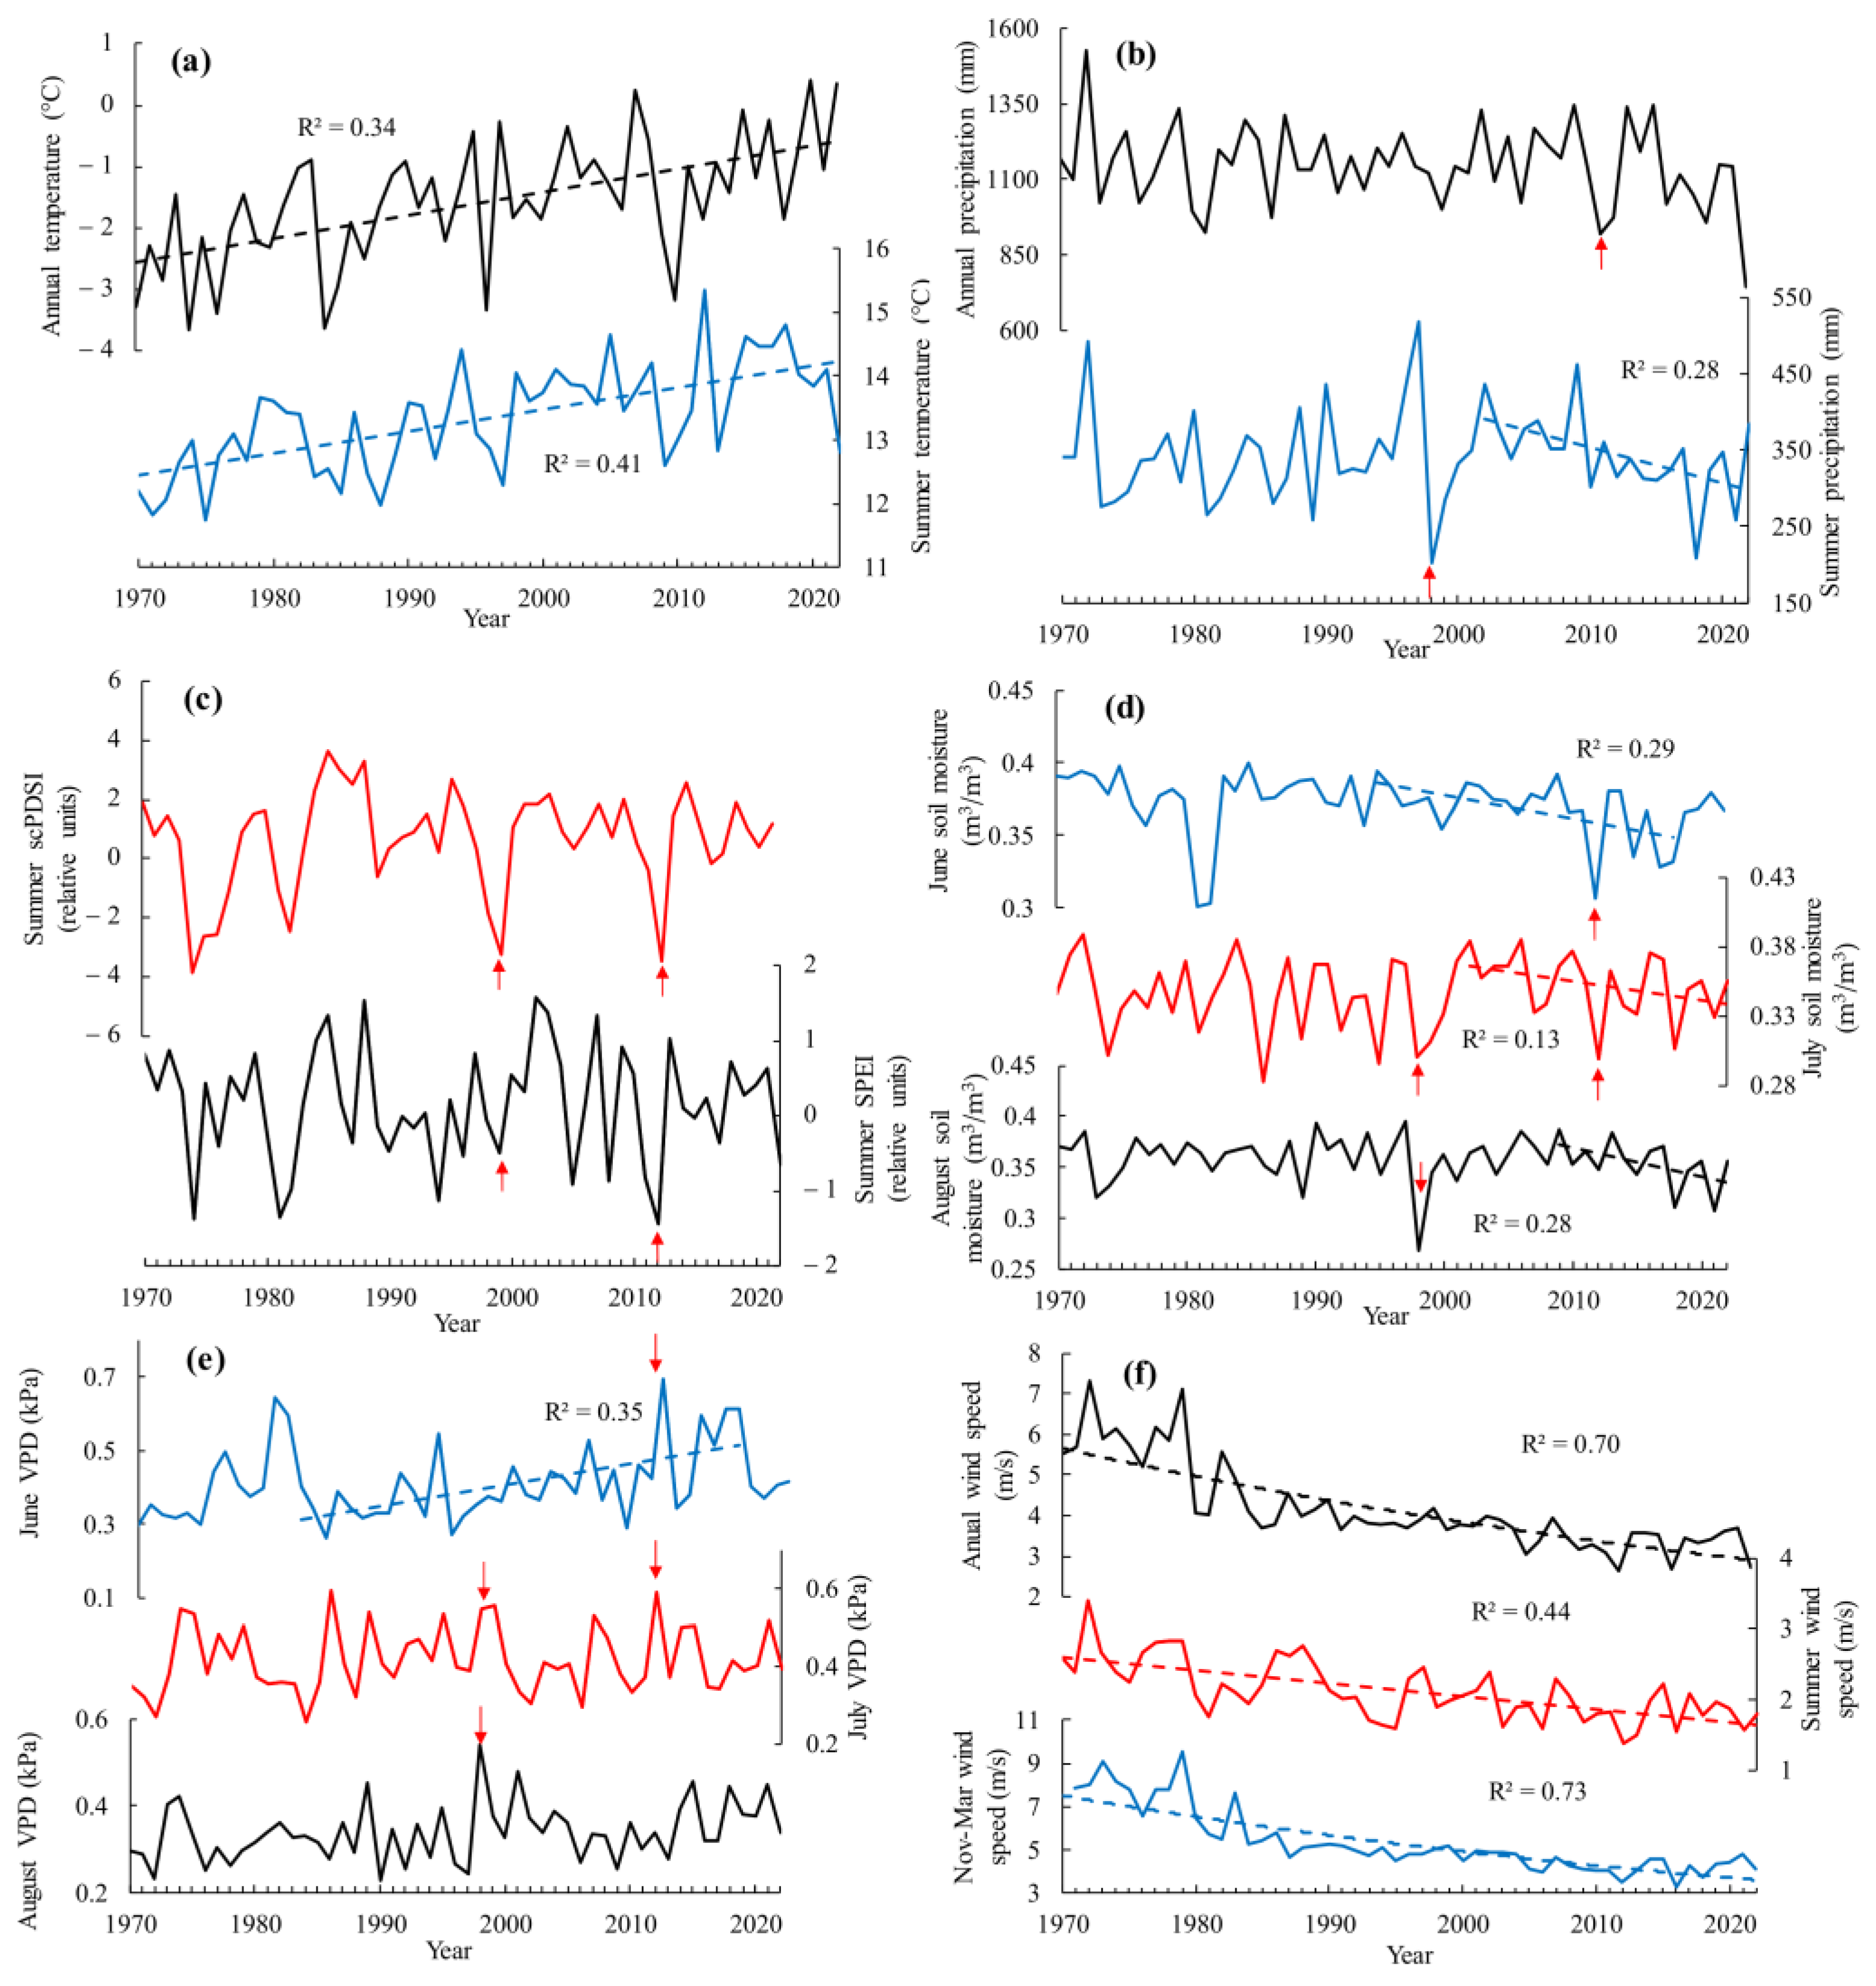
3.1. Climate Variables’ Dynamic

Air temperatures and VPD (June) have been increasing since the warming onset in the 1970s, whereas summer precipitation and soil moisture have been decreasing since ca. 2000 (Figure 2a,b,d). Air dryness (indicated by VPD) has been increasing since the mid-1980s, while the Palmer (sc-PDSI) and the SPEI drought indexes showed no significant trends (Figure 2e). As data analysis showed (Section 3.3), VPD is a more informative variable in comparison with sc-PDSI and SPEI. Therefore, we used VPD only as an indicator of atmospheric dryness. Acute air and soil dryness occurred in 1985, 1998, and 2012. A notable continuous decrease in wind speed (including a harmful “cold period”, i.e., November–March; Figure 2f). That indicated a decrease in the negative effect of winter desiccation on the trees.

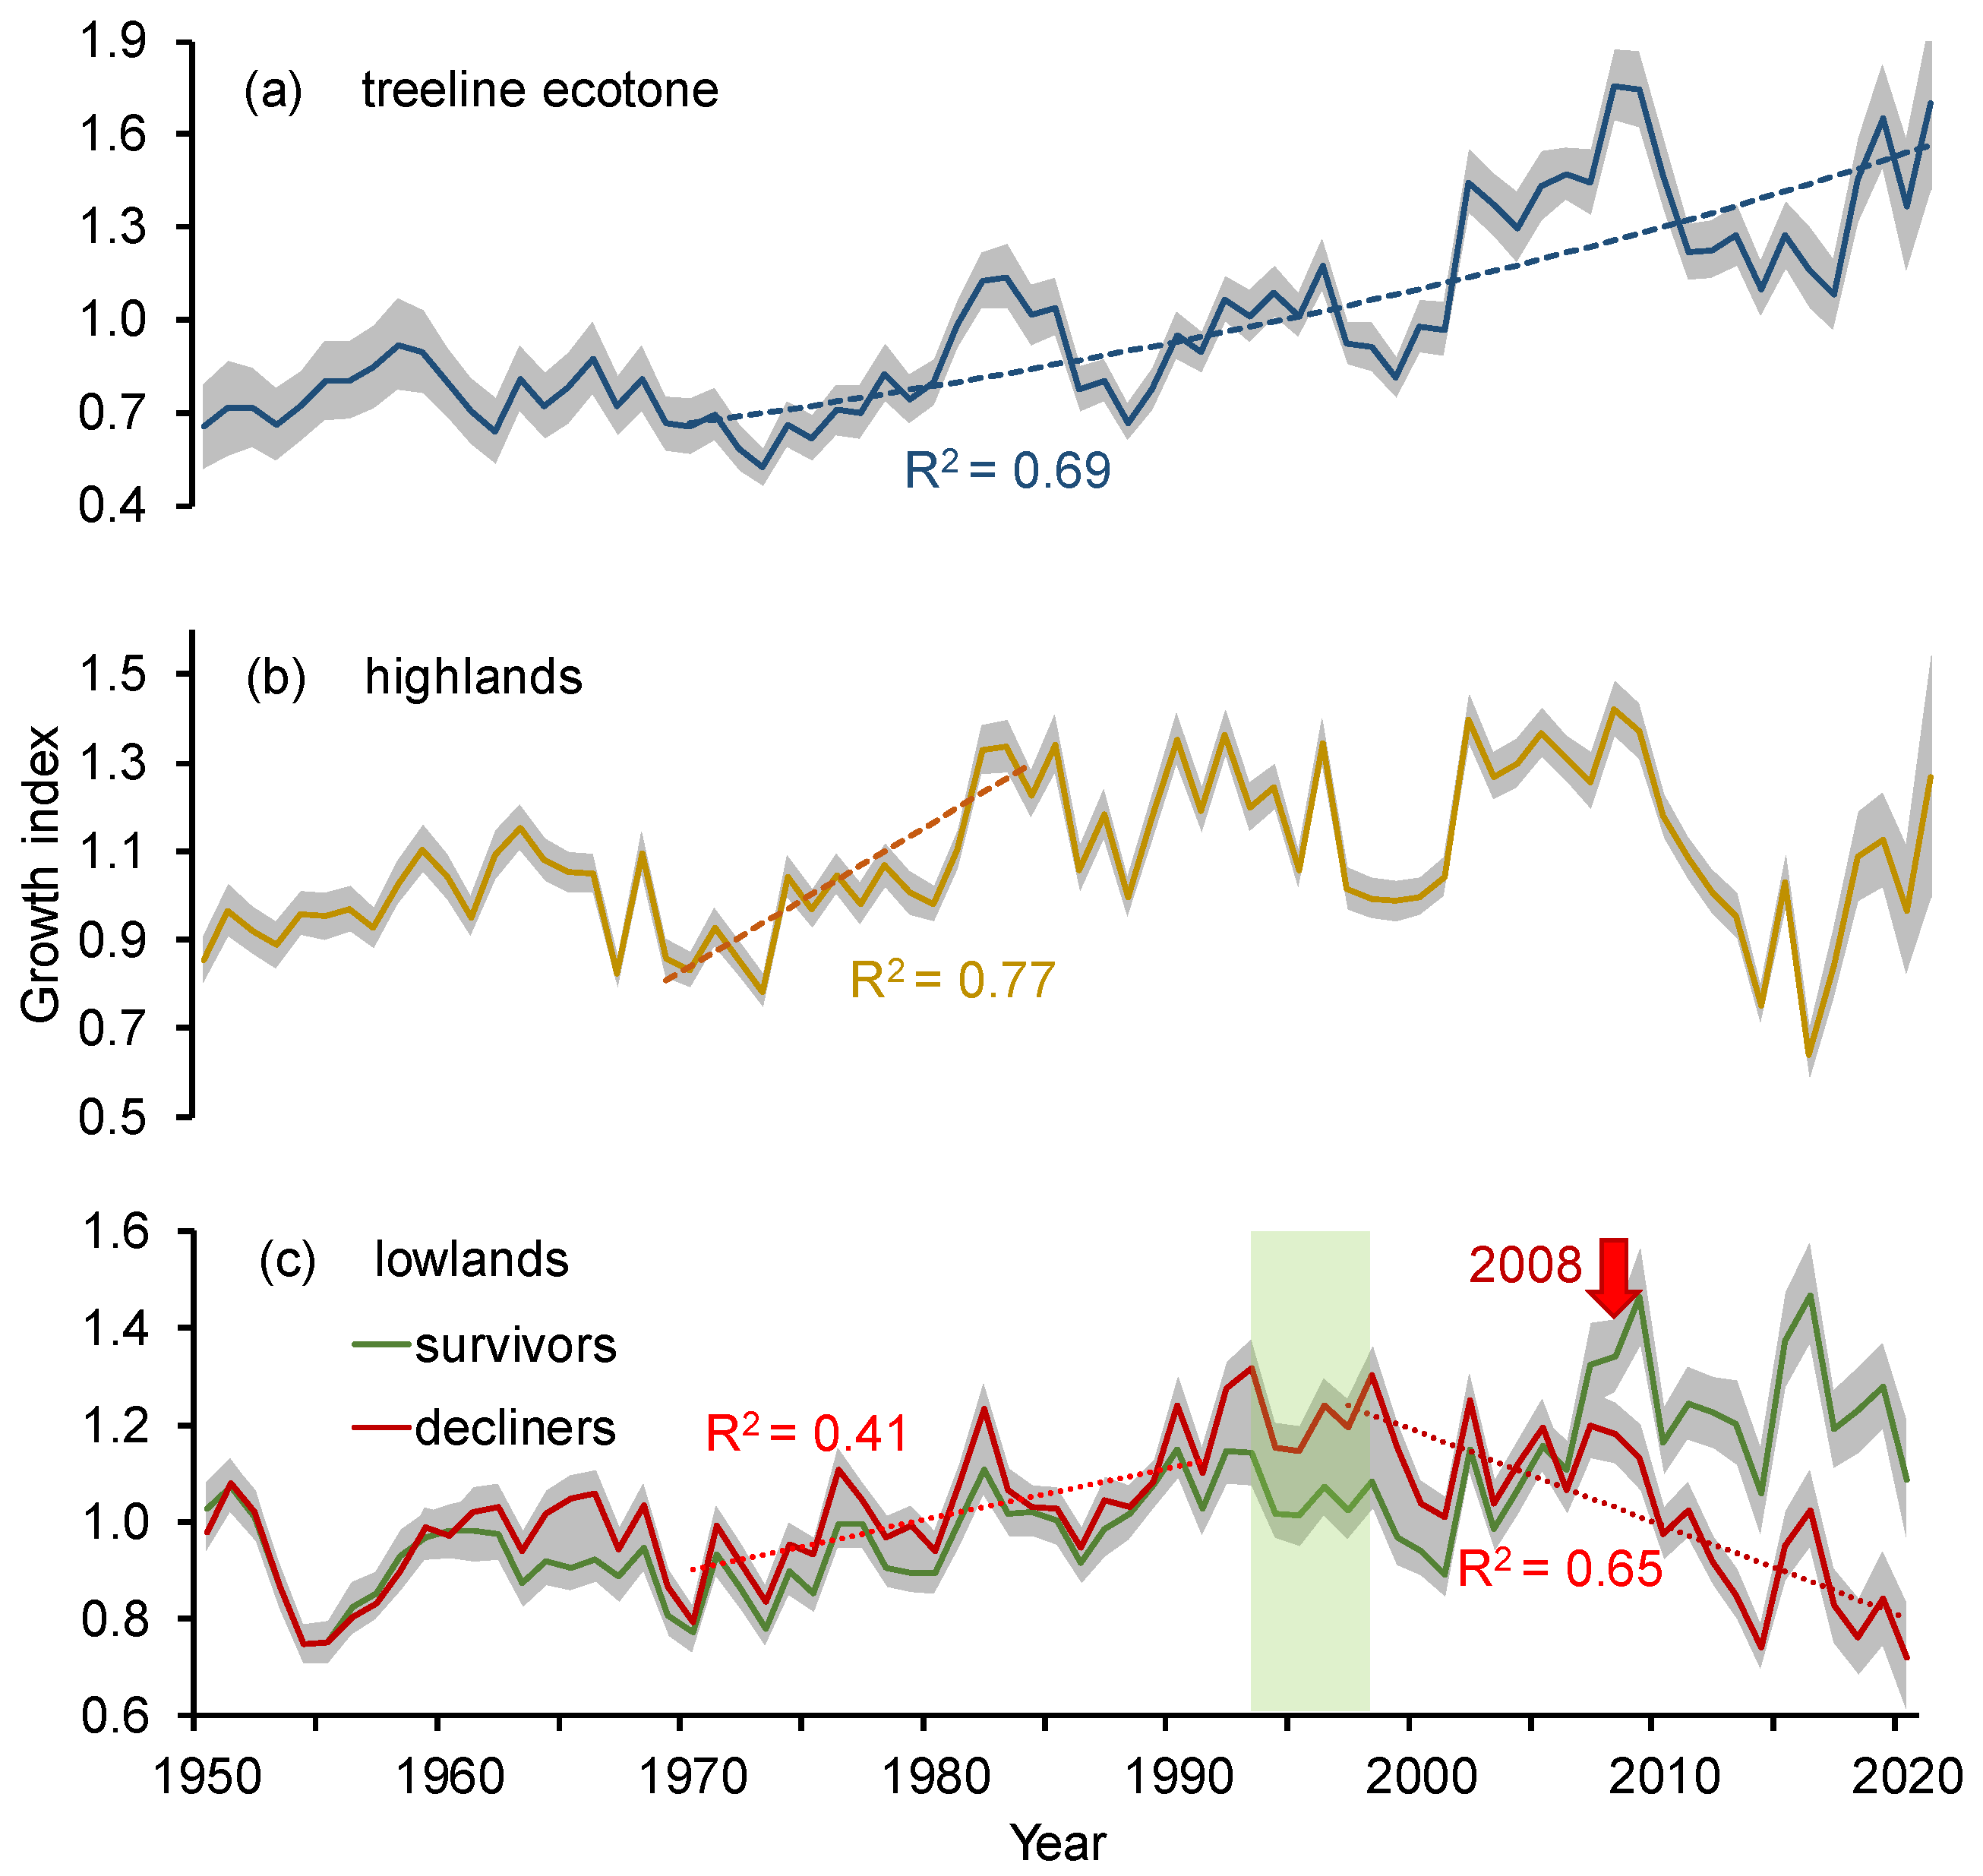
3.2. Siberian Pine Growth Dynamic along the Elevation Gradient

Since the warming onset, the tree’s growth index has been increasing within all elevation belts, i.e., lowlands, highlands, and treeline ecotone. Within the treeline ecotone, Siberian pine growth indicates an increasing trend throughout time intervals since the 1970s (Figure 3a). Within the highlands, growth increase during 1970–1985 turned to fluctuations until about 2010 with a consequent growth drop. Meanwhile, during the last four years, the GI has been increasing again (Figure 3). Within the lowlands, an increase in atmospheric dryness (VPD, Figure 2e) together with acute droughts in 1985, 1998, and 2012 triggered a split of trees’ population into “decliners” and “survivors” cohorts, i.e., trees with decreasing and increasing growth trends. Warming-driven water stress, in combination with bark borers’ attacks (Ips sexdentatus (Boerner, 1776)), led to the partial mortality of the trees’ population. That divergence occurred during the “growth breakpoint” period 1993–1998 (marked by the green bar in Figure 3c). The growth index (GI) of the “decliners” cohort has been decreasing since 2000, whereas the GI of “survivors” has not decreased (Figure 3c). Notably, the acute drought in 1998 and 2012 also caused a temporal decrease in the growth of trees within the treeline ecotone and highlands (Figure 3a,b).

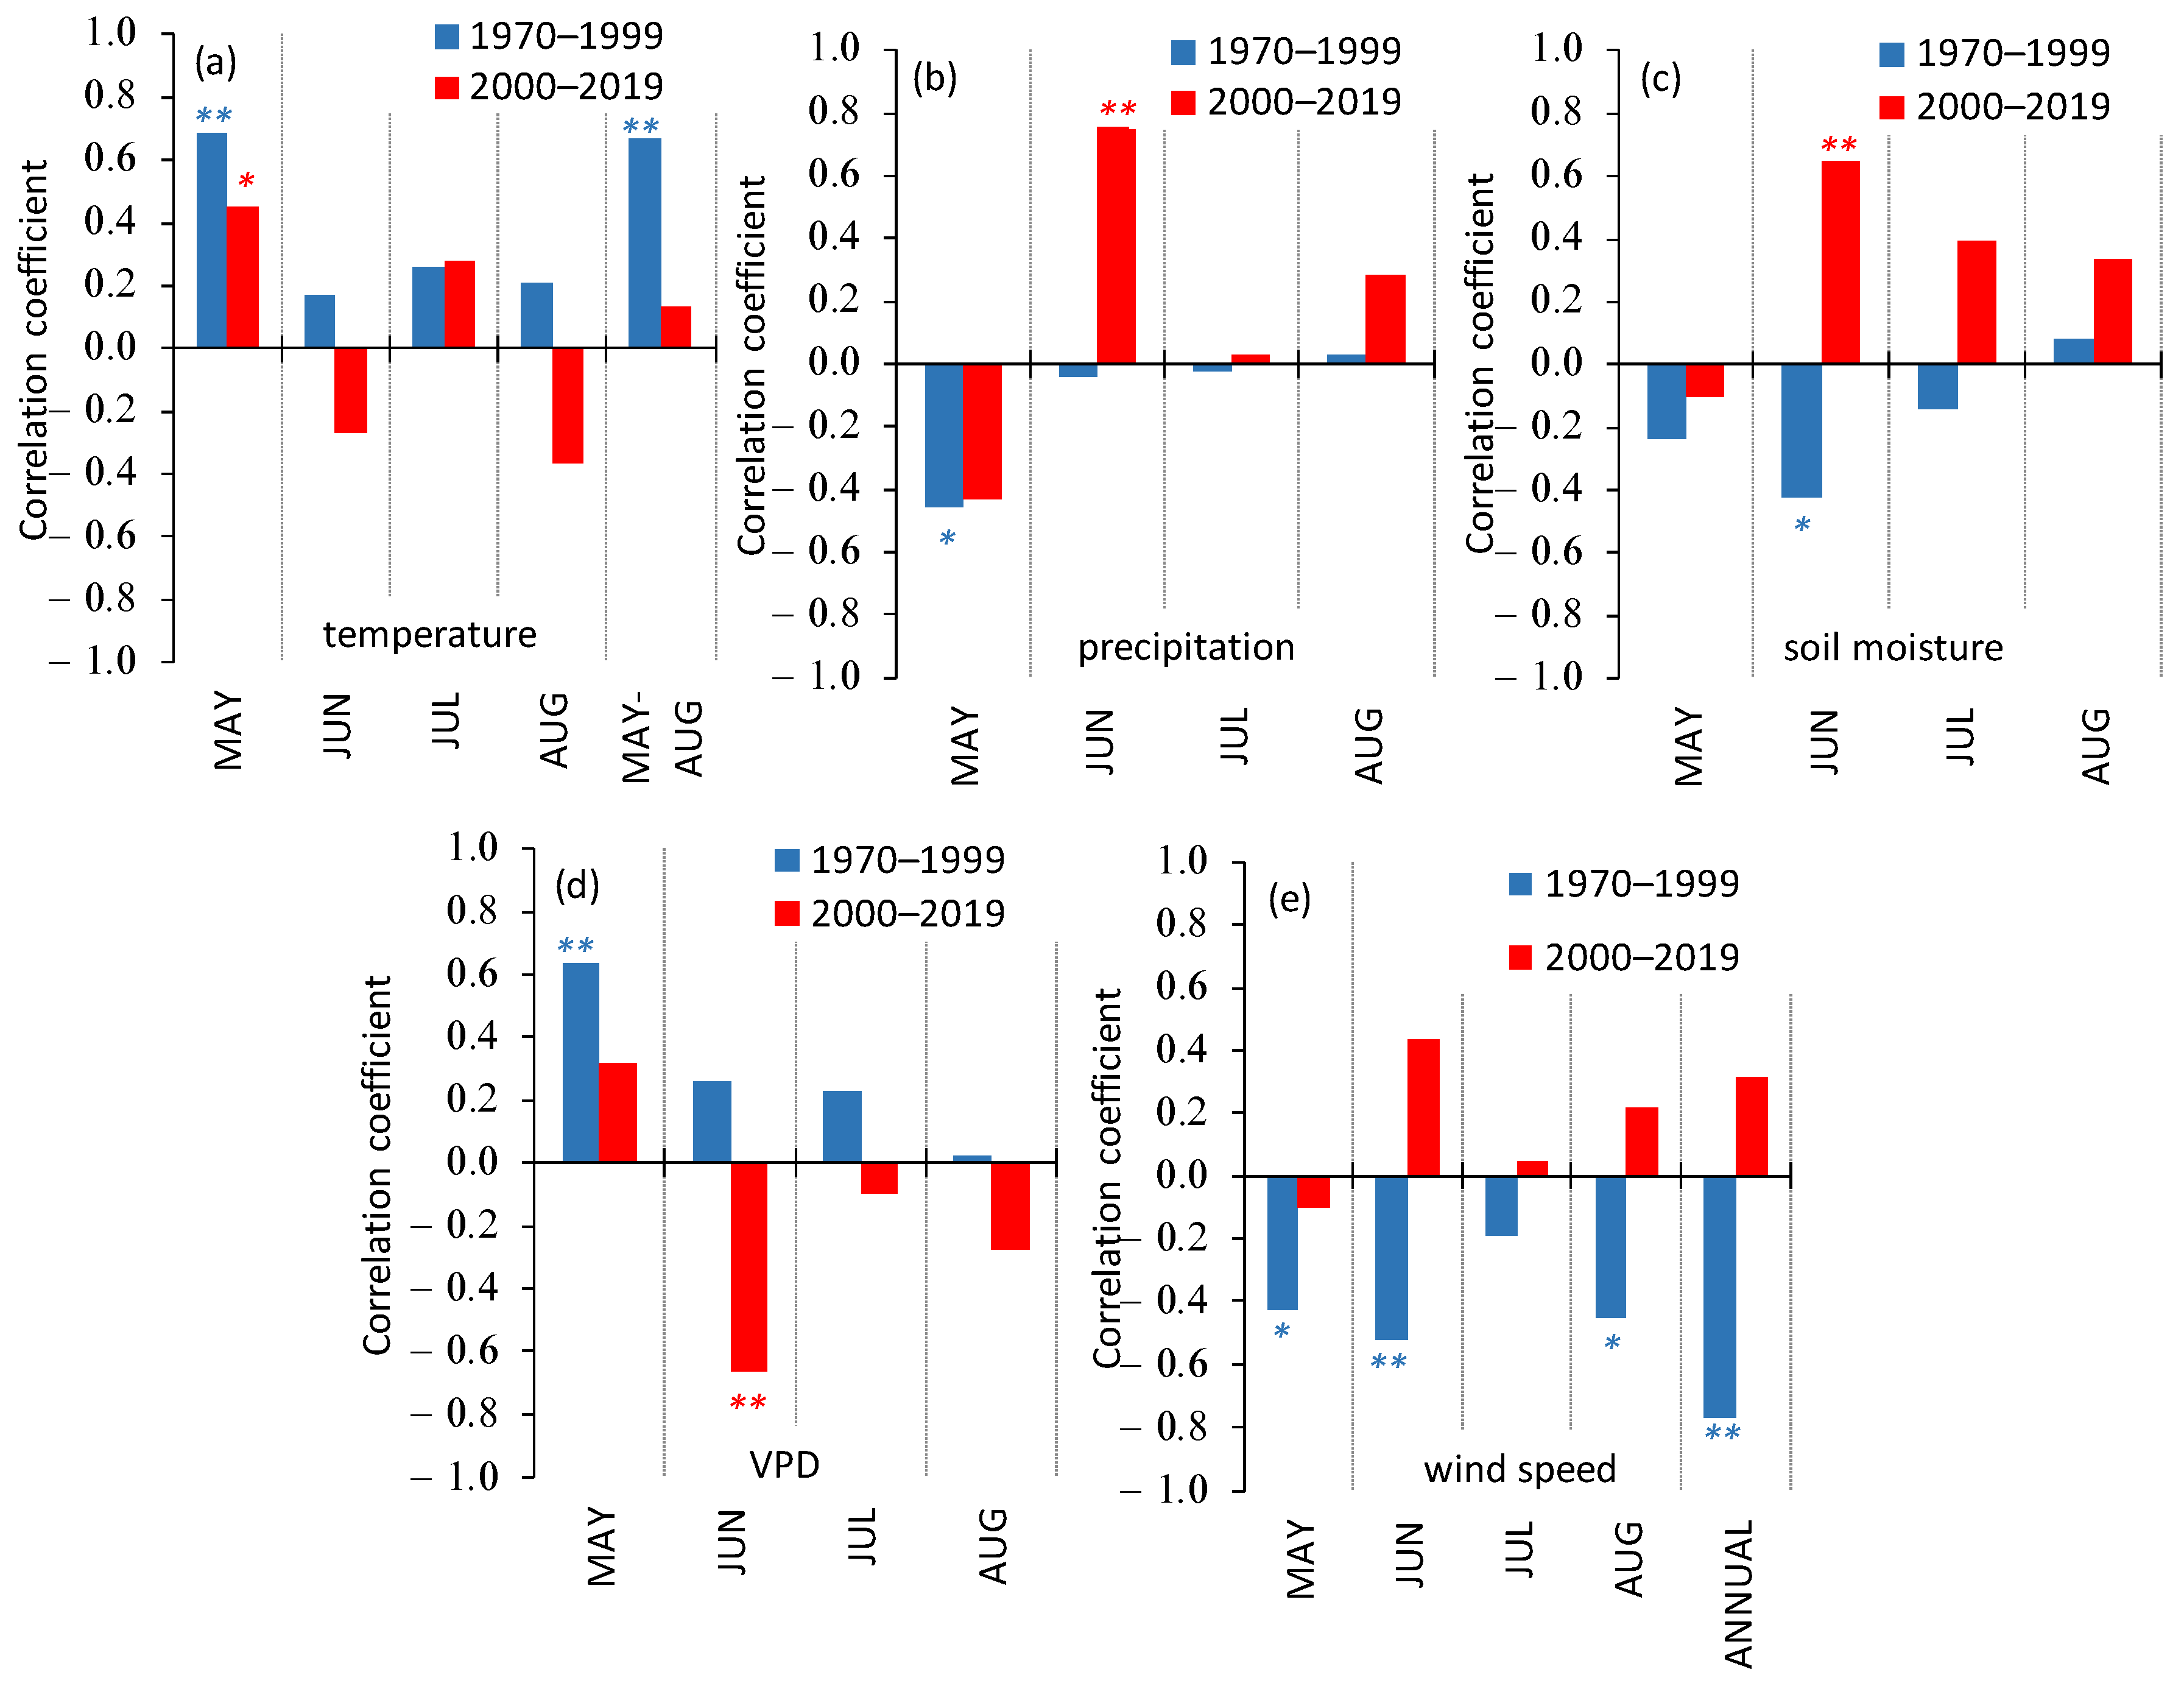
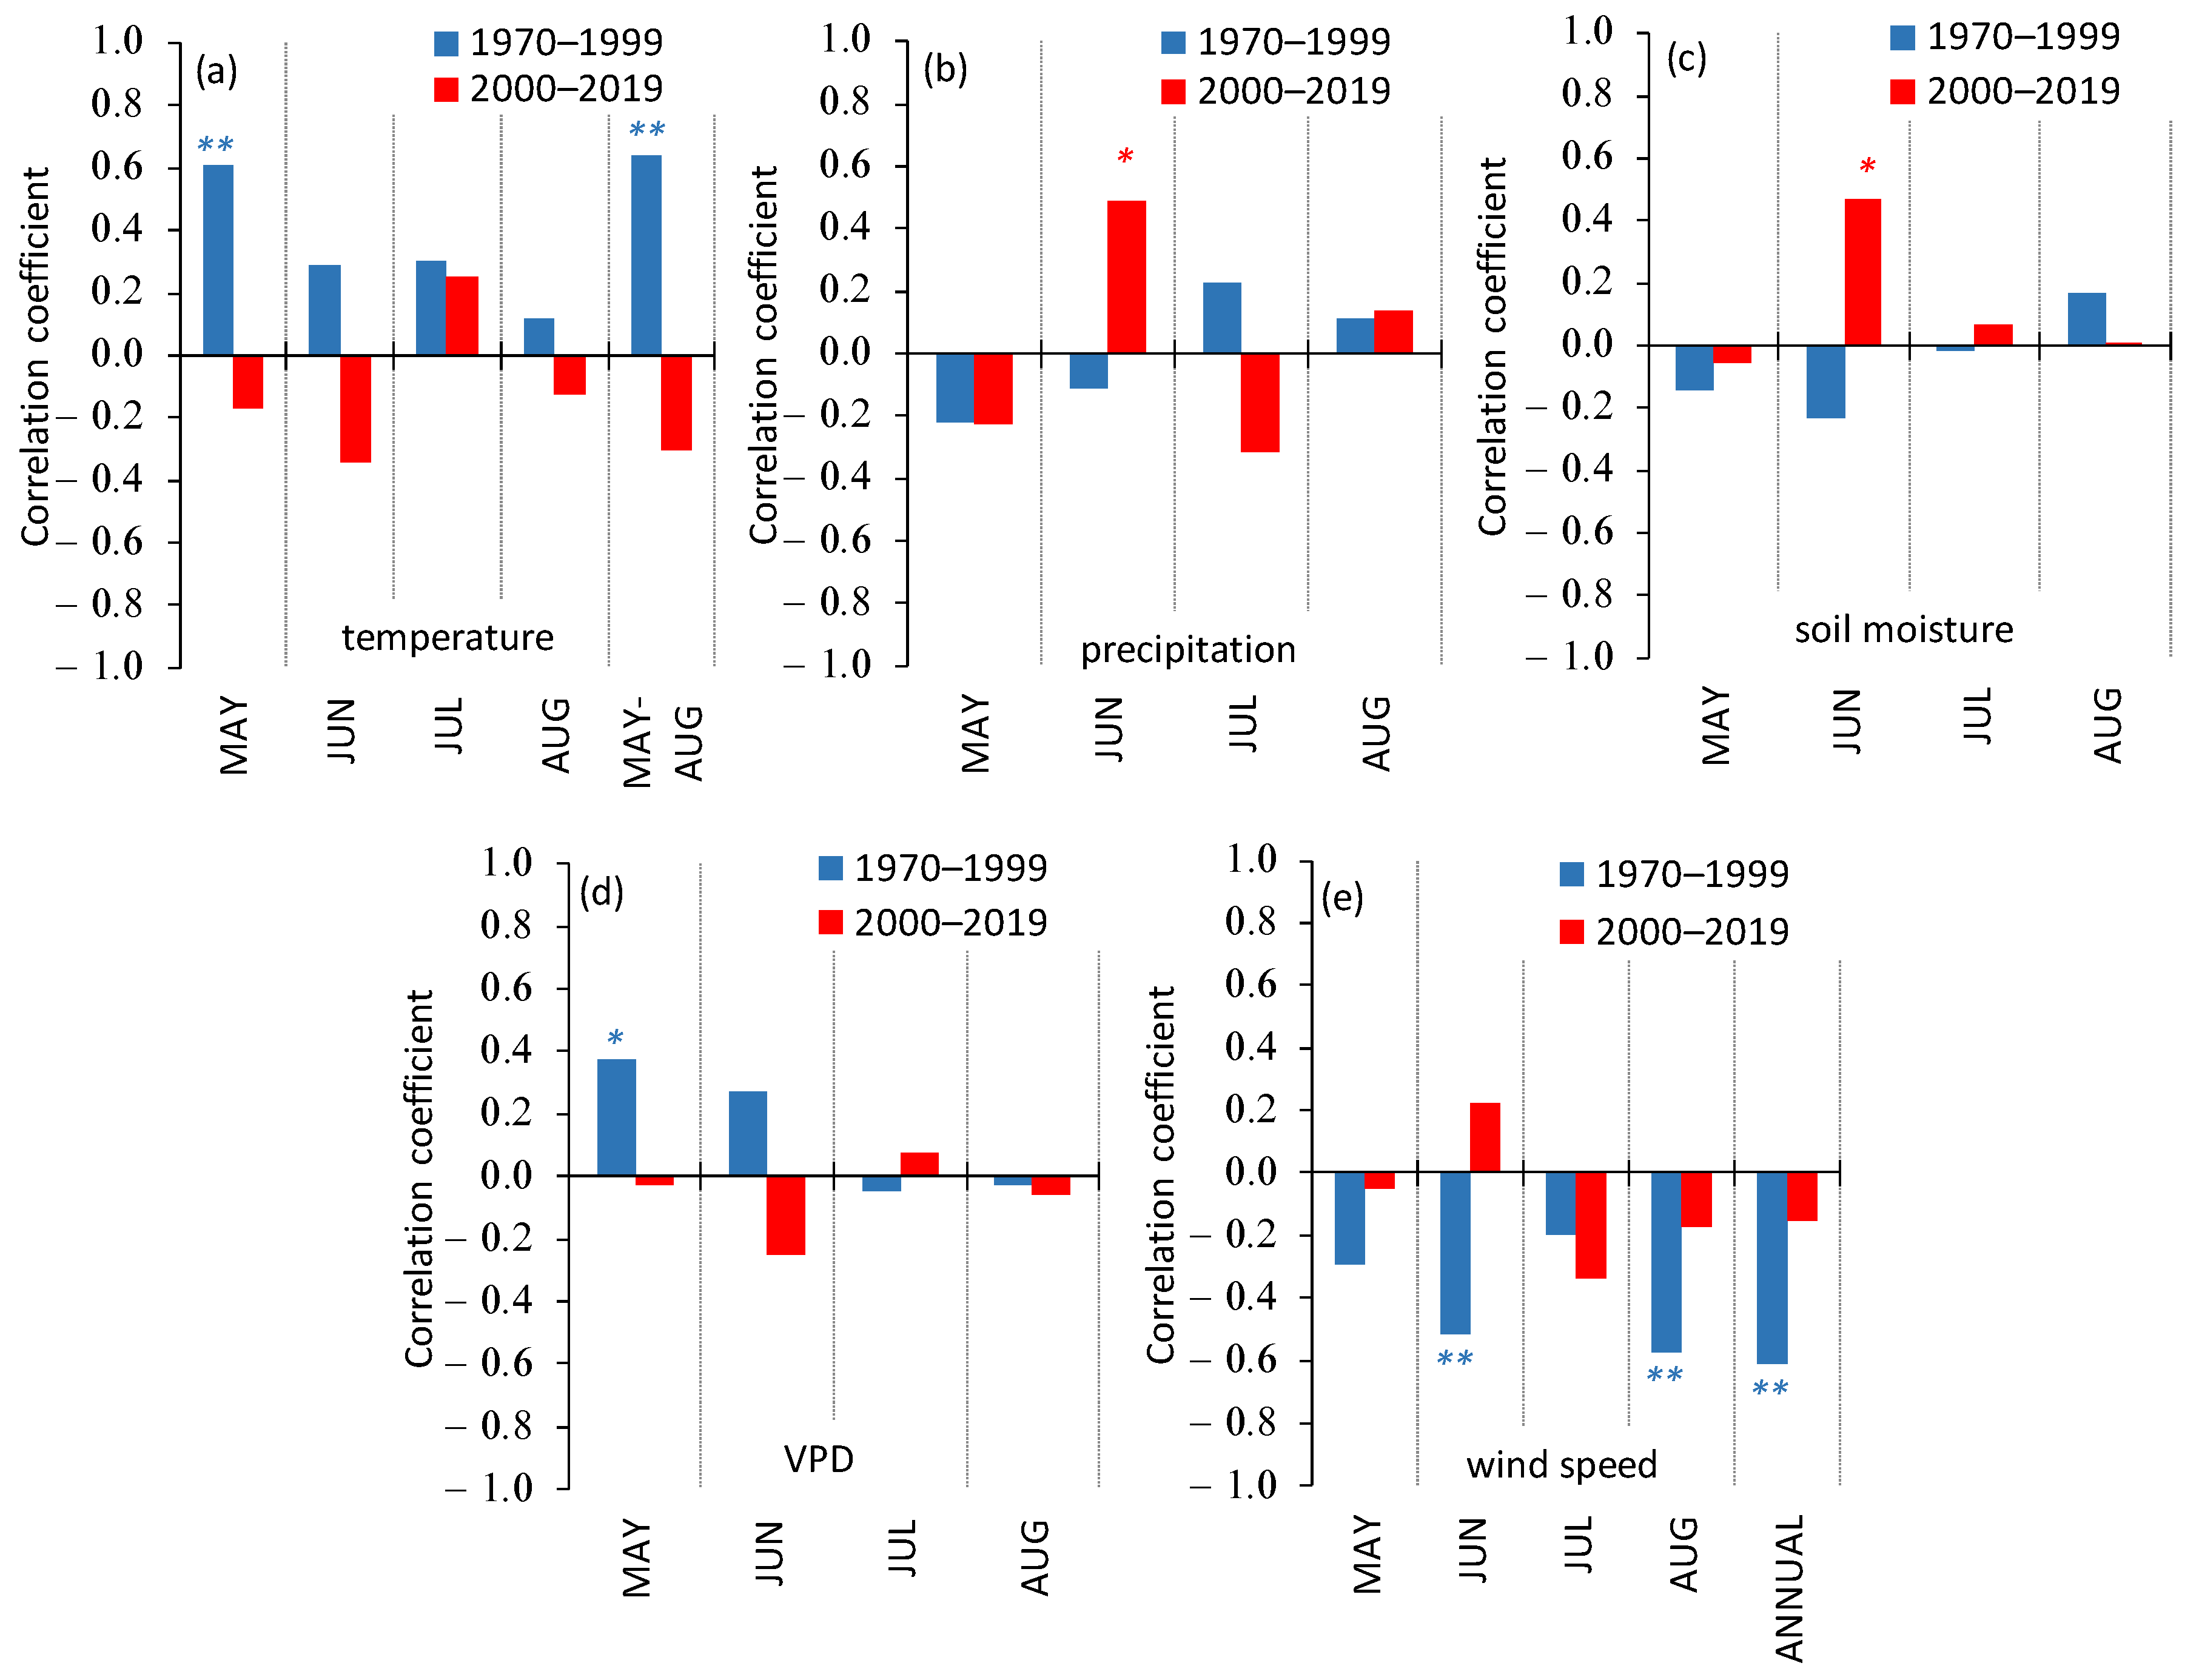
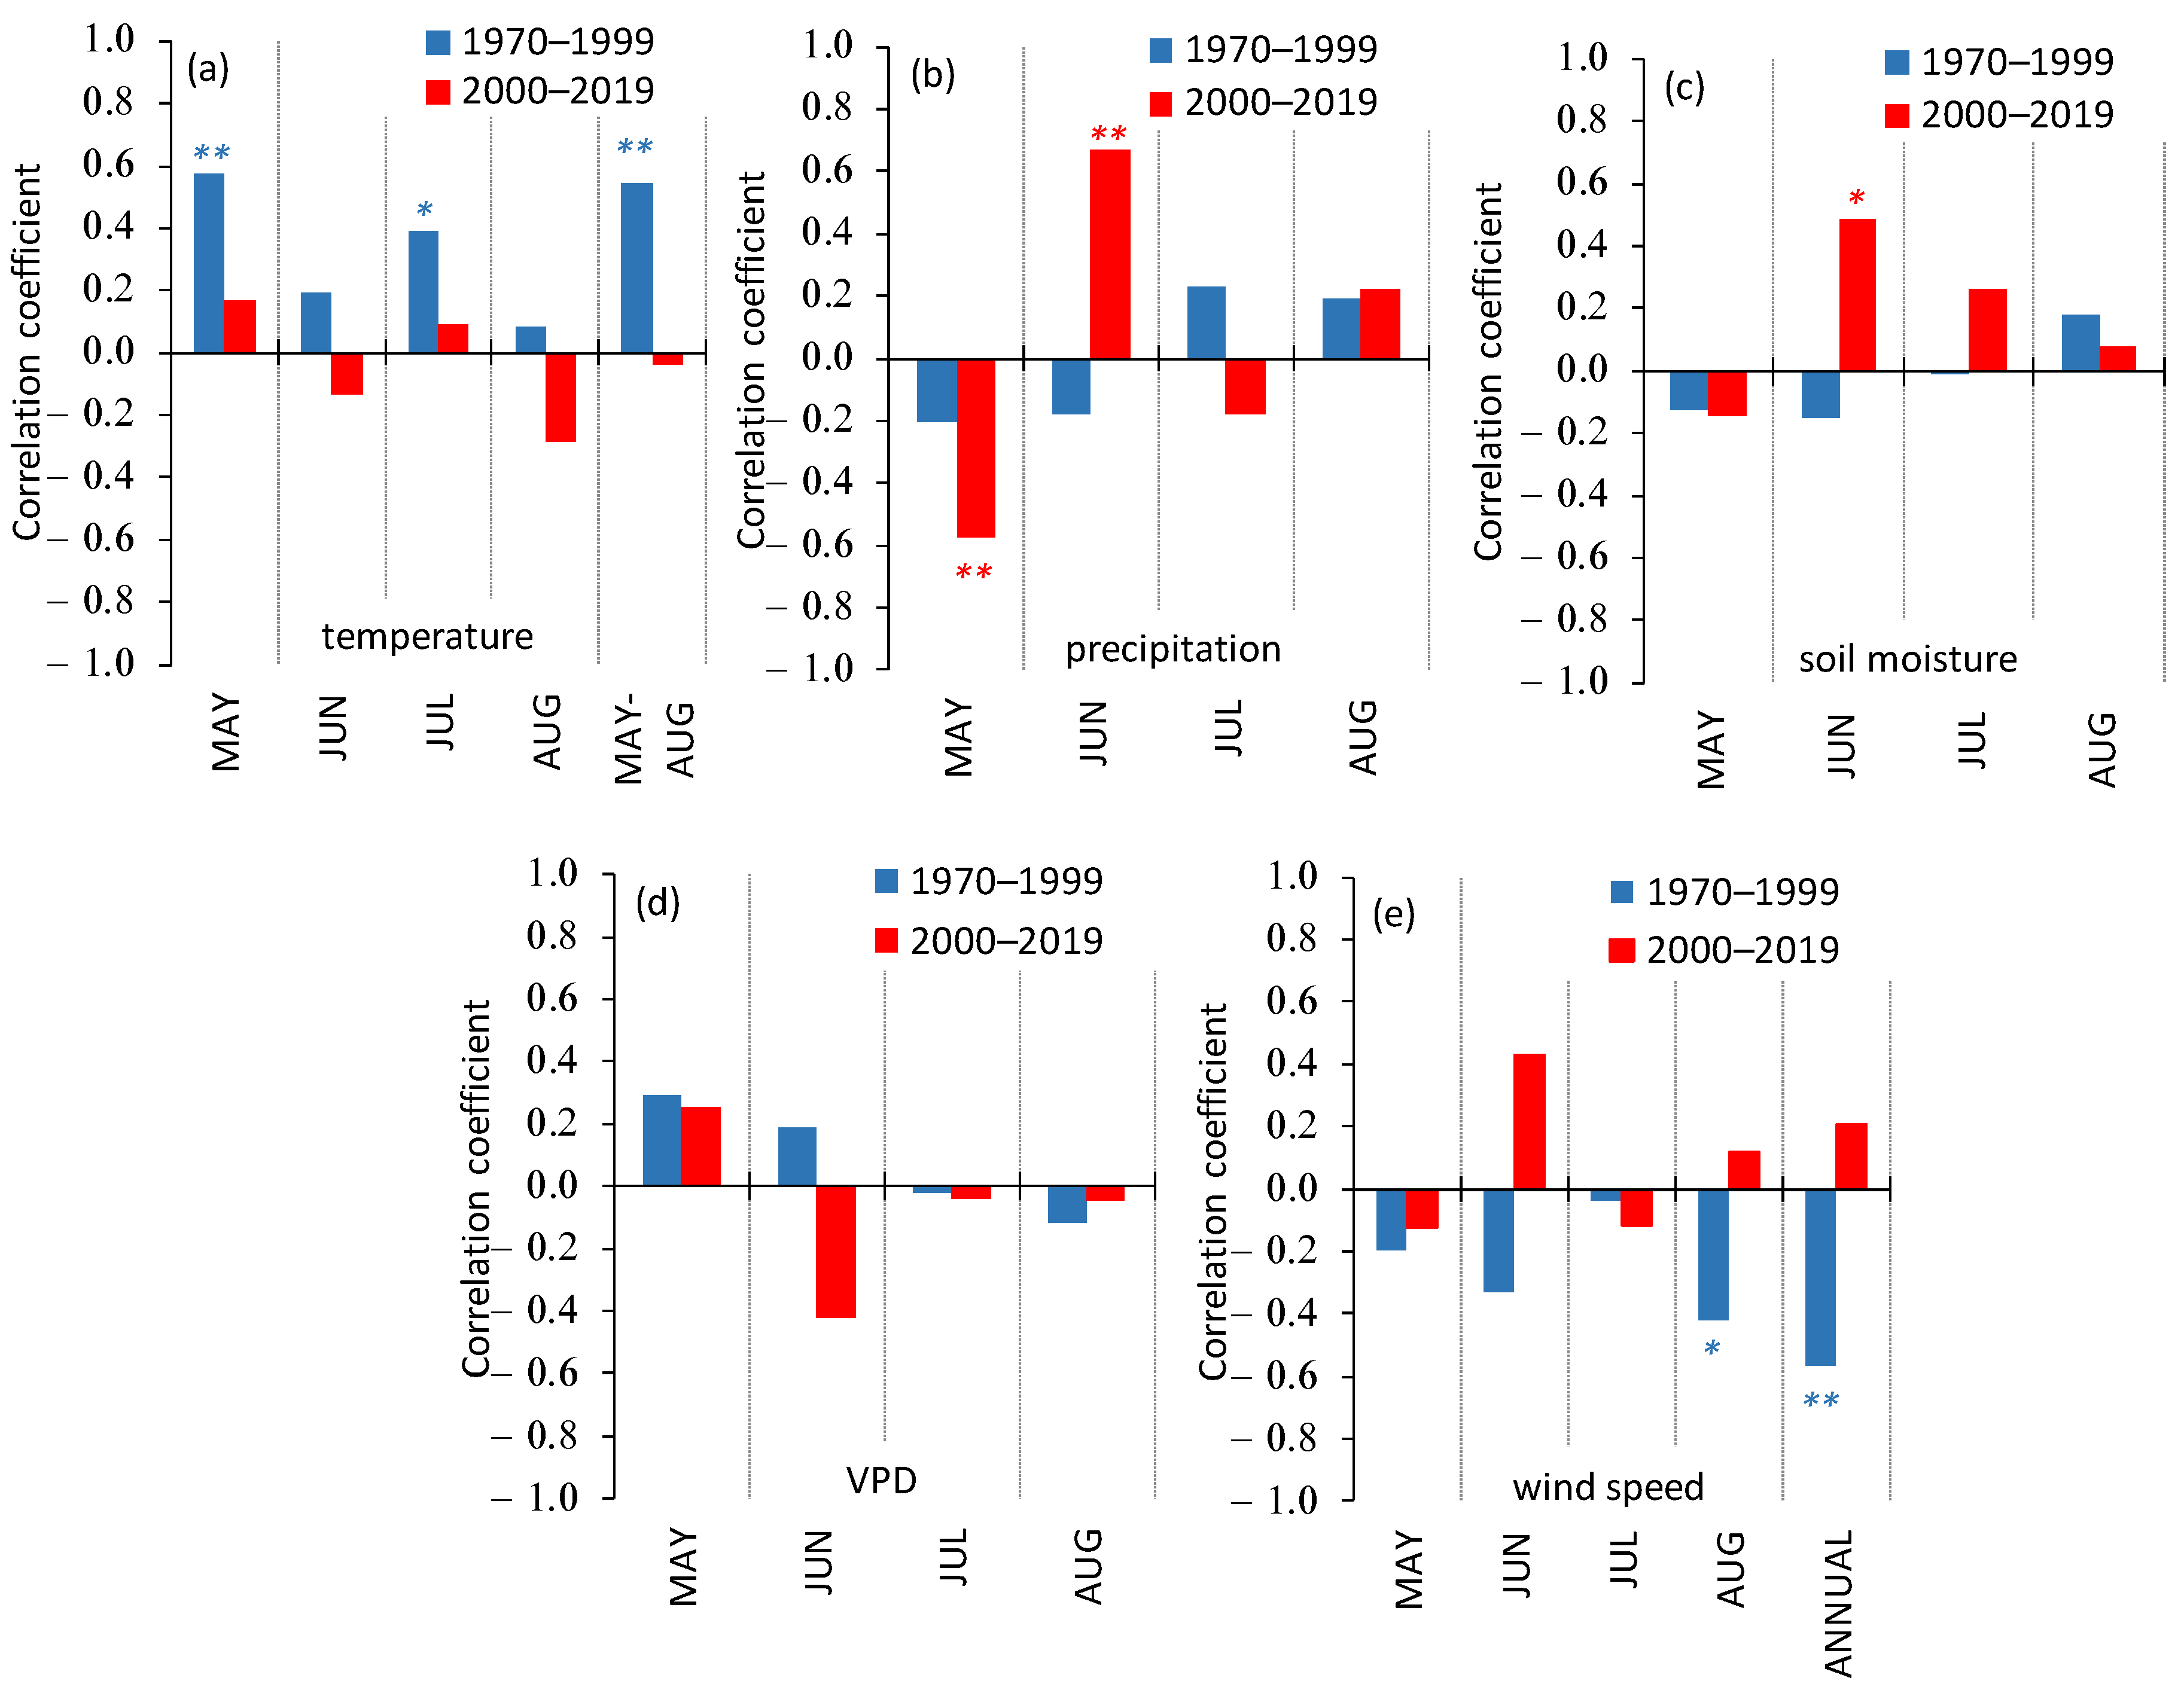
3.3. Siberian Pine Growth Dependence on Climate Variables

This section describes a comparative analysis of tree growth within various elevation belts. We focused on the growth analysis before the growth breakpoint (i.e., from the warming onset in 1970 until 1998) and since the growth decrease within the lowlands (since 2000). However, within the treeline ecotone and the highlands, breakpoints in growth were not obvious. For the comparative analysis, we used the same time intervals as the lowlands.
Since the warming onset, an increase in air temperature stimulated the growth of trees within elevation belts (Figure 4a, Figure 5a and Figure 6a). However, further warming led to atmospheric drying (vapor pressure deficit increase) and soil moisture decrease (Figure 2e,d), which led to a drop in the growth of trees within lowlands (with the “breakpoint period” around 1993–1998; Figure 3c). After this point in time, the growth trajectories of “decliners” and “survivors” diverged (Figure 4c). These data indicate that the breakpoint in growth was caused by a water stress increase. The increase in water stress along with insect attacks (mainly by bark borer Ips sexdentatus) resulted in partial mortality of the “decliners” cohort (Figure 7). Similar synergy, i.e., water stress and bark borer Polygraphus proximus, caused widespread fir mortality in Siberia in 2003–2020 [6].
Wind adverse influence was observed within elevation belts until the end of the 1990s (Figure 4e, Figure 5e and Figure 6e). Meanwhile, because of the persistent decrease in wind speed (Figure 2f), wind influence on growth became insignificant in the 2000s (Figure 4e, Figure 5e and Figure 6e).
Thus, after the “breakpoint period”, trees’ growth limitation by air temperature switched to limitation by moisture variables: precipitation, soil moisture, and (in lowlands) VPD. That switch occurred within all elevation belts, although the values of correlation coefficients were different. Growth dependence on moisture variables reached its maximum within the lowlands, whereas minimal values were observed within the treeline ecotone (Figure 4, Figure 5 and Figure 6).

4. Discussion

In the southern Siberian Mountains, the growth, decline, and mortality of Siberian pine were mediated by moisture, air temperature, and wind speed gradients. Dead and declining trees’ cohorts were located mostly at elevations below about 800 m, whereas trees in the treeline ecotone and the highlands showed increasing growth trends with no signs of population mortality.
Since the warming onset, an increase in air temperature stimulated the growth of Siberian pine until the breakpoint period around 1993–1999 (Figure 3c). At that time, warming also led to atmospheric drying and an increase in vapor pressure deficit. The following increase in temperature led to GI reduction via increased water stress at the beginning of the growth season. Such a persistent GI decrease regularly preceded potential trees’ mortality [27]. Consecutive water stress, together with acute droughts, split the Siberian pine population into “decliners” and “survivors” cohorts since the tipping point coincided with acute drought around 2008 (Figure 2). A similar effect was also reported for fir [6]. Both Siberian pine and Siberian fir are moisture-sensitive species and highly intolerant to atmospheric dryness. Because of that, these species are called “tree-of-fogs”. Similar to Siberian pine, fir is also decreasing its range within the southern Siberian lowlands, whereas in the highlands, fir, as well as Siberian pine, is climbing uphill and increasing in growth index [3]. It is notable that within the water-limited habitat, even such drought-tolerant species as larch (Larix sibirica, L. gmelinii) also split into “survivors” and “decliners” cohorts [28].
Mortality of trees was found mostly in areas with higher water stress risk. As shown earlier, tree mortality occurred mostly on the convex sunlit steep slopes, likely due to higher evapotranspiration and increased runoff [29]. Similarly, Stephenson et al. [29] found that the mortality of fir in US forests was mediated by water stress. Thus, after the growth index breakpoint (in 1998), the control of trees’ growth by air temperature switched to control by moisture variables (Figure 7), i.e., in the lowlands, further warming leads to atmospheric and soil dryness and water stress (mainly in June), which causes a consequent growth drop. Once trees had been weakened by water stress, insects (mostly Ips sexdentatus) increased their attacks on trees, which finally led to the mortality of trees. However, the growth of “survivors” increased, which may be partly attributed to decreased competition for water and nutrients. Pest outbreaks have not occurred within highlands and treeline due to lower air temperatures. In addition, Siberian pine trees at high elevations were not weakened by water stress, although trees may experience moderate seasonal water stress at the beginning of the growth period [6].
In the treeline ecotone and the highlands, trees are also experiencing water stress at the beginning of the growth season (June), when precipitation is insufficient and when enhanced evapotranspiration is combined with the limited water supply from partly frozen soil. However, the trees’ growth rate increased.
The wind’s influence on Siberian pine growth has dramatically changed due to a continuous decrease in wind speed throughout the study period (Figure 2f). Thus, the significant negative influence of winds on the trees’ growth within elevation belts until ca. 2000 turned later to insignificant (Figure 7). For the treeline ecotone, that observation was reported earlier for clusters of trees with closed aerodynamic-friendly crowns that smoothed winds’ influence, whereas for trees that are turning from prostrate to vertical, the wind’s influence on the trees’ growth was significant [3].
Since the tipping point in 2008, the “decliner’s” correlation with soil moisture became insignificant, whereas the “survivor’s” growth was controlled by moisture (R2 = 0.38). That should be attributed to the increase in insect infestation, which swamped the soil moisture influence on the GI. Similar observations were reported for Aleppo pines [30]. Notably, “survivors” were regularly found under the decliners’ canopy, although the mean age of both cohorts was rather similar (212 ± 8 and 228 ± 5 years, correspondingly). Thus, the upper canopy likely “buffered” air dryness and those partially protected survivors. A similar effect was reported for fir regeneration under the mother canopy in the case of combined water stress and insect (Polygraphus proximus) influence on the fir forests [7]. Microclimatic buffering of water stress was also described in the forests of northwestern US [31]. Concurrently, although “decliners” demonstrate a continuous decrease in growth, the growth rate of “survivors” is rather stable (Figure 2c). That may indicate the partial conservation of the Siberian pine population in the lowlands. However, the predicted increase in drought in the southern boreal forests [32] should lead to a further recession of the Siberian pine range in the southern Siberian lowlands.

5. Conclusions

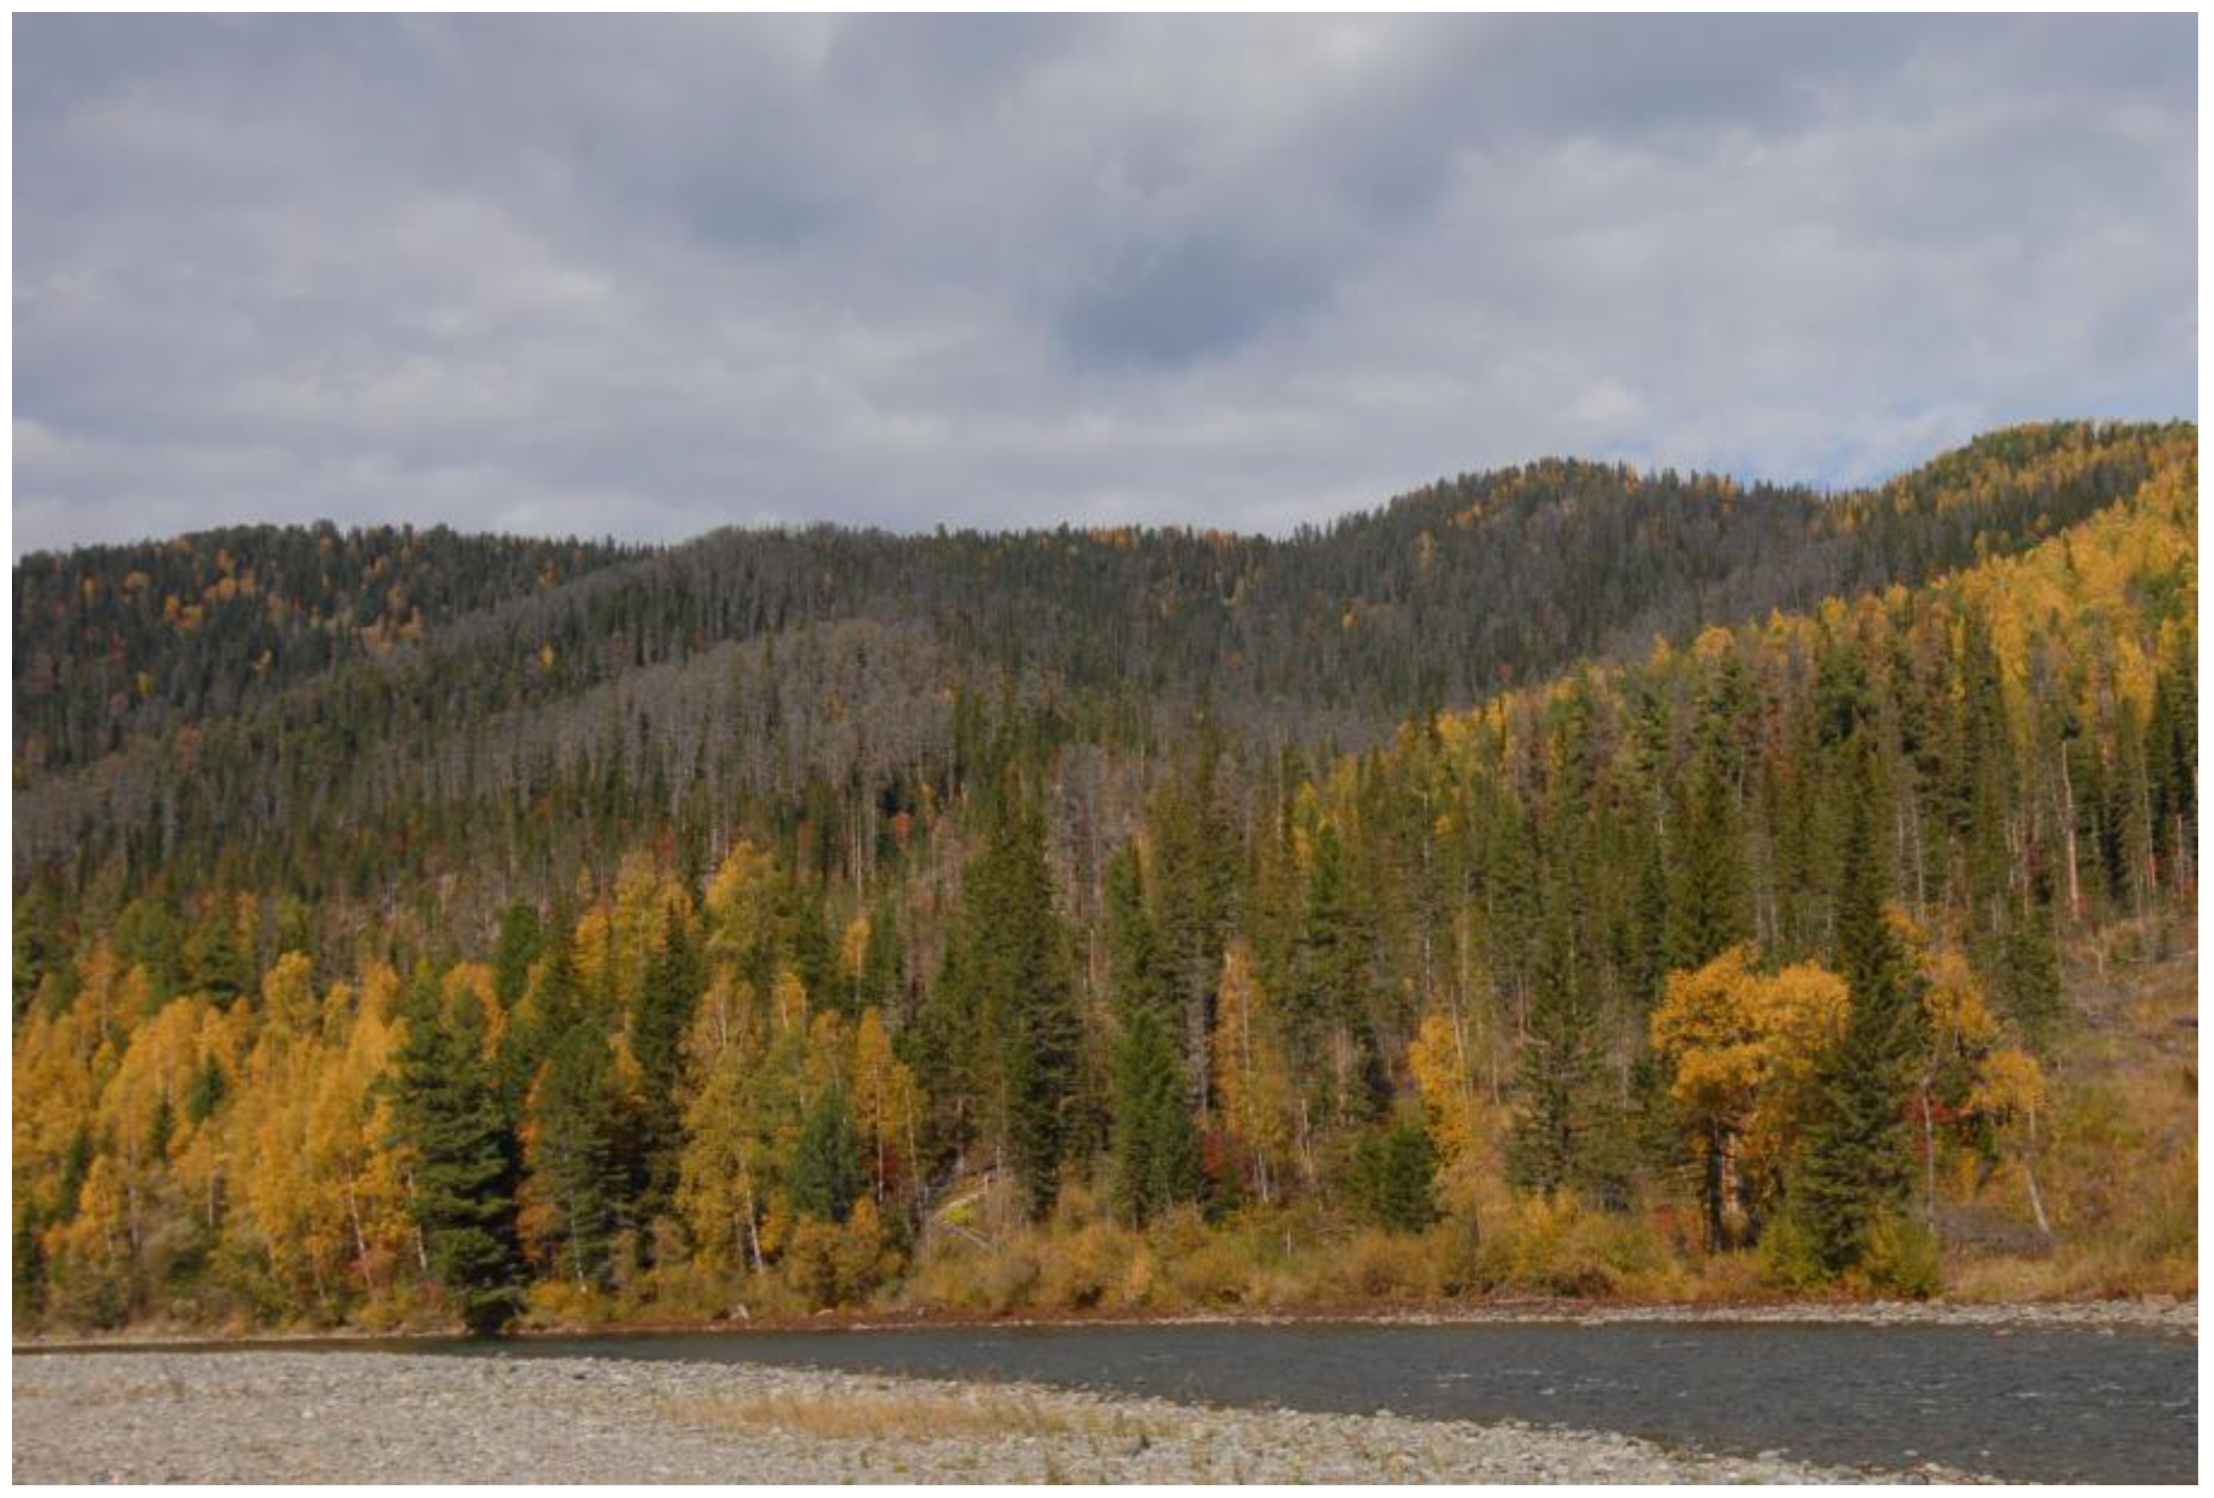
  • The consequences of climate warming differed within different elevation belts. In the treeline ecotone, the tree’s growth has continuously increased since the warming onset in the 1970s, whereas in the lowlands, the initial growth increase switched to a growth drop since the beginning of the 2000s with consequent partial mortality of Siberian pine forest. In the highlands, the tree’s growth was increasing until the end of the 1980s with the following growth fluctuations.
  • The control of the Siberian pine growth by air temperature and moisture variables included two phases. Firstly, (from the warming onset in the 1970s), the trees’ GI was positively correlated with elevated temperature, whereas the GI dependence on precipitation and soil moisture was negative. During the second phase (since the warming increase after 2000), negative correlations between GI and moisture variables switched to positive ones, whereas the GI correlations with air temperature switched from positive to insignificant (except for the beginning of the growth period, i.e., during the seasonal water stress).
  • The wind influence on the GI dramatically changed due to a continuous decrease in wind speed throughout the study period. Thus, the significant negative influence of winds on the trees’ growth within all elevation belts turned insignificant after 2000.
  • Within the lowlands, warming-driven water stress, in combination with bark borers’ attacks, led to tree mortality, which suggests the retraction of the Siberian pine range in the lowlands of the Siberian Mountains. The projected drought increase will likely lead to the substitution of Siberian pine with drought-tolerant species.
  • Afforestation within the areas of Siberian pine mortality should not be based on the planting of Siberian pine but on planting drought-tolerant species such as larch (Larix sibirica) and Scots pine (Pinus sylvestris).

Author Contributions

Conceptualization, V.I.K.; methodology, V.I.K. and I.A.P.; validation, V.I.K., A.S.G., S.T.I. and I.A.P.; formal Analysis, S.T.I., I.A.P. and A.S.G.; investigation, V.I.K., S.T.I. and I.A.P.; resources, S.T.I., A.S.S. and A.S.G.; data curation, S.T.I., I.A.P. and A.S.G.; writing—original draft preparation, V.I.K.; visualization, S.T.I., I.A.P., A.S.G. and A.S.S. supervision, V.I.K.; project administration, V.I.K.; funding acquisition, V.I.K. All authors have read and agreed to the published version of the manuscript.

Funding

This research was funded by the Tomsk State University Development Program (Priority 2030).

Data Availability Statement

The data presented in this study are openly available: climate data at https://cds.climate.copernicus.eu/cdsapp (accessed on 15 September 2023); SPEI in https://spei.csic.es/map/maps.html (accessed on 15 September 2023); sc-PDSI monthly data were obtained from CRU TS 4.06 database (https://crudata.uea.ac.uk/cru/data/drought/; accessed on 15 September 2023); wind speed monthly data were obtained from the AISORI web-service (http://aisori-m.meteo.ru/waisori/, accessed on 15 September 2023).

Conflicts of Interest

The authors declare no conflicts of interest.

References

  1. Hammond, W.M.; Williams, A.P.; Abatzoglou, J.T.; Adams, H.D.; Klein, T.; López, R.; Sáenz-Romero, C.; Hartmann, H.; Breshears, D.D.; Allen, C.D. Global field observations of tree die-off reveal hotter-drought fingerprint for Earth’s forests. Nat. Commun. 2022, 13, 1761. [Google Scholar] [CrossRef] [PubMed]
  2. Rao, M.P.; Davi, N.K.; Magney, T.S.; Andreu-Hayles, L.; Nachin, B.; Suran, B.; Varuolo-Clarke, A.M.; Cook, B.I.; D’Arrigo, R.D.; Pederson, N.; et al. Approaching a thermal tipping point in the Eurasian boreal forest at its southern margin. Commun. Earth Environ. 2023, 4, 247. [Google Scholar] [CrossRef]
  3. Kharuk, V.I.; Im, S.T.; Petrov, I.A. Alpine ecotone in the Siberian Mountains: Vegetation response to warming. J. Mt. Sci. 2021, 18, 3099–3108. [Google Scholar] [CrossRef]
  4. Maher, C.; Hewitt, R.E.; Sullivan, P.F. Sufficient conditions for rapid range expansion of a boreal conifer. Nature 2022, 608, 546–551. [Google Scholar] [CrossRef]
  5. Watts, J.; Farina, M.; Kimball, J.; Schiferl, L.; Liu, Z.; Arndt, K.; Zona, D.; Ballantyne, A.; Euskirchen, E.S.; Parmentier, F.W.; et al. Carbon uptake in Eurasian boreal forests dominates the high-latitude net ecosystem carbon budget. Glob. Chan. Biol. 2023, 29, 1870–1889. [Google Scholar] [CrossRef] [PubMed]
  6. Kharuk, V.I.; Im, S.T.; Petrov, I.A.; Dvinskaya, M.L.; Shushpanov, A.S.; Golyukov, A.S. Climate-driven conifer mortality in Siberia. Global Ecol. Biogeogr. 2021, 30, 543–556. [Google Scholar] [CrossRef]
  7. Anderegg, W.R.L.; Wu, C.; Acil, N.; Carvalhais, N.; Pugh, T.A.M.; Sadler, J.P.; Seidl, R. A climate risk analysis of Earth’s forests in the 21st century. Science 2022, 377, 1099–1103. [Google Scholar] [CrossRef] [PubMed]
  8. Guarín, A.; Taylor, A.H. Drought triggered tree mortality in mixed conifer forests in Yosemite National Park, California, USA. For. Ecol. Manag. 2005, 218, 229–244. [Google Scholar] [CrossRef]
  9. Redmond, M.D.; Barger, N.N. Tree regeneration following drought- and insect-induced mortality in piñon–juniper woodlands. New Phytol. 2013, 200, 402–412. [Google Scholar] [CrossRef]
  10. Boyd, M.A.; Berner, L.T.; Doak, P.; Goetz, S.J.; Rogers, B.M.; Wagner, D.; Walker, X.J.; Mack, M.C. Impacts of climate and insect herbivory on productivity and physiology of trembling aspen (Populus tremuloides) in Alaskan boreal forests. Environ. Res. Lett. 2019, 14, 085010. [Google Scholar] [CrossRef]
  11. Yousefpour, R.; Hanewinkel, M.; Le Moguédec, G. Evaluating the suitability of management strategies of pure Norway spruce forests in the black forest area of Southwest Germany for adaptation to or mitigation of climate change. Environ. Manag. 2010, 45, 387–402. [Google Scholar] [CrossRef] [PubMed]
  12. Martínez-Vilalta, J.; Lloret, F.; Breshears, D.D. Drought-induced forest decline: Causes, scope and implications. Biol. Lett. 2012, 8, 689–691. [Google Scholar] [CrossRef] [PubMed]
  13. Neumann, M.; Mues, V.; Moreno, A.; Hasenauer, H.; Seidl, R. Climate variability drives recent tree mortality in Europe. Glob. Chang. Biol. 2017, 23, 4788–4797. [Google Scholar] [CrossRef] [PubMed]
  14. Hlásny, T.; Barka, I.; Kulla, L.; Bucha, T.; Sedmák, R.; Trombik, J. Sustainable forest management in a mountain region in the Central Western Carpathians, northeastern Slovakia: The role of climate change. Reg. Environ. Chang. 2017, 17, 65–77. [Google Scholar] [CrossRef]
  15. Zamolodchikov, D.G. Evaluation of climate-induced changes in diversity of tree species according to forest fund data records. Biol. Bull. Rev. 2011, 131, 382–392. (In Russian) [Google Scholar]
  16. Allen, C.D.; Breshears, D.D.; McDowell, N.G. On underestimation of global vulnerability to tree mortality and forest die-off from hotter drought in the anthropocene. Ecosphere 2015, 6, 1–55. [Google Scholar] [CrossRef]
  17. Goulden, M.L.; Bales, R.C. California forest die-off linked to multi-year deep soil drying in 2012–2015 drought. Nat. Geosci. 2019, 12, 632–637. [Google Scholar] [CrossRef]
  18. Raffa, K.F.; Aukema, B.H.; Bentz, B.J.; Carroll, A.L.; Hicke, J.A.; Turner, M.G.; Romme, W.H. Cross-scale drivers of natural disturbances prone to anthropogenic amplification: The dynamics of bark beetle eruptions. BioScience 2008, 58, 501–517. [Google Scholar] [CrossRef]
  19. Millar, C.I.; Stephenson, N.L. Temperate forest health in an era of emerging megadisturbance. Science 2015, 349, 823–826. [Google Scholar] [CrossRef]
  20. Kolb, T.E.; Fettig, C.J.; Ayres, M.P.; Bentz, B.J.; Hicke, J.A.; Mathiasen, R.; Stewart, J.E.; Weed, A.S. Observed and anticipated impacts of drought on forest insects and diseases in the United States. For. Ecol. Manag. 2016, 380, 321–324. [Google Scholar] [CrossRef]
  21. Kharuk, V.I.; Ponomarev, E.I.; Ivanova, G.A.; Dvinskaya, M.L.; Coogan, S.C.P.; Flannigan, M.D. Wildfires in the Siberian taiga. Ambio 2021, 50, 1953–1974. [Google Scholar] [CrossRef] [PubMed]
  22. Rinn, F. TSAP V 3.6 Reference Manual: Computer Program for Tree-Ring Analysis and Presentation; Frank Rinn Distribution: Heidelberg, Germany, 1996. [Google Scholar]
  23. Holmes, R.L. Computer-assisted quality control in tree-ring dating and measurement. Tree-Ring Bull. 1983, 44, 69–75. [Google Scholar]
  24. Cook, E.R.; Holmes, R.L. Chronology Development, Statistical Analysis. Guide for Computer Program ARSTAN; Lab. of Tree Ring Res., the University of Arizona: Tucson, AZ, USA, 1986; pp. 50–65. [Google Scholar]
  25. Speer, J.H. Fundamentals of Tree-Ring Research; University of Arizona Press: Tucson, AZ, USA, 2010. [Google Scholar]
  26. Ryan, S.E.; Porth, L.S. A Tutorial on the Piecewise Regression Approach Applied to Bedload Transport Data; Gen. Tech. Rep. RMRS-GTR-189; U.S. Department of Agriculture, Forest Service, Rocky Mountain Research Station: Fort Collins, CO, USA, 2007; 41p. [Google Scholar]
  27. Cailleret, M.; Jansen, S.; Robert, E.M.R.; Desoto, L.; Aakala, T.; Antos, J.A.; Beikircher, B.; Bigler, C.; Bugmann, H.; Caccianiga, M.; et al. A synthesis of radial growth patterns preceding tree mortality. Glob. Chang. Biol. 2017, 23, 1675–1690. [Google Scholar] [CrossRef] [PubMed]
  28. Kharuk, V.I.; Ranson, K.J.; Petrov, I.A.; Dvinskaya, M.L.; Im, S.T.; Golyukov, A.S. Larch (Larix dahurica Turcz) growth response to climate change in the Siberian permafrost zone. Reg. Environ. Chang. 2019, 19, 233–243. [Google Scholar] [CrossRef]
  29. Stephenson, N.L.; Das, A.J.; Ampersee, N.J.; Bulaon, B.M.; Yee, J.L. Which trees die during drought? The key role of insect host-tree selection. J. Ecol. 2019, 107, 2383–2401. [Google Scholar] [CrossRef]
  30. Sangüesa-Barreda, G.; Linares, J.C.; Camarero, J.J. Reduced growth sensitivity to climate in bark-beetle infested Aleppo pines: Connecting climatic and biotic drivers of forest dieback. For. Ecol. Manag. 2015, 357, 126–137. [Google Scholar] [CrossRef]
  31. Davis, K.; Dobrowski, S.Z.; Holden, Z.A.; Higuera, P.E.; Abatzoglou, J.T. Microclimatic buffering in forests of the future: The role of local water balance. Ecography 2018, 42, 1–11. [Google Scholar] [CrossRef]
  32. Pachauri, R.K.; Allen, M.R.; Barros, V.R.; Broome, J.; Cramer, W.; Christ, R.; Church, J.A.; Clarke, L.; Dahe, Q.; Dasgupta, P.; et al. Climate Change 2014: Synthesis Report. Contribution of Working Groups I, II and III to the Fifth Assessment Report of the Intergovernmental Panel on CLIMATE CHANGE.; Pachauri, R., Meyer, L., Eds.; IPCC: Geneva, Switzerland, 2014; Available online: https://epic.awi.de/id/eprint/37530/1/IPCC_AR5_SYR_Final.pdf (accessed on 23 November 2023).
Figure 1. (a) The study area is located within the Kuznetsk Ala-Tau Mountains. (b) Test sites’ (TS) locations (1–6) within the treeline ecotone (elevations > 1400 m), highlands (>1000 m), and lowlands (<900 m) are marked by blue, yellow, and red dots, respectively. The number of test sites is n = 10 (treeline), n = 14 (highlands), and n = 14 (lowlands). The DNC is the “dark needle conifer” forest, mainly composed of Siberian pine and fir.
Forests 15 00050 g001
Figure 2. Climate variables’ dynamic. Air temperature (a) and June VPD (e) are increasing, whereas summer precipitation (b), soil moisture (d), and wind speed (f) are decreasing. Those trends are significant at p < 0.05 except for soil moisture (p < 0.11). No significant trends were found for summer and monthly Palmer self-calibrating (sc-PDSI) and SPEI drought indexes (c). Red arrows indicate acute drought (1985, 1998, and 2012).
Forests 15 00050 g002
Figure 3. Growth index dynamics of Siberian pine within the (a) treeline ecotone (sample size n =110), (b) highlands (n = 262), and (c) lowlands (n = 401). Within the treeline ecotone, a stable increasing rate of growth index was observed. Within the lowlands, the green bar highlights the “breakpoint period”, i.e., the formation of “decliners” and “survivors” cohorts. The red arrow indicates the year of divergence in trajectories of the “decliners” and “survivors”. The persistent decreasing trend of the “decliners” GI has been observed since 1999. Trends are significant at p < 0.05.
Forests 15 00050 g003
Figure 4. Lowlands. Spearman’s correlations of the growth index with climate variables before (1970–1999, blue columns) and after (2000–2019, red columns) the growth breakpoint. Before the breakpoint, the GI positively correlated with May and MJJA temperatures (a) and May VPD (d) and correlated negatively with May precipitation (b) and June soil moisture (c) and wind speed (e). After the growth breakpoint, correlations switched, and the GI was controlled by the moisture variables (bd), except for May temperatures (a). Notably, wind speed influence became insignificant after 2000. One and two stars indicate significance at p < 0.05 and p < 0.01.
Forests 15 00050 g004
Figure 5. Treeline ecotone. Spearman’s correlations of the GI with climate variables before (1970–1999, blue columns) and after (2000–2019, red columns) growth breakpoint. Before breakpoint, the GI positively correlated with May and MJJA temperatures (a) and May VPD (d) and correlated negatively with annual wind speed (e). After the breakpoint, correlations switched to precipitation (b) and soil moisture (c). One and two stars indicate significance at p < 0.05 and p < 0.01.
Forests 15 00050 g005
Figure 6. Highlands. Growth index correlations with climate variables before (1970–1999, blue columns) and after (2000–2019, red columns) growth breakpoint. Before breakpoint, growth positively correlated with air temperatures (a) and negatively with wind speed (e). Correlations with VPD are non significant (d). After the growth breakpoint, correlations switched to dependence on the precipitation (negative in May and positive in June; (b) and soil moisture (c). Wind influence became insignificant after 2000. One and two stars indicate significance at p < 0.05 and p < 0.01.
Forests 15 00050 g006
Figure 7. Siberian pine trees’ mortality (gray color) in the lowlands (about 600 m; Site 4 in Figure 1).
Forests 15 00050 g007
Table 1. Mean biometric data of Siberian pine trees within the study area.
Elevation Belt (m) Tree Height (m)DBH (cm)Species CompositionSiberian Pine Age (Years)Number of Test Sites
Treeline ecotone 1400–1550 3.5105Sp3L2F1B *6510
Highlands 1200–14008205Sp3F1L1B14014
Lowlands 500–90027655Sp4F1S19014
* Species composition is presented as a given species proportion (with the total value = 10.0). I.e., 5Sp3L1F1B means that Siberian pine (SP) proportion is 50%, larch (L) is 30%, fir is 10%, and birch is 10%. Abbreviations: Sp is Pinus sibirica, F is Abies sibirica, B is Betula spp., and S is Picea obovata.
Disclaimer/Publisher’s Note: The statements, opinions and data contained in all publications are solely those of the individual author(s) and contributor(s) and not of MDPI and/or the editor(s). MDPI and/or the editor(s) disclaim responsibility for any injury to people or property resulting from any ideas, methods, instructions or products referred to in the content.

