Article

Plant–Soil Feedback of Companion Species during Grassland Community Succession

1
College of Forestry, Sichuan Agricultural University, Chengdu 611130, China
2
State Key Laboratory of Soil Erosion and Dryland Farming on Loess Plateau, Institute of Soil and Water Conservation, Northwest A & F University, Xianyang 712100, China
3
The Key Laboratory for Silviculture and Conservation of Ministry of Education, College of Forestry, Beijing Forestry University, Beijing 100083, China
*
Authors to whom correspondence should be addressed.
These authors should be considered joint first authors.
Forests 2023, 14(8), 1634; https://doi.org/10.3390/f14081634
Submission received: 12 July 2023 / Revised: 5 August 2023 / Accepted: 11 August 2023 / Published: 13 August 2023
(This article belongs to the Topic Plants Nutrients)

Abstract

:
The responses of dominant species to plant–soil feedback (PSF) are well established; however, the changes in the PSF of companion species remain unclear. This study aims to assess the direction and intensity of PSF, determine the main factors influencing it, and interpret the ecological significance of PSF in companion species within the context of grassland community succession. Three typical companion species, namely Artemisia sacrorum, Artemisia capillaris, and Artemisia giraldii, were planted in soils at three grassland community succession stages (early, middle, and late) on the Loess Plateau. Our results indicate that during both plant growth periods, the shoot biomass of A. sacrorum, A. capillaris, and A. giraldii in early- and late-stage soils was higher than that in the middle-stage soil, suggesting consistent growth of the three companion species during the two growth periods. However, plant growth simultaneously led to a reduction in soil nutrient content and microbial biomass, resulting in an overall decrease in the biomass of the three species, indicating a negative PSF effect in companion species. In conclusion, the negative PSF observed in all three associated species explains the temporary dominance of companion species during succession. This study enhances our understanding of the mechanisms driving PSF in community succession.

1. Introduction

For a scientific understanding of community succession, it is crucial to comprehend the changes in plant community structure and composition [1]. The forms and functions of terrestrial ecosystems are continually changing due to human activities and climate change, particularly in the Loess Plateau region of China [2,3]. Since the 1950s, factors such as reclamation, deforestation, and extreme weather events (e.g., droughts, heavy rain, hailstorms, and strong winds) have severely damaged the vegetation on the Loess Plateau, leading to significant soil degradation and erosion [4]. However, after the implementation of China’s ‘Grain-for-Green’ Program in 1999, there was a notable improvement in plant growth, coverage, and plant community diversity [5]. Returning farmland to grassland has proven to be an effective measure in enhancing soil fertility and controlling erosion in this region [6]. Nevertheless, due to the unique environmental conditions of the Loess Plateau, such as drought and nutrient-poor soil resulting from severe erosion [7], vegetation restoration in this area requires an extended period. Therefore, understanding the dynamics of plant communities during restoration is vital for comprehending community succession.
While significant research has been conducted on changes in soil nutrients, microbial activity, and plant community structure during plant succession [8], more researchers are now focusing on changes in plant–soil feedback (PSF) during succession. PSF refers to the changes in soil biotic and abiotic properties caused by plant growth, which, in turn, influence the growth of the plants themselves or other plants [9,10]. Increasing evidence suggests that PSF plays a crucial role in driving community succession [11,12]. By studying PSF, we can gain a better understanding the changes in plant community composition and structure, as well as the role of PSF in species replacement.
PSF varies significantly among species at different successional stages. Recent studies have shown that the PSF of early-successional grass species tends to be negative, which may be attributed to the greater influence of pathogenic fungi compared to mycorrhizal fungi [13,14]. Conversely, the PSF of late-successional grass species exhibits a positive feedback effect, indicating that the role of mycorrhizal fungi is more significant during late succession than that of pathogenic fungi [15]. Dominant and companion species display notable differences in photosynthesis and resource utilization due to their distinct ecological niches [16]. Additionally, research has confirmed that the growth of dominant species can produce allelopathy, inhibiting the seed germination and growth of associated species. This process eventually leads to the gradual disappearance of the community of associated species, driving the plant community to change in a specific direction and ultimately develop into a top-level dominant community [2]. Scholars have found that dominant and companion species have different PSF effects, which contribute to species replacement within the community when studying PSF at different successional stages [15,17]. For instance, during the invasion of exotic species, dominant species demonstrate a significant advantage in the PSF process, whereas companion species gradually disappear [16]. This discrepancy is primarily due to companion species typically having a relatively low importance value in the community and facing disadvantages in photosynthetic competition and soil nutrient utilization [18]. These findings underscore the importance of PSF in companion species for community succession [15]. However, current research on PSF is primarily focused on dominant species, with a lack of study on the PSF of common companion species during community succession. Thus, a comprehensive analysis is urgently needed to evaluate the PSF of common companion species in the grassland succession sequence of the Loess Plateau. This analysis will aid in a better understanding of changes in plant community composition and structure, as well as the role of PSF in species replacement.
In this study, we have identified three typical companion species (Artemisia sacrorum, Artemisia capillaris, and Artemisia giraldii) in the soils of three grassland community succession stages (early, middle, and late) on the Loess Plateau. Through a two-year PSF experiment, the aims of this study were to (1) assess the direction and intensity of PSF in the three companion species, (2) determine the main factors influencing the PSF of these species, and (3) provide an ecological interpretation of the impact of companion species’ PSF on grassland community succession. The results of this study are expected to provide a scientific basis for vegetation restoration and stability on the Loess Plateau.

2. Materials and Methods

2.1. Experimental Site and Design

2.1.1. Plant, Seed, and Soil Collection

The dominant species of secondary succession in semiarid grasslands, Setaria viridis (abandoned 1–2 years ago), Stipa bungeana (abandoned 10–20 years ago), and Bothriochloa ischaemum (abandoned >30 years ago), were selected from the Loess Plateau in China as representative plants of early-, middle-, and late-successional species, respectively [2,3]. Rhizosphere soil samples were collected from the three dominant species, representing early-, middle-, and late-stage species. The soil samples were collected at a depth of 5–20 cm from soil adhering to the plant roots and were obtained from the Ansai Research Station of the Chinese Academy of Sciences (36°51′ N, 109°19′ E). Subsequently, the collected soil samples were passed through a 5 mm sieve and stored at 4 °C.
As experimental plants, we selected three companion species: A. capillaris, A. sacrorum, and A. giraldii. These three companion species are common in the grass succession process of the Loess Plateau. Specifically, A. capillaris serves as the companion species in the early stage of succession, while A. sacrorum and A. giraldii act as companion species in the middle and late stages of succession, respectively. The seeds of these three companion species were obtained from mature plants.

2.1.2. Plant–Soil Feedback (PSF) Experiment

To investigate the PSF effects of the three companion species in soils of three different succession stages, PSF experiments were carried out at the State Key Laboratory of Soil Erosion and Dryland Farming in Loess Plateau, Institute of Soil and Water Conservation, Chinese Academy of Sciences, and the Ministry of Water Resources (34°12′ N, 108°07′ E, 530 m a.s.l.). For this, A. sacrorum, A. capillaris, and A. giraldii were planted in the soils at three different succession stages, resulting in 9 treatments (12 pots/replicates: 6 replicates per years) planted in each treatment, totaling 108 pots (Figure S1).
The planting method involved placing crushed stones with a diameter of approximately 1 cm at the bottom of each pot, serving as a watering channel with a diameter of about 1.5 cm. Subsequently, 2.8 kg of the soil sample (based on dry weight) was added. On 4 May 2018, seeds were sown by scattering them in each pot, and sufficient water was supplied to enhance seed germination. After two weeks of growth, thinning was conducted to control the final number of plants per pot at four. Throughout the plant growth period, the positions of the pots were randomly changed once a week, and water was controlled twice a week to maintain 80% of the field water capacity. To accurately simulate field conditions, no fertilizers were added during the entire experiment. Plant height was measured four times a year during the growth period (20 May, 20 June, 20 July, and 20 August). After four months of plant growth (the first year or first plant growth period), five pots (6 pots/replicates) were chosen at random to obtain plant and soil samples. The aboveground and belowground parts of the remaining pots were removed (drop out), and the soil was retained for the second-year experiment (the second year or second plant growth period),. The next year, we replanted the plants (using plant seeds) with the same planting and management methods as in the first year.

2.1.3. Plant–Soil Sampling

After removing the dust from the plant leaves, the shoots were cut along the soil surface using scissors, and the roots were obtained using the whole-plant harvesting method. The plant roots were rinsed with distilled water. Then, both the shoots and roots were stored in archive bags and dried to a constant weight at 65 °C, which is the root biomass (RTB) and shoot biomass (STB). The dried plant sample was pulverized with a spheroidal graphite apparatus and sieved through a 1 mm sieve for determination of plant carbon (C), nitrogen (N), and phosphorus (P), including STB carbon (STBC), nitrogen (STBN), phosphorus (STBP), RTB carbon (RTBC), nitrogen (RTBN), and phosphorus (RTBP).
After the root of the plants was obtained, the remaining soil was sufficiently mixed, sieved through a 2 mm sieve, and the soil samples were divided into two parts. One part was air-dried and used for determination of the soil mineral nutrient content (soil organic carbon (SOC), total nitrogen (TN), total phosphorus (TP), available nitrogen (SAN), and available phosphorus (SAP)), whereas the other part was stored at 4 °C for determinations of the soil microbial biomass (microbial carbon (MBC) and microbial nitrogen (MBN)) and soil enzyme activity (β-1,4-glucosidase (BG), cellobiose hydrolase (CBH), β-1,4-acetyl-glucosamine glycosidase (NAG), leucine aminopeptidase (LAP), and phosphatase (AP)).

2.2. Library Analysis

The H2SO4-K2Cr2O7 oxidation heating method was used for the determination of the C content in the plant and soil, the Kjeldahl method was used to determine the plant and soil N content, and the P content in the plant and soil was determined by the molybdenum antimony anti-colorimetric method [19,20,21]. The contents of nitrate nitrogen (NO3-N) and ammonium nitrogen (NH4+-N) in the soil were determined by ultraviolet spectrophotometry and flow analysis, respectively. The molybdenum antimony anti-colorimetric method was used to determine the SAP content in the soil [22]. Soil microbial biomass was determined by the chloroform fumigation method [23], and soil enzyme activity was determined using the microplate fluorescence method [24]. Before the pot experiment, the soil mineral nutrient content, microbial biomass, and enzyme activities of the three succession stages soil were measured, and the results are shown in Tables S1 and S2.

2.3. Statistical Analysis

The PSF index is utilized to evaluate the direction and strength of the feedback effect of various plant species during different growth periods (year). The formula for calculating the PSF index is as follows [25]:
PSF   index = ( biomass 2 biomass 1 ) biomass 1
where biomass1 and biomass2 are the biomass of the first and second growth periods (refering to the first and second years of the experiment), respectively.
The data presented in both figures and tables are shown as the mean ± standard error. SAN is the sum of NO3-N and NH4+-N. A three-way ANOVA was used in comparing the effects of the plant growth period, species, and soil type on the content of shoot biomass, root biomass, SOC, TN, TP, SAP, SAN, MBC, MBN, BG, CBH, NAG, LAP, AP, STBC, STBN, STBP, RTBC, RTBN, and RTBP. Tukey post-hoc tests were used for multiple comparisons (p < 0.05). Before ANOVA analyses, the normality and homogeneity of variance were tested. Differences in plant characteristics (biomass, plant height, and plant C, N, and P) between the first and second growth periods were assessed using t-tests. Relationships between plant and soil characteristics were assessed using correlation matrices, and data were analyzed and visualized using R 4.0.2 (corrplot package).

3. Results

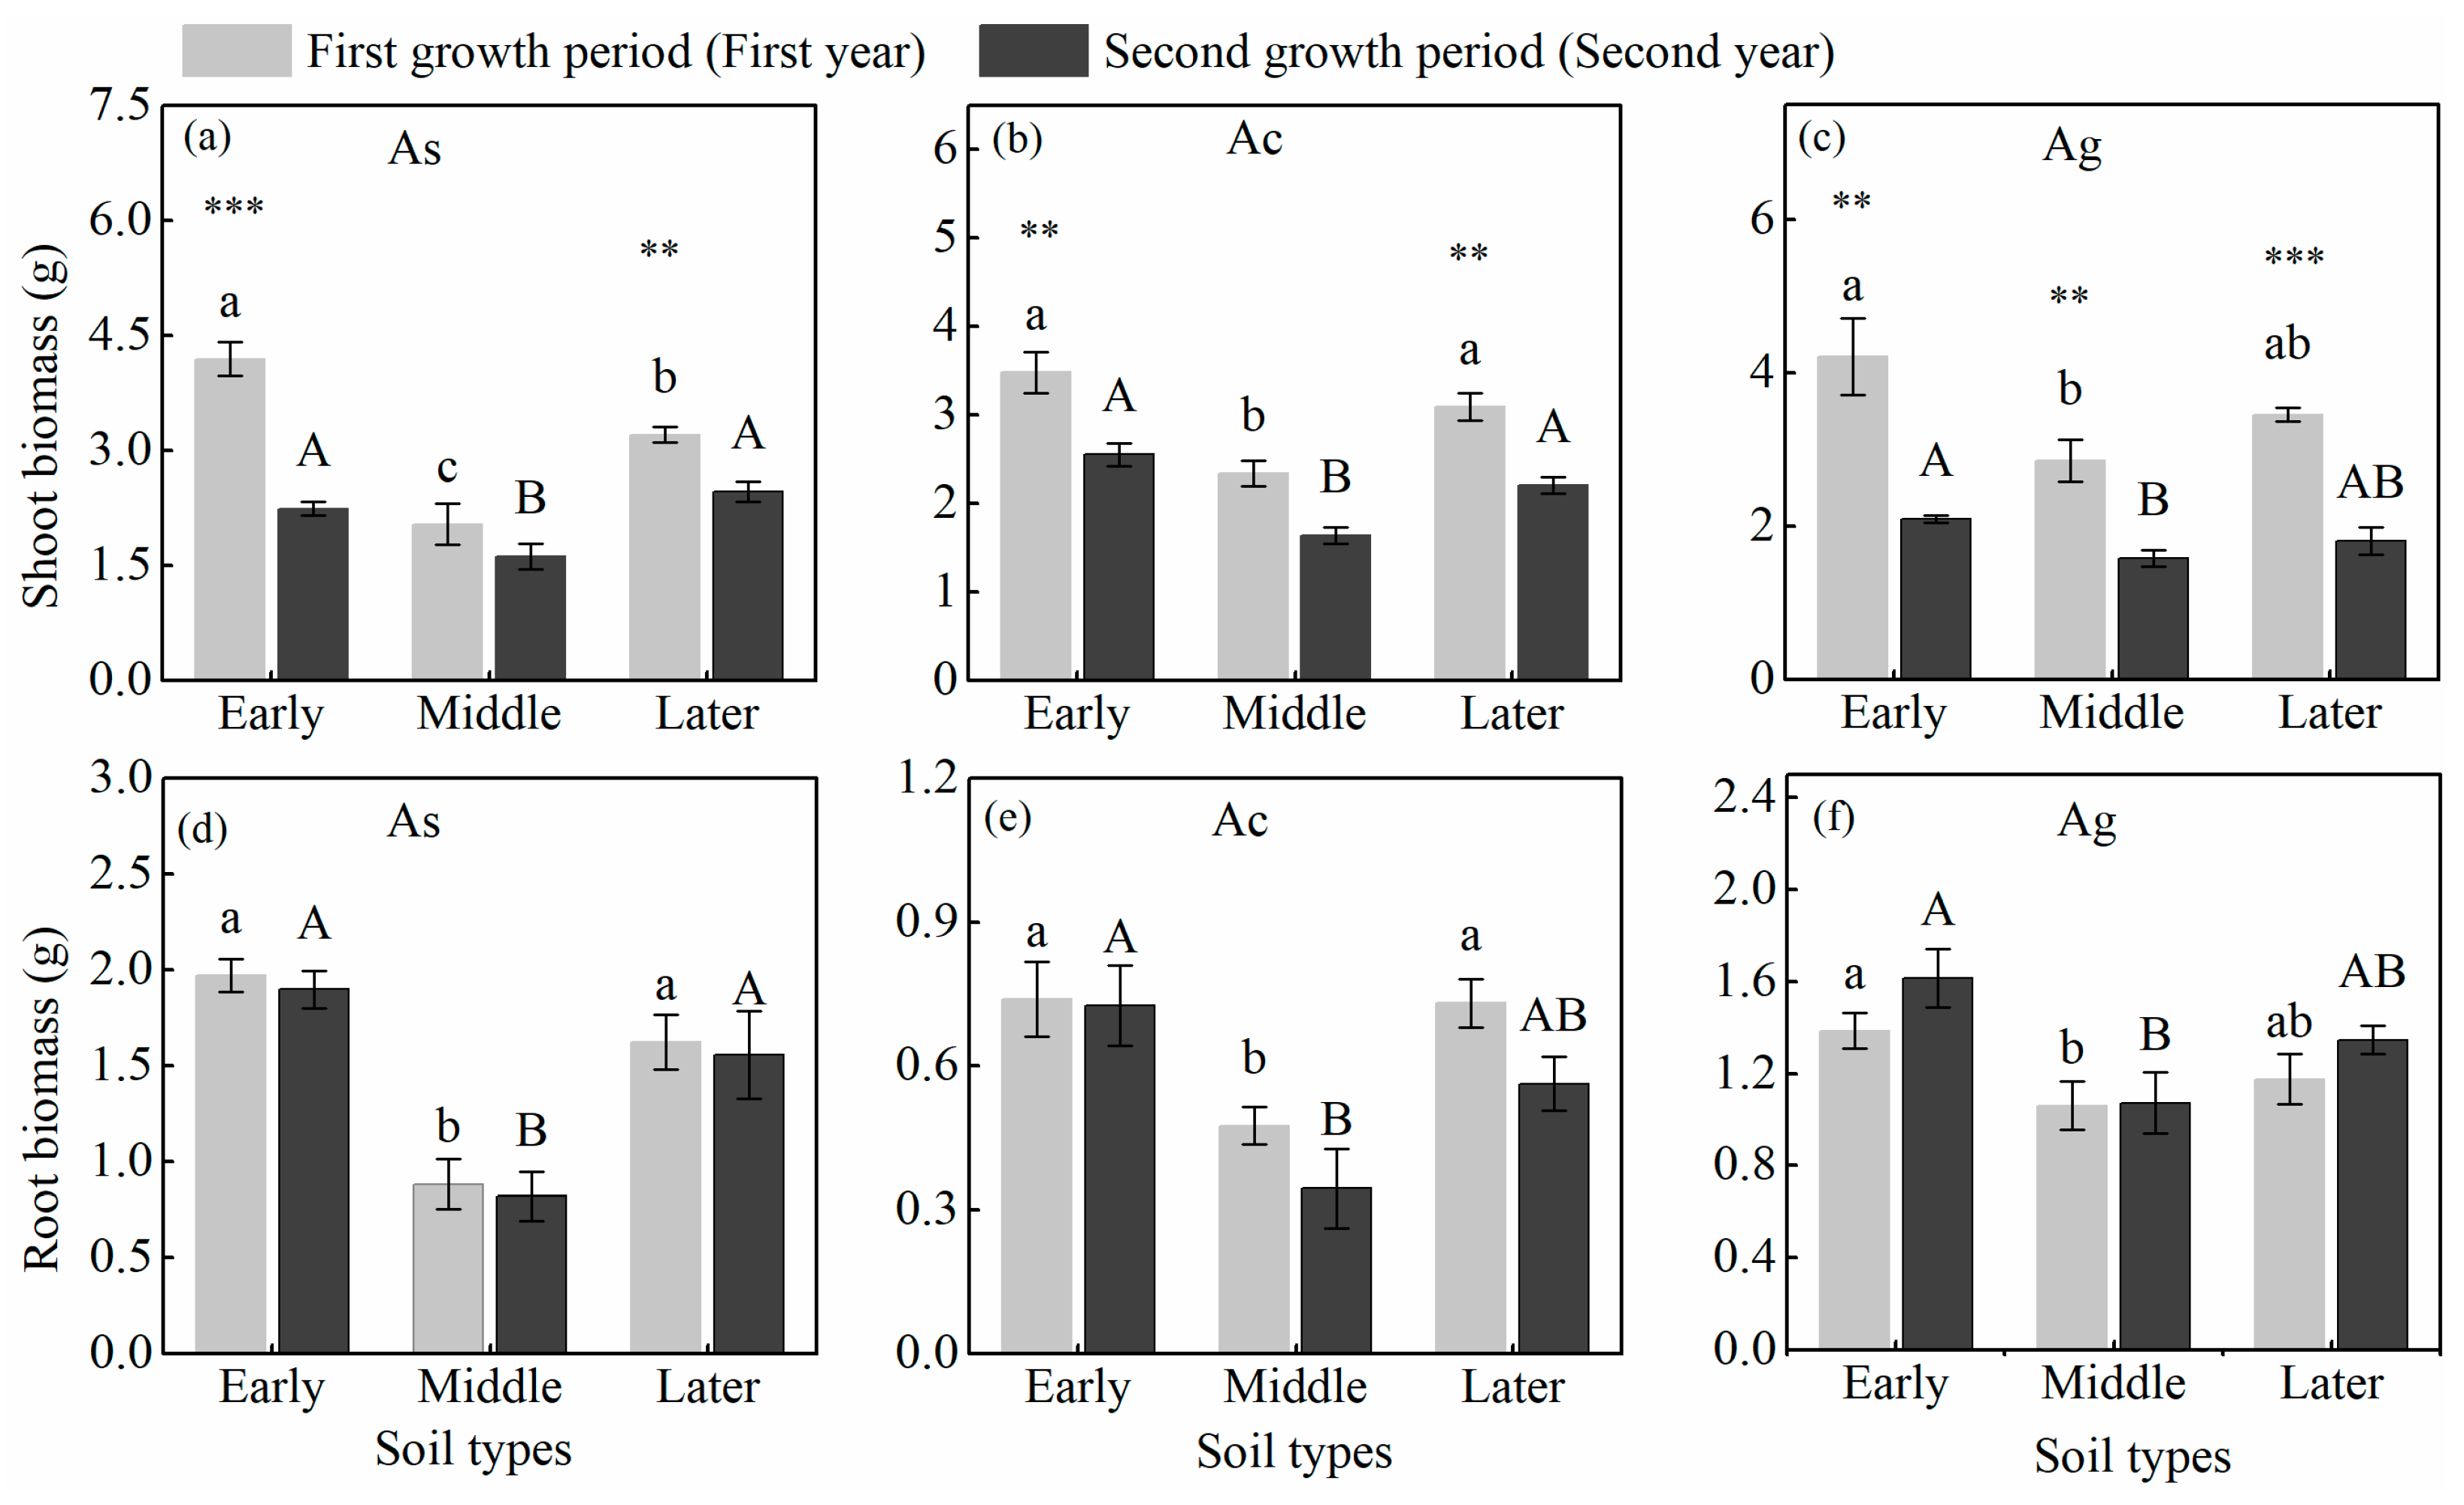
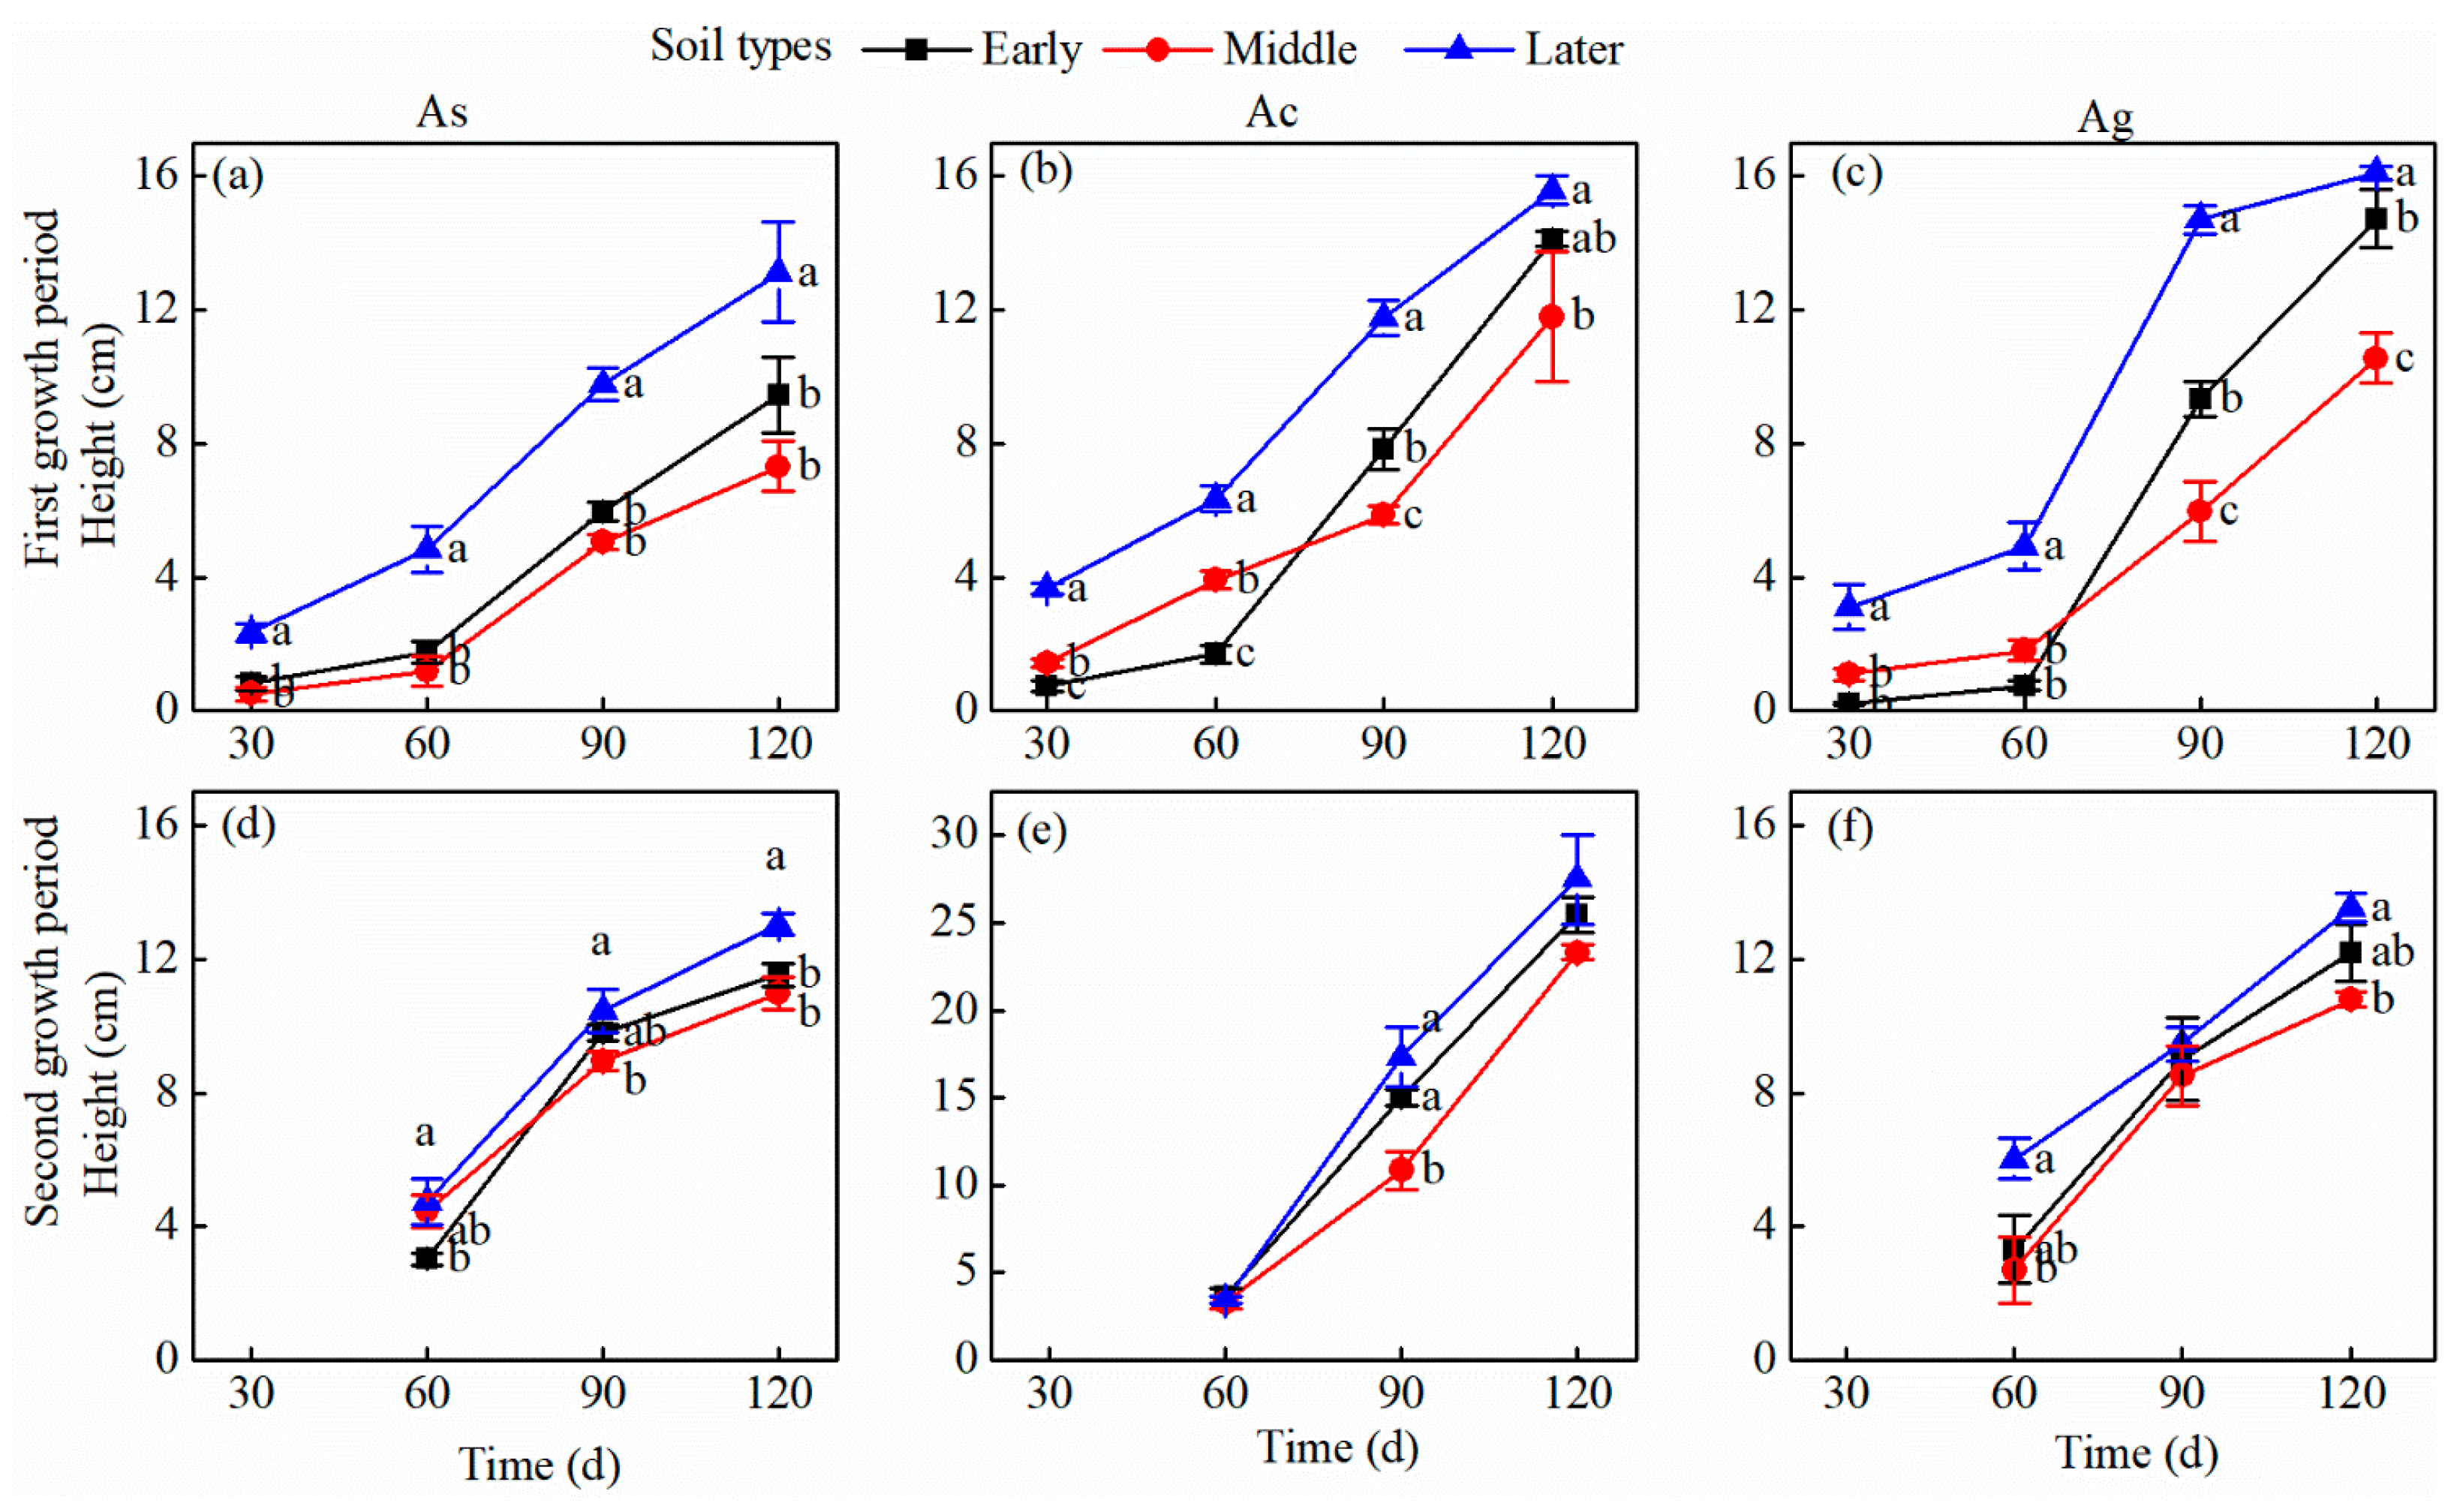
3.1. Plant Biomass, PSF Index, and Plant Height

The shoot and root biomass of A. sacrorum, A. capillaris, and A. giraldii are significantly influenced by the soil type and plant growth period (Figure 1a–f; Table S3). In both the first and second growth periods (refering to the first and second years of the experiment), the shoot and root biomass of the three species grown in the early- and late-stage soils were higher than those grown in the middle-stage soil. Furthermore, the shoot biomass of A. sacrorum and A. capillaris grown in early- and late-stage soil, and the shoot biomass of A. giraldii grown in the soil of all three stages were significantly higher in the first growth period than that in the second growth period.
During the first growth period, the plant height of A. sacrorum, A. capillaris, and A. giraldi grown in late-stage soil (30 d (day), 60 d, 90 d, and 120 d) was higher overall than that of plants grown in early- and middle-stage soils (Figure 2a–c). In the second growth period, the heights of A. sacrorum (60 d, 90 d, and 120 d) and A. giraldii (120 d) grown in late-stage soil were overall higher than those of plants grown in early- and middle-stage soils (Figure 2d–f). Additionally, the plant height of A. sacrorum in middle- and late-stage soil, of A. capillaris (90 d and 120 d) in the three stages of soil, and A. giraldii in early-stage soil (90 d and 120 d) were significantly greater in the second growth period than in the first (Table S4).
The PSF indexes of A. sacrorum, A. capillaris, and A. giraldii were all negative, with indexes ranging from −0.16 to −0.46, −0.26 to −0.29, and −0.42 to −0.48, respectively (Figure 3a–c).

3.2. Carbon, Nitrogen, and Phosphorus Characteristics of Plants

In the first growth period, A. sacrorum and A. capillaris grown in early- and late-stage soils generally had higher STBC, STBN, STBP, RTBC, RTBN, and RTBP contents than those grown in middle-stage soil. Similarly, A. giraldii grown in early- and late-stage soil had higher STBC, STBN, RTBC, and RTBN contents than those grown in middle-stage soil. In the second growth period, the STBC, STBN, STBP, RTBN, and RTBP contents of the three species grown in early- and late-stage soil were higher than those grown in middle-stage soil. Additionally, the RTBN and RTBP contents of A. giraldii grown in early-stage soil were significantly higher than those of plants grown in middle- and late-stage soils (Table 1 and Table 2).
Furthermore, in the soil of all three stages, the STBC, STBP, RTBC, RTBN, and RTBP contents of A. sacrorum were significantly lower in the second growth period than the first. Similarly, the STBN, RTBC, RTBN, and RTBP contents of A. capillaris were significantly lower in the second growth period than the first. The STBC, STBN, RTBC, RTBN, and RTBP contents of A. giraldii were also significantly lower in the second growth period than the first (Table 1 and Table 2).

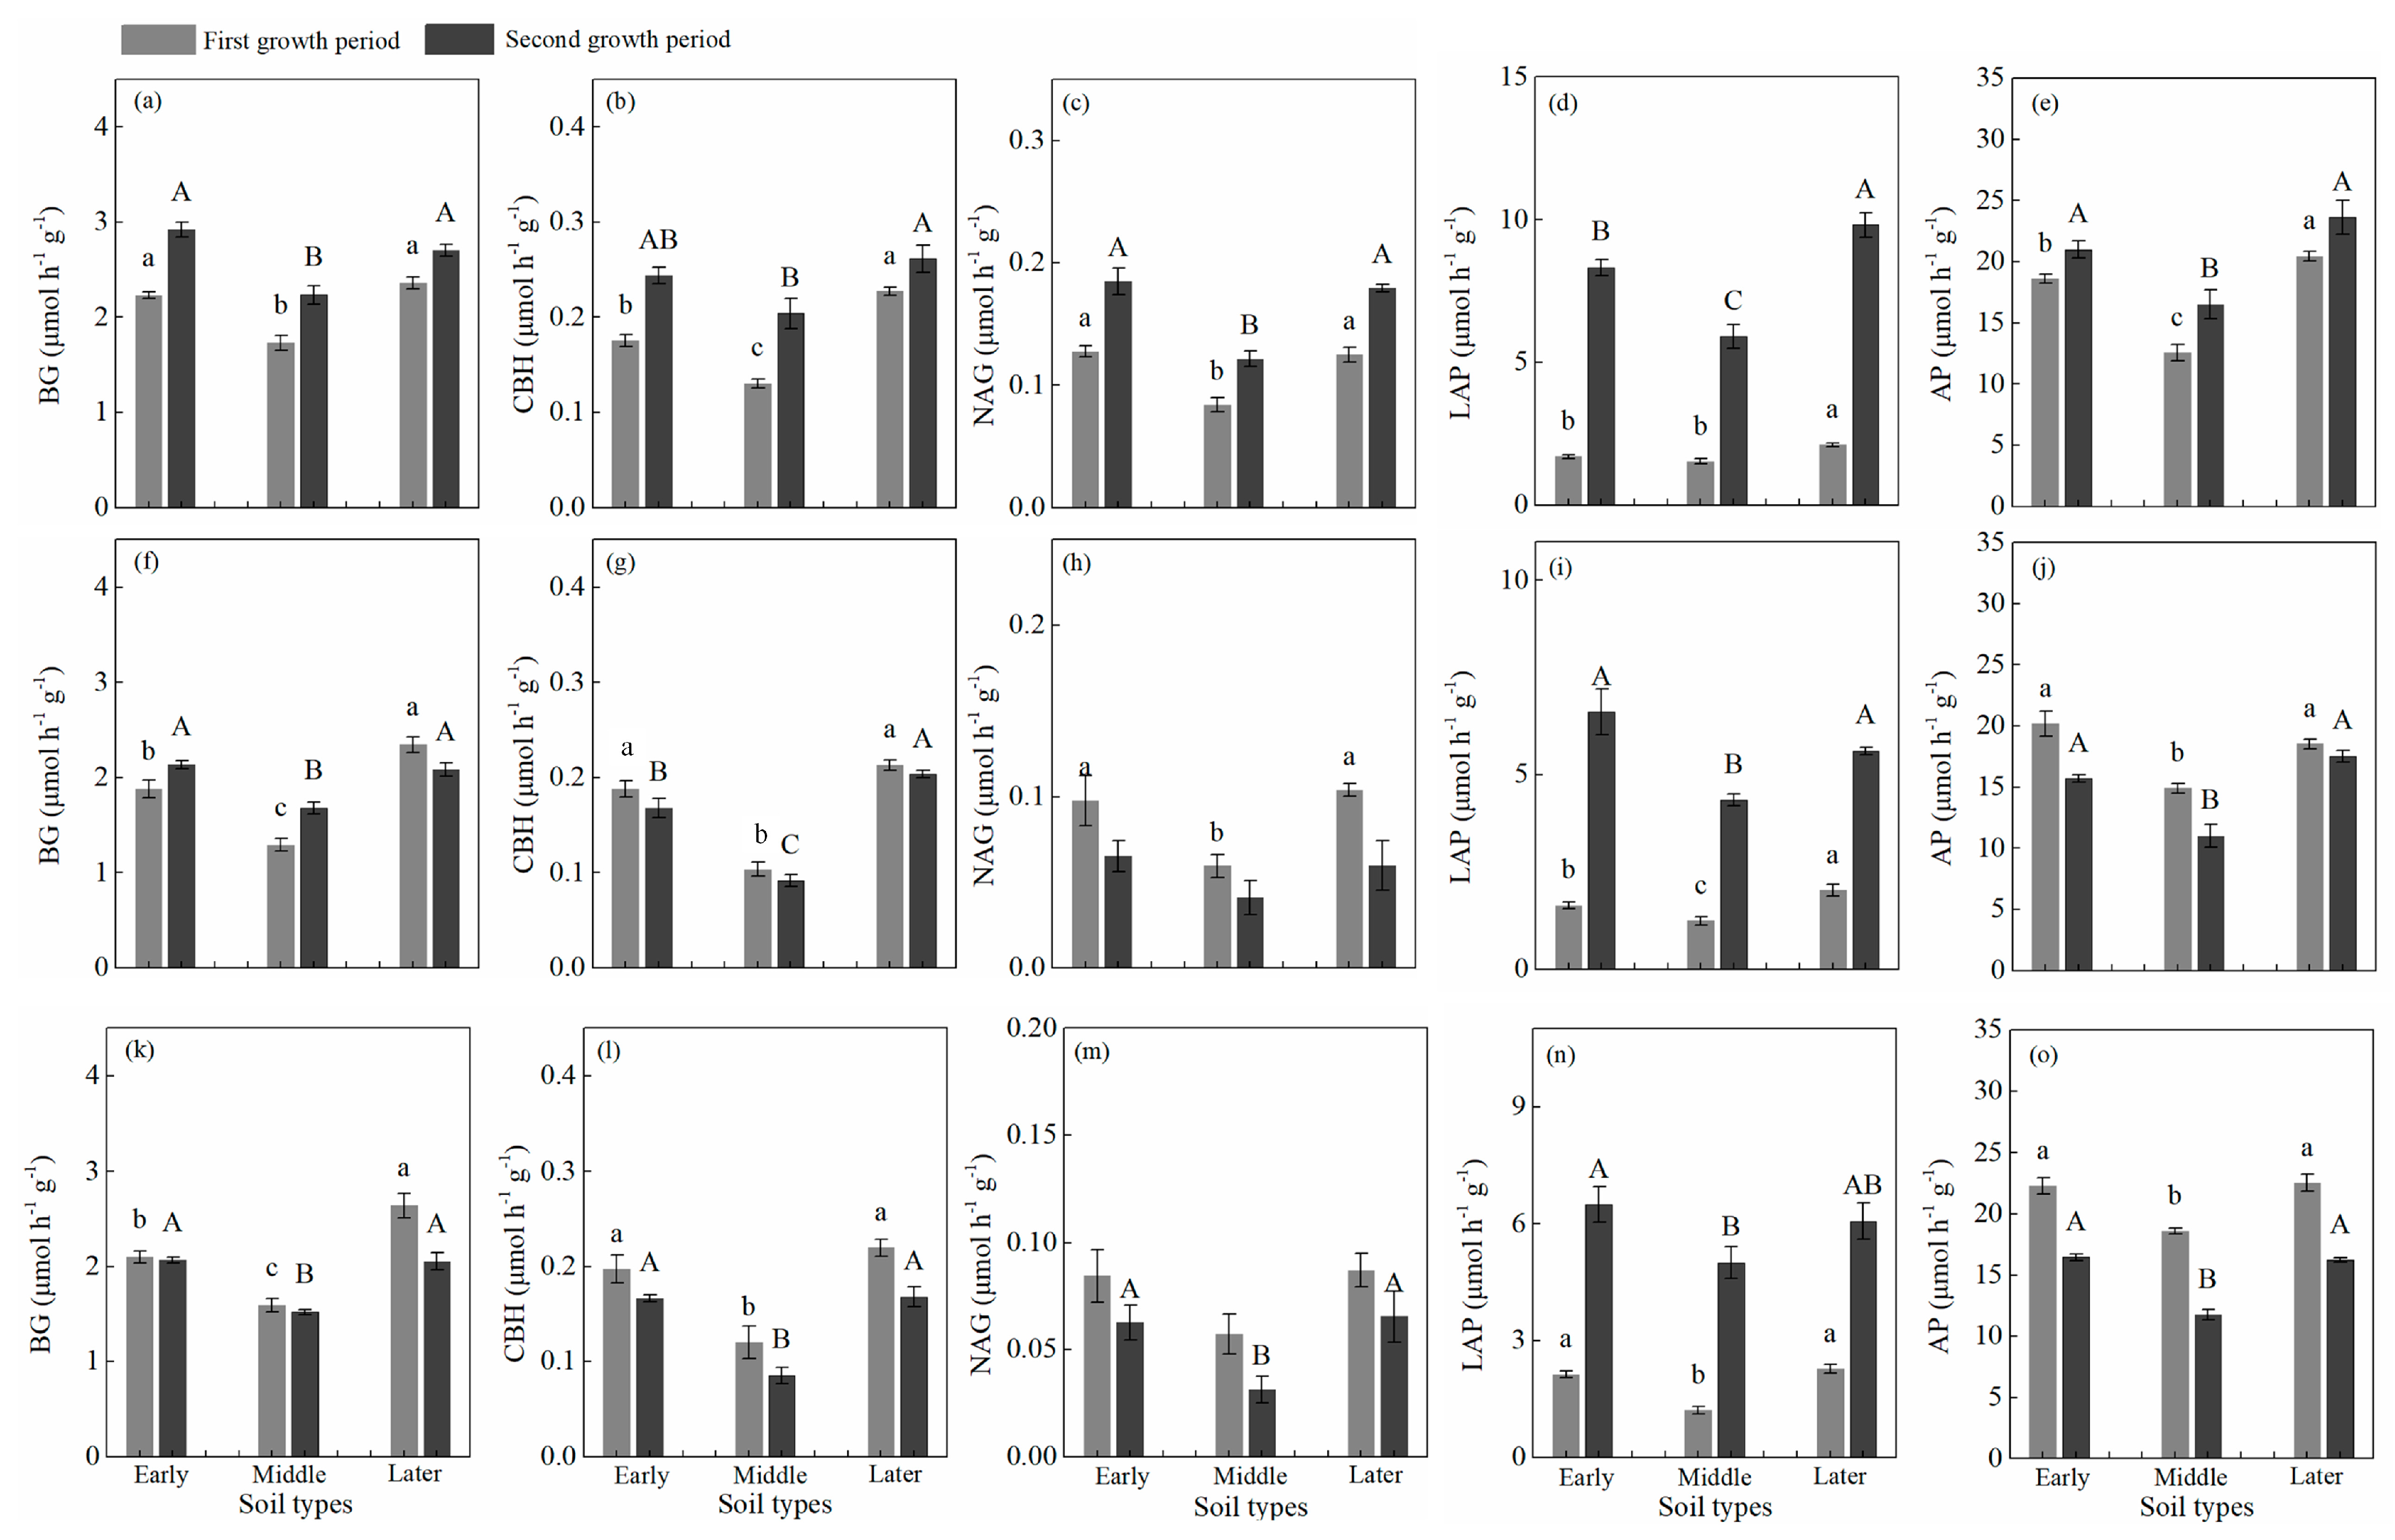
3.3. Soil Carbon, Nitrogen, and Phosphorus, Enzyme Activity, and Microbial Biomass

The SOC and TN contents were significantly higher in the early- and late-stage soils than in the middle-stage soil (Figure 4a–o). Additionally, the SOC, TP, and SAP contents in the early-, middle-, and late-stage soil in the second growth period were significantly lower than those in the first growth period (Table S5).
The enzyme activities of BG, CBH, NAG, LAP, and AP were higher in the early- and late-stage soils than in the middle-stage soil (Figure 5a–o). Additionally, in A. sacrorum, the BG, CBH, NAG, LAP, and AP activities were significantly higher in the second growth period than in the first growth period in the three soil stages. In A. capillaris, the activities of BG and LAP in the three soil stages and the activity of NAG in the early- and late-stage soils were significantly higher in the second growth period than in the first growth period. In A. giraldii, the activities of AP and LAP in the three soil stages and CBH in the middle- and late-stage soil were significantly higher in the second growth period than those in the first growth period (Table S6).
In the soils of the three companion plant species, MBC and MBN contents were generally higher in the early- and late-stage soils than in the middle-stage soil (Figure 6a–f). In the early soil stage, the MBC and MBN contents of the three companion plant species were significantly lower in the second growth period than those in the first growth period (Table S7).

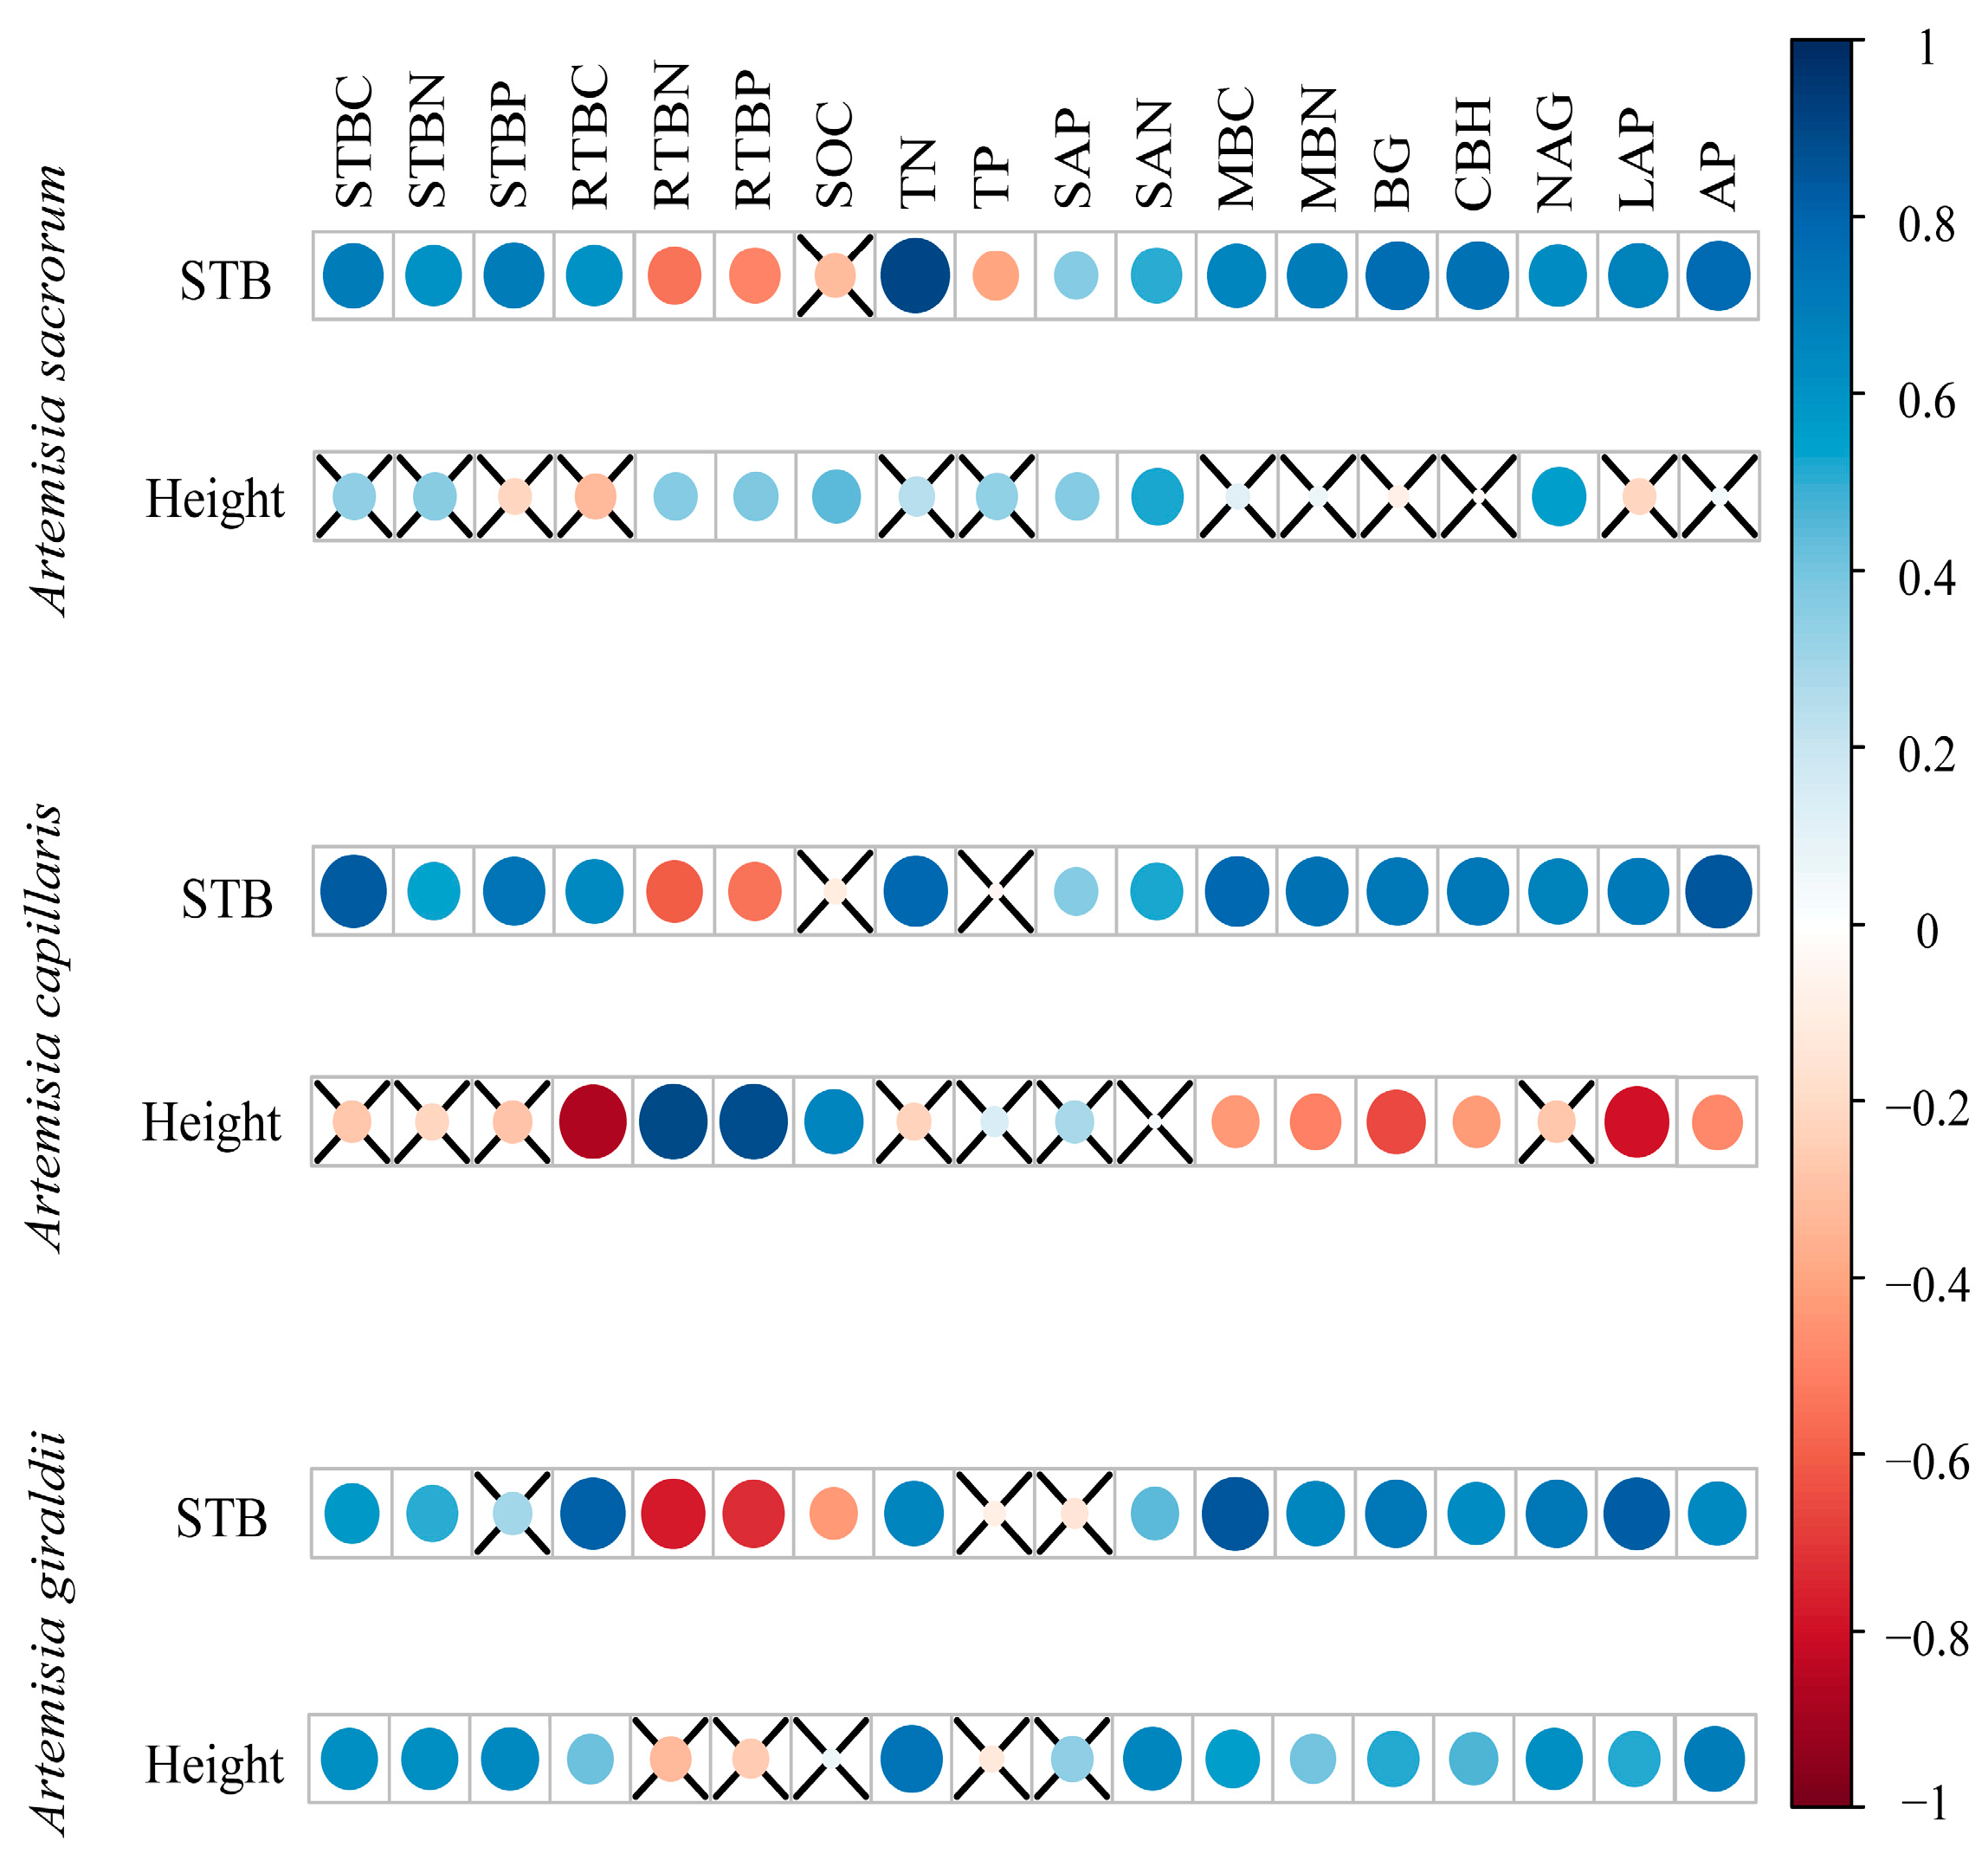
3.4. Correlation Analysis between Plant–Soil–Enzyme Activities and Plant Biomass

The results for A. sacrorum showed significant positive correlations between STB and the following factors: STBC, STBN, STBP, RTBC, TN, SAP, SAN, MBC, MBN, BG, CBH, NAG, LAP, and AP (p < 0.05). Moreover, plant height showed a significant and positive correlation with the following factors: RTBN, RTBP, TN, SAP, SAN, and CBH activities (p < 0.05). For A. capillaris, STB exhibited significant positive correlations (p < 0.05) with STBC, STBN, STBP, RTBC, TN, SAP, SAN, MBC, MBN, BG, CBH, NAG, LAP, and AP activity (p < 0.05). Additionally, plant height showed significant and positive correlations with RTBN, RTBP, and SOC (p < 0.05). Regarding A. giraldii, there were significant positive correlations between STB and STBC, STBN, STBC, TN, SAN, MBC, MBN, BG, CBH, NAG, LAP, and AP activity (p < 0.05). In addition, plant height was significantly and positively correlated with STBC, STBN, TN, MBC, MBN, BG, CBH, NAG, LAP, and AP activity (p < 0.05) (Figure 7).

4. Discussion

Observations of A. sacrorum, A. capillaris, and A. giraldii growth during the two growth periods revealed consistent responses in the soils of different successional stages. Specifically, plants grown in early- and late-stage soils exhibited a higher shoot biomass and plant height compared to those in middle-stage soil. This variation was primarily attributed to the higher soil nutrient content, microbial biomass, and enzyme activities in early- and late-stage soils than that in middle- stage soil [26]. Furthermore, the correlation analysis results indicated a significant positive relationship among shoot biomass, soil nutrient content, and enzyme activity for all three species. Moreover, plants grown in early- and late-stage soils demonstrated higher plant C and N contents, important indicators of their ability to cope with environmental stress. Generally, these indicators are strongly correlated with plant biomass [27,28], as confirmed in this study. Overall, a positive correlation was found between shoot biomass and plant C and N contents in all three species (Figure 7). Consequently, these three companion species grown in the early- and late-stage soils exhibited a strong growth advantage in this study.
Investigating PSF with companion species helps us to better understand changes in community composition and structure during plant community succession, as well as its driving role in community succession [15]. In this study, we observed negative PSF effects for all three species in the time series, indicating a strong inhibitory effect of the plant growth period on their companion species’ growth, which gradually increased over time. Plant growth influences the biotic and abiotic environments of the soil by altering soil structure and root secretions [29,30]. In other words, plant growth inevitably leaves residual effects on the soil, significantly altering its physical, chemical, and biological properties [31,32]. These residual soil effects can either promote or inhibit the growth of other plants [33,34]. Prior studies have reported that negative PSF effects are mainly attributed to soil resource depletion [32], a finding supported by other research [35,36]. Thus, the negative PSF effects observed in this study on A. sacrorum, A. capillaris, and A. giraldii could be attributed to an overall decrease in soil nutrient content and soil microbial biomass during the plant growth period. Furthermore, soil nutrient depletion negatively impacts soil microbe growth, as soil nutrients provide essential nutrition for microbes’ development [8]. Studies have shown that the interaction between soil nutrients and soil microbes can affect plant growth [33,37]. Hence, soil nutrient depletion may indirectly influence the negative PSF effects on plant species by reducing soil microbial activity. Additionally, soil microbial activity significantly affects soil nutrient cycling. Soil microorganisms, as essential decomposers in the ecosystem, facilitate the decomposition of dead roots and the cycling of soil nutrients [38]. Simultaneously, they decompose challenging-to-degrade substances into substances that plants can directly absorb and utilize [39]. However, soil microorganisms themselves are an active part of the soil organic matter [40], and their level of activity directly affects the soil’s nutrient content [30]. Consequently, significant reductions in soil microbial load and enzyme activity weaken soil nutrient cycling and restrict plant growth. Moreover, the correlation matrix results showed that the overall STB of the plants was positively correlated with soil nutrient content and microbial biomass (Figure 7), further supporting our hypothesis.
Plant C and N serve as structural and nutritional elements, respectively, and play important roles in plant growth [41,42]. This study found a significant positive correlation between STB and plant height and plant C and N content, with higher C and N contents in the first growth period. This suggests that a reduction in C and N storage capacities might limit plant growth to a certain extent, leading to a negative PSF. Previous studies have shown that dominant species have clear advantages over companion species in response to invasive species [16], mainly due to the inferiority of companion species during resource competition [16,18]. Conversely, dominant species occupy more ecological niches in the community [16] and thus exhibit clear advantages in resource competition over invasive species. Moreover, our previous studies have confirmed that PSF is negative, neutral, and positive for early-, middle-, and late-stage species, respectively, in the successional sequence [26,43]. This difference in the direction of feedback is mainly attributed to the effects of plant growth on soil nutrient content and microbial activity. Our findings indicate that companion species are at a disadvantage compared to dominant species, especially in later soil stages. This is mainly because companion species usually have a relatively low importance in the community and are at a disadvantage in terms of photosynthetic competition and soil nutrient use [18].

5. Conclusions

In this study, we systematically analyzed the PSF effects of the companion species of A. capillaris, A. sacrorum, and A. giraldii. Our results emphasize that the negative PSF of companion species explains the temporary advantage of species in the plant community and their eventual replacement by dominant species in successional sequences. The results of this study enhance our understanding of the mechanisms underlying PSF stability in community succession.

Supplementary Materials

The following supporting information can be downloaded at: https://www.mdpi.com/article/10.3390/f14081634/s1, Figure S1: Plant–soil feedback experiment design of companion species Artemisia sacrorum (As), Artemisia capillaris (Ac), and Artemisia giraldii (Ag); Table S1: Soil chemical of field soils that support early-, middle-, and late-successional species; Table S2: Soil microbial biomass and enzyme activity of field soils that support early-, middle-, and late-successional species; Table S3: F and p values of independent factors (plant growth period (P), species (S), and soil types (ST)) and their interactions to various parameters studied by a three-way ANOVA. Table S4: ANOVA analysis parameters of plant height during the plant growth period of Artemisia sacrorum, Artemisia capillaris, and Artemisia giraldii; Table S5: ANOVA analysis parameters of soil chemicals during growth of Artemisia sacrorum, Artemisia capillaris, and Artemisia giraldii; Table S6: ANOVA analysis parameters of soil enzyme activity during the plant growth of Artemisia sacrorum, Artemisia capillaris, and Artemisia giraldii; Table S7: ANOVA analysis parameters of soil microbial biomass during the plant growth of Artemisia sacrorum, Artemisia capillaris, and Artemisia giraldii.

Author Contributions

Conceptualization, L.Z. (Li Zhang), S.X. and H.X.; methodology, L.Z. (Linhui Zhang), L.H. and H.Z.; software, L.Z. (Linhui Zhang); validation, L.Z. (Linhui Zhang) and S.X.; data curation, H.X.; writing—original draft preparation, L.Z. (Li Zhang) and L.Z. (Linhui Zhang); writing—review and editing, S.X., M.W. and H.X.; visualization, L.Z. (Linhui Zhang). All authors have read and agreed to the published version of the manuscript.

Funding

This research was funded by the Shaanxi Science Fund for Distinguished Young Scholars (2021JC-50), the Shaanxi Province Innovation Capability Support Program Innovative Talent Promotion Program, the Ecological Restoration Innovation Team of the Loess Plateau (2023-CX-TD-37), and the Open Fund for the Key Lab of Land Degradation and Ecological Restoration in northwestern China of Ningxia University (LDER2023Z02).

Data Availability Statement

The data is available on request from the corresponding author.

Acknowledgments

We would like to thank Zhenfeng Xu and Bo Tan for providing statistics assistance.

Conflicts of Interest

The authors declare no conflict of interest. The founding sponsors had no role in the design of the study; in the collection, analysis, or interpretation of data; in the writing of the manuscript; or in the decision to publish the results.

References

  1. Marasco, A.; Giannino, F.; Iuorio, A. Modelling competitive interactions and plant-soil feedback in vegetation dynamics. Ric. Mat. 2020, 69, 553–577. [Google Scholar] [CrossRef]
  2. Zhang, J.; Ai, Z.; Xu, H.; Liu, H.; Wang, G.; Deng, L.; Liu, G.; Xue, S. Plant-microbial feedback in secondary succession of semiarid grasslands. Sci. Total Environ. 2021, 760, 143389. [Google Scholar] [CrossRef] [PubMed]
  3. Xu, H.; Ai, Z.; Qu, Q.; Wang, M.; Liu, G.; Xue, S. Invasibility and recoverability of a plant community following invasion depend on its successional stages. Soil Ecol. Lett. 2022, 4, 171–185. [Google Scholar] [CrossRef]
  4. Xu, H.; Qu, Q.; Li, P.; Guo, Z.; Wulan, E.; Xue, S. Stocks and Stoichiometry of Soil Organic Carbon, Total Nitrogen, and Total Phosphorus after Vegetation Restoration in the Loess Hilly Region, China. Forests 2019, 10, 27. [Google Scholar] [CrossRef] [Green Version]
  5. Liu, Y.; Dang, Z.; Tian, F.; Wang, D.; Wu, G. Soil organic carbon and inorganic carbon accumulation along a 30-year grassland restoration chronosequence in semi-arid regions (China). Land Degrad. Dev. 2017, 28, 189–198. [Google Scholar] [CrossRef]
  6. Xu, H.; Qu, Q.; Chen, Y.; Liu, G.; Xue, S. Responses of soil enzyme activity and soil organic carbon stability over time after cropland abandonment in different vegetation zones of the Loess Plateau of China. Catena 2021, 196, 104812. [Google Scholar] [CrossRef]
  7. Deng, L.; Liu, G.; Shangguan, Z. Land-use conversion and changing soil carbon stocks in China’s ‘Grain-for-Green’ Program: A synthesis. Glob. Chang. Biol. 2014, 20, 3544–3556. [Google Scholar] [CrossRef]
  8. Frouz, J.; Toyota, A.; Mudrak, O.; Jilkova, V.; Filipova, A.; Cajthaml, T. Effects of soil substrate quality, microbial diversity and community composition on the plant community during primary succession. Soil Biol. Biochem. 2016, 99, 75–84. [Google Scholar] [CrossRef]
  9. Bever, J.D.; Westover, K.M.; Antonovics, J. Incorporating the soil community into plant population dynamics: The utility of the feedback approach. J. Ecol. 1997, 85, 561–573. [Google Scholar] [CrossRef]
  10. Ehrenfeld, J.G.; Ravit, B.; Elgersma, K. Feedback in the plant-soil system. Annu. Rev. Env. Resour. 2005, 30, 75–115. [Google Scholar] [CrossRef] [Green Version]
  11. Bezemer, T.M.; van der Putten, W.H.; Martens, H.; van de Voorde, T.F.J.; Mulder, P.P.J.; Kostenko, O. Above- and below-ground herbivory effects on below-ground plant-fungus interactions and plant-soil feedback responses. J. Ecol. 2013, 101, 325–333. [Google Scholar] [CrossRef] [Green Version]
  12. Heinze, J.; Wacker, A.; Kulmatiski, A. Plant-soil feedback effects altered by aboveground herbivory explain plant species abundance in the landscape. Ecology 2020, 101, e03023. [Google Scholar] [CrossRef]
  13. Van der Putten, W.H.; Van Dijk, C.; Peters, B.A.M. Plant-specific soil-borne diseases contribute to succession in foredune vegetation. Nature 1993, 362, 53–56. [Google Scholar] [CrossRef]
  14. Jing, J.; Bezemer, T.M.; van der Putten, W.H. Complementarity and selection effects in early and mid-successional plant communities are differentially affected by plant-soil feedback. J. Ecol. 2015, 103, 641–647. [Google Scholar] [CrossRef]
  15. Kardol, P.; Bezemer, T.M.; van der Putten, W.H. Temporal variation in plant-soil feedback controls succession. Ecol. Lett. 2006, 9, 1080–1088. [Google Scholar] [CrossRef] [PubMed]
  16. Zhang, Z.; van Kleunen, M. Common alien plants are more competitive than rare natives but not than common natives. Ecol. Lett. 2019, 22, 1378–1386. [Google Scholar] [CrossRef]
  17. Crawford, K.M.; Bauer, J.T.; Comita, L.S.; Eppinga, M.B.; Johnson, D.J.; Mangan, S.A.; Queenborough, S.A.; Strand, A.E.; Suding, K.N.; Umbanhowar, J.; et al. When and where plant-soil feedback may promote plant coexistence: A meta-analysis. Ecol. Lett. 2019, 22, 1274–1284. [Google Scholar] [CrossRef] [PubMed]
  18. Yang, X.; Wang, X.P.; Qu, Y.B.; Wu, M.; Wang, J.L.; Wang, Z.L.; Wang, S.Q.; Zhao, N.X.; Gao, Y.B. Comparing the effects of companion species diversity and the dominant species (Stipa grandis) genotypic diversity on the biomass explained by plant functional trait. Ecol. Eng. 2019, 136, 17–22. [Google Scholar] [CrossRef]
  19. Bremner, J.M.; Mulvaney, C.S. Nitrogen-Total. In Methods of Soil Analysis, Part 2: Chemical and Microbiological Properties, 2nd ed.; Page, A.L., Ed.; ASA, SSSA: Madison, WI, USA, 1983; pp. 595–624. [Google Scholar]
  20. Nelson, D.W.; Sommers, L.E. Total carbon, organic carbon, and organic matter. In Methods of Soil Analysis: Part 2. Chemical and Microbial Properties, 2nd ed.; Page, A.L., Ed.; ASA, SSSA: Madison, WI, USA, 1983; pp. 539–579. [Google Scholar]
  21. Schade, J.D.; Kyle, M.; Hobbie, S.E.; Fagan, W.F.; Elser, J.J. Stoichiometric tracking of soil nutrients by a desert insect herbivore. Ecol. Lett. 2003, 6, 96–101. [Google Scholar] [CrossRef] [Green Version]
  22. Olsen, S.R.; Sommers, L.E. Phosphorus. In Methods of Soil Analysis, Part 2. Chemical and Microbial Properties, 2nd ed.; Page, A.L., Ed.; ASA, SSSA: Madison, WI, USA, 1983; pp. 403–430. [Google Scholar]
  23. Vance, E.D.; Brookes, P.C.; Jenkinson, D.S. An extraction method for measuring soil microbial biomass C. Soil Biol. Biochem. 1987, 19, 703–707. [Google Scholar] [CrossRef]
  24. Saiya-Cork, K.R.; Sinsabaugh, R.L.; Zak, D.R. The effects of long term nitrogen deposition on extracellular enzyme activity in an Acer saccharum forest soil. Soil Biol. Biochem. 2002, 34, 1309–1315. [Google Scholar] [CrossRef]
  25. Baxendal, C.; Orwin, K.H.; Poly, F.; Pommier, T.; Bardgett, R.D. Are plant-soil feedback responses explained by plant traits. New Phytol. 2014, 204, 408–423. [Google Scholar] [CrossRef] [PubMed]
  26. Qu, Q.; Xu, H.; Wang, M.; Liu, G.; Xue, S. Plant-soil feedback plays an important role in the progression of plant community succession. J. Plant Nutr. Soil Sci. 2023, 186, 169–176. [Google Scholar] [CrossRef]
  27. Martinez-Luscher, J.; Kurtural, S.K. Same season and carry-over effects of source-sink adjustments on grapevine yields and non-structural carbohydrates. Front. Plant Sci. 2021, 12, 695319. [Google Scholar] [CrossRef] [PubMed]
  28. Perkovich, C.; Ward, D. Aboveground herbivory causes belowground changes in twelve oak Quercus species: A phylogenetic analysis of root biomass and non-structural carbohydrate storage. Oikos 2021, 130, 1797–1812. [Google Scholar] [CrossRef]
  29. Mahaming, A.R.; Mills, A.A.S.; Adl, S.M. Soil community changes during secondary succession to naturalized grasslands. Appl. Soil Ecol. 2009, 41, 137–147. [Google Scholar] [CrossRef]
  30. Xiao, L.; Liu, G.; Li, P.; Li, Q.; Xue, S. Ecoenzymatic stoichiometry and microbial nutrient limitation during secondary succession of natural grassland on the Loess Plateau, China. Soil Tillage Res. 2020, 200, 104605. [Google Scholar] [CrossRef]
  31. Harrison, K.A.; Bardgett, R.D. Influence of plant species and soil conditions on plant-soil feedback in mixed grassland communities. J. Ecol. 2010, 98, 384–395. [Google Scholar] [CrossRef]
  32. Bennett, J.A.; Klironomos, J. Mechanisms of plant-soil feedback: Interactions among biotic and abiotic drivers. New Phytol. 2019, 222, 91–96. [Google Scholar] [CrossRef] [Green Version]
  33. van de Voorde, T.F.J.; van der Putten, W.H.; Bezemer, T.M. Intra- and interspecific plant-soil interactions, soil legacies and priority effects during old-field succession. J. Ecol. 2011, 99, 945–953. [Google Scholar] [CrossRef]
  34. De Long, J.R.; Heinen, R.; Jongen, R.; Hannula, S.E.; Huberty, M.; Kielak, A.M.; Steinauer, K.; Martijn Bezemer, T. How plant-soil feedbacks influence the next generation of plants. Ecol. Res. 2021, 36, 32–44. [Google Scholar] [CrossRef]
  35. Bennett, J.A.; Maherali, H.; Reinhart, K.O.; Lekberg, Y.; Hart, M.M.; Klironomos, J. Plant-soil feedbacks and mycorrhizal type influence temperate forest population dynamics. Science 2017, 355, 181–184. [Google Scholar] [CrossRef]
  36. Fujii, K.; Shibata, M.; Kitajima, K.; Ichie, T.; Kitayama, K.; Turner, B.L. Plant-soil interactions maintain biodiversity and functions of tropical forest ecosystems. Ecol. Res. 2018, 33, 149–160. [Google Scholar] [CrossRef]
  37. González-López, O.; Ruano-Rosa, D. Root exudates, a key factor in the plant-bacteria interaction mechanisms. In Molecular Aspects of Plant Beneficial Microbes in Agriculture; Sharma, V., Salwan, R., Al-Ani, L.K.T., Eds.; Academic Press: Cambridge, MA, USA, 2020; pp. 111–121. [Google Scholar]
  38. Bray, S.R.; Kitajima, K.; Sylvia, D.M. Mycorrhizae differentially alter growth, physiology, and competitive ability of an invasive shrub. Ecol. Appl. 2003, 13, 565–574. [Google Scholar] [CrossRef]
  39. Zheng, L.; Chen, H.; Wang, Y.; Mao, Q.; Zheng, M.; Su, Y.; Xiao, K.; Wang, K.; Li, D. Responses of soil microbial resource limitation to multiple fertilization strategies. Soil Tillage Res. 2020, 196, 104474. [Google Scholar] [CrossRef]
  40. Ren, C.; Zhang, W.; Zhong, Z.; Han, X.; Yang, G.; Feng, Y.; Ren, G. Differential responses of soil microbial biomass, diversity, and compositions to altitudinal gradients depend on plant and soil characteristics. Sci. Total Environ. 2018, 610–611, 750–758. [Google Scholar] [CrossRef] [PubMed]
  41. Elser, J.J.; Fagan, W.F.; Kerkhoff, A.J.; Swenson, N.G.; Enquist, B.J. Biological stoichiometry of plant production: Metabolism, scaling and ecological response to global change. New Phytol. 2010, 186, 593–608. [Google Scholar] [CrossRef] [PubMed] [Green Version]
  42. LeBauer, D.S.; Treseder, K.K. Nitrogen limitation of net primary productivity in terrestrial ecosystems is globally distributed. Ecology 2008, 89, 371–379. [Google Scholar] [CrossRef] [Green Version]
  43. Ai, Z.; Li, J.; Li, X.; Zhang, J.; Liu, H.; Xu, H.; Liu, G.; Xue, S. Plant traits variably respond to plant–soil interactions during secondary succession on the Loess Plateau. Forests 2023, 14, 726. [Google Scholar] [CrossRef]
Figure 1. Shoot and root biomass for Artemisia sacrorum (As, a,d), Artemisia capillaris (Ac, b,e), and Artemisia giraldii (Ag, c,f) over the two growth periods (refers to the first and second years of the experiment hereafter). Different letters indicate significant differences in the mean biomass among the three soil types based on a Tukey post-hoc test (p < 0.05), and asterisks indicate significant differences between growth periods (*** p < 0.001, ** p < 0.01).
Forests 14 01634 g001
Figure 2. Plant height for Artemisia sacrorum (As, a,d), Artemisia capillaris (Ac, b,e), and Artemisia giraldii (Ag, c,f) over the two growth periods. Different letters indicate significant differences in mean plant height among the three soil types based on a Tukey post-hoc test (p < 0.05).
Forests 14 01634 g002
Figure 3. Plant–soil feedback (PSF) index of Artemisia sacrorum (As, a), Artemisia capillaris (Ac, b), and Artemisia giraldii (Ag, c). Different letters indicate significant differences in PSF index among the three soil types based on a Tukey post-hoc test (p < 0.05).
Forests 14 01634 g003
Figure 4. Soil chemistry of Artemisia sacrorum (ae), Artemisia capillaris (fj), and Artemisia giraldii (ko). Different letters indicate significant differences in soil chemicals among the three soil types based on a Tukey post-hoc test (p < 0.05). SOC, soil organic carbon; TN, soil total nitrogen; TP, soil total phosphorus; SAP, soil available phosphorus; SAN, soil available nitrogen.
Forests 14 01634 g004
Figure 5. Soil enzyme activities of Artemisia sacrorum (ae), Artemisia capillaris (fj), and Artemisia giraldii (ko). Different letters indicate significant differences in enzyme activity among the three soil types based on a Tukey post-hoc test (p < 0.05). BG, β-1,4-glucosidase; CBH, cellobiose hydrolase; NAG, β-1,4-acetyl-glucosamine glycosidase; LAP, leucine aminopeptidase; AP, phosphatase.
Forests 14 01634 g005
Figure 6. Soil microbial biomass of Artemisia sacrorum (a,d) Artemisia capillaris (b,e), and Artemisia giraldii (c,f). Different letters indicate significant differences in soil microbial biomass among the three soil types based on a Tukey post-hoc test (p < 0.05). MBC, microbial biomass carbon; MBN, microbial biomass nitrogen.
Forests 14 01634 g006
Figure 7. Correlation network analysis of plant and soil characteristics of Artemisia sacrorum, Artemisia capillaris, and Artemisia giraldii. ×, not significant. STB, shoot biomass; STBC, shoot biomass carbon; STBN, shoot biomass nitrogen; STBP, shoot biomass phosphorus; RTBC, root biomass carbon; RTBN, root biomass nitrogen; RTBP, root biomass phosphorus; SOC, soil organic carbon; TN, soil total nitrogen; TP, soil total phosphorus; SAP, soil available phosphorus; SAN, soil available nitrogen; MBC, microbial biomass carbon; MBN, microbial biomass nitrogen; BG, β-1,4-glucosidase; CBH, cellobiose hydrolase; NAG, β-1,4-acetyl-glucosamine glycosidase; LAP, leucine aminopeptidase; AP, phosphatase.
Forests 14 01634 g007
Table 1. Mean (± SE) shoot biomass C, N, and P contents of Artemisia sacrorum, Artemisia capillaris, and Artemisia giraldii.
Growth PeriodSpeciesSoil TypesSTBC
(g kg−1)
STBN
(g kg−1)
STBP
(g kg−1)
FirstA. sacrorumEarly434.85 ± 13.02 a ***9.26 ± 0.35 a **2.14 ± 0.07 b ***
Middle363.60 ± 5.90 b **7.51 ± 0.44 b1.81 ± 0.05 c ***
Late428.20 ± 3.91 a ***9.54 ± 0.26 a **2.45 ± 0.05 a ***
A. capillarisEarly438.20 ± 7.65 a ***9.80 ± 0.76 b **1.74 ± 0.04 a ***
Middle323.46 ± 5.55 c7.11 ± 0.07 c *0.66 ± 0.22 b
Late391.98 ± 6.10 b ***11.72 ± 0.28 a **1.67 ± 0.04 a ***
A. giraldiiEarly433.92 ± 3.67 a **9.80 ± 0.31 ab **1.12 ± 0.09 b
Middle403.79 ± 7.15 c *8.34 ± 0.40 b *0.49 ± 0.04 c **
Late452.30 ± 3.01 a ***10.15 ± 0.48 a1.81 ± 0.15 a **
SecondA. sacrorumEarly407.65 ± 4.46 A8.70 ± 0.25 A1.10 ± 0.1 A
Middle325.11 ± 8.87 C7.01 ± 0.49 B0.76 ± 0.06 B
Late381.38 ± 4.53 B8.34 ± 0.10 A1.24 ± 0.05 A
A. capillarisEarly377.59 ± 3.80 A8.02 ± 0.23 B1.08 ± 0.04 A
Middle305.00 ± 6.97 C6.57 ± 0.21 C0.67 ± 0.02 C
Late329.32 ± 4.56 B9.86 ± 0.23 A0.94 ± 0.03 B
A. giraldiiEarly416.95 ± 2.53 A8.52 ± 0.13 B1.11 ± 0.02 A
Middle376.67 ± 7.16 B7.34 ± 0.12 C0.72 ± 0.01 B
Late411.87 ± 6.53 A9.21 ± 0.08 A1.05 ± 0.04 A
Different letters indicate significant differences in mean C, N, and P among the three soil types based on a Tukey post-hoc test. Asterisks indicate significant differences between growth periods (*** p < 0.001, ** p < 0.01, * p < 0.05). STBC, shoot biomass carbon; STBN, shoot biomass nitrogen; STBP, shoot biomass phosphorus.
Table 2. Mean (± SE) root biomass C, N, and P contents of Artemisia sacrorum, Artemisia capillaris, and Artemisia giraldii.
Growth PeriodSpeciesSoil TypesRTBC
(g kg−1)
RTBN
(g kg−1)
RTBP
(g kg−1)
FirstA. sacrorumEarly367.99 ± 1.08 b ***8.78 ± 0.25 a ***0.57 ± 0.04 a ***
Middle323.81 ± 5.24 c ***5.54 ± 0.46 b ***0.31 ± 0.05 b ***
Late401.89 ± 9.25 a ***7.79 ± 0.26 a ***0.58 ± 0.00 a ***
A. capillarisEarly370.16 ± 1.66 a ***7.80 ± 0.06 a ***0.55 ± 0.00 a ***
Middle345.42 ± 7.07 b ***5.94 ± 0.4 b ***0.45 ± 0.00 b ***
Late376.50 ± 8.64 a ***7.96 ± 0.2 a ***0.59 ± 0.01 a ***
A. giraldiiEarly366.62 ± 7.18 a ***9.02 ± 0.77 a ***0.61 ± 0.08 ***
Middle318.49 ± 0.94 b ***6.05 ± 0.08 b ***0.43 ± 0.01 ***
Late362.53 ± 10.43 a ***8.06 ± 0.35 ab ***0.51 ± 0.02 ***
SecondA. sacrorumEarly348.67 ± 3.39 A7.10 ± 0.25 A0.46 ± 0.03
Middle312.33 ± 4.58 B5.38 ± 0.15 B0.42 ± 0.03
Late334.42 ± 5.01 A6.63 ± 0.17 A0.44 ± 0.01
A. capillarisEarly354.78 ± 7.94 A6.74 ± 0.34 A1.07 ± 0.02 A
Middle327.39 ± 2.95 B5.31 ± 0.13 B0.69 ± 0.01 C
Late351.72 ± 4.34 A6.69 ± 0.12 A0.89 ± 0.04 B
A. giraldiiEarly334.69 ± 4.02 A8.01 ± 0.15 A1.12 ± 0.03 A
Middle307.35 ± 7.27 B5.62 ± 0.17 C0.86 ± 0.01 B
Late338.28 ± 2.36 A6.95 ± 0.17 B0.86 ± 0.02 B
Different letters indicate significant differences in mean C, N, and P among the three soil types based on a Tukey post-hoc test. Asterisks indicate significant differences between growth periods (*** p < 0.001). RTBC, root biomass carbon; RTBN, root biomass nitrogen; RTBP, root biomass phosphorus.
Disclaimer/Publisher’s Note: The statements, opinions and data contained in all publications are solely those of the individual author(s) and contributor(s) and not of MDPI and/or the editor(s). MDPI and/or the editor(s) disclaim responsibility for any injury to people or property resulting from any ideas, methods, instructions or products referred to in the content.

