

Predicting the Unpredictable: Predicting Landcover in Boreal Alaska and the Yukon Including Succession and Wildfire Potential


Abstract
:1. Introduction
2. Materials and Methods
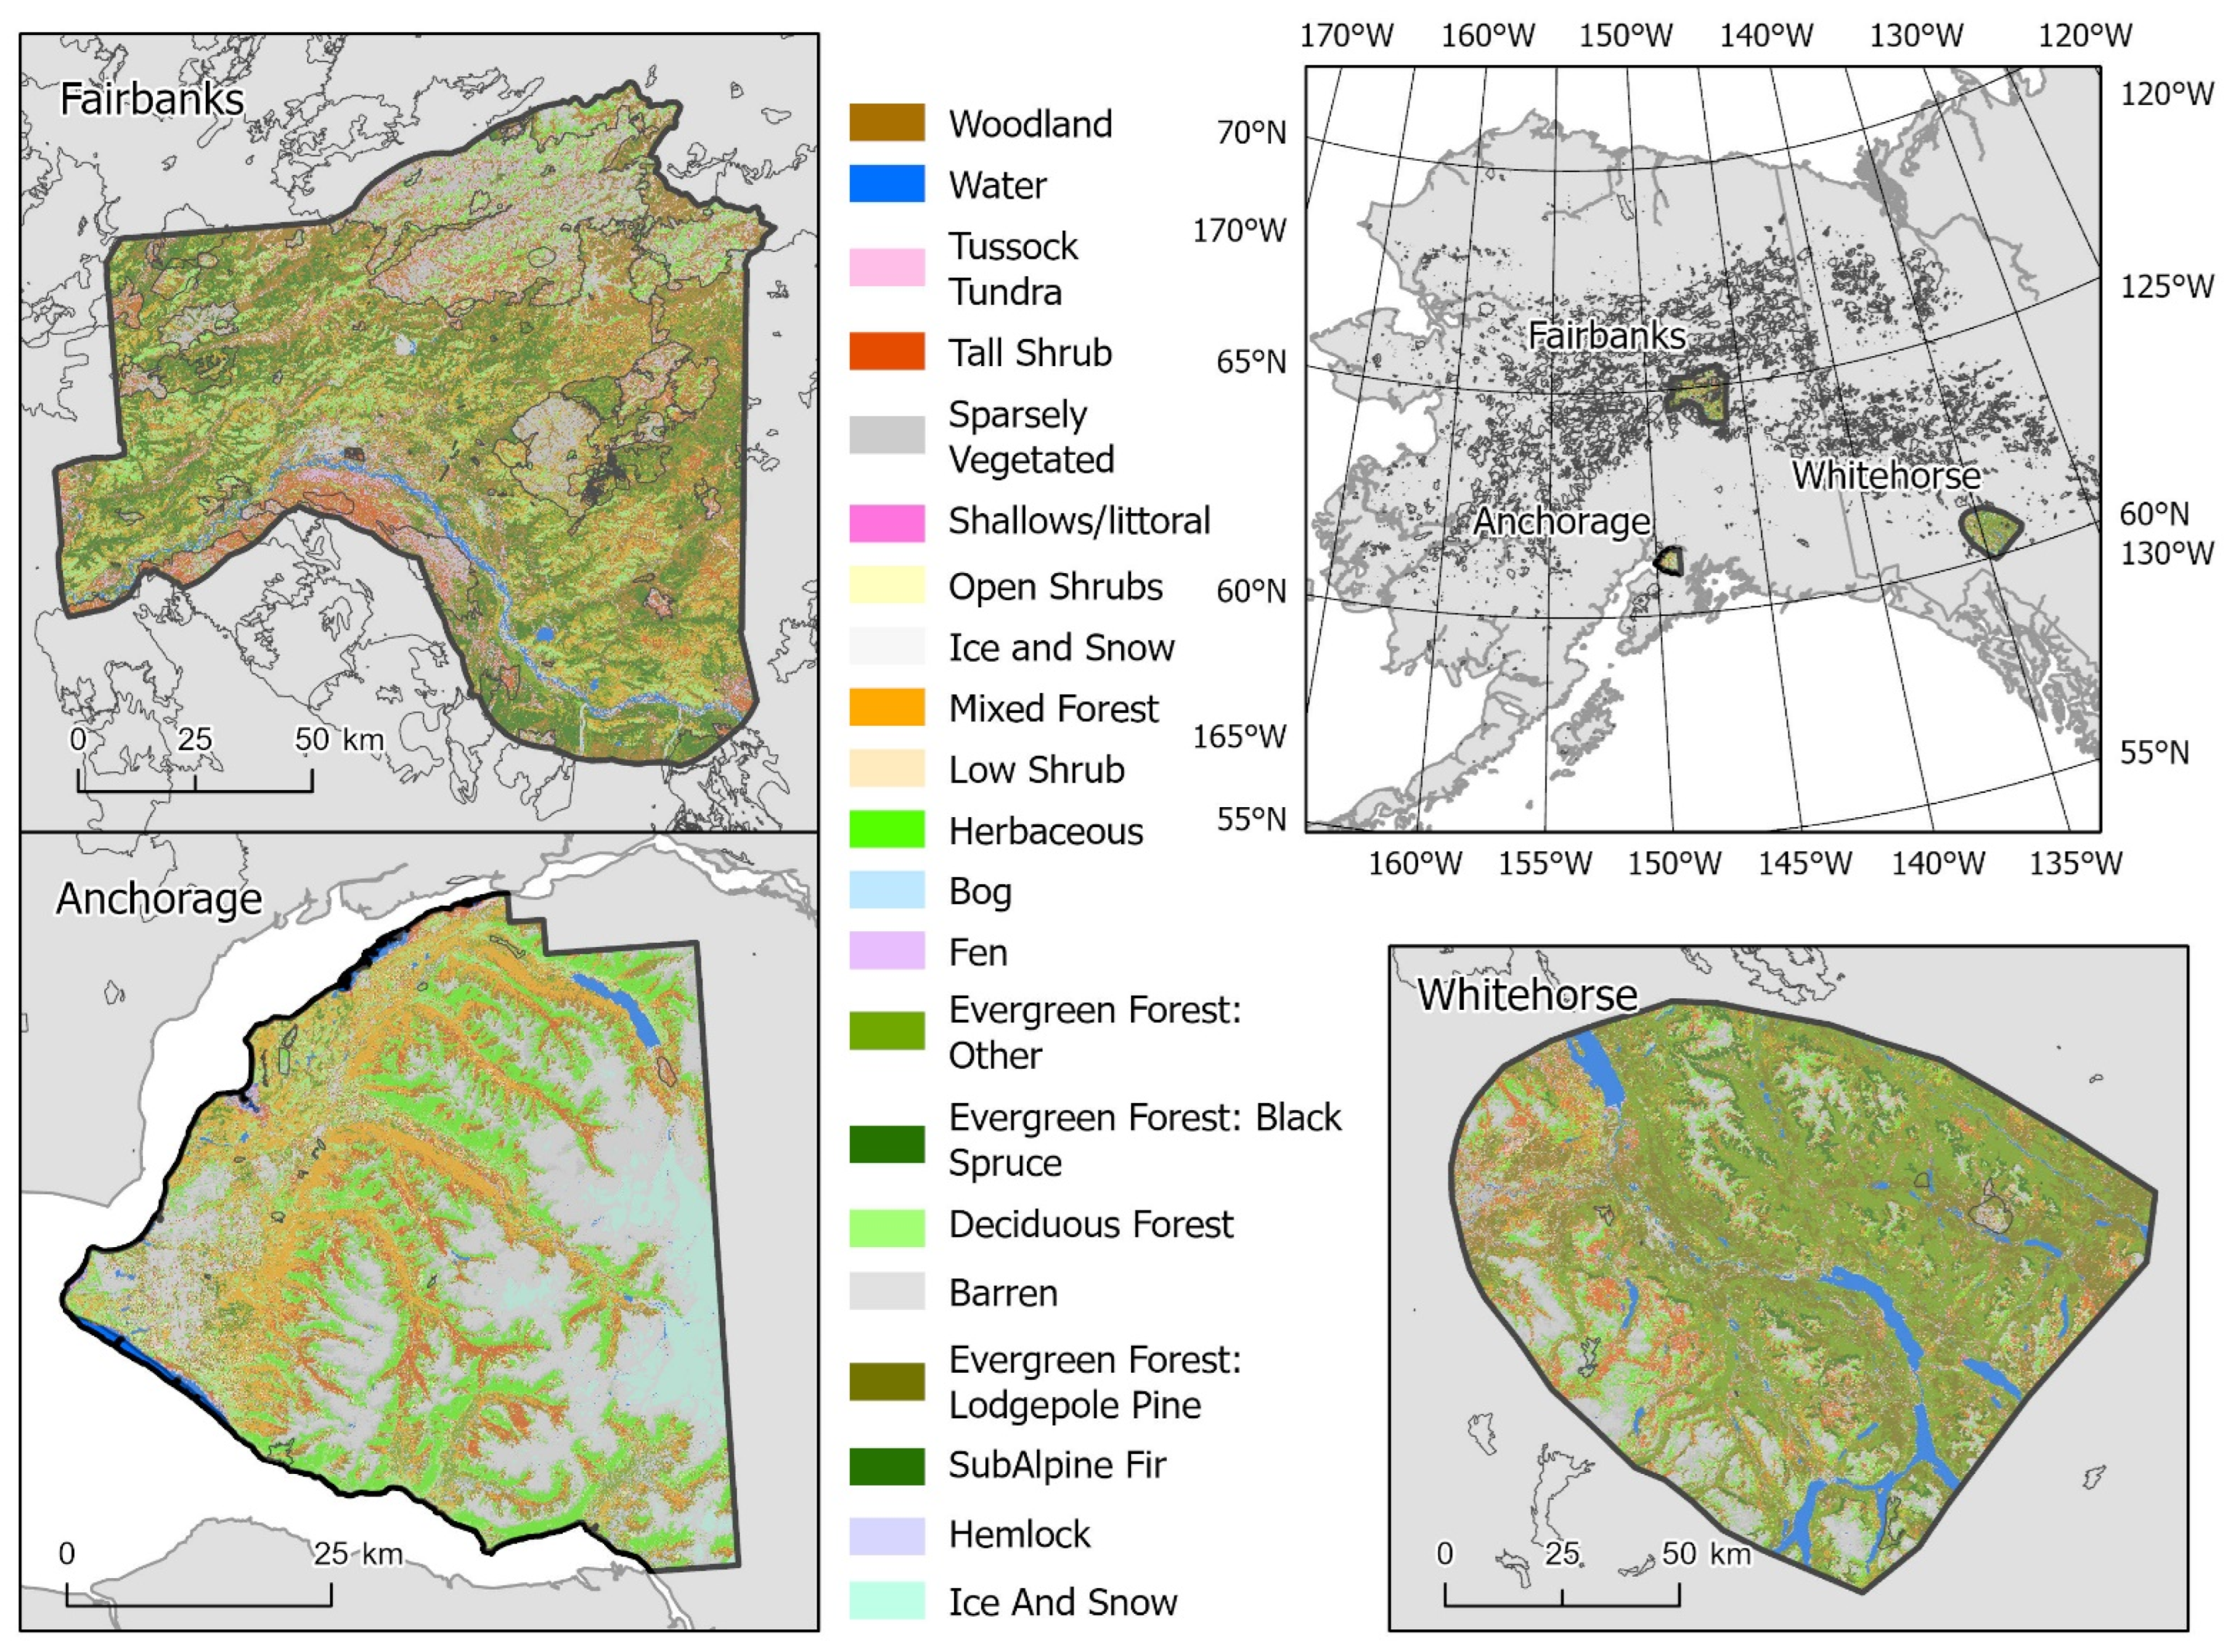
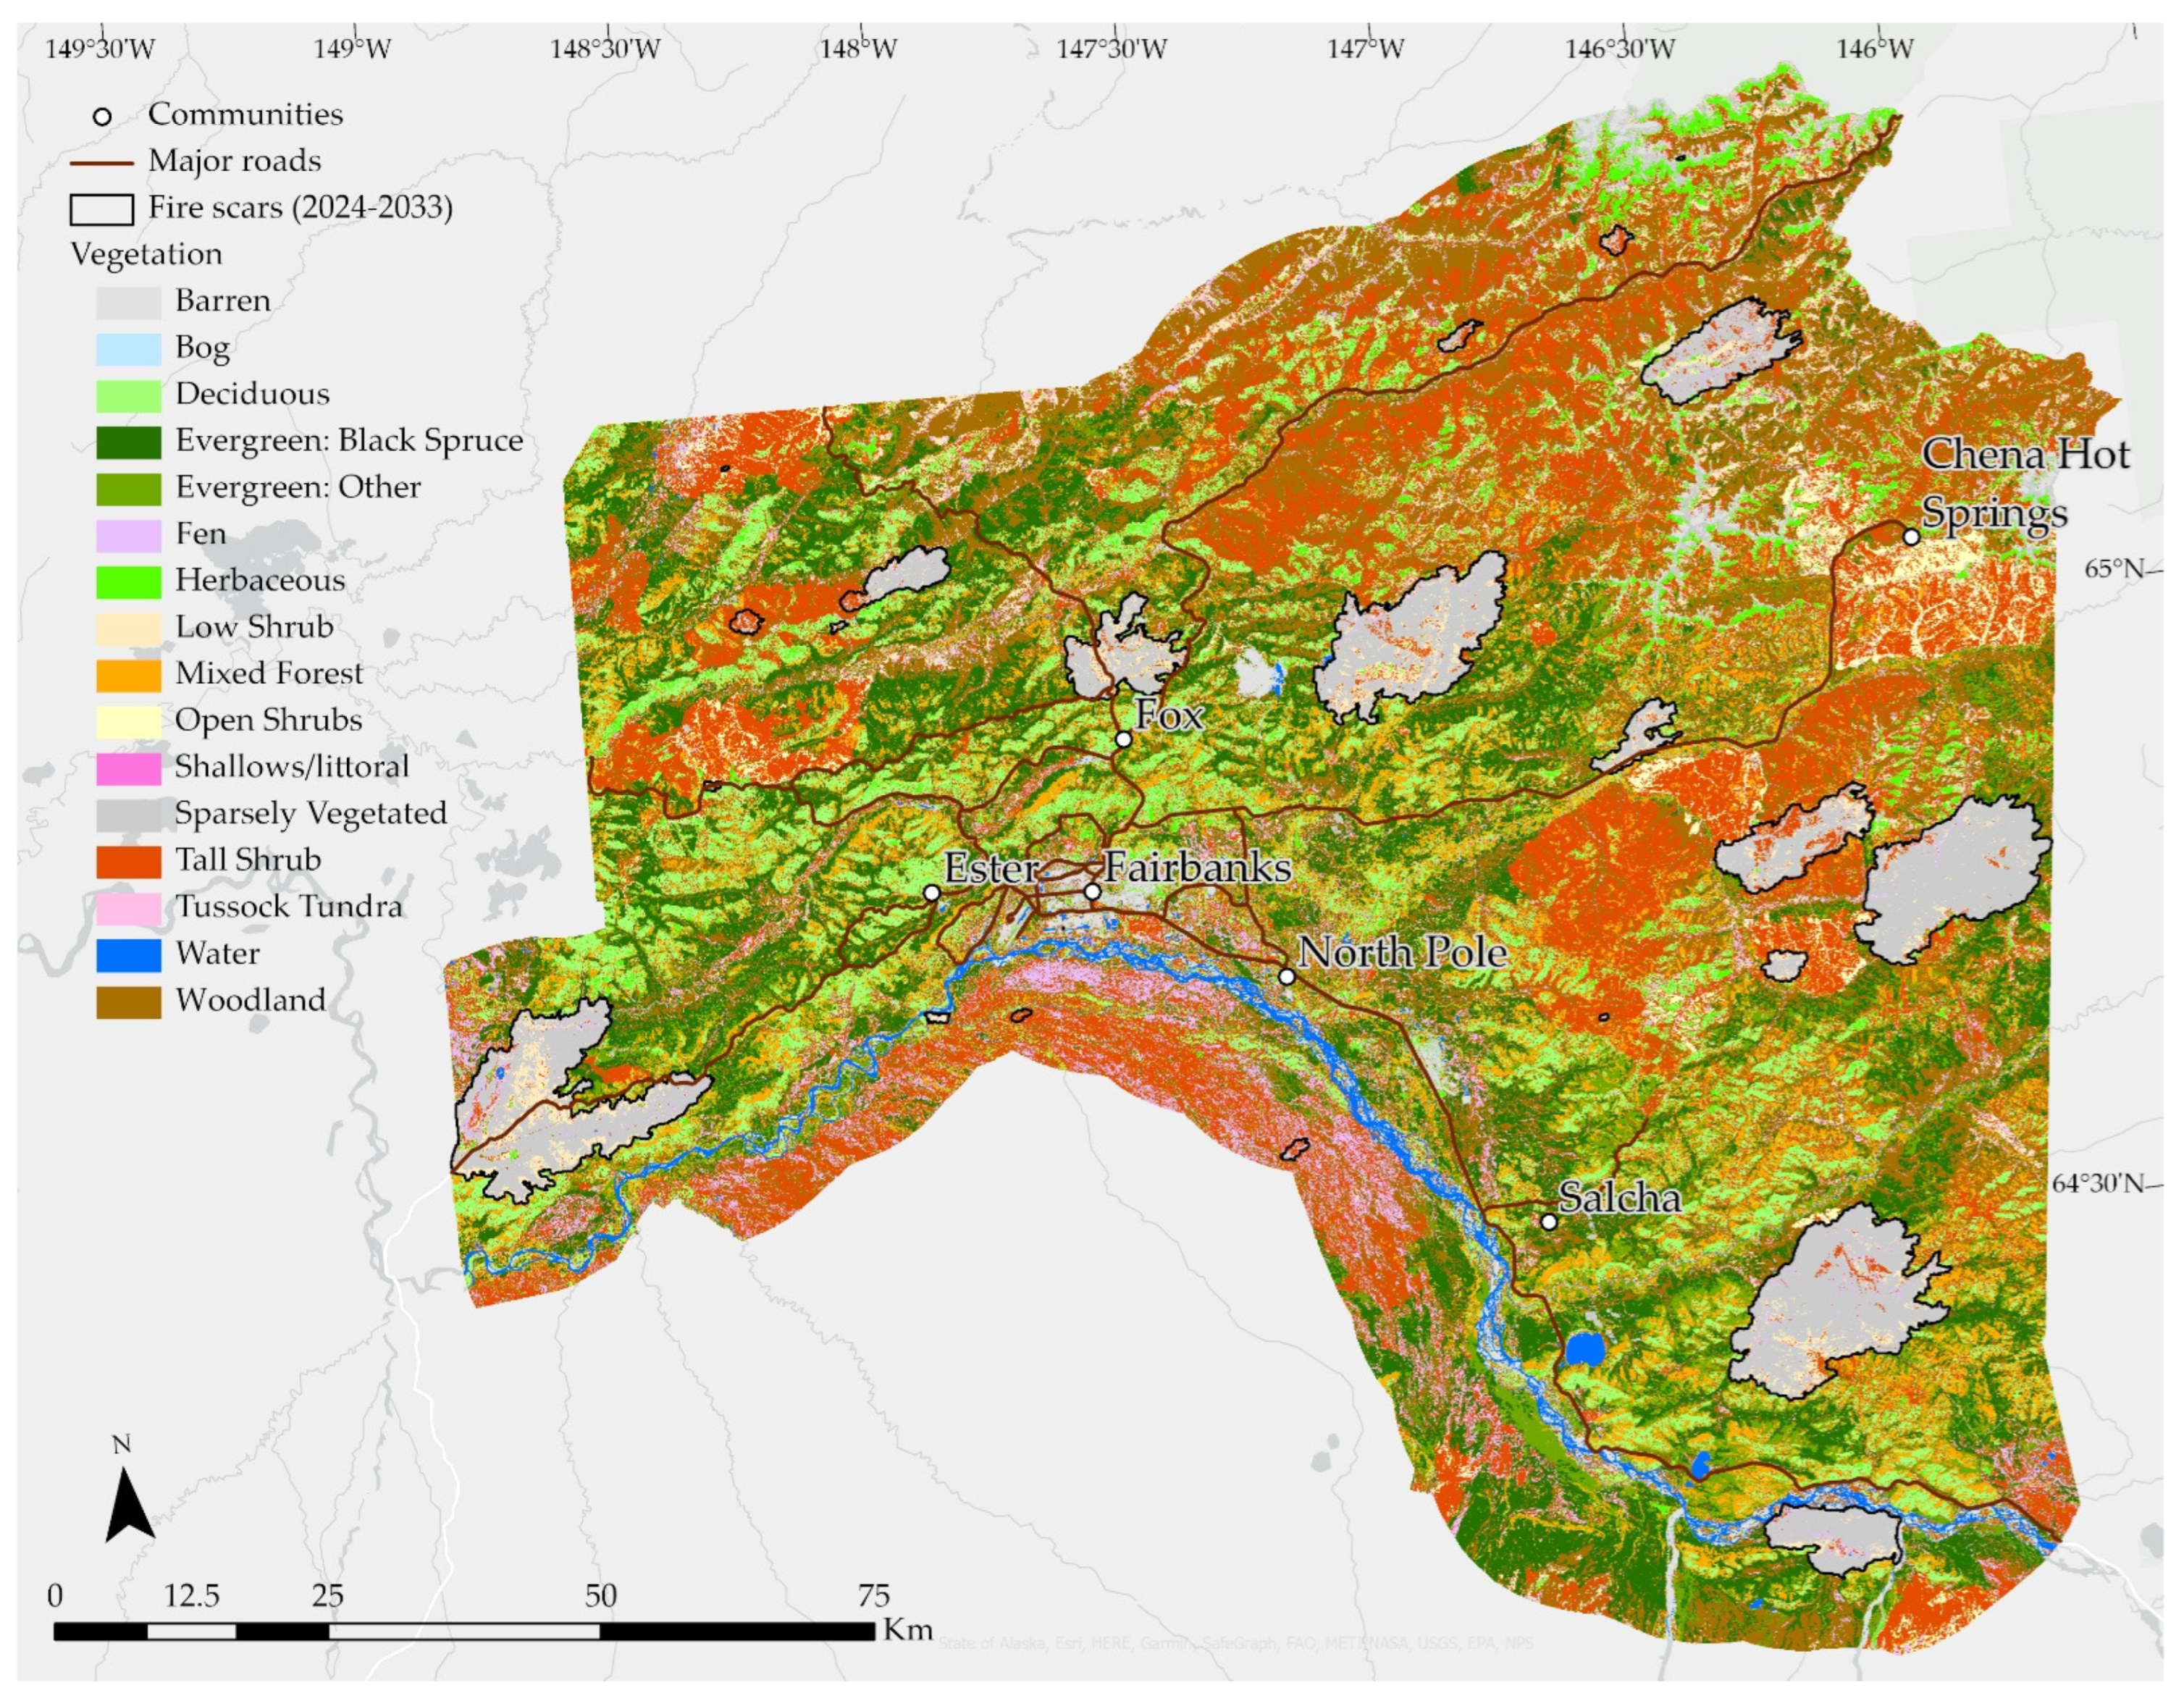
2.1. Study Areas

| Study Area | Population | Area (km2) | Area Burned (km2, %) |
|---|---|---|---|
| Anchorage, AK | 288,121 | 2703.84 | 18.43, 0.68 |
| Fairbanks, AK | 95,593 | 13,822.02 | 4190.75, 30.32 |
| Whitehorse, YK | 31,913 | 12,305.27 | 102.85, 0.84 |
2.2. Landcover Modeling
- A refinement of ABoVE’s Evergreen Forest category into different types of needle leaf species relevant to wildfire potential using several predictors in a compound modeling approach for the year with the best cross-reference data. We then applied this refined model to existing ABoVE data for the remaining years of 1984, 1994, 2004, and 2014 and used a succession sequence based on analyses of existing ABoVE data to simulate recovery after fire disturbance.
- A future wildfire and vegetation prediction approach that used the historic fire record as reference, Monte Carlo simulations to represent expected future area burned, FlamMap’s Burn Probability module to randomly identify future large fire locations and perimeters, and succession rules derived from ABoVE data to guide burned area revegetation.
2.2.1. Refinement of the ABoVE Classification
- If the pixel remains classified as evergreen forest, then the modeled classification remains the same.
- If the pixel’s ABoVE classification changes to the evergreen forest category, then we use the trained machine learning model to refine that category.
2.2.2. Model Predictors, Testing, and Validation
- (For all three study areas) Topology: elevation, aspect (split into north–south and east–west components), and slope;
- (For Anchorage and Fairbanks) Wetland status using NWI GEN data [59];
- (For Fairbanks) Time since last fire for the year of interest from the Alaska large perimeter database (https://fire.ak.blm.gov/ (accessed on 1 January 2023)) and Canadian National Fires Database [60];
- (For Fairbanks) Soil information from the SSURGO database [59]: annual water storage, groundwater water pH, and topsoil pH.
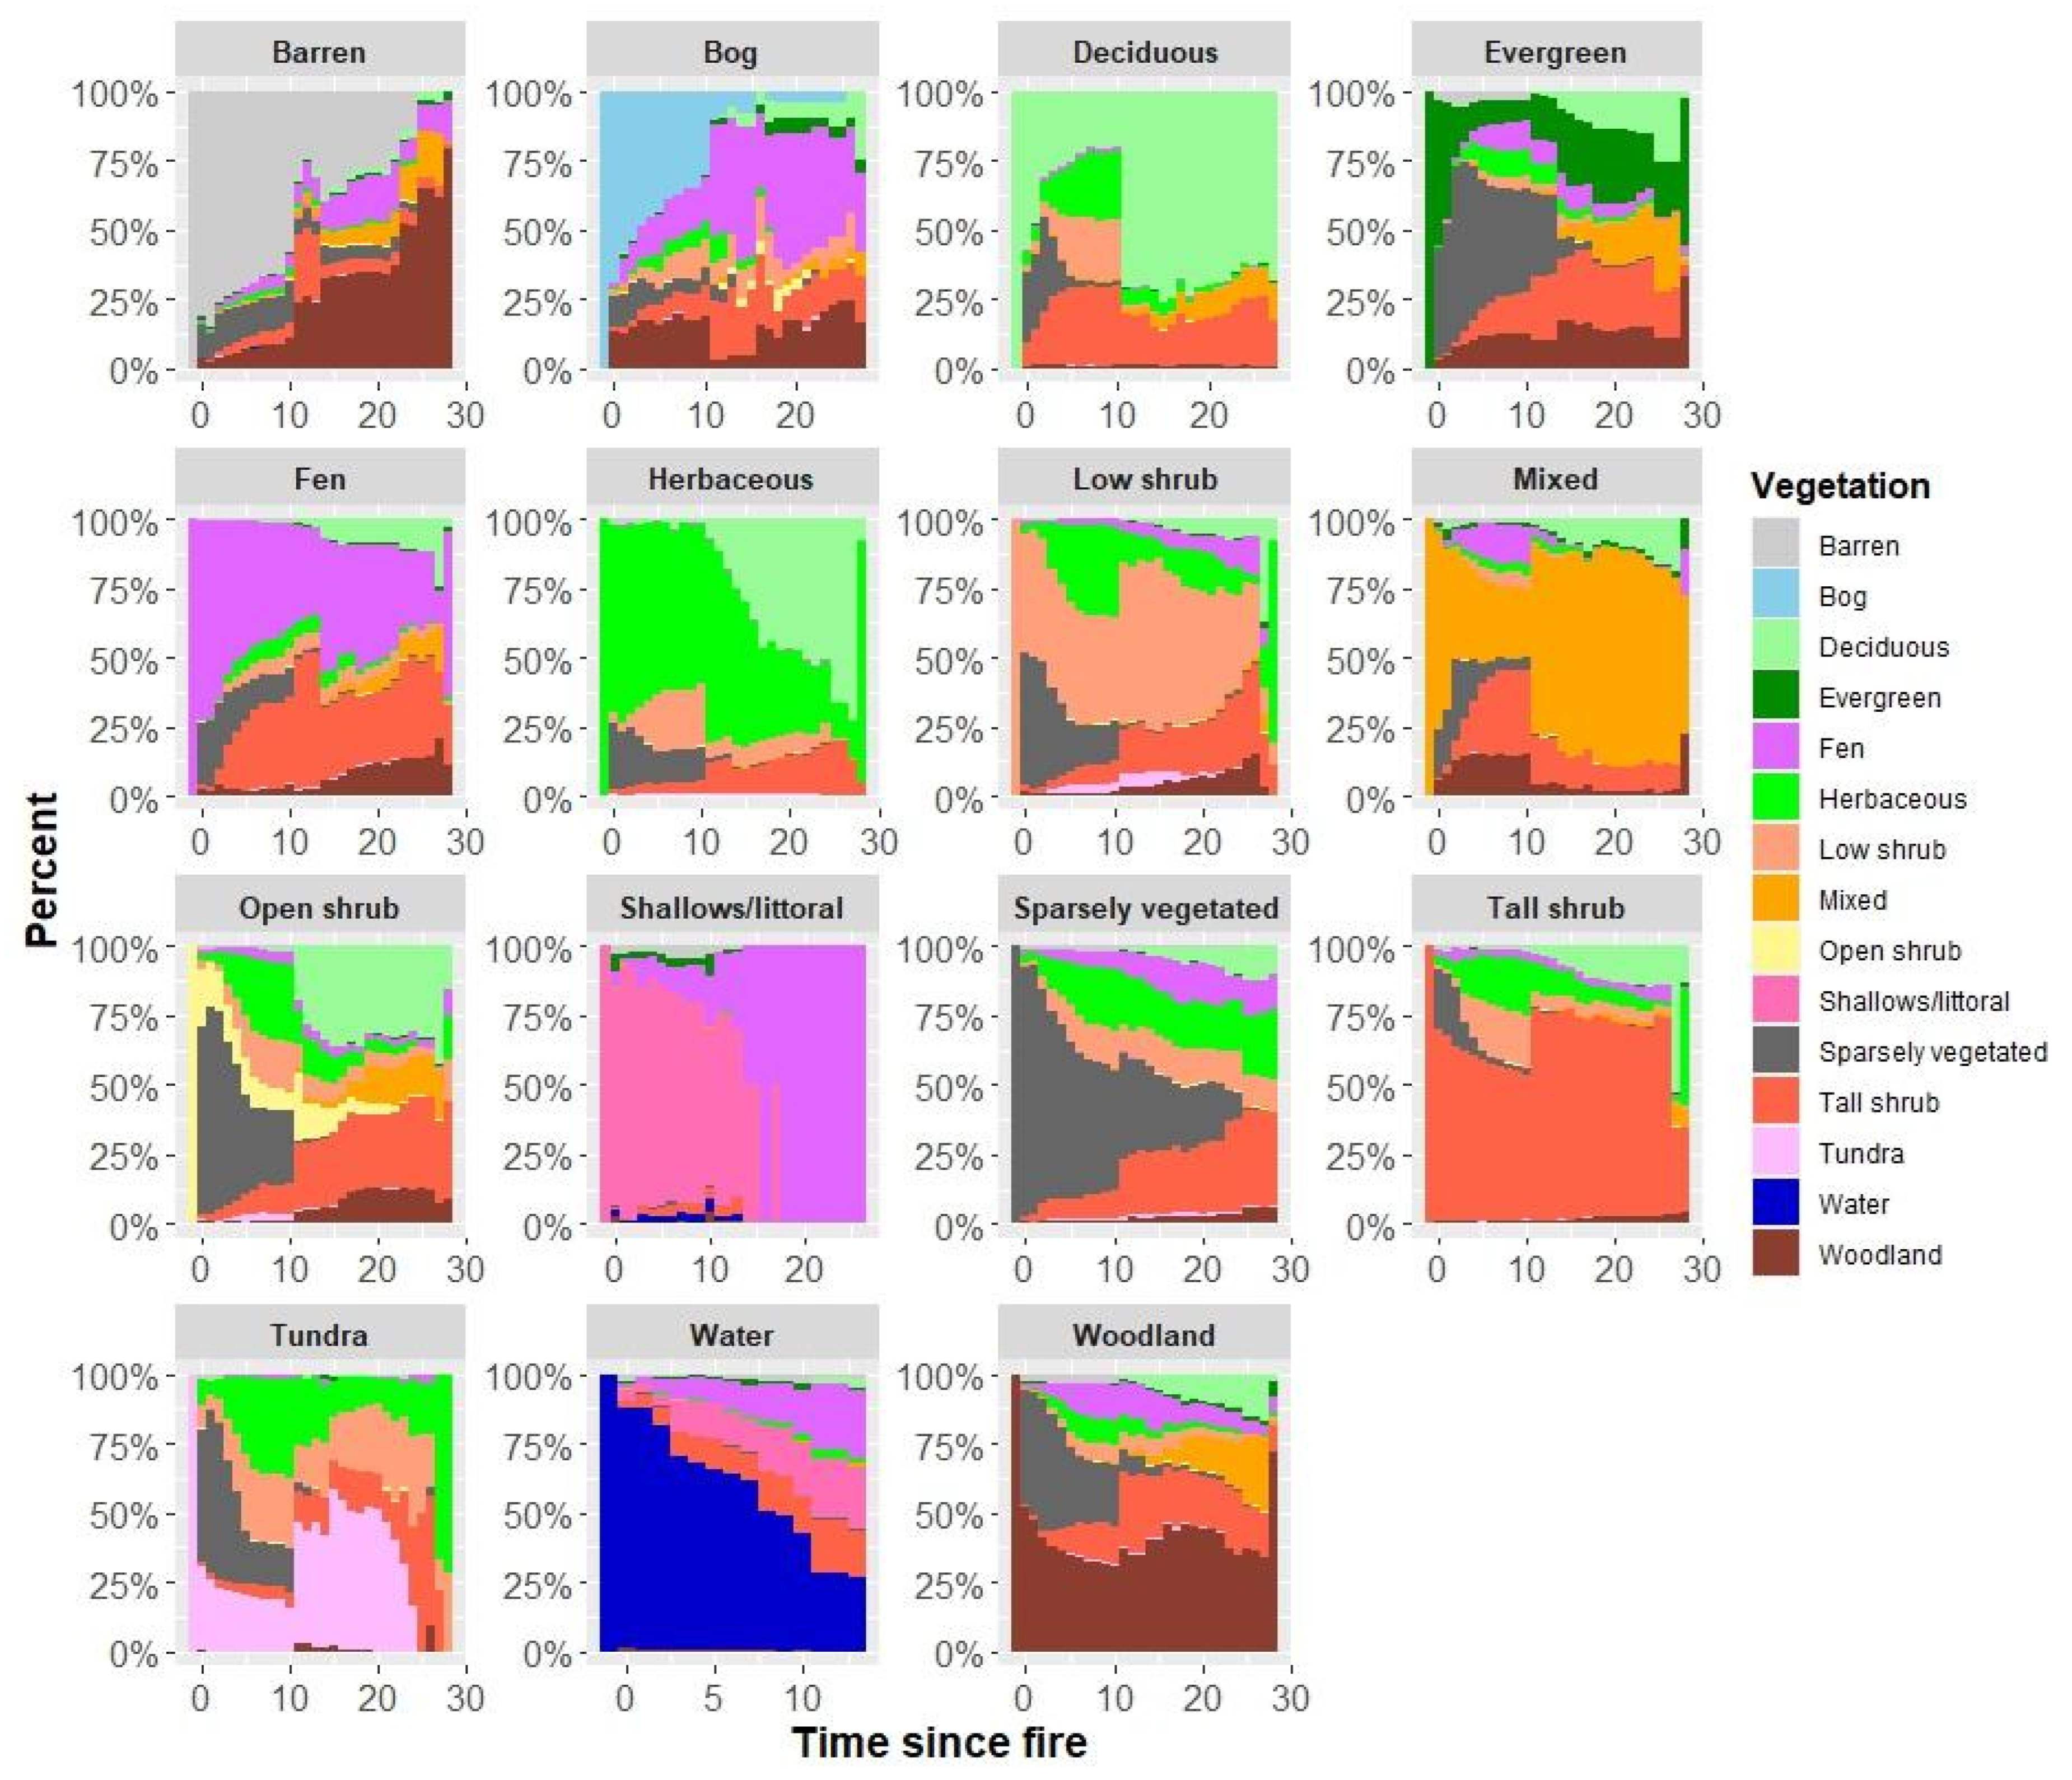
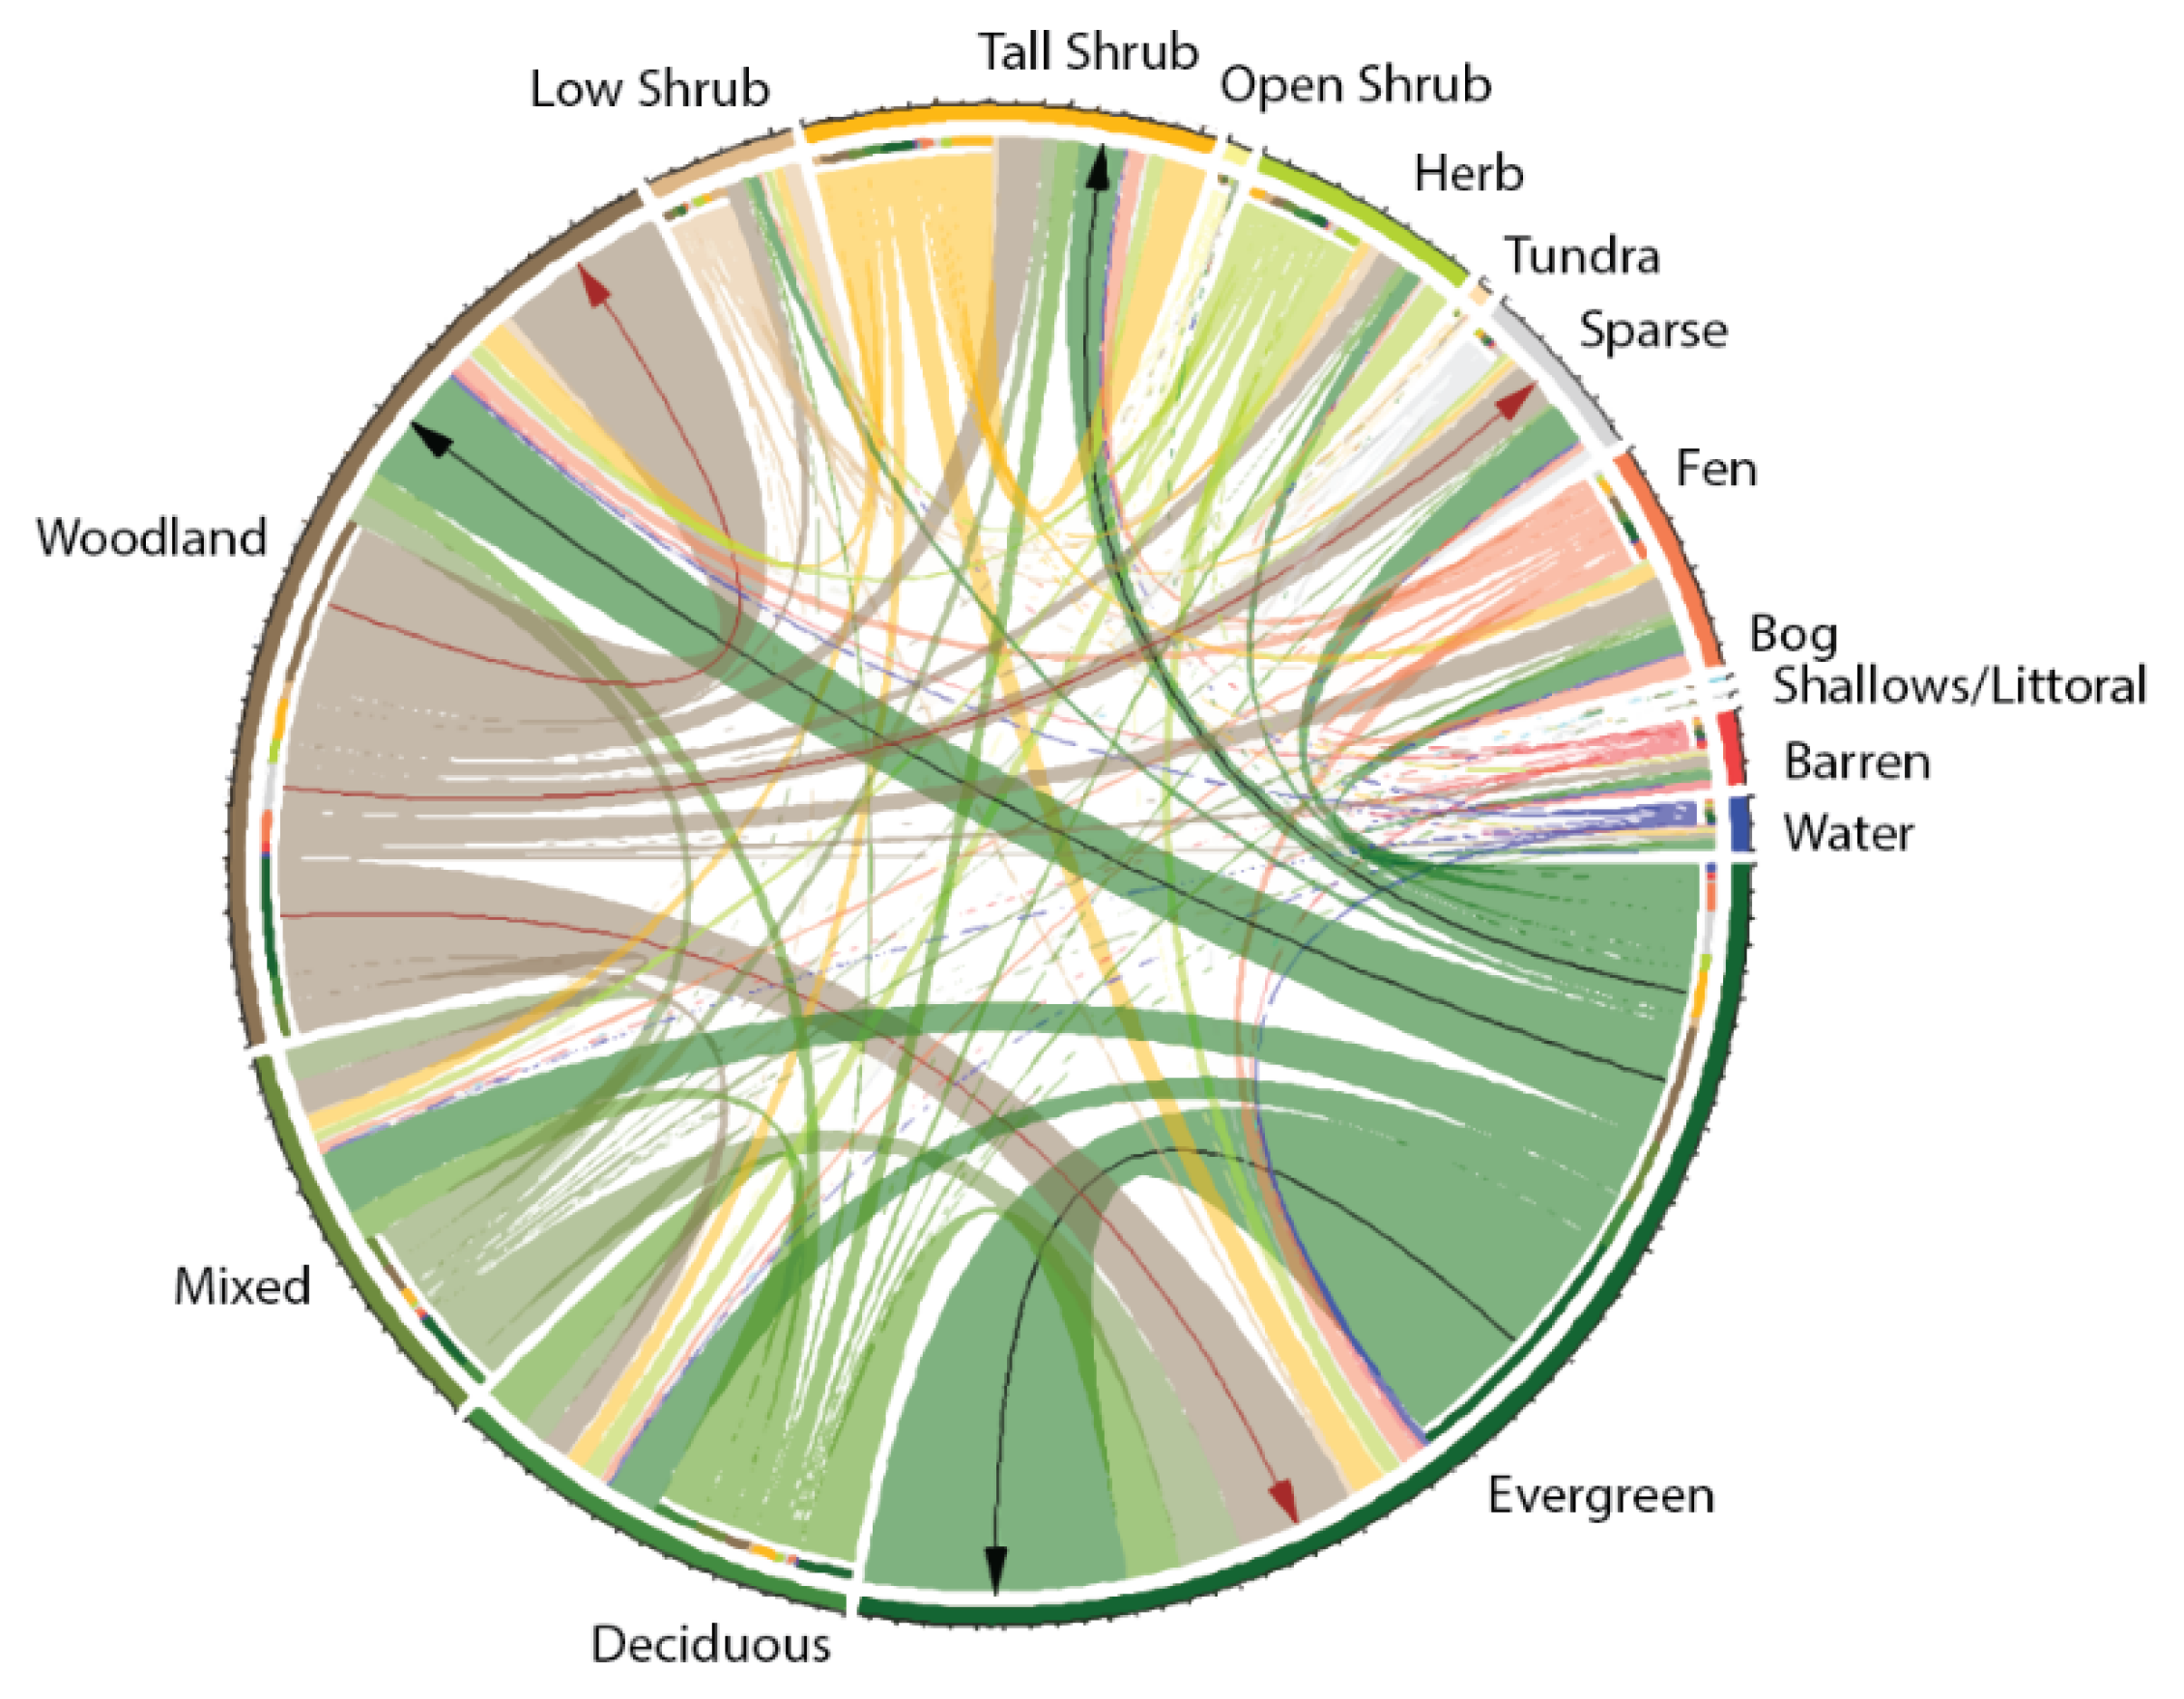
2.2.3. Succession Model
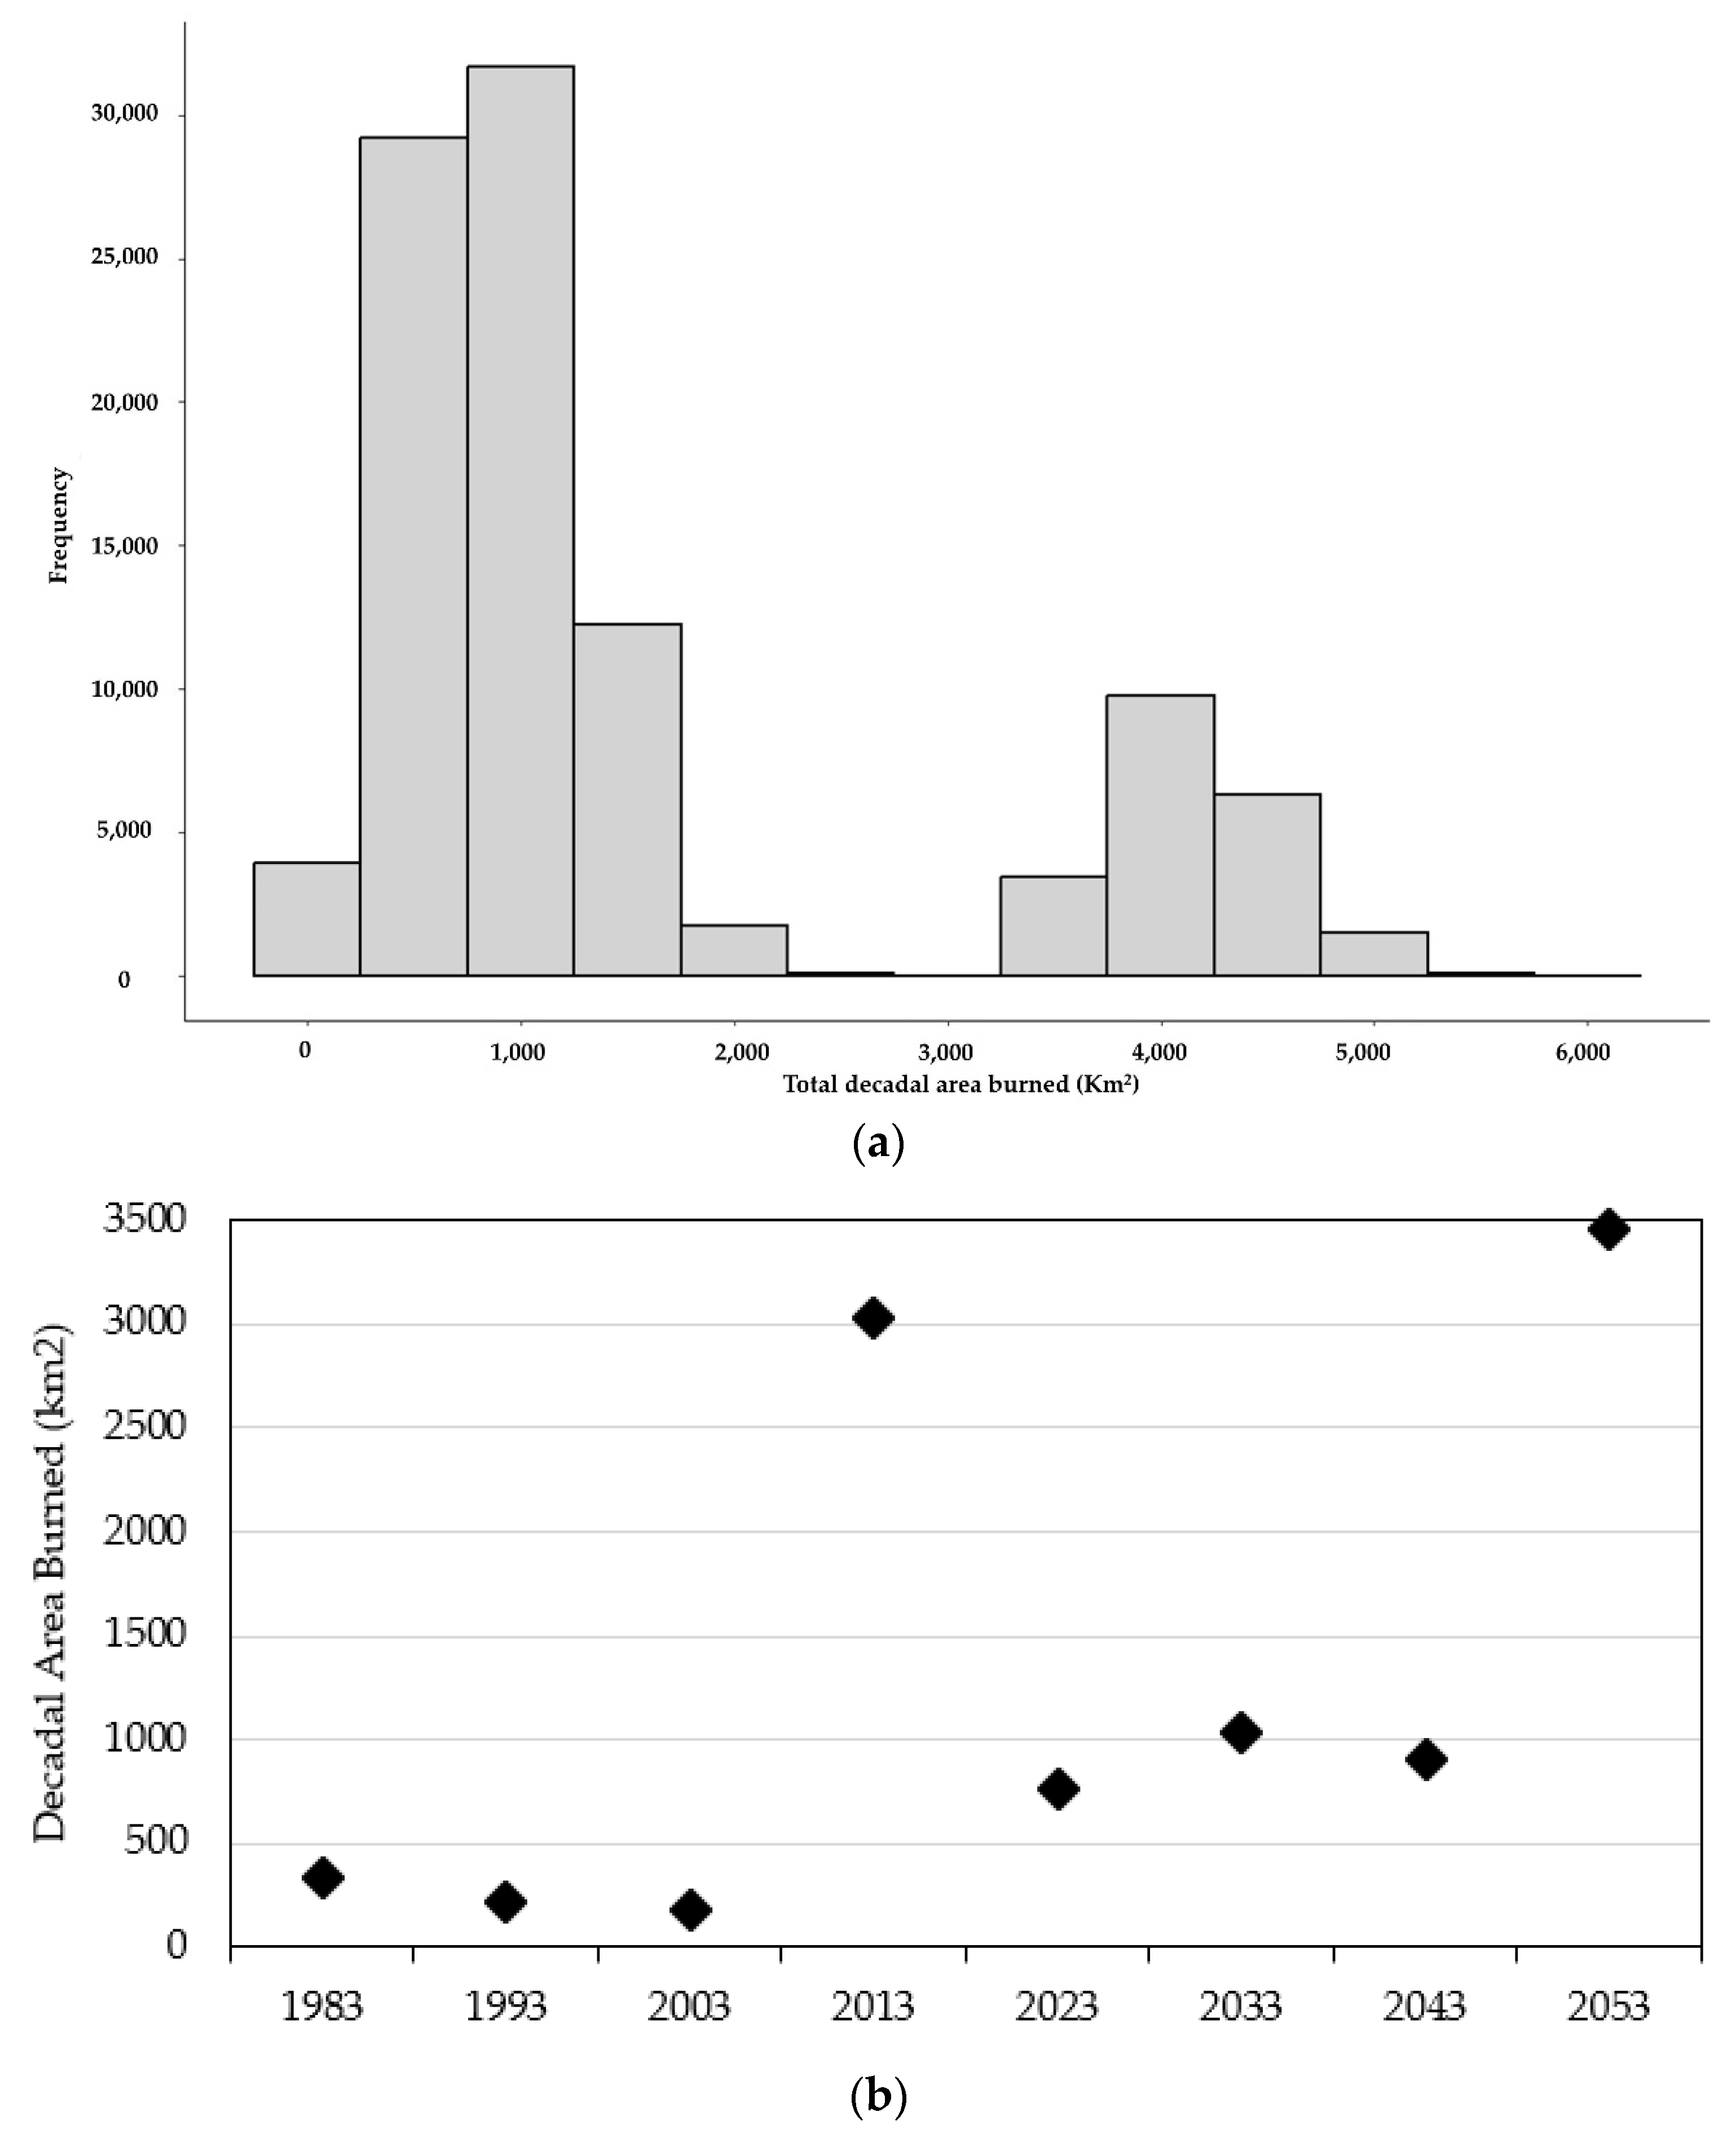
2.2.4. Future Fire Disturbance and Landcover
3. Results
3.1. Refined ABoVE Classification
3.2. Model Validation
3.3. Succession Model
3.4. Future Fire Disturbance and Landcover
4. Discussion
4.1. Historic Land Cover and Succession
4.2. Future Fire Disturbance and Landcover
5. Conclusions
Author Contributions
Funding
Data Availability Statement
Acknowledgments
Conflicts of Interest
Appendix A


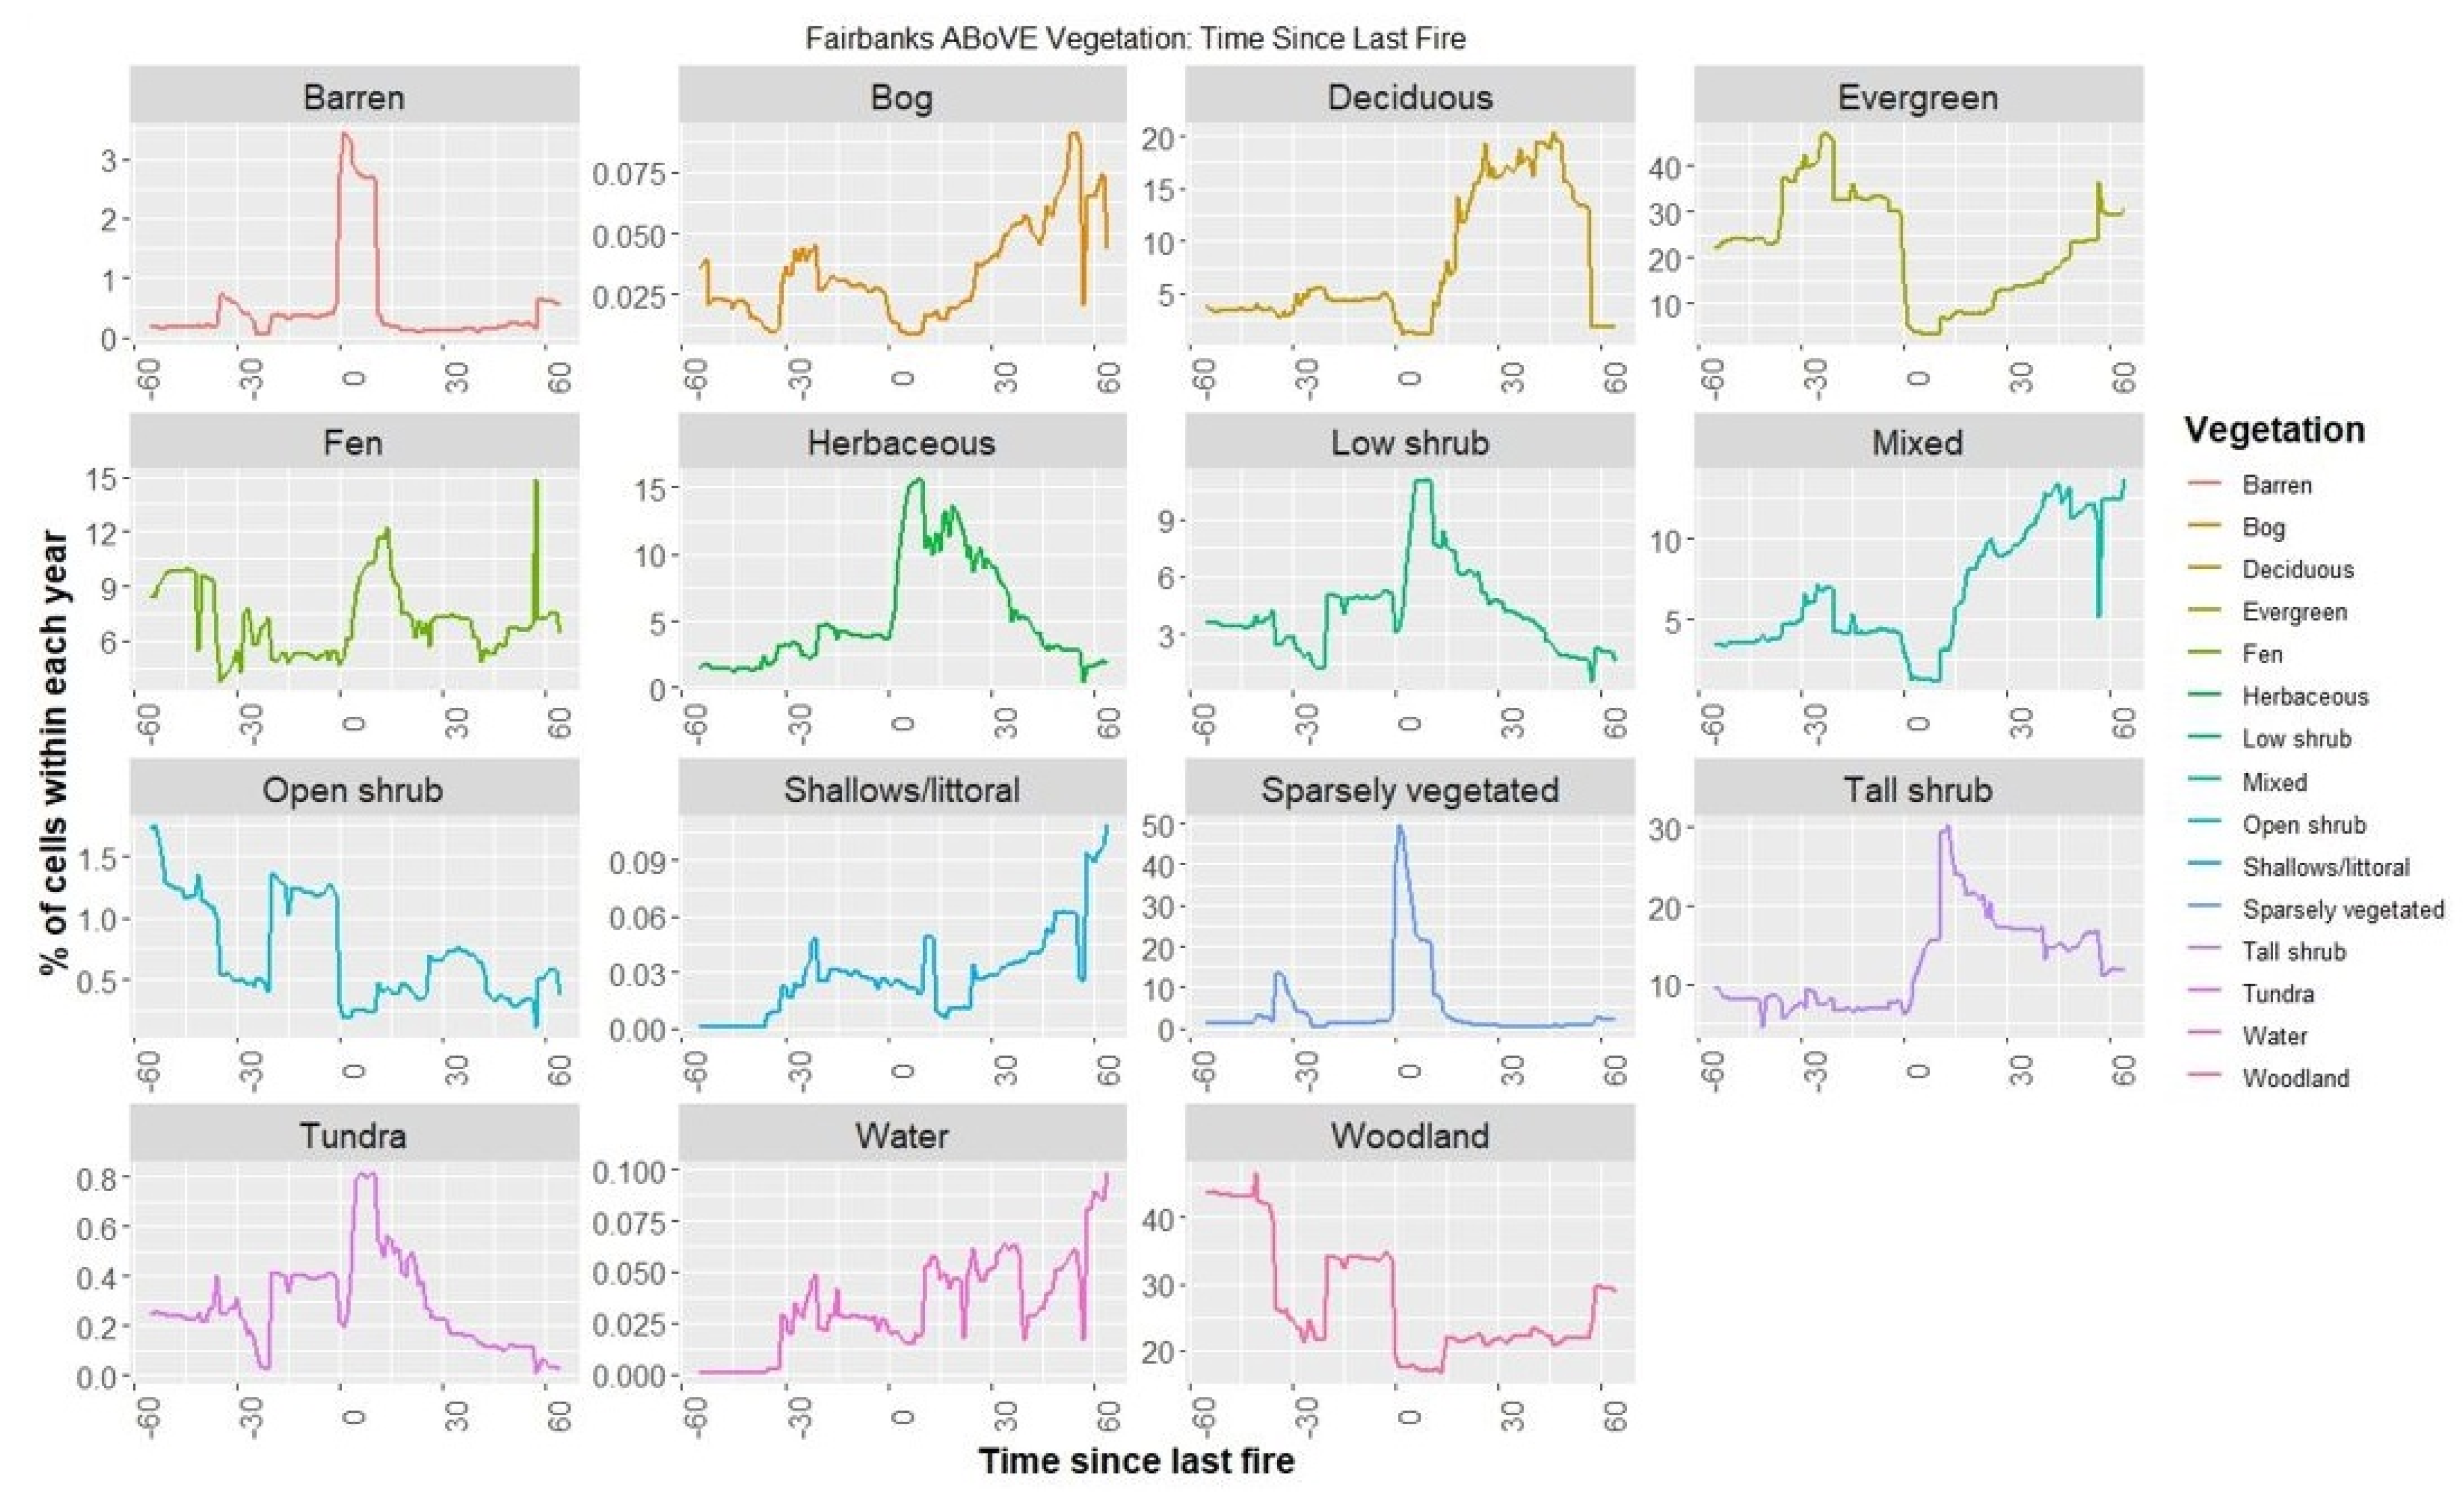
| Time Since Last Fire | ||||||||||||||
|---|---|---|---|---|---|---|---|---|---|---|---|---|---|---|
| Vegetation | 0 | 5 | 10 | 15 | 20 | 25 | 30 | 35 | 40 | 45 | 50 | 55 | 60 | 64 |
| Barren | 3 | 3 | 3 | 0 | 0 | 0 | 0 | 0 | 0 | 0 | 0 | 0 | 1 | 1 |
| Bog | 0 | 0 | 0 | 0 | 0 | 0 | 0 | 0 | 0 | 0 | 0 | 0 | 0 | 0 |
| Deciduous | 2 | 1 | 1 | 8 | 12 | 17 | 16 | 17 | 16 | 19 | 16 | 13 | 2 | 2 |
| Evergreen | 15 | 4 | 3 | 8 | 8 | 8 | 13 | 14 | 15 | 18 | 23 | 24 | 29 | 31 |
| Fen | 5 | 9 | 10 | 10 | 7 | 7 | 7 | 7 | 6 | 5 | 7 | 7 | 7 | 6 |
| Herbaceous | 4 | 14 | 16 | 10 | 13 | 9 | 9 | 7 | 5 | 3 | 3 | 3 | 2 | 2 |
| Low shrub | 3 | 10 | 11 | 8 | 6 | 5 | 5 | 4 | 4 | 3 | 2 | 2 | 2 | 2 |
| Mixed | 3 | 1 | 1 | 6 | 8 | 10 | 9 | 10 | 12 | 13 | 11 | 12 | 12 | 14 |
| Open shrub | 0 | 0 | 0 | 0 | 0 | 0 | 1 | 1 | 1 | 0 | 0 | 0 | 1 | 0 |
| Shallows/littoral | 0 | 0 | 0 | 0 | 0 | 0 | 0 | 0 | 0 | 0 | 0 | 0 | 0 | 0 |
| Sparsely vegetated | 40 | 27 | 21 | 3 | 1 | 1 | 1 | 0 | 0 | 0 | 1 | 1 | 2 | 2 |
| Tall shrub | 6 | 13 | 16 | 24 | 22 | 20 | 17 | 17 | 17 | 15 | 15 | 17 | 12 | 12 |
| Tundra | 0 | 1 | 1 | 1 | 0 | 0 | 0 | 0 | 0 | 0 | 0 | 0 | 0 | 0 |
| Water | 0 | 0 | 0 | 0 | 0 | 0 | 0 | 0 | 0 | 0 | 0 | 0 | 0 | 0 |
| Woodland | 19 | 18 | 17 | 22 | 21 | 22 | 22 | 22 | 24 | 22 | 22 | 22 | 30 | 29 |
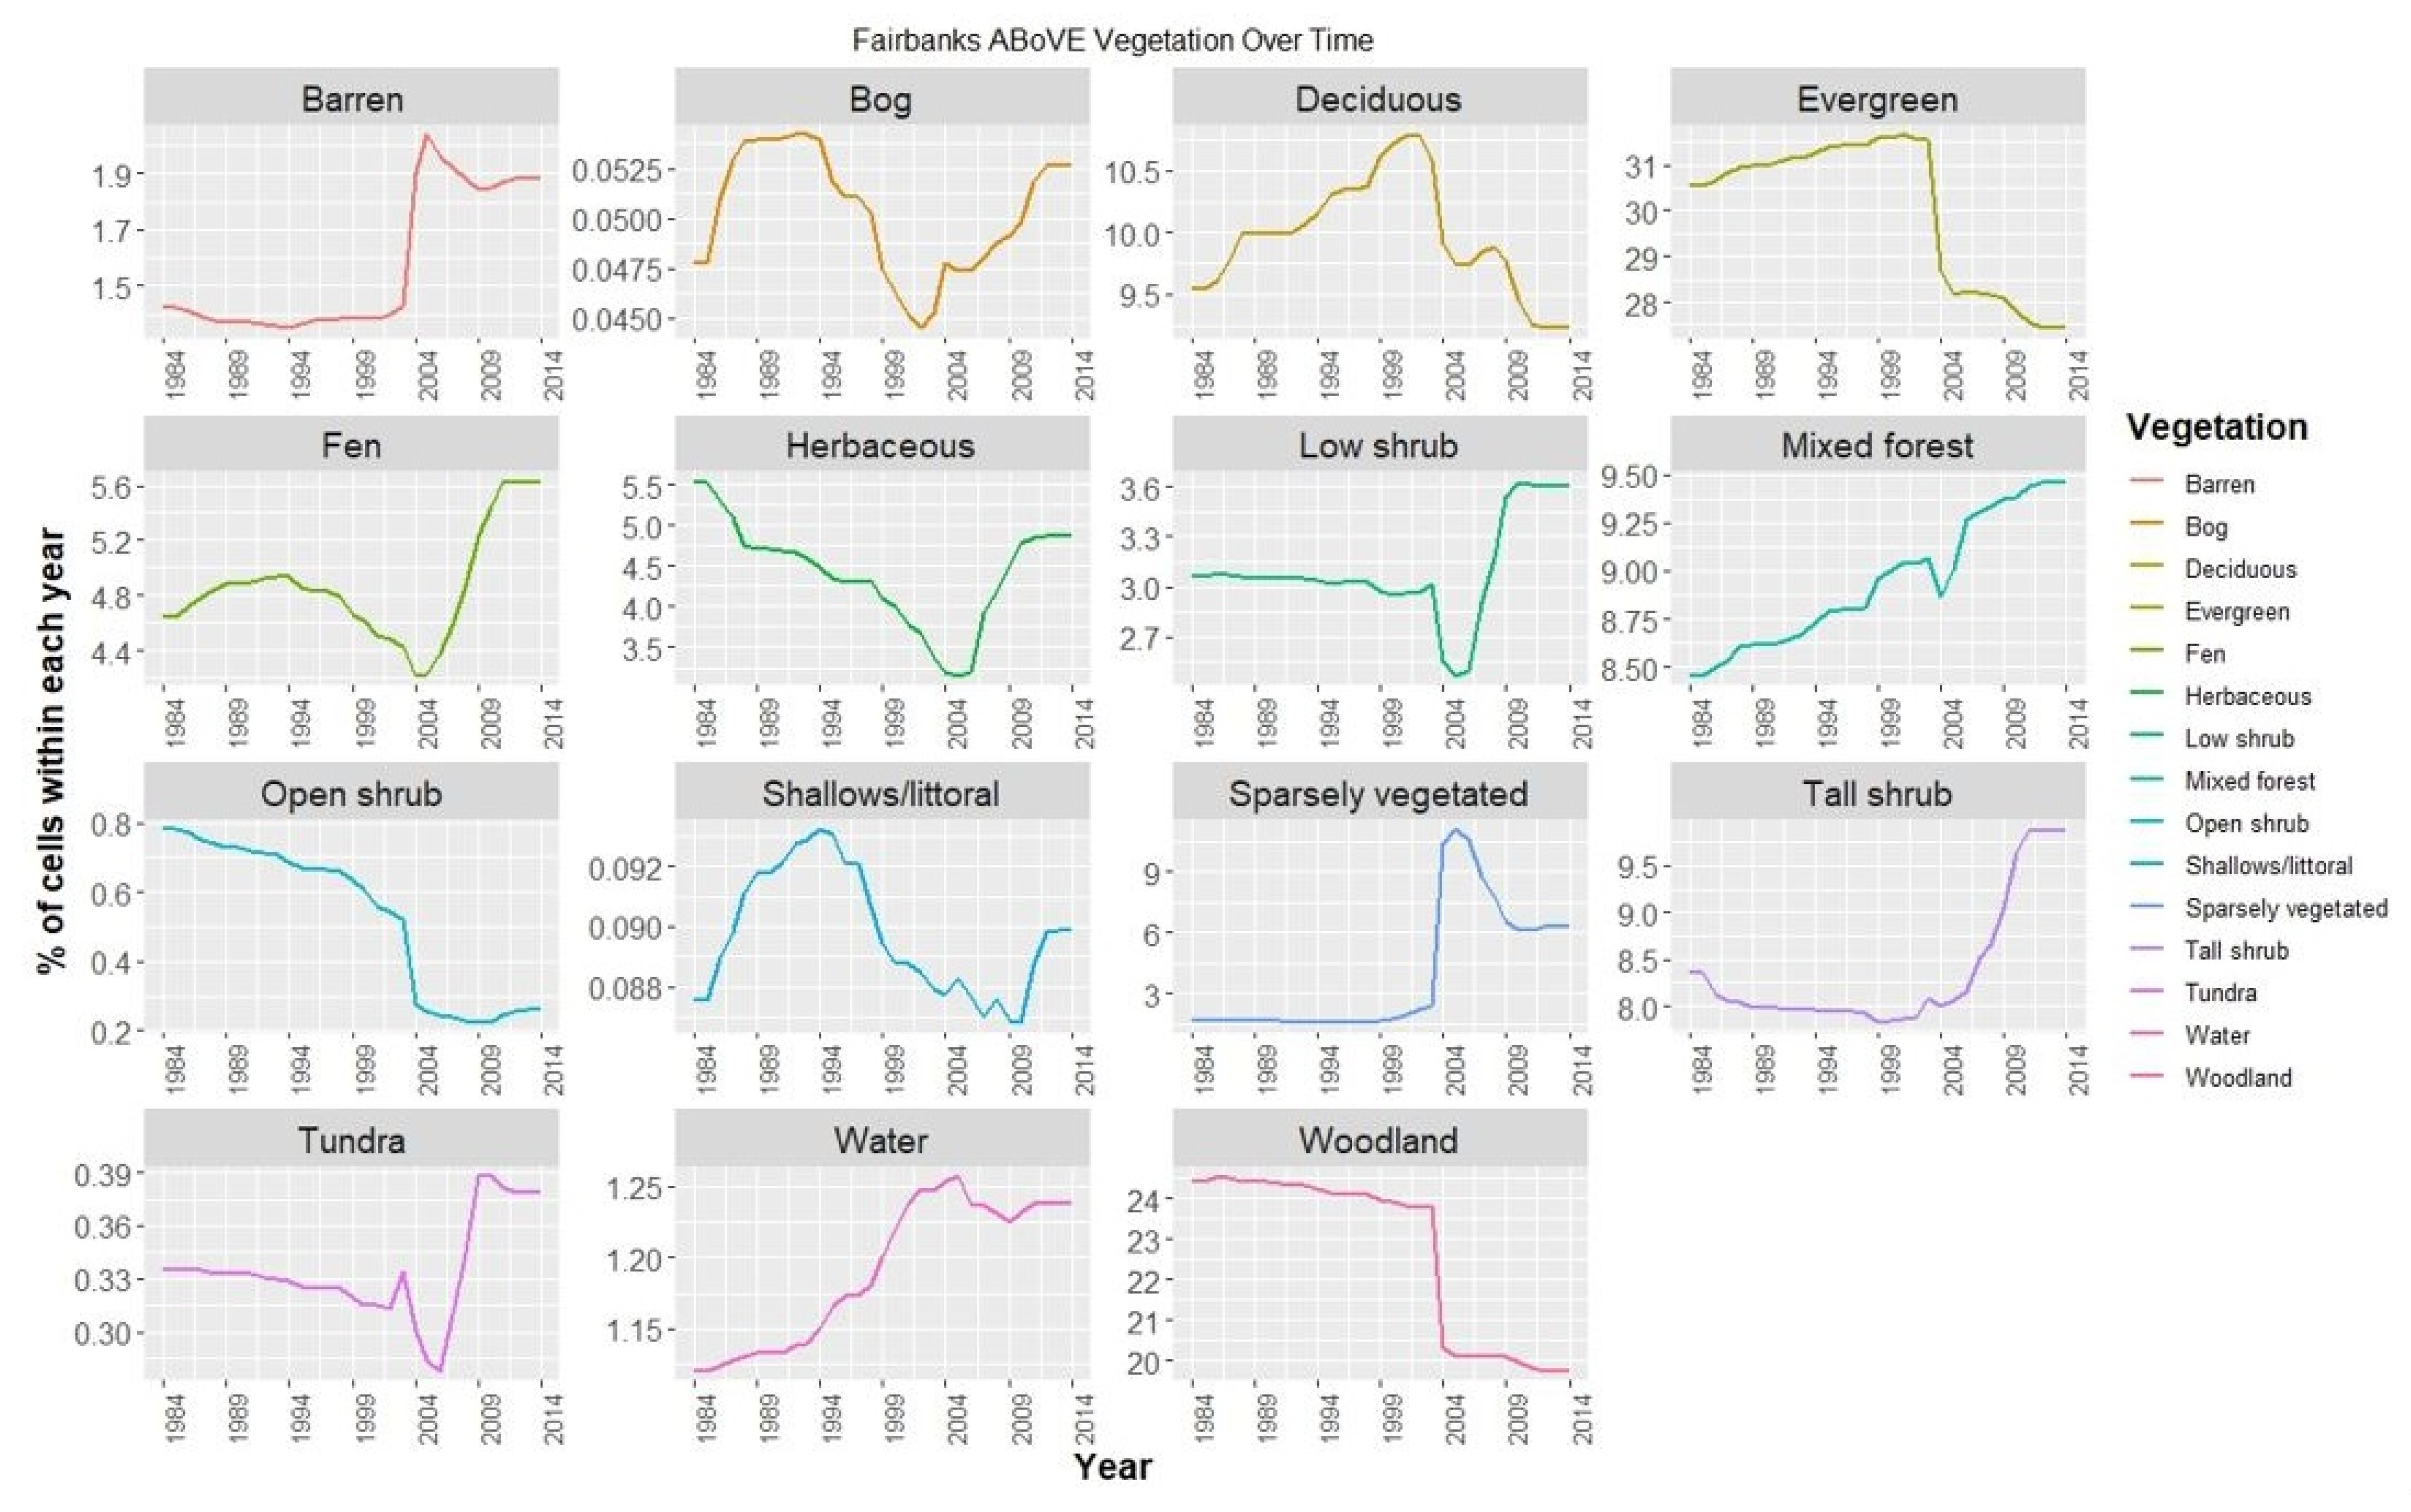
| (a) | 1984 | 1994 | 2004 | 2014 | ||||
| Vegetation | km2 | % | km2 | % | km2 | % | km2 | % |
| Barren | 592 | 21.89 | 589 | 21.78 | 591 | 21.86 | 589 | 21.78 |
| Bog | 0 | - | 0 | - | 0 | - | 0 | - |
| Deciduous Forest | 189 | 6.99 | 198 | 7.32 | 212 | 7.84 | 205 | 7.58 |
| Evergreen Forest: Black Spruce | 14 | 0.52 | 14 | 0.52 | 13 | 0.48 | 13 | 0.48 |
| Evergreen Forest: White Spruce | 150 | 5.55 | 151 | 5.58 | 149 | 5.51 | 145 | 5.36 |
| Fen | 13 | 0.48 | 14 | 0.52 | 13 | 0.48 | 14 | 0.52 |
| Hemlock | 46 | 1.7 | 46 | 1.7 | 46 | 1.7 | 46 | 1.7 |
| Herbaceous | 458 | 16.94 | 455 | 16.83 | 447 | 16.53 | 455 | 16.83 |
| Low Shrub | 5 | 0.18 | 5 | 0.18 | 6 | 0.22 | 6 | 0.22 |
| Mixed Forest | 364 | 13.46 | 366 | 13.54 | 365 | 13.5 | 359 | 13.28 |
| NA | 158 | 5.84 | 158 | 5.84 | 158 | 5.84 | 158 | 5.84 |
| Open Shrubs | 104 | 3.85 | 101 | 3.74 | 95 | 3.51 | 94 | 3.48 |
| Shallows/littoral | 2 | 0.07 | 3 | 0.11 | 2 | 0.07 | 2 | 0.07 |
| Sparsely Vegetated | 219 | 8.1 | 218 | 8.06 | 226 | 8.36 | 228 | 8.43 |
| Tall Shrub | 231 | 8.54 | 227 | 8.39 | 222 | 8.21 | 232 | 8.58 |
| Tussock Tundra | 1 | 0.04 | 1 | 0.04 | 2 | 0.07 | 2 | 0.07 |
| Water | 57 | 2.11 | 56 | 2.07 | 56 | 2.07 | 56 | 2.07 |
| Woodland | 99 | 3.66 | 100 | 3.7 | 100 | 3.7 | 100 | 3.7 |
| (b) | 1984 | 1994 | 2004 | 2014 | ||||
| Vegetation | km2 | % | km2 | % | km2 | % | km2 | % |
| Barren | 196 | 1.42 | 186 | 1.35 | 263 | 1.9 | 260 | 1.88 |
| Bog | 7 | 0.05 | 7 | 0.05 | 7 | 0.05 | 7 | 0.05 |
| Deciduous Forest | 1561 | 11.29 | 1570 | 11.36 | 1426 | 10.32 | 1275 | 9.23 |
| Evergreen Forest: Black Spruce | 2939 | 21.26 | 3008 | 21.76 | 2842 | 20.56 | 2563 | 18.54 |
| Evergreen Forest: White Spruce | 1281 | 9.27 | 1313 | 9.5 | 1121 | 8.11 | 1071 | 7.75 |
| Fen | 641 | 4.64 | 683 | 4.94 | 583 | 4.22 | 777 | 5.62 |
| Herbaceous | 522 | 3.78 | 451 | 3.26 | 386 | 2.79 | 673 | 4.87 |
| Low Shrub | 423 | 3.06 | 420 | 3.04 | 353 | 2.55 | 498 | 3.6 |
| Mixed Forest | 1169 | 8.46 | 1207 | 8.73 | 1225 | 8.86 | 1308 | 9.46 |
| NA | 2 | 0.01 | 2 | 0.01 | 2 | 0.01 | 2 | 0.01 |
| Open Shrubs | 108 | 0.78 | 95 | 0.69 | 38 | 0.27 | 36 | 0.26 |
| Shallows/littoral | 12 | 0.09 | 13 | 0.09 | 12 | 0.09 | 12 | 0.09 |
| Sparsely Vegetated | 231 | 1.67 | 213 | 1.54 | 1434 | 10.37 | 1024 | 7.41 |
| Tall Shrub | 1155 | 8.36 | 1101 | 7.97 | 1106 | 8 | 1364 | 9.87 |
| Tussock Tundra | 46 | 0.33 | 45 | 0.33 | 42 | 0.3 | 52 | 0.38 |
| Water | 155 | 1.12 | 159 | 1.15 | 173 | 1.25 | 171 | 1.24 |
| Woodland | 3374 | 24.41 | 3348 | 24.22 | 2810 | 20.33 | 2728 | 19.74 |
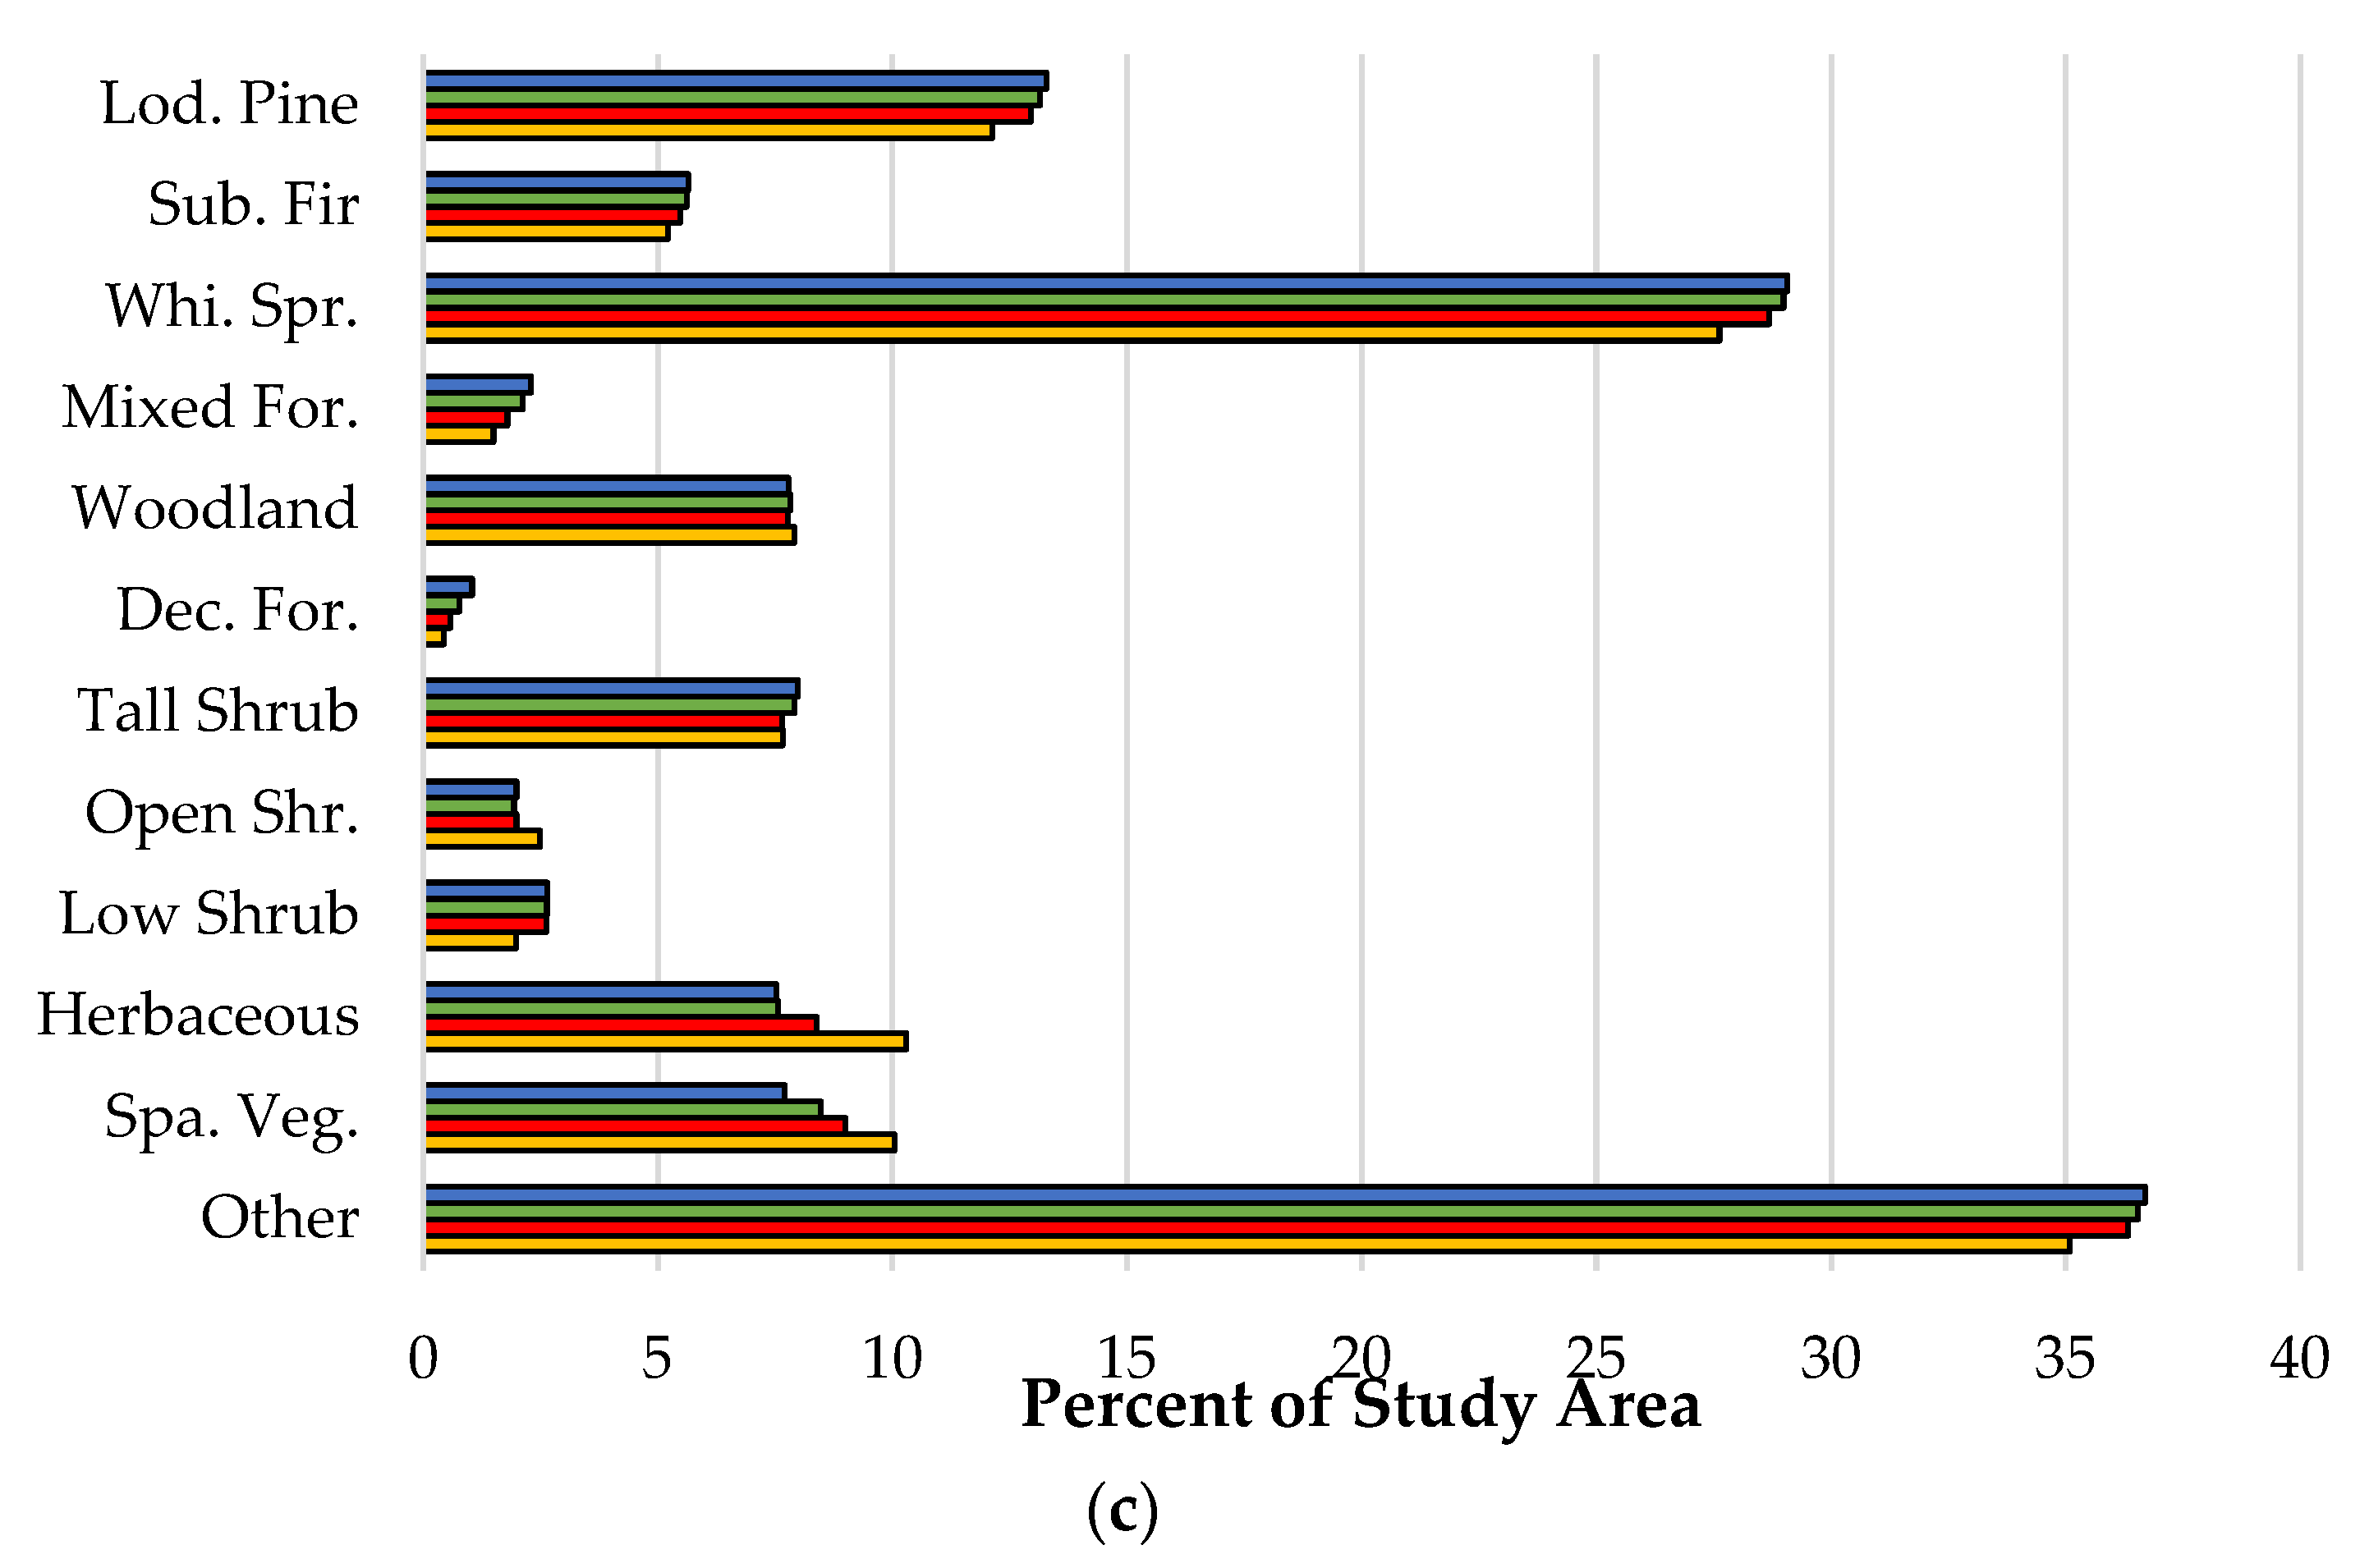
| (c) | 1984 | 1994 | 2004 | 2014 | ||||
| Vegetation | km2 | % | km2 | % | km2 | % | km2 | % |
| Barren | 707 | 5.75 | 650 | 5.28 | 634 | 5.15 | 624 | 5.07 |
| Bog | 0 | 0 | 0 | 0 | 0 | 0 | 1 | 0.01 |
| Deciduous Forest | 54 | 0.44 | 71 | 0.58 | 96 | 0.78 | 129 | 1.05 |
| Evergreen Forest: Lodgepole Pine | 1492 | 12.13 | 1593 | 12.95 | 1618 | 13.15 | 1634 | 13.28 |
| Evergreen Forest: White Spruce | 3399 | 27.62 | 3529 | 28.68 | 3567 | 28.99 | 3578 | 29.07 |
| Fen | 212 | 1.72 | 292 | 2.37 | 295 | 2.4 | 314 | 2.55 |
| Herbaceous | 1267 | 10.3 | 1032 | 8.39 | 930 | 7.56 | 926 | 7.52 |
| Low Shrub | 244 | 1.98 | 324 | 2.63 | 325 | 2.64 | 326 | 2.65 |
| Mixed Forest | 184 | 1.5 | 221 | 1.8 | 261 | 2.12 | 283 | 2.3 |
| NA | 7 | 0.06 | 7 | 0.06 | 7 | 0.06 | 7 | 0.06 |
| Open Shrubs | 307 | 2.49 | 245 | 1.99 | 239 | 1.94 | 245 | 1.99 |
| Shallows/littoral | 17 | 0.14 | 19 | 0.15 | 20 | 0.16 | 20 | 0.16 |
| Sparsely Vegetated | 1236 | 10.04 | 1107 | 9 | 1044 | 8.48 | 949 | 7.71 |
| Subalpine Fir | 641 | 5.21 | 674 | 5.48 | 691 | 5.62 | 695 | 5.65 |
| Tall Shrub | 942 | 7.66 | 941 | 7.65 | 975 | 7.92 | 983 | 7.99 |
| Tussock Tundra | 40 | 0.33 | 57 | 0.46 | 52 | 0.42 | 47 | 0.38 |
| Water | 583 | 4.74 | 586 | 4.76 | 588 | 4.78 | 588 | 4.78 |
| Woodland | 973 | 7.91 | 957 | 7.78 | 964 | 7.83 | 959 | 7.79 |
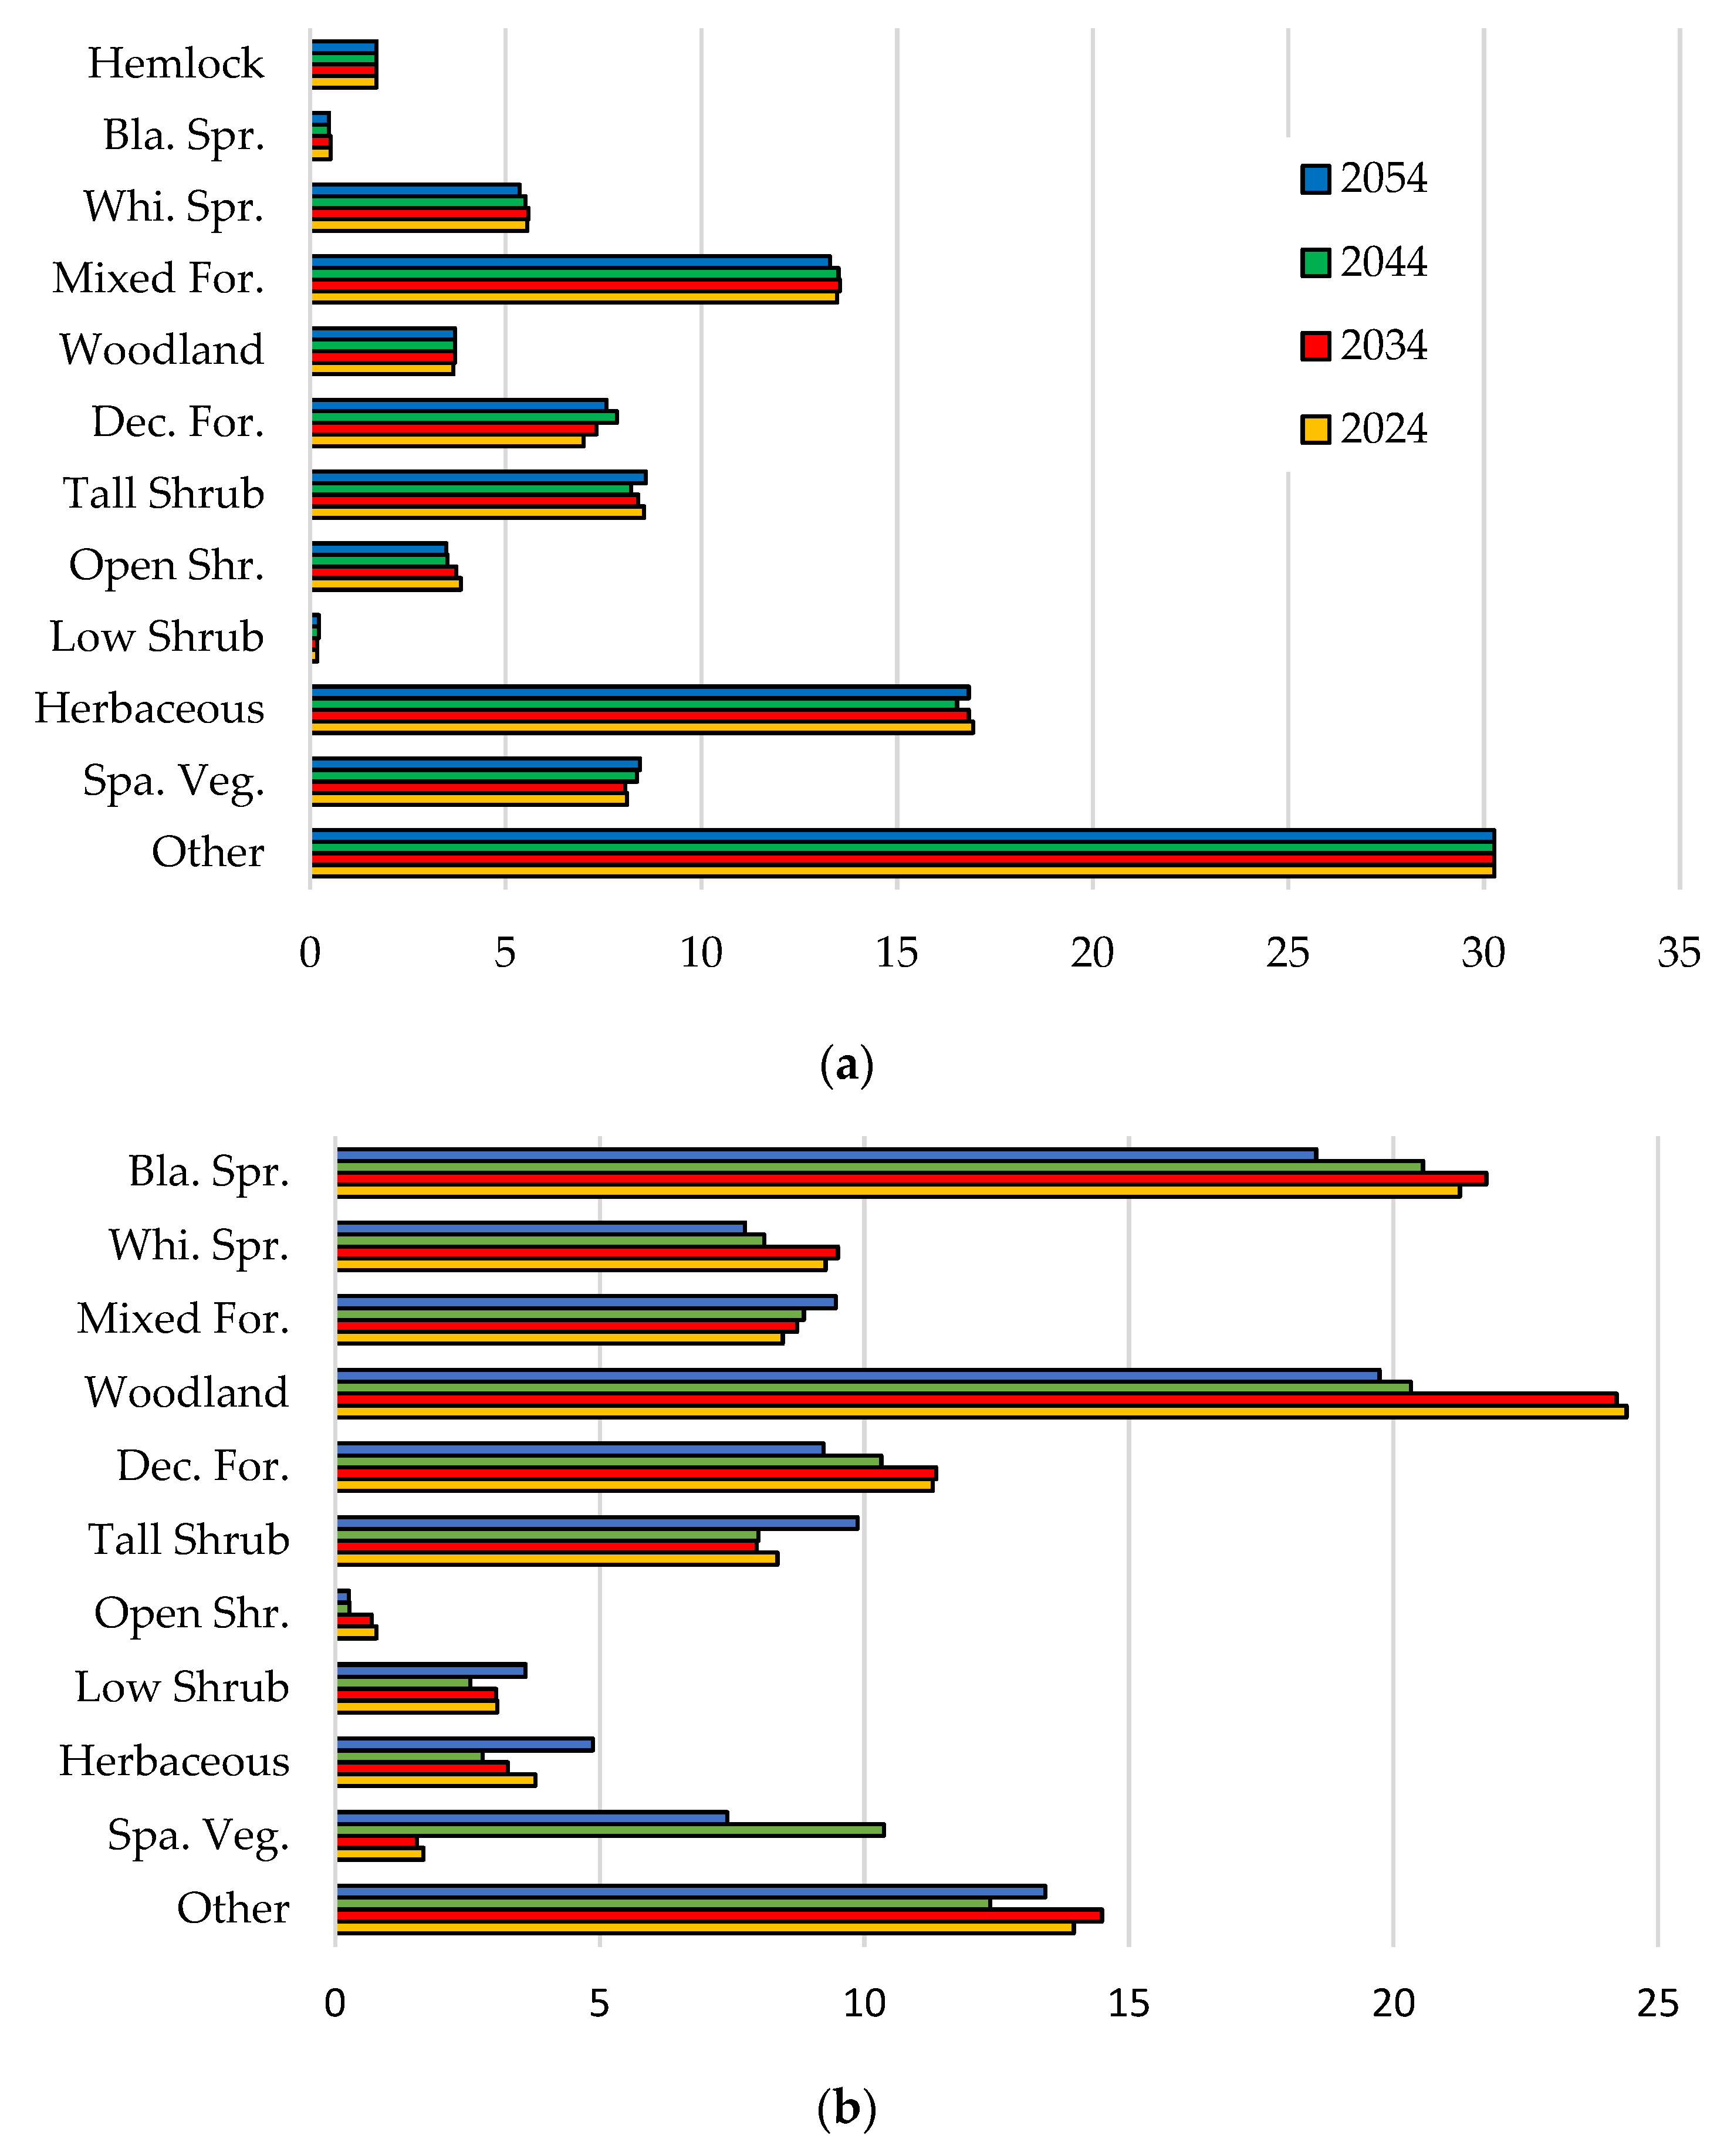
| (a) | 2024 | 2034 | 2044 | 2054 | ||||
| Vegetation | km2 | % | km2 | % | km2 | % | km2 | % |
| Barren | 588 | 21.73 | 588 | 21.73 | 588 | 21.73 | 588 | 21.73 |
| Bog | 0 | 0 | 0 | 0 | 0 | 0 | 0 | 0 |
| Deciduous Forest | 204 | 7.55 | 205 | 7.58 | 205 | 7.58 | 205 | 7.58 |
| Evergreen Forest: Black Spruce | 13 | 0.47 | 13 | 0.47 | 13 | 0.47 | 13 | 0.47 |
| Evergreen Forest: White Spruce | 144 | 5.32 | 144 | 5.32 | 144 | 5.32 | 144 | 5.32 |
| Fen | 14 | 0.52 | 14 | 0.52 | 14 | 0.52 | 14 | 0.52 |
| Hemlock | 46 | 1.68 | 46 | 1.68 | 46 | 1.68 | 46 | 1.68 |
| Herbaceous | 454 | 16.78 | 454 | 16.78 | 454 | 16.78 | 454 | 16.78 |
| Low Shrub | 8 | 0.3 | 7 | 0.25 | 8 | 0.29 | 8 | 0.29 |
| Mixed Forest | 357 | 13.2 | 358 | 13.25 | 359 | 13.27 | 359 | 13.27 |
| NA | 157 | 5.8 | 157 | 5.8 | 157 | 5.8 | 157 | 5.8 |
| Open Shrubs | 94 | 3.47 | 94 | 3.46 | 94 | 3.46 | 94 | 3.46 |
| Shallows/littoral | 2 | 0.08 | 2 | 0.08 | 2 | 0.08 | 2 | 0.08 |
| Sparsely Vegetated | 227 | 8.41 | 227 | 8.4 | 227 | 8.4 | 227 | 8.4 |
| Tall Shrub | 235 | 8.67 | 234 | 8.66 | 233 | 8.61 | 233 | 8.61 |
| Tussock Tundra | 2 | 0.06 | 2 | 0.06 | 2 | 0.06 | 2 | 0.06 |
| Water | 56 | 2.07 | 56 | 2.07 | 56 | 2.07 | 56 | 2.07 |
| Woodland | 100 | 3.68 | 100 | 3.69 | 100 | 3.69 | 100 | 3.69 |
| (b) | 2024 | 2034 | 2044 | 2054 | ||||
| Vegetation | km2 | % | km2 | % | km2 | % | km2 | % |
| Barren | 193 | 1.39 | 193 | 1.39 | 193 | 1.39 | 193 | 1.39 |
| Bog | 7 | 0.05 | 7 | 0.05 | 7 | 0.05 | 7 | 0.05 |
| Deciduous Forest | 1322 | 9.56 | 1334 | 9.65 | 1290 | 9.33 | 1081 | 7.82 |
| Evergreen Forest: Black Spruce | 2282 | 16.51 | 1953 | 14.13 | 1742 | 12.61 | 1192 | 8.62 |
| Evergreen Forest: White Spruce | 906 | 6.55 | 796 | 5.76 | 719 | 5.2 | 527 | 3.81 |
| Fen | 628 | 4.54 | 628 | 4.54 | 628 | 4.55 | 629 | 4.55 |
| Herbaceous | 390 | 2.82 | 390 | 2.82 | 390 | 2.82 | 390 | 2.82 |
| Low Shrub | 487 | 3.52 | 525 | 3.8 | 515 | 3.73 | 1058 | 7.65 |
| Mixed Forest | 1222 | 8.84 | 1254 | 9.08 | 1281 | 9.27 | 971 | 7.03 |
| NA | 1 | 0.01 | 1 | 0.01 | 1 | 0.01 | 1 | 0.01 |
| Open Shrubs | 1019 | 7.38 | 202 | 1.46 | 272 | 1.96 | 355 | 2.57 |
| Shallows/littoral | 12 | 0.09 | 12 | 0.08 | 11 | 0.08 | 11 | 0.08 |
| Sparsely Vegetated | 958 | 6.93 | 919 | 6.65 | 840 | 6.08 | 1761 | 12.74 |
| Tall Shrub | 2075 | 15.01 | 2536 | 18.35 | 3004 | 21.73 | 3297 | 23.86 |
| Tussock Tundra | 43 | 0.31 | 43 | 0.31 | 43 | 0.31 | 43 | 0.31 |
| Water | 171 | 1.24 | 171 | 1.24 | 171 | 1.24 | 171 | 1.24 |
| Woodland | 2104 | 15.22 | 2857 | 20.67 | 2712 | 19.63 | 2133 | 15.43 |
| (c) | 2024 | 2034 | 2044 | 2054 | ||||
| Vegetation | km2 | % | km2 | % | km2 | % | km2 | % |
| Barren | 623 | 5.06 | 623 | 5.06 | 623 | 5.06 | 623 | 5.06 |
| Bog | 1 | 0.01 | 1 | 0.01 | 1 | 0.01 | 1 | 0.01 |
| Deciduous Forest | 129 | 1.05 | 131 | 1.06 | 130 | 1.06 | 128 | 1.04 |
| Evergreen Forest: Lodgepole Pine | 1641 | 13.33 | 1639 | 13.32 | 1644 | 13.36 | 1644 | 13.36 |
| Evergreen Forest: White Spruce | 3557 | 28.91 | 3566 | 28.98 | 3573 | 29.04 | 3590 | 29.18 |
| Fen | 313 | 2.54 | 313 | 2.54 | 313 | 2.54 | 313 | 2.54 |
| Herbaceous | 928 | 7.54 | 928 | 7.54 | 927 | 7.53 | 926 | 7.53 |
| Low Shrub | 326 | 2.65 | 327 | 2.66 | 327 | 2.65 | 325 | 2.64 |
| Mixed Forest | 283 | 2.30 | 283 | 2.30 | 283 | 2.30 | 285 | 2.32 |
| NA | 4 | 0.03 | 4 | 0.03 | 4 | 0.03 | 4 | 0.03 |
| Open Shrubs | 249 | 2.03 | 244 | 1.99 | 245 | 1.99 | 243 | 1.98 |
| Shallows/littoral | 20 | 0.17 | 20 | 0.17 | 20 | 0.16 | 20 | 0.16 |
| Sparsely Vegetated | 950 | 7.72 | 927 | 7.54 | 922 | 7.49 | 922 | 7.49 |
| Subalpine Fir | 692 | 5.62 | 692 | 5.62 | 692 | 5.62 | 694 | 5.64 |
| Tall Shrub | 998 | 8.11 | 1008 | 8.19 | 1002 | 8.14 | 984 | 8.00 |
| Tussock Tundra | 47 | 0.38 | 47 | 0.38 | 47 | 0.38 | 47 | 0.38 |
| Water | 588 | 4.78 | 588 | 4.78 | 588 | 4.78 | 588 | 4.78 |
| Woodland | 956 | 7.77 | 962 | 7.82 | 964 | 7.84 | 966 | 7.85 |
References
- Johnstone, J.F.; Chapin, F.S., III; Foote, J.; Kemmett, S.; Price, K.; Viereck, L.A. Decadal observations of tree regeneration following fire in boreal forests. Can. J. For. Res. 2004, 34, 267–273. [Google Scholar] [CrossRef]
- Yarie, J. Forest fire cycles and life tables: A case study from interior Alaska. Can. J. For. Res. 1981, 11, 554–562. [Google Scholar] [CrossRef]
- Van Cleve, K.; Chapin, F.S., III; Dyrness, C.T.; Viereck, L.A. Element cycling in taiga forests: State-factor control. Bioscience 1991, 41, 78–88. [Google Scholar] [CrossRef]
- Justino, F.; Bromwich, D.H.; Schumacher, V.; Dasilva, A.; Wang, S.-H. Arctic Oscillation and Pacific-North American pattern dominated-modulation of fire danger and wildfire occurrence. NPJ Clim. Atmos. Sci. 2022, 5, 52. [Google Scholar] [CrossRef]
- Duffy, P.A.; Walsh, J.E.; Graham, J.M.; Mann, D.H.; Rupp, T.S. Impacts of large-scale atmospheric–ocean variability on alaskan fire season severity. Ecol. Appl. 2005, 15, 1317–1330. [Google Scholar] [CrossRef] [Green Version]
- Kasischke, E.S.; Turetsky, M.R. Recent changes in the fire regime across the North American boreal region—Spatial and temporal patterns of burning across Canada and Alaska. Geophys. Res. Lett. 2006, 33, 1–5. [Google Scholar] [CrossRef] [Green Version]
- Krawchuk, M.A.; Cumming, S.G.; Flannigan, M.D.; Wein, R.W. Biotic and Abiotic Regulation of Lightning Fire Initiation in the Mixedwood Boreal Forest. Ecology 2006, 87, 458–468. [Google Scholar] [CrossRef]
- Calef, M.P.; McGuire, A.D.; Chapin, F.S., III. Human influences on wildfire in Alaska from 1988 through 2005: An analysis of the spatial patterns of human impacts. Earth Interact 2008, 12, 1–17. [Google Scholar] [CrossRef] [Green Version]
- Kasischke, E.S.; Williams, D.; Barry, D. Analysis of the patterns of large fires in the boreal forest region of Alaska. Int. J. Wildland Fire 2002, 11, 131–144. [Google Scholar] [CrossRef] [Green Version]
- Veraverbeke, S.; Rogers, B.M.; Goulden, M.L.; Jandt, R.R.; Miller, C.E.; Wiggins, E.B.; Randerson, J.T. Lightning as a major driver of recent large fire years in North American boreal forests. Nat. Clim. Chang. 2017, 7, 529–534. [Google Scholar] [CrossRef]
- Trainor, S.F.; Calef, M.; Natcher, D.; Chapin, F.S., III; McGuire, A.D.; Huntington, O.; Duffy, P.; Rupp, T.S.; DeWilde, L.O.; Kwart, M.; et al. Vulnerability and adaptation to climate-related fire impacts in rural and urban interior Alaska. Polar Res. 2009, 28, 100–118. [Google Scholar] [CrossRef]
- Nelson, J.L.; Zavaleta, E.S.; Chapin, F.S.I. Boreal Fire Effects on Subsistence Resources in Alaska and Adjacent Canada. Ecosystems 2008, 11, 156–171. [Google Scholar] [CrossRef]
- Melvin, A.M.; Murray, J.; Boehlert, B.; Martinich, J.A.; Rennels, L.; Rupp, T.S. Estimating wildfire response costs in Alaska’s changing climate. Clim. Chang. 2017, 141, 783–795. [Google Scholar] [CrossRef] [Green Version]
- Iglesias, V.; Braswell, A.E.; Rossi, M.W.; Joseph, M.B.; McShane, C.; Cattau, M.; Koontz, M.J.; McGlinchy, J.; Nagy, R.C.; Balch, J.; et al. Risky Development: Increasing Exposure to Natural Hazards in the United States. Earth’s Futur. 2021, 9, e2020EF001795. [Google Scholar] [CrossRef]
- Hu, F.S.; Brubaker, L.B.; Gavin, D.G.; Higuera, P.E.; Lynch, J.A.; Rupp, T.S.; Tinner, W. How Climate and Vegetation Influence the fire Regime of the Alaskan Boreal Biome: The Holocene Perspective. Mitig. Adapt. Strat. Glob. Chang. 2006, 11, 829–846. [Google Scholar] [CrossRef]
- Chapin, F.S.; Viereck, L.A.; Adams, P.C.; Van Cleve, K.; Fastie, C.L.; Ott, R.A.; Mann, D.; Johnstone, J.F. Successional processes in the Alaskan boreal forest. In Alaska’s Changing Boreal Forest; Chapin, F.S.I., Oswood, M.W., Van Cleve, K., Viereck, L.A., Verbyla, D.L., Eds.; Oxford University Press: New York, NY, USA, 2006; pp. 100–120. [Google Scholar]
- Shenoy, A.; Johnstone, J.F.; Kasischke, E.S.; Kielland, K. Persistent effects of fire severity on early successional forests in interior Alaska. For. Ecol. Manag. 2010, 261, 381–390. [Google Scholar] [CrossRef]
- Johnstone, J.F.; Hollingsworth, T.N.; Chapin, F.S., III; Mack, M.C. Changes in fire regime break the legacy lock on successional trajectories in Alaskan boreal forest. Glob. Chang. Biol. 2010, 16, 1281–1295. [Google Scholar] [CrossRef]
- Johnstone, J.F. Response of boreal plant communities to variations in previous fire-free interval. Int. J. Wildland Fire 2006, 15, 497–508. [Google Scholar] [CrossRef]
- Markon, C.; Gray, S.; Berman, M.; Eerkes-Medrano, L.; Hennessy, T.; Huntington, H.; Littell, J.; McCammon, M.; Thoman, R.; Trainor, S. Alaska. In Impacts, Risks, and Adaptation in the United States: Fourth National Climate Assessment; Reidmiller, D.R., Avery, C.W., Easterling, D.R., Kunkel, K.E., Lewis, K.L.M., Maycock, T.K., Stewart, B.C., Eds.; U.S. Global Change Research Program: Washington, DC, USA, 2018; Volume II, pp. 1185–1241. [Google Scholar]
- Bieniek, P.A.; Walsh, J.E.; Thoman, R.L.; Bhatt, U.S. Using Climate Divisions to Analyze Variations and Trends in Alaska Temperature and Precipitation. J. Clim. 2014, 27, 2800–2818. [Google Scholar] [CrossRef] [Green Version]
- Chapin, F.S.I.; Trainor, S.F.; Cochran, P.; Huntington, H.; Markon, C.; McCammon, M.; McGuire, A.D.; Serreze, M. Alaska. In Climate Change Impacts in the United States: The Third National Climate Assessment; Melillo, J.M., Richmond, T.C., Yohe, G.W., Eds.; U.S. Global Change Research Program: Washington, DC, USA, 2014; pp. 514–536. [Google Scholar]
- Fiore, N.M.; Goulden, M.L.; Czimczik, C.I.; Pedron, S.A.; Tayo, M.A. Do recent NDVI trends demonstrate boreal forest decline in Alaska? Environ. Res. Lett. 2020, 15, 095007. [Google Scholar] [CrossRef]
- Goetz, S.J.; Bunn, A.G.; Fiske, G.J.; Houghton, R.A. Satellite-observed photosynthetic trends across boreal North America associated with climate and fire disturbance. Proc. Natl. Acad. Sci. USA 2005, 102, 13521–13525. [Google Scholar] [CrossRef]
- Verbyla, D. The greening and browning of Alaska based on 1982–2003 satellite data. Glob. Ecol. Biogeogr. 2008, 17, 547–555. [Google Scholar] [CrossRef]
- Ju, J.C.; Masek, J.G. The vegetation greenness trend in Canada and US Alaska from 1984–2012 Landsat data. Remote Sens. Environ. 2016, 176, 1–16. [Google Scholar] [CrossRef]
- Wylie, B.; Rigge, M.; Brisco, B.; Murnaghan, K.; Rover, J.; Long, J. Effects of Disturbance and Climate Change on Ecosystem Performance in the Yukon River Basin Boreal Forest. Remote Sens. 2014, 6, 9145–9169. [Google Scholar] [CrossRef] [Green Version]
- Mann, D.H.; Rupp, T.S.; Olson, M.A.; Duffy, P.A. Is Alaska’s boreal forest now crossing a major ecological threshold? Arct. Antarct. Alp. Res. 2012, 44, 319–331. [Google Scholar] [CrossRef] [Green Version]
- Baltzer, J.L.; Day, N.J.; Walker, X.J.; Greene, D.; Mack, M.C.; Alexander, H.D.; Arseneault, D.; Barnes, J.; Bergeron, Y.; Boucher, Y.; et al. Increasing fire and the decline of fire adapted black spruce in the boreal forest. Proc. Natl. Acad. Sci. USA 2021, 118, e2024872118. [Google Scholar] [CrossRef]
- Beck, P.S.A.; Goetz, S.J.; Mack, M.C.; Alexander, H.D.; Jin, Y.; Randerson, J.T.; Loranty, M.M. The impacts and implications of an intensifying fire regime on Alaskan boreal forest composition and albedo. Glob. Chang. Biol. 2011, 17, 2853–2866. [Google Scholar] [CrossRef]
- Xian, G.; Homer, C.; Yang, L. Development of the USGS National Land Cover Database over two decades. In Advances in Environmental Remote Sensing: Sensors, Algorithms, and Applications; Weng, Q., Ed.; CRC Press: Boca Raton, FL, USA, 2011; pp. 529–544. [Google Scholar]
- NLCD (National Land Cover Datasets). 2016. Available online: https://www.mrlc.gov/data/nlcd-2016-land-cover-alaska (accessed on 1 January 2023).
- NALCMS (North American Land Change Monitoring Systems). Available online: http://www.cec.org/north-american-land-change-monitoring-system/ (accessed on 1 January 2023).
- Jin, S.; Homer, C.; Yang, L.; Danielson, P.; Dewitz, J.; Li, C.; Zhu, Z.; Xian, G.; Howard, D. Overall Methodology Design for the United States National Land Cover Database 2016 Products. Remote Sens. 2019, 11, 2971. [Google Scholar] [CrossRef] [Green Version]
- Wang, J.A.; Sulla-Menashe, D.; Woodcock, C.E.; Sonnentag, O.; Keeling, R.F.; Friedl, M.A. ABoVE: Landsat-Derived Annual Dominant Land Cover across ABoVE Core Domain, 1984–2014; ORNL DAAC: Oak Ridge, TN, USA, 2019. [Google Scholar]
- ABoVE. About ABoVE. NASA. 2022. Available online: https://above.nasa.gov/about.html (accessed on 1 January 2023).
- Cheyette, D.; Rupp, T.S.; Rodman, S. Developing Fire Behavior Fuel Models for the Wildland–Urban Interface in Anchorage, Alaska. West. J. Appl. For. 2008, 23, 149–155. [Google Scholar] [CrossRef] [Green Version]
- Viereck, L.A.; Dyrness, C.T.; Batten, A.R.; Wenzlick, K.J. The Alaska Vegetation Classification; USDA Forest Service: Portland, OR, USA, 1992; 278p. [Google Scholar]
- Van Cleve, K.; Viereck, L.A. Forest succession in relation to nutrient cycling in the boreal forest of Alaska. In Forest Succession, Concepts and Application; West, D.C., Shugart, H.H., Botkin, D.B., Eds.; Springer: New York, NY, USA, 1981; pp. 185–210. [Google Scholar]
- Van Cleve, K.; Dyrness, C.T.; Viereck, L.A.; Fox, J.; Chapin, F.S., III; Oechel, W.C. Taiga ecosystems in interior Alaska. Bioscience 1983, 33, 39–44. [Google Scholar] [CrossRef]
- Rogers, B.M.; Soja, A.J.; Goulden, M.L.; Randerson, J.T. Influence of tree species on continental differences in boreal fires and climate feedbacks. Nat. Geosci. 2015, 8, 228–234. [Google Scholar] [CrossRef] [Green Version]
- Johnstone, J.F.; Boby, L.; Tissier, E.; Mack, M.C.; Verbyla, D.; Walker, X. Postfire seed rain of black spruce, a semiserotinous conifer, in forests of interior Alaska. Can. J. For. Res. 2002, 39, 1575–1588. [Google Scholar] [CrossRef] [Green Version]
- Tesky, J.L. Tsuga mertensiana. U.S. Department of Agriculture, Forest Service, Rocky Mountain Research Station, Fire Sciences Laboratory 1992. Available online: https://www.fs.usda.gov/database/feis/plants/tree/tsumer/all.html (accessed on 1 January 2023).
- State of Alaska-Division of Forestry, Fairbanks Area Office. Community Wildfire Protection Plan for at-Risk Communities in the Fairbanks North Star Borough, Alaska Phase I. 2006. Available online: http://forestry.alaska.gov/Assets/pdfs/fire/cwpp/misc/fnsb_cwpp_v12.pdf (accessed on 1 June 2022).
- Viereck, L.A.; Dyrness, C.T.; Van Cleve, K.; Foote, M.J. Vegetation, soils, and forest productivity in selected forest types in interior Alaska. Can. J. For. Res. 1983, 13, 703–720. [Google Scholar] [CrossRef]
- Yarie, J.; Van Cleve, K. Controls over forest production in Interior Alaska. In Alaska’s Changing Boreal Forest; Chapin, F.S., III, Oswood, M.W., Van Cleve, K., Viereck, L.A., Verbyla, D.L., Eds.; LTER Oxford University Press: Cary, NC, USA, 2006; pp. 171–188. [Google Scholar]
- Oswald, E.T.; Brown, B.N. Forest Communities in Lake Laberge Ecoregion, Yukon Territory; Information Report BC-X.; Canadian Forestry Service, Pacific Forestry Centre: Victoria, BC, Canada, 1986. [Google Scholar]
- Stanek, W.; Orlóci, L. Vegetation survey of the Alaska Highway, Yukon Territory: Types and gradients. Plant Ecol. 1980, 41, 1–56. [Google Scholar] [CrossRef]
- Johnstone, J.F.; Chapin, F.S., III. Non-equilibrium succession dynamics indicate continued northern migration of lodgepole pine. Glob. Chang. Biol. 2003, 9, 1401–1409. [Google Scholar] [CrossRef]
- American Community Survey 1-Year Estimates Subject Tables. Available online: https://data.census.gov/table?t=Populations+and+People&g=0500000US02020&y=2021&tid=ACSST1Y2021.S0101 (accessed on 1 January 2023).
- Census of Population. Available online: https://www12.statcan.gc.ca/census-recensement/2021/dp-pd/prof/index.cfm?Lang=E (accessed on 1 January 2023).
- Goodrich, C.P.; Rodman, S.U.; Stam, J. Municipality of Anchorage Community Wildfire Protection Plan; Municipality of Anchorage: Anchorage, AK, USA, 2008. [Google Scholar]
- Vegetation Inventory-5K. Forest Management Branch. Available online: http://yukon.maps.arcgis.com/home (accessed on 1 January 2023).
- Chen, T. XGBoost: A Scalable Tree Boosting System. In Proceedings of the 22nd ACM SIGKDD International Conference on Knowledge Discovery and Data Mining, San Francisco, CA, USA, 13–17 August 2016; Krishnapuram, B., Shah, M., Smola, A.J., Aggarwal, C.C., Shen, D., Rastogi, R., Eds.; ACM: New York, NY, USA, 2016; pp. 785–794. [Google Scholar] [CrossRef]
- xgboost: eXtreme Gradient Boosting; R Package Version 0.4–2.1. 2015. Available online: https://github.com/dmlc/xgboost (accessed on 1 June 2022).
- Friedman, J.H. Greedy function approximation: A gradient boosting machine. Ann. Stat. 2001, 29, 1189–1232. [Google Scholar] [CrossRef]
- High-Resolution Gridded Datasets (and Derived Products). Available online: https://crudata.uea.ac.uk/cru/data/hrg/ (accessed on 1 June 2022).
- Harris, I.; Osborn, T.J.; Jones, P.; Lister, D. Version 4 of the CRU TS monthly high-resolution gridded multivariate climate dataset. Sci. Data 2020, 7, 109. [Google Scholar] [CrossRef] [Green Version]
- Web Soil Survey. United States Department of Agriculture. Available online: https://websoilsurvey.nrcs.usda.gov (accessed on 1 June 2022).
- Natural Resources Canada, Government of Canada. Canadian National Fire Database. Available online: https://cwfis.cfs.nrcan.gc.ca/ha/nfdb (accessed on 1 June 2022).
- Chapin, F.S., III; Hollingsworth, T.; Murray, D.F.; Viereck, L.A.; Walker, M.D. Floristic diversity and vegetation distribution in the Alaskan boreal forest. In Alaska’s Changing Boreal Forest, 1st ed.; Chapin, F.S., III, Oswood, M.W., Van Cleve, K., Viereck, L.A., Verbyla, D.L., Eds.; Long-term ecological network series. Oxford University Press: New York, NY, USA, 2006; Volume 6, pp. 81–99. [Google Scholar]
- Cater, T.C.; Chapin, F.S. Differential effects of competition or microenvironment on boreal tree seedling establishment after fire. Ecology 2000, 81, 1086–1099. [Google Scholar] [CrossRef]
- Gu, Z.; Gu, L.; Eils, R.; Schlesner, M.; Brors, B. circlize implements and enhances circular visualization in R. Bioinformatics 2014, 30, 2811–2812. [Google Scholar] [CrossRef] [Green Version]
- Calef, M.P.; Varvak, A.; McGuire, A.D.; Chapin, F.S.; Reinhold, K.B. Recent Changes in Annual Area Burned in Interior Alaska: The Impact of Fire Management. Earth Interact. 2015, 19, 1–17. [Google Scholar] [CrossRef] [Green Version]
- Finney, M.A. An Overview of FlamMap Fire Modeling Capabilities. In Fuels Management-How to Measure Success, 2006; Andrews, P.L.B., Bret, W., Eds.; USDA Forest Service: Madison, WI, USA, 2006; pp. 28–30. [Google Scholar]
- Andrews, P.L.; Bevins, C.D.; Seli, R.C. BehavePlus Fire Modeling System Version 4.0: User’s Guide; RMRS-GTW-106WWW; USDA Forest Service, Rocky Mountain Research Station: Fort Collins, CO, USA, 2008. [Google Scholar]
- Andrews, P.L. Current status and future needs of the BehavePlus Fire Modeling System. Int. J. Wildland Fire 2014, 23, 21–33. [Google Scholar] [CrossRef] [Green Version]
- Finney, M.A. FARSITE: Fire Area Simulator—Model Development and Evaluation; USDA Forest Service, Rocky Mountain Research Station: RMRS-RP-4: Ogden, UT, USA, 1998. [Google Scholar]
- Scott, J.H. NEXUS: A system for assessing crown fire hazard. Fire Manag. Notes 1999, 59, 20–24. [Google Scholar]
- Scott, J.H.; Reinhardt, E.D. Assessing Crown Fire Potential by Linking Models of Surface and Crown Fire Behavior; USDA Forest Service, Rocky Mountain Research Station: Fort Collins, CO, USA, 2001; RMRS Rp-29. [Google Scholar]
- Rothermel, R.C. A Mathematical Model for Predicting Fire Spread in Wildland Fuels; USDA Intermountain Forest and Range Experiment Station: Ogden, UT, USA, 1972. [Google Scholar]
- Frost, S.M.; Alexander, M.E.; Jenkins, M.J. The Application of Fire Behavior Modeling to Fuel Treatment Assessments at Army Garrison Camp Williams, Utah. Fire 2022, 5, 78. [Google Scholar] [CrossRef]
- Andrews, P.L. The Rothermel Surface Fire Spread Model and Associated Developments; USDA Forest Service, Rocky Mountain Research Station: Forest Collins, CO, USA, 2018. [Google Scholar] [CrossRef]
- Gaglioti, B.V.; Mann, D.H.; Jones, B.M.; Wooller, M.J.; Finney, B.P. High-resolution records detect human-caused changes to the boreal forest wildfire regime in interior Alaska. Holocene 2016, 26, 1064–1074. [Google Scholar] [CrossRef]
- Parent, M.B.; Verbyla, D. The Browning of Alaska’s Boreal Forest. Remote Sens. 2010, 2, 2729–2747. [Google Scholar] [CrossRef] [Green Version]
- Wang, J.A.; Sulla-Menashe, D.; Woodcock, C.E.; Sonnentag, O.; Keeling, R.F.; Friedl, M.A. Extensive land cover change across Arctic–Boreal Northwestern North America from disturbance and climate forcing. Glob. Chang. Biol. 2020, 26, 807–822. [Google Scholar] [CrossRef]
- Cahoon, S.M.P.; Sullivan, P.F.; Brownlee, A.H.; Pattison, R.R.; Andersen, H.E.; Legner, K.; Hollingsworth, T.N. Contrasting drivers and trends of coniferous and deciduous tree growth in interior Alaska. Ecology 2018, 99, 1284–1295. [Google Scholar] [CrossRef]
- Nicklen, E.F.; Roland, C.A.; Ruess, R.W.; Scharnweber, T.; Wilmking, M. Divergent responses to permafrost and precipitation reveal mechanisms for the spatial variation of two sympatric spruce. Ecosphere 2021, 12, e03622. [Google Scholar] [CrossRef]
- Airey-Lauvaux, C.; Pierce, A.D.; Skinner, C.N.; Taylor, A.H. Changes in fire behavior caused by fire exclusion and fuel build-up vary with topography in California montane forests, USA. J. Environ. Manag. 2022, 304, 114255. [Google Scholar] [CrossRef]
- Ouarmim, S.; Paradis, L.; Asselin, H.; Bergeron, Y.; Ali, A.A.; Hély, C. Burning Potential of Fire Refuges in the Boreal Mixedwood Forest. Forests 2016, 7, 246. [Google Scholar] [CrossRef] [Green Version]
- Balshi, M.S.; McGUIRE, A.D.; Duffy, P.; Flannigan, M.D.; Walsh, J.; Melillo, J.M. Assessing the response of area burned to changing climate in western boreal North America using a Multivariate Adaptive Regression Splines (MARS) approach. Glob. Chang. Biol. 2009, 15, 578–600. [Google Scholar] [CrossRef]
- Young, A.M.; Higuera, P.E.; Duffy, P.A.; Hu, F.S. Climatic thresholds shape northern high-latitude fire regimes and imply vulnerability to future climate change. Ecography 2017, 40, 606–617. [Google Scholar] [CrossRef]
- McCoy, V.M.; Burn, C.R. Potential Alteration by Climate Change of the Forest-Fire Regime in the Boreal Forest of Central Yukon Territory. Arctic 2005, 58, 276–285. [Google Scholar] [CrossRef] [Green Version]
- Chapin, F.S., III; Callaghan, T.V.; Bergeron, Y.; Fukuda, M.; Johnstone, J.F.; Juday, G.P.; Zimov, S.A. Global change and the boreal forest: Thresholds, shifting states or gradual change? Ambio 2004, 33, 361–365. [Google Scholar] [CrossRef] [PubMed]
- Berman, M.; Schmidt, J.I. Economic Effects of Climate Change in Alaska. Weather. Clim. Soc. 2019, 11, 245–258. [Google Scholar] [CrossRef]
- Foster, A.C.; Shuman, J.K.; Rogers, B.M.; Walker, X.J.; Mack, M.C.; Bourgeau-Chavez, L.L.; Veraverbeke, S.; Goetz, S.J. Bottom-up drivers of future fire regimes in western boreal North America. Environ. Res. Lett. 2022, 17, 025006. [Google Scholar] [CrossRef]
- Fettig, C.J.; Asaro, C.; Nowak, J.T.; Dodds, K.J.; Gandhi, K.J.K.; Moan, J.E.; Robert, J. Trends in Bark Beetle Impacts in North America During a Period (2000–2020) of Rapid Environmental Change. J. For. 2022, 120, 693–713. [Google Scholar] [CrossRef]
- Kelly, R.; Chipman, M.L.; Higuera, P.E.; Stefanova, I.; Brubaker, L.B.; Hu, F.S. Recent burning of boreal forests exceeds fire regime limits of the past 10,000 years. Proc. Natl. Acad. Sci. USA 2013, 110, 13055–13060. [Google Scholar] [CrossRef] [PubMed]


| Anchorage | Fairbanks | Whitehorse | ||||
|---|---|---|---|---|---|---|
| Actual | ||||||
| Predicted | 0 | 1 | 0 | 1 | 0 | 1 |
| 0 | 38,665 | 1635 | 130,139 | 108,045 | 571,058 | 111,373 |
| 1 | 2356 | 815 | 118,907 | 572,700 | 75,964 | 177,110 |
| Statistic | Anchorage | Fairbanks | Whitehorse |
|---|---|---|---|
| Accuracy | 90.8% | 75.6% | 80.0% |
| True positive | 33.3% | 84.1% | 61.4% |
| False positive | 66.7% | 15.9% | 38.6% |
| True negative | 94.3% | 52.3% | 88.3% |
| False negative | 6.1% | 91.4% | 13.3% |
| Precision | 25.7% | 82.8% | 70.0% |
| Recall | 33.3% | 84.1% | 61.4% |
| (a) | ||||||
| Pre-Fire Vegetation | Postfire Vegetation Recovery in 5-Year Increments | |||||
| 0–5 Years | 6–10 Years | 11–15 Years | 16–20 Years | 21–30 Years | >31 Years | |
| Hemlock | Spa. Veg. | Low shrub | Tall shrub | Tall shrub | Tall shrub | Hemlock |
| Bla. Spr. | Spa. Veg. | Spa. Veg. | Tall shrub | Tall shrub | Tall shrub | Bla. Spr. |
| Spr. For. | Spa. Veg. | Low shrub | Tall shrub | Tall shrub | Tall shrub | Spr. For. |
| Mixed forest | Low shrub | Tall shrub | Tall shrub | Tall shrub | Mix. For. | Mix. For. |
| Woodland | Spa. Veg. | Spa. Veg. | Open Shr. | Open Shr. | Woodland | Woodland |
| Dec. For. | Low shrub | Tall shrub | Tall shrub | Dec. For. | Dec. For. | Dec. For. |
| Open shrubs | Spa. Veg. | Open Shr. | Open Shr. | Dec. For. | Dec. For. | Dec. For. |
| Sha./lit. | Sha./lit. | Sha./lit. | Sha./lit. | Sha./lit. | Fen | Fen |
| Spa. Veg. | Spa. Veg. | Spa. Veg. | Spa. Veg. | Spa. Veg. | Tall shrub | Tall shrub |
| (b) | ||||||
| Pre-Fire Vegetation | Postfire Vegetation Recovery in 5-Year Increments | |||||
| 0–5 Years | 6–10 Years | 11–15 Years | 16–20 Years | 21–30 Years | >31 Years | |
| Lodgepole pine | Spa. Veg. | Low shrub | Tall shrub | Tall shrub | Lodgepole Pine | Lodgepole Pine |
| Sub-alpine fir | Spa. Veg. | Spa. Veg. | Spa. Veg. | Low shrub | Low shrub | Sub-alpine fir |
| Spr. For. | Spa. Veg. | Low shrub | Tall shrub | Tall shrub | Tall shrub | Spr. For. |
| Mixed forest | Low shrub | Tall shrub | Tall shrub | Tall shrub | Mix. For. | Mix. For. |
| Woodland | Spa. Veg. | Herbaceous | Herbaceous | Open Shr. | Open Shr. | Woodland |
| Dec. For. | Low shrub | Tall shrub | Tall shrub | Dec. For. | Dec. For. | Dec. For. |
| Open shrubs | Spa. Veg. | Open Shr. | Open Shr. | Open Shr. | Open Shr. | Woodland |
| Sha./lit. | Sha./lit. | Sha./lit. | Sha./lit. | Sha./lit. | Fen | Fen |
| Spa. Veg. | Spa. Veg. | Spa. Veg. | Spa. Veg. | Spa. Veg. | Woodland | Woodland |
Disclaimer/Publisher’s Note: The statements, opinions and data contained in all publications are solely those of the individual author(s) and contributor(s) and not of MDPI and/or the editor(s). MDPI and/or the editor(s) disclaim responsibility for any injury to people or property resulting from any ideas, methods, instructions or products referred to in the content. |
© 2023 by the authors. Licensee MDPI, Basel, Switzerland. This article is an open access article distributed under the terms and conditions of the Creative Commons Attribution (CC BY) license (https://creativecommons.org/licenses/by/4.0/).
Share and Cite
Calef, M.P.; Schmidt, J.I.; Varvak, A.; Ziel, R. Predicting the Unpredictable: Predicting Landcover in Boreal Alaska and the Yukon Including Succession and Wildfire Potential. Forests 2023, 14, 1577. https://doi.org/10.3390/f14081577
Calef MP, Schmidt JI, Varvak A, Ziel R. Predicting the Unpredictable: Predicting Landcover in Boreal Alaska and the Yukon Including Succession and Wildfire Potential. Forests. 2023; 14(8):1577. https://doi.org/10.3390/f14081577
Chicago/Turabian StyleCalef, Monika P., Jennifer I. Schmidt, Anna Varvak, and Robert Ziel. 2023. "Predicting the Unpredictable: Predicting Landcover in Boreal Alaska and the Yukon Including Succession and Wildfire Potential" Forests 14, no. 8: 1577. https://doi.org/10.3390/f14081577