Article

Changes in Ecosystem Service Values of Forests in Southwest China’s Karst Regions from 2001–2020

1
School of Karst Science, Guizhou Normal University, Guiyang 550001, China
2
Real Estate Registration Center of Guizhou Province, Guiyang 550001, China
3
The State Key Laboratory Incubation Base for Karst Mountain Ecology Environment of Guizhou Province, Guiyang 550001, China
*
Author to whom correspondence should be addressed.
Forests 2023, 14(8), 1534; https://doi.org/10.3390/f14081534
Submission received: 4 June 2023 / Revised: 21 July 2023 / Accepted: 24 July 2023 / Published: 27 July 2023

Abstract

:
Forests, serving as crucial custodians of our planet’s ecological balance, also constitute a significant source of livelihood for humanity. Karst regions, recognized as some of the world’s most susceptible landscapes, grapple with the dual predicaments of ecological restoration and resident impoverishment. To bridge the gap between environmental and economic concerns, this manuscript employs an amalgamation of remote sensing and socio-economic methodologies to devise a comprehensive assessment framework, thereby scrutinizing the alterations in forest ecosystems from 2001 to 2020.The investigation reveals that over the past two decades, forest rehabilitation within the study area has yielded commendable outcomes, substantially mitigating various ecological dilemmas instigated by rocky desertification in this region. The forested area has increased significantly, and the ecosystem service value has more than doubled. These improvements are largely attributed to compulsory forest conservation measures, demonstrating their decisive influence. The study advocates meticulous management and conservation strategies to safeguard these unique ecosystems and ensure their sustainability. This research underscores the significance of striking a balance between maintaining ecological integrity and fostering economic development, thereby contributing to the broader discourse on sustainable forest management in vulnerable landscapes.

1. Introduction

Forests, encompassing approximately one-third of Earth’s terrestrial surface [1], serve as crucial constituents in maintaining our planet’s ecological balance while providing an array of indispensable ecosystem services vital to human well-being. Forests are geographically unevenly distributed across the globe. Russia, Brazil, Canada, the United States, and China collectively account for 54% of the world’s forested areas [2], thereby conferring upon these nations a heightened responsibility for safeguarding forest ecosystems. Moreover, forests function as crucial components within the Earth’s biosphere, contributing not only to global energy and material cycles, but also furnishing a variety of direct and indirect products essential for human life and economic development. Forests represent a principal source of livelihood for innumerable communities [3], particularly in rural areas. However, factors such as anthropogenic activities, wildfires, pests, diseases, and other environmental perturbations can degrade forests, resulting in diminished supply of forest products and services, biodiversity value, productivity, and health [4]. Forest degradation can also precipitate other adverse environmental consequences, including deterioration of downstream water quality and increased greenhouse gas emissions [5,6]. Although a multitude of measures have been enacted globally to ensure the sustainable utilization of forest resources, the rate of forest area loss has slowed, yet forested areas continue to decrease worldwide. This issue is particularly acute in developing countries, especially in impoverished regions.
The sustainable use of forests is intimately linked to societal challenges such as eradicating poverty and addressing global climate change [7]. To bridge the gap between environmental and economic concerns, scientists across the world have conducted extensive research and devised comprehensive frameworks to quantify the myriad benefits of forest ecosystems and account for the stock and flow of forest resources within the environmental and economic systems [8,9]. The System of Environmental-Economic Accounting—Ecosystem Accounting (SEEA EA) proffers a systematic approach for measuring and reporting the economic, social, and environmental values of forest ecosystems [10], predicated on the principles of the System of Environmental-Economic Accounting Central Framework (SEEA-CF) [11]. Concurrently, it is a spatially based comprehensive statistical framework [12] employed to organize biophysical information about ecosystems, measure ecosystem services, monitor changes in ecosystem scope and conditions, evaluate ecosystem services and assets, and integrate this information with measurements of economic and human activities.
This framework has yielded some noteworthy findings in the appraisal of forest ecosystem value. Countries such as the UK and the Netherlands have published the most comprehensive accounting results thus far, and the EU has developed supranational accounting [13]. However, the implementation of SEEA EA typically necessitates detailed and comprehensive data, which is relatively accessible in developed countries but often unattainable in remote or economically disadvantaged developing countries. Additionally, the imperfect national economic accounting systems of developing countries hinder the integration of data procured from various statistical measurements using unified standards, precluding comprehensive analysis. Consequently, there remain numerous limitations and challenges in the promotion and application process. Despite the backing of several pilot projects by the World Bank and the United Nations [14], such as the Natural Capital Accounting and Valuation of Ecosystem Services (NCAVES) project [15,16], these constraints cannot be entirely surmounted. For instance, in Indonesia, the government favors planning land use over mapping spatial data on forest scope, conditions, and use [17,18], thereby rendering it incapable of monitoring forest resource use and fluctuations in forest ecosystem conditions and values using statistical data. This underscores a pressing gap that needs to be addressed in developing nations, particularly in economically deprived areas: how can we employ limited biophysical parameters to rapidly evaluate the ecosystem changes in the range, quality, and value of these regions, thereby fostering the sustainable development of the local economy and society? To address these limitations, an increasing number of geographers have become engaged in this work. Owing to advancements in remote sensing and geographic information technology, scientists have been able to employ remote sensing data to monitor forests globally, including their distribution, health status, and other relevant attributes. Satellite data reveals that China’s net growth in leaf area between 2000 and 2017 accounted for 25% of the global total, with 42% of this greening stemming from forests [19,20]. By harnessing remote sensing technology, researchers can access an abundance of data on forest ecosystems, which can be analyzed in tandem with socio-economic data to furnish a more comprehensive understanding of the value of forest ecosystem services and the factors influencing their changes. Integrating remote sensing data with socio-economic data can yield more accurate and spatially explicit assessments of forest ecosystem services, as well as their value and temporal changes [21,22]. This approach holds the potential to surmount the data limitations faced in poverty-stricken and remote areas, contributing to a more accurate and holistic comprehension of forest ecosystems and their role in supporting human well-being. Simultaneously, policymakers and forest managers can acquire a more comprehensive understanding of the implications of different management options for both ecosystems and human well-being.
Our analysis of remote sensing data on global forest change over the past 20 years indicates that forest change in China is highly significant, with a substantial proportion of karst mountainous areas in the Southwest experiencing reforestation [23,24]. These areas serve as vital ecological barriers in the upper reaches of the Yangtze River and represent ecologically fragile regions characterized by a widespread distribution of karst landforms. The karst area in southwest China, influenced by both natural and human factors, underwent severe degradation of karst rocky desertification from the 1950s to the 1990s. The ecosystem in this region is exceptionally fragile, and the poverty rate among farmers is high, resulting in a pronounced conflict between humans and land [25,26,27]. For instance, in karst areas where farmland is scarce, numerous impoverished farmers increase their income by deforesting. However, deforestation leads to a larger scale of rocky desertification, which further exacerbates the difficulties in agricultural production, creating a phenomenon of “the more deforestation, the poorer; the poorer, the more deforestation”. Therefore, the objective of this research is to harness remote sensing and socioeconomic data to scrutinize changes in the forest ecosystem of the area from 2001 to 2020. By doing so, we aim to evaluate the impacts of forest conservation implementations, investigate the delicate balance between ecosystem protection and economic growth, and thereby provide guidance to policy makers. This assistance would be instrumental in facilitating prudent forest management decisions, considering ecosystem functionality and human welfare considerations.

2. Materials and Methods

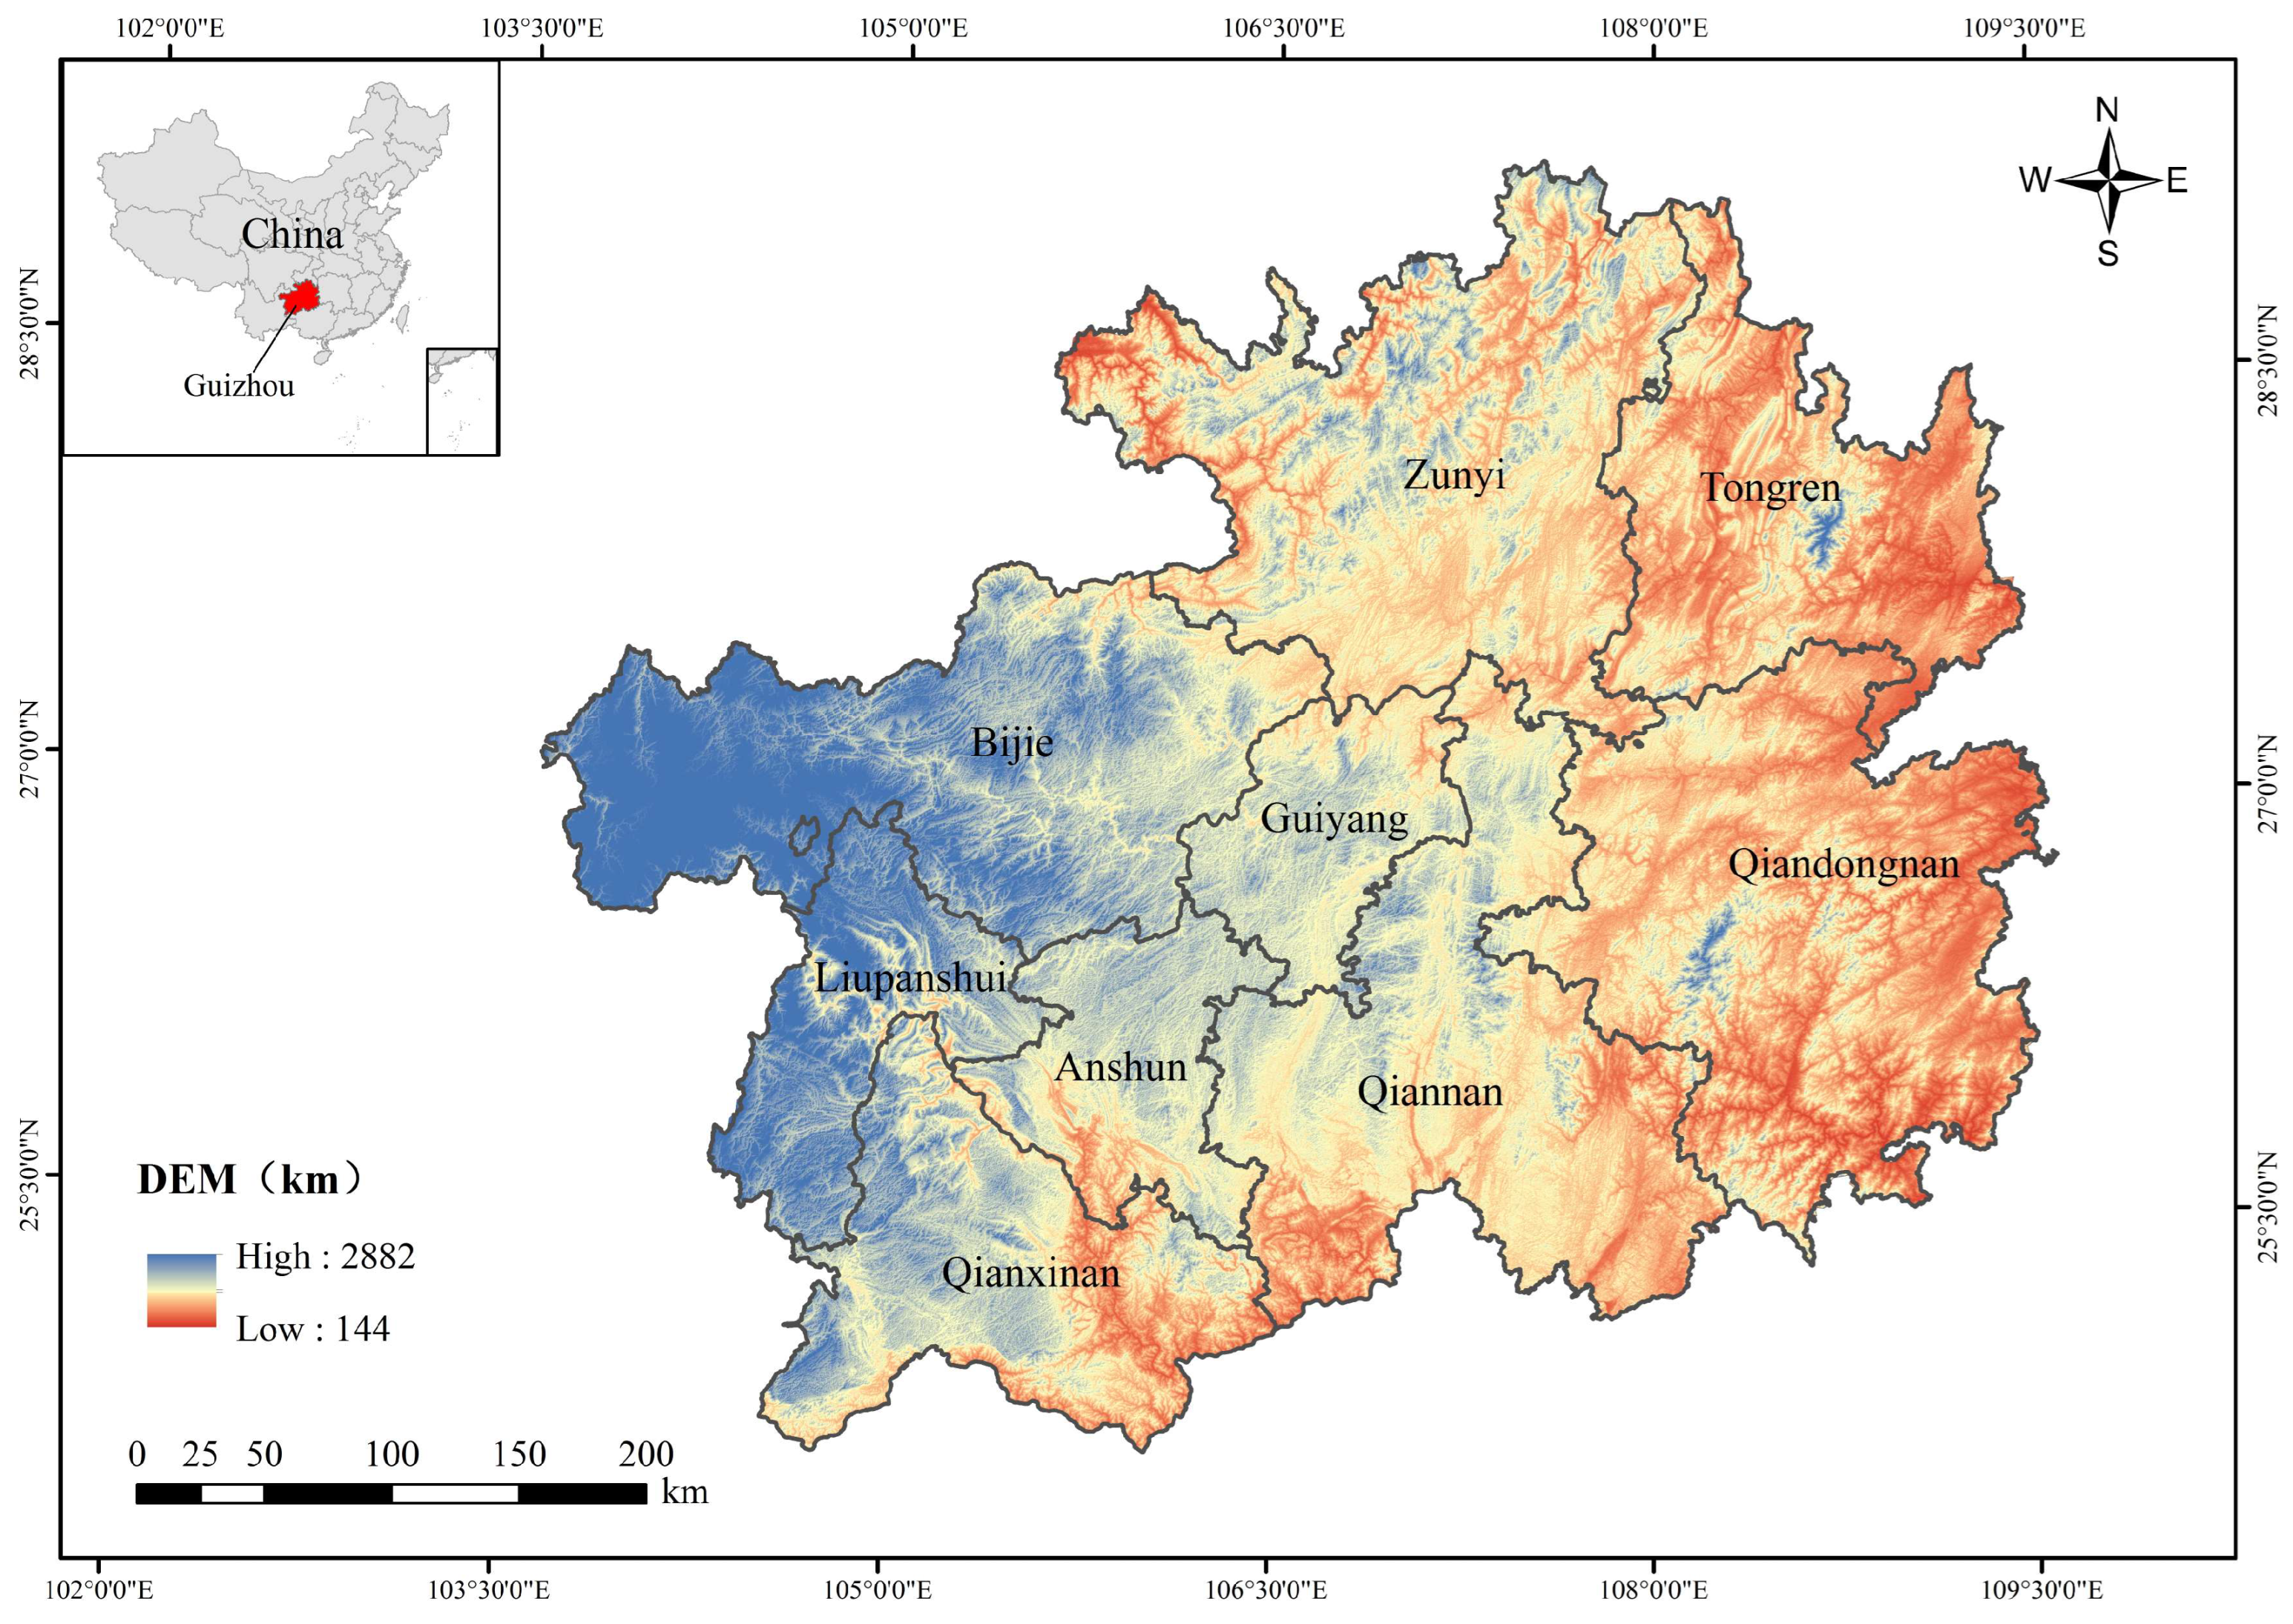
2.1. Overview of the Study Area

Nestled within the karst mountainous expanse of southwest China lies the study area, a unique and intricate ecosystem distinguished by its remarkable topography and diverse vegetation (Figure 1). This region, predominantly composed of limestone and dolomite formations [28], stands as a quintessential exemplar of global karst landforms, with an extensive karst development encompassing over 73.8% of the total area [29,30,31].
The region’s climate is classified as subtropical monsoon, characterized by high temperatures and abundant rainfall. The average annual temperature ranges from 14 °C to 16 °C, and the annual precipitation averages between 1000 mm and 1300 mm. This climate, in conjunction with the region’s distinctive karst topography, has catalyzed a rapid greening process. The region’s vegetation is as multifaceted as its topography, including a variety of co-existing forest types. Economically significant and ubiquitously distributed coniferous forests, primarily composed of Chinese fir (Cunninghamia lanceolata), Mason pine (Pinus massoniana), Yunnan pine (Pinus yunnanensis), and cypress forests (Cupressus spp.), intermingle with broad-leaved forests. The latter predominantly comprise species from the Fagaceae family, including Fagus spp., Lauraceae family with Laurus spp., Magnoliaceae family with Magnolia spp., and Camelliaceae family with Camellia spp. [32]. These forests are interspersed with bamboo forests, shrubs, and swamp and aquatic vegetation, contributing to the region’s rich biodiversity.
The strata of the research area predominantly consist of sedimentary rocks and slightly metamorphosed sedimentary rocks, with igneous rocks and highly metamorphosed rocks being sparse. Among the sedimentary rocks, carbonate rocks are the most developed, with an accumulated thickness of up to 20,000 m. Due to the restriction of parent-rock properties in soil formation, the research area exhibits lithogenic soils such as calcareous and purple soils. Soil types, distributed roughly from south to north, encompass ferruginous tropical soil, lateritic red soil, yellowish-red soil, yellow soil, yellow-brown soil, and montane meadow soil. Karst landforms in this region are characterized by a variety of dissolution features, including sinkholes, caves, and disappearing streams, formed as a consequence of the dissolution of the underlying soluble rock by slightly acidic water. These areas typically possess complex subterranean drainage systems, with water infiltrating the ground through sinkholes and other surface features and coursing through a network of subterranean channels and caves. This results in sparse surface water, with streams and rivers often disappearing underground. The soil in this region, often thin and rocky due to the karst topography, has given rise to unique vegetation patterns [33,34,35]. Plants must adapt to the rocky soil and fluctuating water availability [36].
The vegetation in this region exhibits zonality driven by thermal conditions and water constraints. The subtropical monsoon climate, in conjunction with the region’s distinctive karst topography, has catalyzed a rapid greening process, particularly in the Karst Peak-Cluster Depression and Karst Trough Valley [37]. However, in non-karst areas of the west highland in the Karst Fault Basin and Karst Plateau, decreasing rainfall has caused recent degradation. Vertically, a distinct zonal pattern is observable under the comprehensive influence of water, heat, and other environmental factors [38]. The interplay of these factors has resulted in a diverse range of forest types, from coniferous and broad-leaved forests to bamboo forests, shrubs, and swamp and aquatic vegetation.
Simultaneously, as the region embarks on ecological restoration initiatives such as the reforestation of agricultural land, it is also hosting industries such as distinctive fruit forestry, under-forest economy, and forest ecotourism. These endeavors aim to augment the economic value of forestry products, thereby striking a balance between ecological preservation and economic development.

2.2. Dataset

In this investigation, we utilized both spatial and socio-economic data to evaluate alterations in forest resources. The spatial data, procured from the Google Earth Engine Platform, were juxtaposed with socio-economic data, encompassing forest products and forest-related disasters, sourced from the Guizhou Statistical Yearbook spanning the years 2001 through 2021. We procured land-cover data (the MCD12Q1 V6 product) from 2001 to 2020 with a resolution of 500 m, which derived from supervised classifications of MODIS Terra and Aqua reflectance data. These land-cover data were generated by a decision-tree classification algorithm. This algorithm utilizes various data layers, including surface reflectance, brightness temperature, land-surface temperature, vegetation indices, and derived-texture metrics. The classification scheme included 5 legacy classification schemes (IGBP, UMD, LAI, BGC, and PFT). The International Geosphere-Biosphere Programme (IGBP) scheme is used in this research, which classifies land cover into 17 classes, including various types of forests, shrublands, savannas, wetlands, and urban areas [39]. The Landsat net primary production CONUS (NPP) was ascertained and the Global Precipitation Measurement (GPM) data (Monthly Global Precipitation Measurement v6) were utilized to amend the pre-existing findings pertaining to ecological value. The Global Precipitation Measurement signifies an international satellite endeavor that furnishes cutting-edge observations of precipitation in the form of rain and snow on a global scale, with an update interval of three hours. The Integrated Multi-Satellite Retrievals for GPM (IMERG) represents a consolidated algorithm that generates rainfall estimates by amalgamating data from all passive-microwave instruments integrated within the GPM Constellation. Additionally, we employed a digital elevation model (DEM) with a resolution of 12.5 m to generate the slope, elevation, and aspect of the study area (Table 1).

2.3. Methods

2.3.1. Indicator Framework

This investigation presents an exhaustive and multi-dimensional methodology to scrutinize the alterations in forest resources within the karst mountainous expanse of southwest China. Initially, the remote sensing examination employs land-cover data to delineate the scope and categorization of forests within the research zone, and a change detection analysis is executed in Google Earth Engine (GEE) to pinpoint regions of forest augmentation and depletion throughout the investigation years. This necessitates a comparison of land-cover data (IGBP classification system. Appendix A) across various years and the identification of pixels that have transitioned from one forest classification to another, or from forest to non-forest, and vice versa. The Digital Elevation Model (DEM) data are utilized to generate topographic variables that could potentially impact the distribution of forests, such as slope, elevation, and aspect.
The statistical analysis incorporates landscape indices to mirror alterations in the landscape configuration of the research zone. These indices, computable via Python, provide quantitative assessments of landscape fragmentation, connectivity, diversity, and other attributes. These indices are computed for each year of the investigation duration, facilitating a quantitative appraisal of alterations in the landscape configuration over time.
Finally, through the amalgamation of remote sensing data, socio-economic data, field surveys, and community surveys, this manuscript establishes two accounts (Table 2), specifically, physical condition and ecosystem services to monitor the spectrum of forest resources, health status, yield of forest products, and alterations in ecosystem services within the research zone. The fusion of qualitative and quantitative analysis enables a comprehensive appraisal of alterations in forest resources. This methodology enhances the insights derived from the remote sensing and landscape analysis, offering a more intricate and nuanced comprehension of the complex interplay between natural and human factors within the research zone.

2.3.2. Landscape Index

The research zone has experienced substantial population migration and adjustments in land-use policy over the past two decades. The examination of landscape-pattern evolution can elucidate the mechanism of interaction between frequent human disturbances and the process of forest transformation [40,41]. Consequently, this manuscript has chosen a suite of indices—Number of Patch (NP), Patch Density (PD), Largest Patch Index (LPI), Edge Density (ED), Mean Area Index (AREA_MN), Mean Shape Index (SHAPE_MN), Mean Patch Fractal Dimension (FRAC_MN), Patch Cohesion Index (COHESION), Landscape Division Index (DIVISION), and Aggregation Index (AI)—to holistically represent the evolution of the landscape pattern within the research zone. The calculation of these landscape indices involved the use of MCD12Q1 V6 land-cover data. These data were transmuted into binary maps, facilitating the extraction of four distinct forest cover categories: Evergreen Needleleaf Forest, Evergreen Broadleaf Forest, Deciduous Broadleaf Forest, and Mixed Forest. Simultaneously, non-forest background data was assigned a value of 9999. This process yielded a sequence of landscape indices for the study area, with the computation method as follows (Table 3):

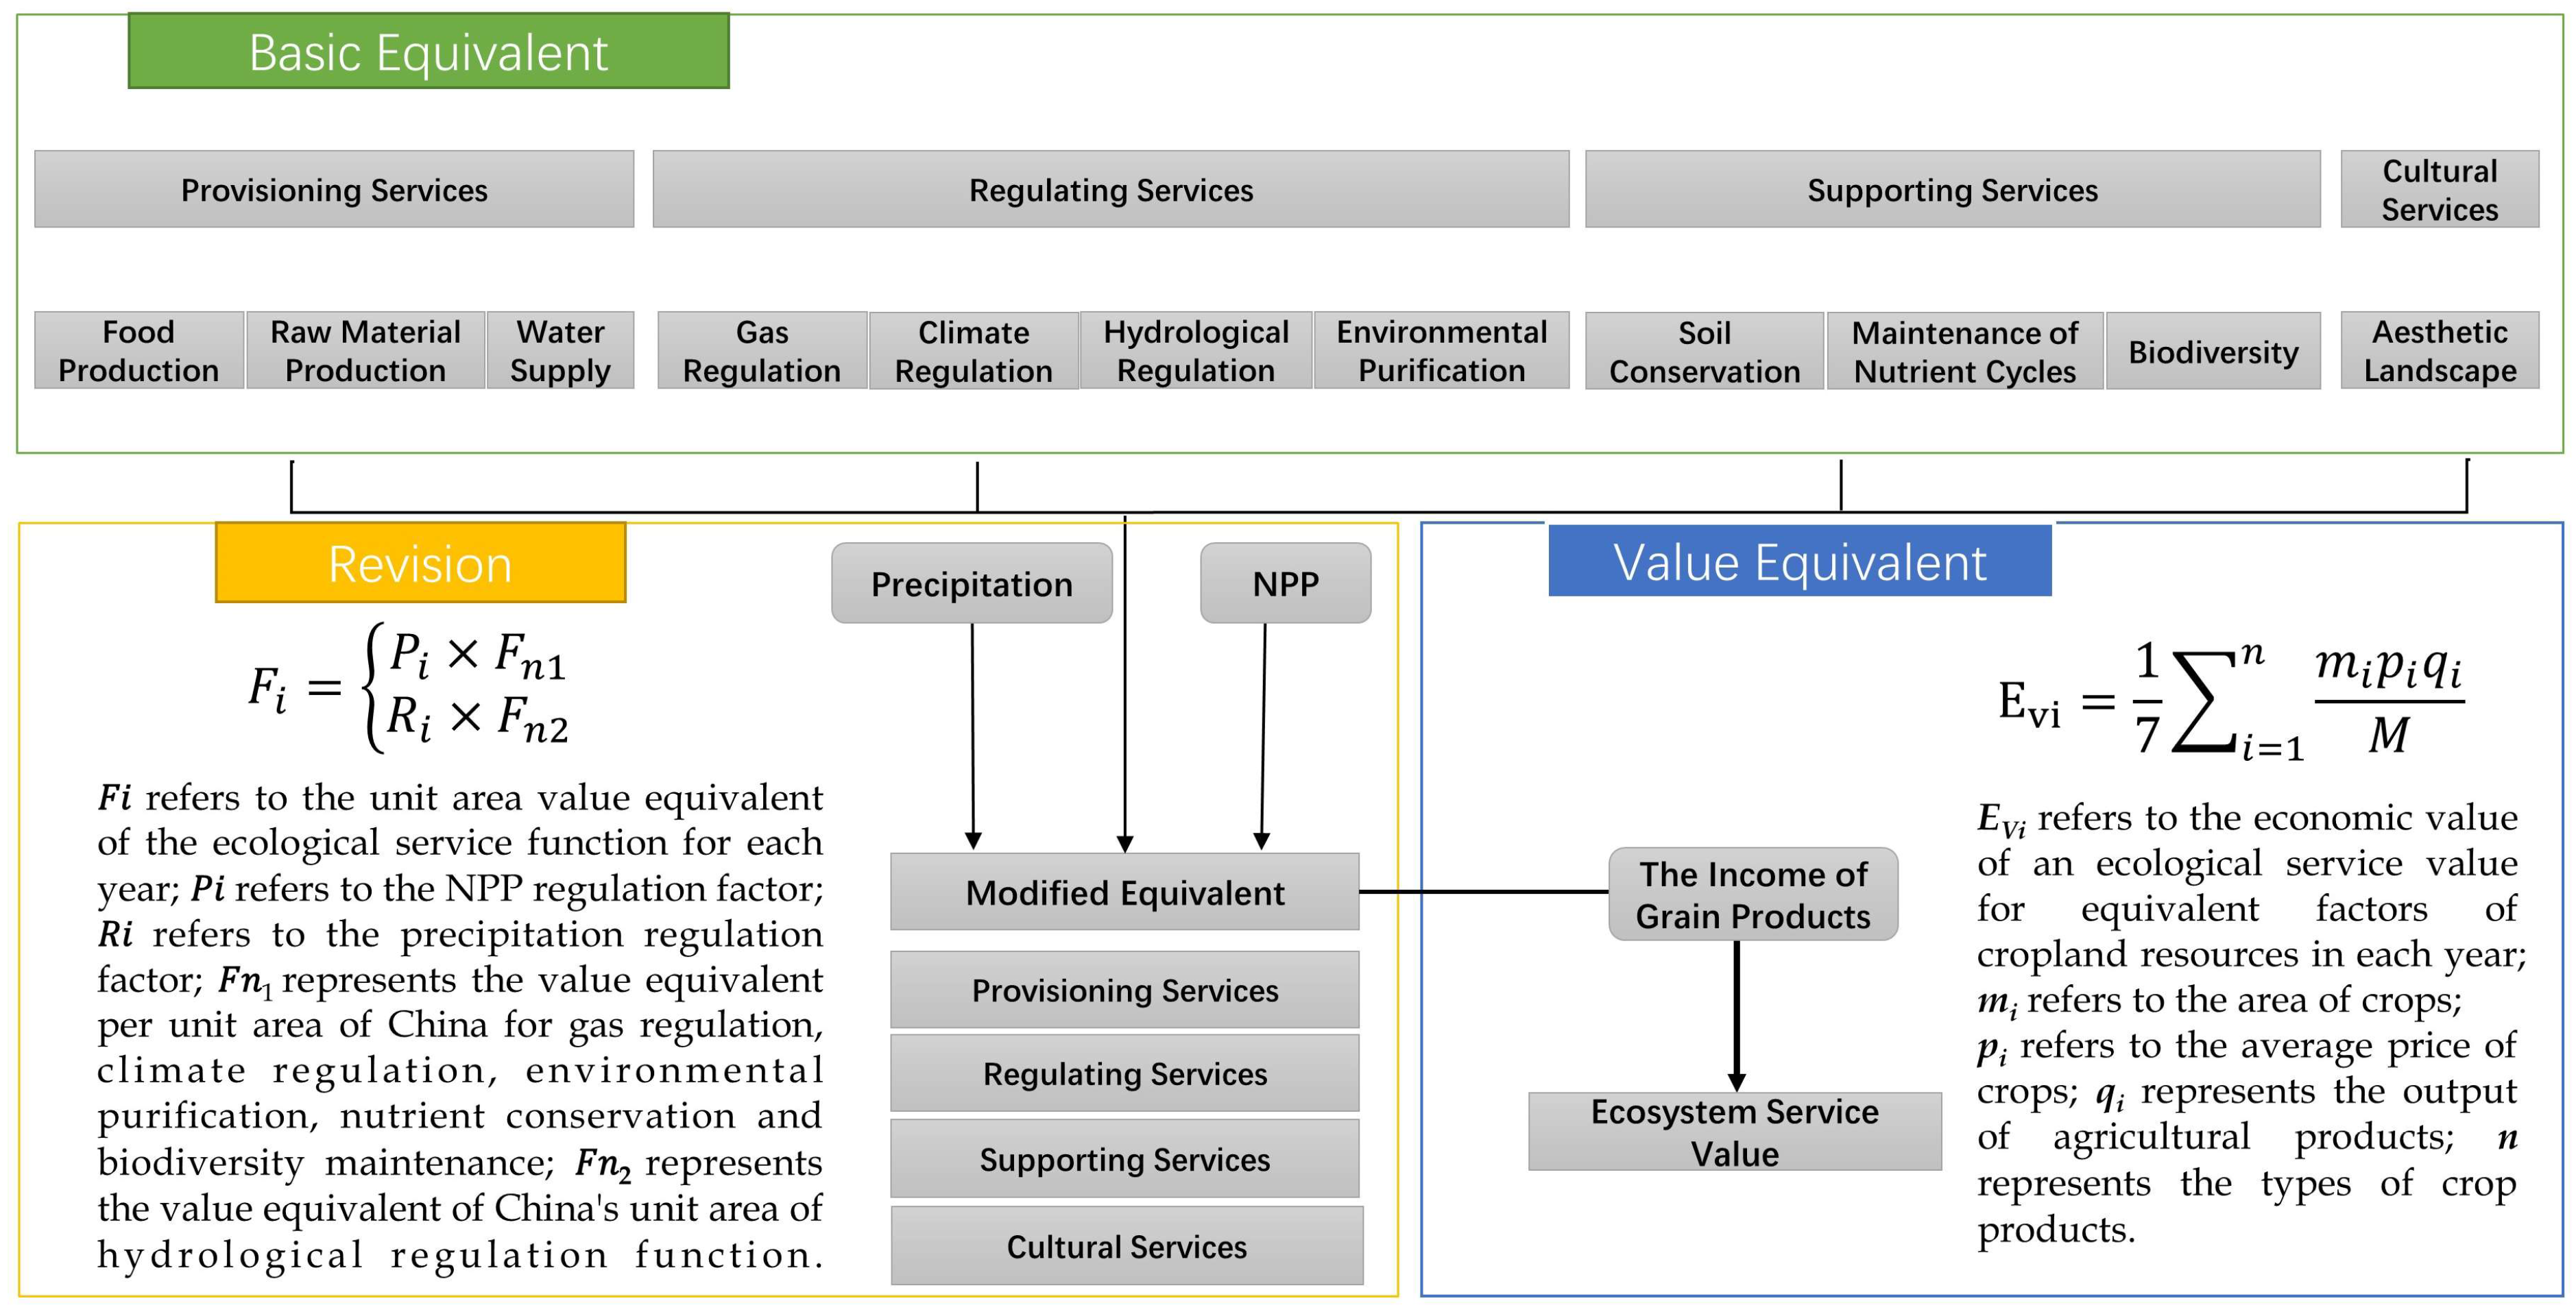
2.3.3. Ecosystem Services Value-Equivalent Model

Forests, as an important ecosystem, provide four categories of ecosystem services for human beings, which are provisioning services (PS), regulating services (RS), supporting services (SS) and cultural services (CS) [47]. Our investigation employed a revised version of the ecosystem service value-estimation methodology proposed by Costanza et al. [48,49]. This approach was further refined by Chinese researchers including Xie Gaodi et al. to accommodate the economic conditions, land usage, and vegetation types particular to China. The methodology initially calculates the value of various ecosystem services as an equivalent to the value of food production from farmland, that is, setting the equivalent value of ecological services for food production in farmland as 1, and calculating the value of other types of ecosystem services based on the willingness to consume or pay. This value is the ratio of the welfare obtained from the annual food production of farmland, forming the equivalent value of various ecosystems. For the study area, the grain crops of the farmland ecosystem are rice, wheat, and corn, so the output of these three major food crops is used to measure the value of various ecosystems (58.5 2007$/hm2).
V i   =   S r i × F r i   + S w i × F w i   + S c i × F c i  
In the formula, V i   represents the value of ecosystem services of a standard equivalent factor ($/hm2); S r i , S w i , S c i , respectively, represent the percentage (%) of the sown area of rice, wheat, and corn in the total sown area of the three crops in the i-th year; F r i   , F w i   , F c i   represent the average net profit per unit area of rice, wheat, and corn in the i-th year ($/hm2).
Next, given that the ecosystem services such as food supply, climate regulation, and biodiversity of the ecosystem are generally positively correlated with biomass, and the supply of water resources and the regulation of water temperature are highly correlated with changes in precipitation, in conjunction with the research results of other scholars, this study revised the equivalent values to attain an equivalent that can more accurately reflect spatial heterogeneity [50]. The specific process is illustrated in the following diagram (Figure 2):

3. Results

3.1. Changes in Physical Condition

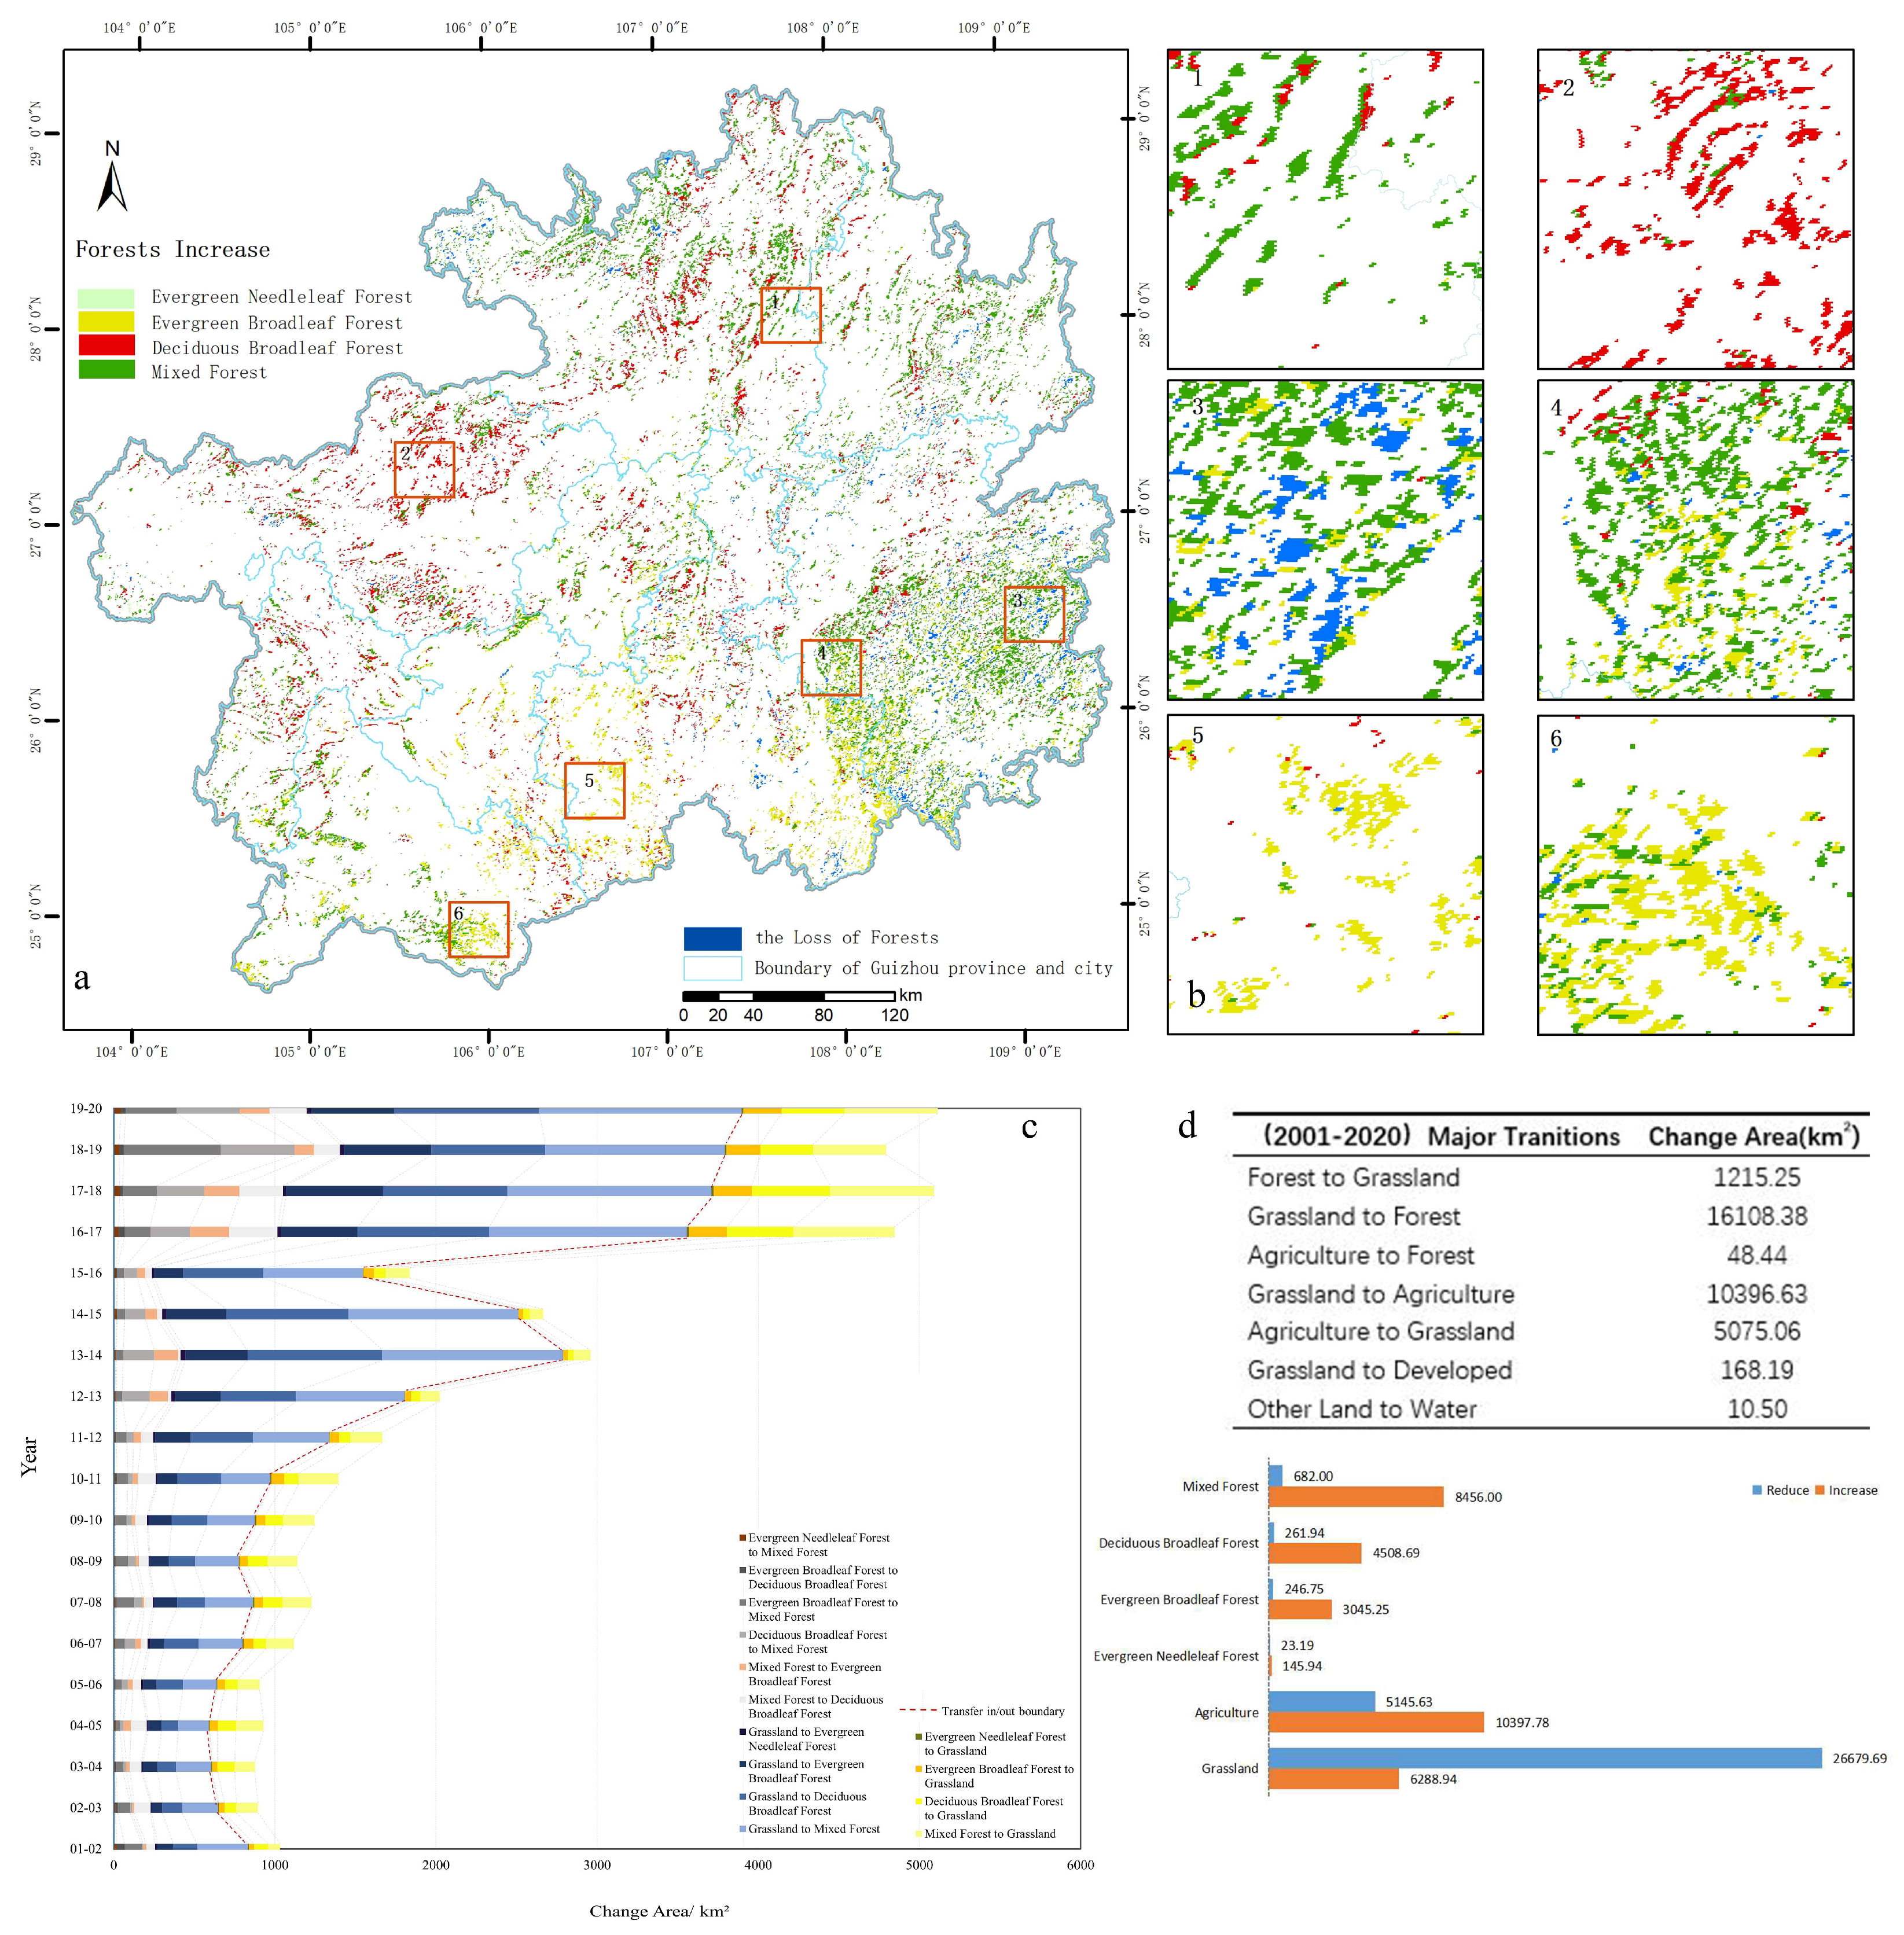
3.1.1. Extent Changes and Area Transfer

During this investigation, we discerned that those four types of forests—namely, Evergreen Needleleaf Forest (ENF), Evergreen Broadleaf Forest (EBF), Deciduous Broadleaf Forest (DBF), and Mixed Forest (MF)—underwent significant transformations. This was determined by analyzing the spatial pattern evolution of forest-cover data from 2001 to 2020 and calculating the characteristics of forest augmentation or diminution. It is evident (Figure 3a) that the distribution of forests within the research zone has conspicuously expanded and exhibited regional disparities over the past two decades, with the exception of a partial decline in the southeast region (Figure 3a-3). Owing to the elevated altitude and low annual average temperature in the western region, the primary increase is observed in Deciduous Broadleaf Forest (Figure 3a-2), while the southern region, with ample precipitation and heat conditions, predominantly experienced an increase in Evergreen Broadleaf Forest [51,52] (Figure 3a-5). Moreover, the terrain in the southeast is relatively flat with inconspicuous karstification, primarily constituting a non-karst area [30,53]. Contrasting with the relatively dispersed patches in other regions, various types of forests in this region have expanded over a substantial area. Lastly, in the northern region, characterized by the most intricate comprehensive effects of altitude, precipitation, and temperature, the four types of forests have augmented to varying extents.
Subsequently, the alteration in forest area is concomitant with the conversion of forests to other land categories and the conversion of other land types into forests. Concurrently, the four types within forests also undergo conversion between each other (Figure 3c). As depicted in the figure (Figure 3c), the change in forest area can be approximately bifurcated into two phases. Prior to 2012, the area transfer between forest and other land types remained relatively stable, with the ratio of transfer-in to transfer-out approximating 2 (Table 4). “Transferred in” refers to the area increase resulting from the conversion of various other land categories into forests, while “transferred out” refers to the area decrease resulting from the transformation of forests into other land categories. Post 2012, the transformation within the research zone underwent a dramatic shift. The forest area expanded significantly, with the maximum value of the transfer-in to transfer-out ratio exceeding 16, and the net increased area escalated from 635.31 km2 in 2002 to 2677 km2 in 2020.
The primary catalyst for the augmentation of forest within the research zone is substantiated to be the consistent transformation of grassland into forest over the past two decades (Figure 3d), encompassing a total area of 16,108.28 square kilometers. The alteration in Mixed Forest is the most conspicuous, with an increase of 8456 km2 and a decrease of 682 km2, succeeded by Deciduous Broadleaf Forest (an increase of 4508.69 km2 and a decrease of 261.94 km2). In contrast to other types, the transformation of Evergreen Coniferous Forest is a bit less.

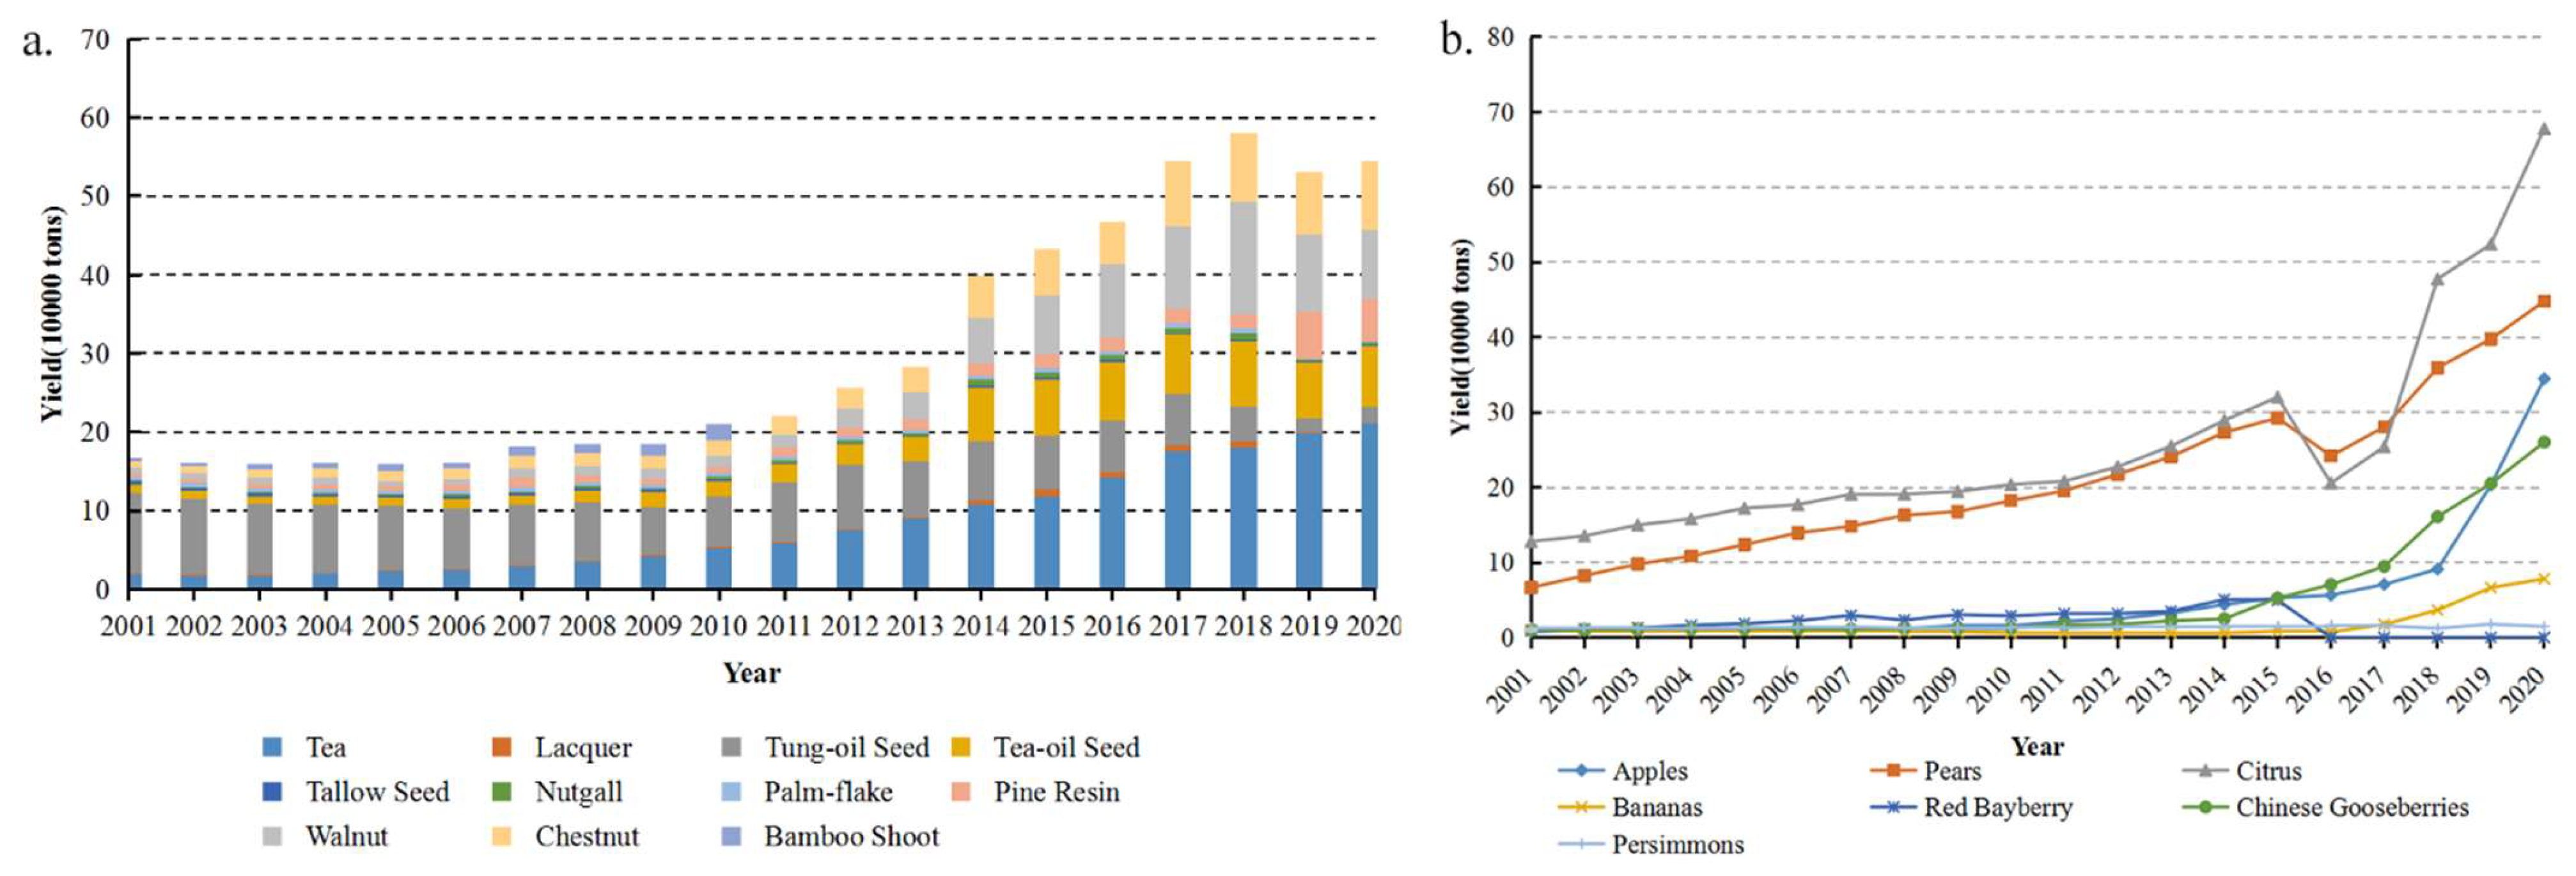
3.1.2. Forest Products

The hydrothermal conditions within the research zone are highly favorable for plant growth. The primary economic forests encompass fruit trees (Rosaceae), tea trees (Camellia sinensis), woody oil plants (Euphorbiaceae), lacquer plants (Toxicodendron vernicifluum), and Chinese medicinal herbs. As depicted (Figure 4a), the yield of forest products in this region prior to 2006 was exceedingly low, with minimal annual fluctuations. From 2007 to 2013, it transitioned into a phase of gradual growth, after which the yield of various forest products commenced a rapid escalation. Among these, tea and its subsidiary products, walnuts (Juglans regia) and chestnuts (Castanea sativa) emerged as the primary forest products, with the output amplifying 11-fold. Regarding the yield of fruit (Figure 4b), the output of citrus (Citrus spp.) significantly surpasses that of other fruits, thereby conferring a distinct advantage in the region. Additionally, the local area is abundant in a variety of prickly pear (Opuntia spp.), which yielded more than 440,000 tons in 2020. Another notable transformation is that post-2014, the yield of apple (Malus domestica) (from 0.79 million tons to 34.46 million tons) and kiwi (Actinidia deliciosa) (0.99 million tons to 26.01 million tons) also escalated significantly, increasing by over 25-fold.

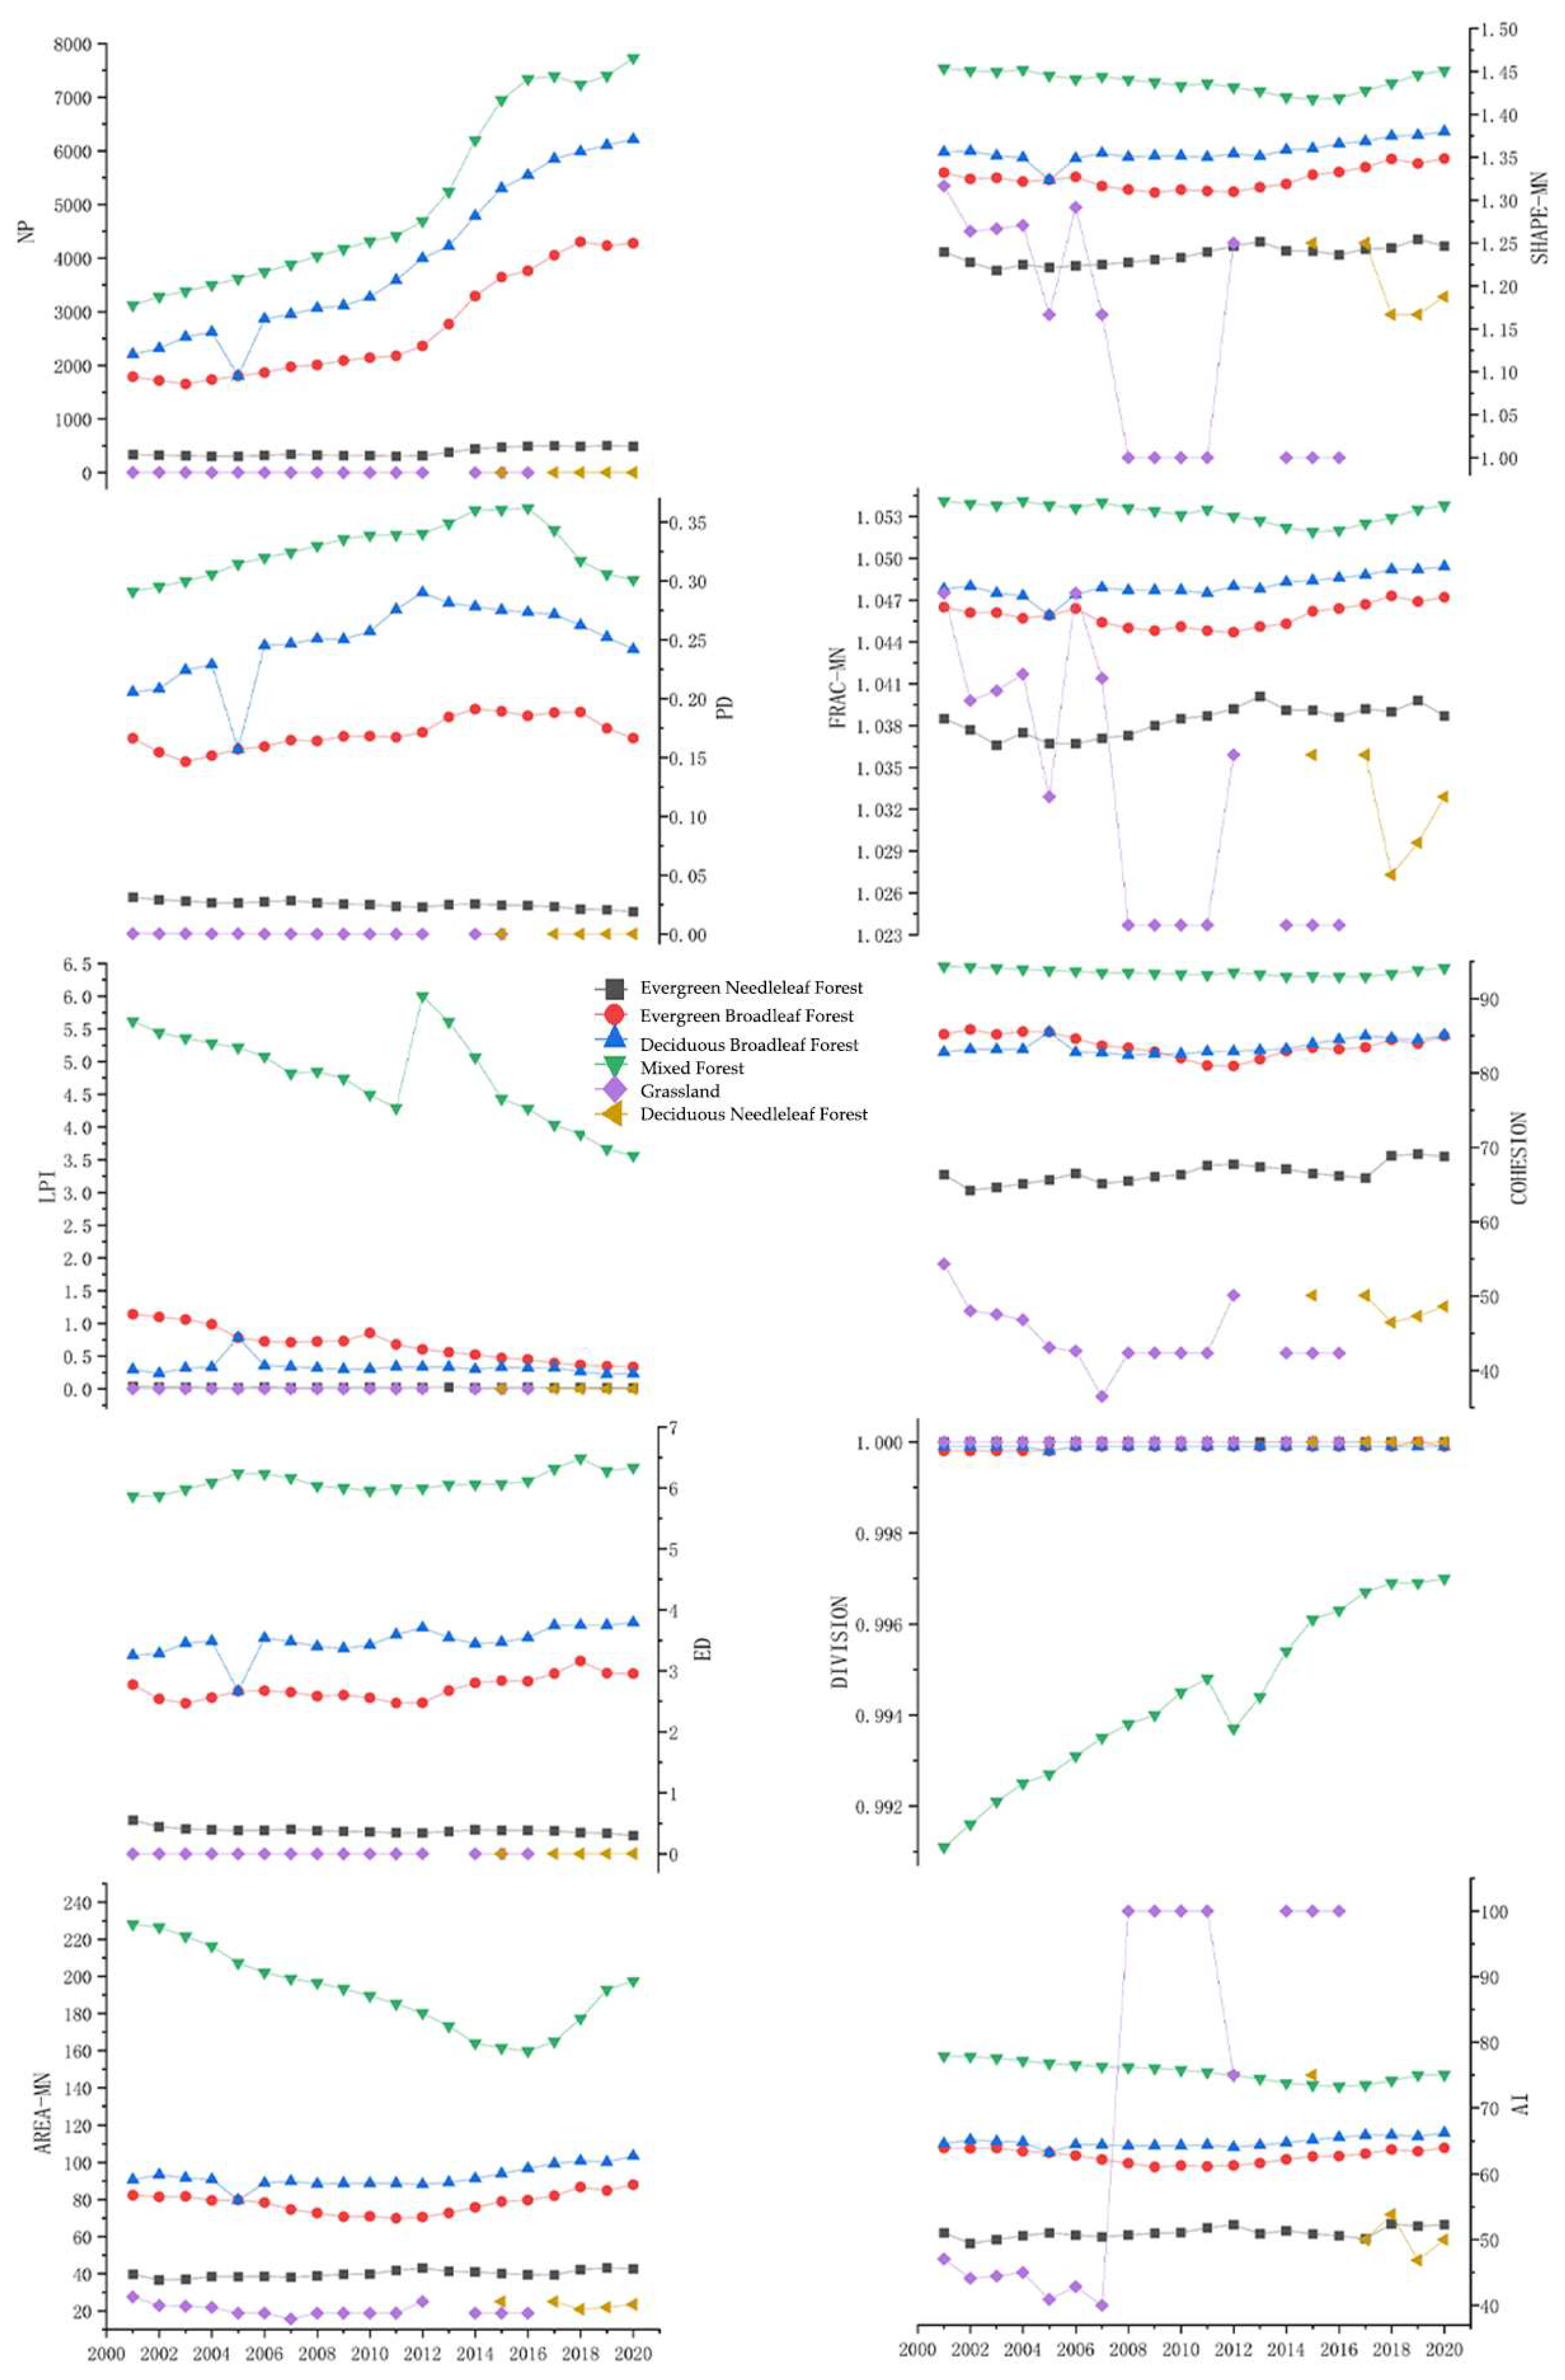
3.1.3. Changes in Landscape

Through the analysis of landscape indexes, we can discern the differentiation regularity of the landscape pattern within the research zone (Figure 5). According to the NP, LPI, and Area-MN indices, the number of patches of Evergreen Coniferous Forest (Pinaceae) and Deciduous Coniferous Forest (Larix decidua) within the region is relatively minimal and essentially stable, while the patches of Evergreen Broadleaf Forest (Fagaceae) and Mixed Forest are on the rise. LPI indicates that the Mixed Forest is the dominant landscape type here, but its maximum patch area exhibits a downward trend, and the DIVISION degree is ascending. By integrating ED, PD, and Area-MN indices, it becomes evident that the forest landscape in this area is relatively fragmented due to the karst topography, particularly the coniferous forest.
From the perspective of various indices, the Mixed Forest, Deciduous Broadleaf Forest (Fagaceae), Evergreen Broadleaf Forest, and Evergreen Coniferous Forest cluster significantly, and the landscape pattern is stable. However, in certain years, Closed Shrub Forest and Deciduous Coniferous Forest were not monitored, resulting in discontinuity in the distribution of the index. The ED, LPI, PD, and other indices have undergone abrupt changes in certain years, primarily affecting the Mixed Forest and Deciduous Broadleaf Forest. This indicates that the natural state of the forest has been severely disrupted during this period.

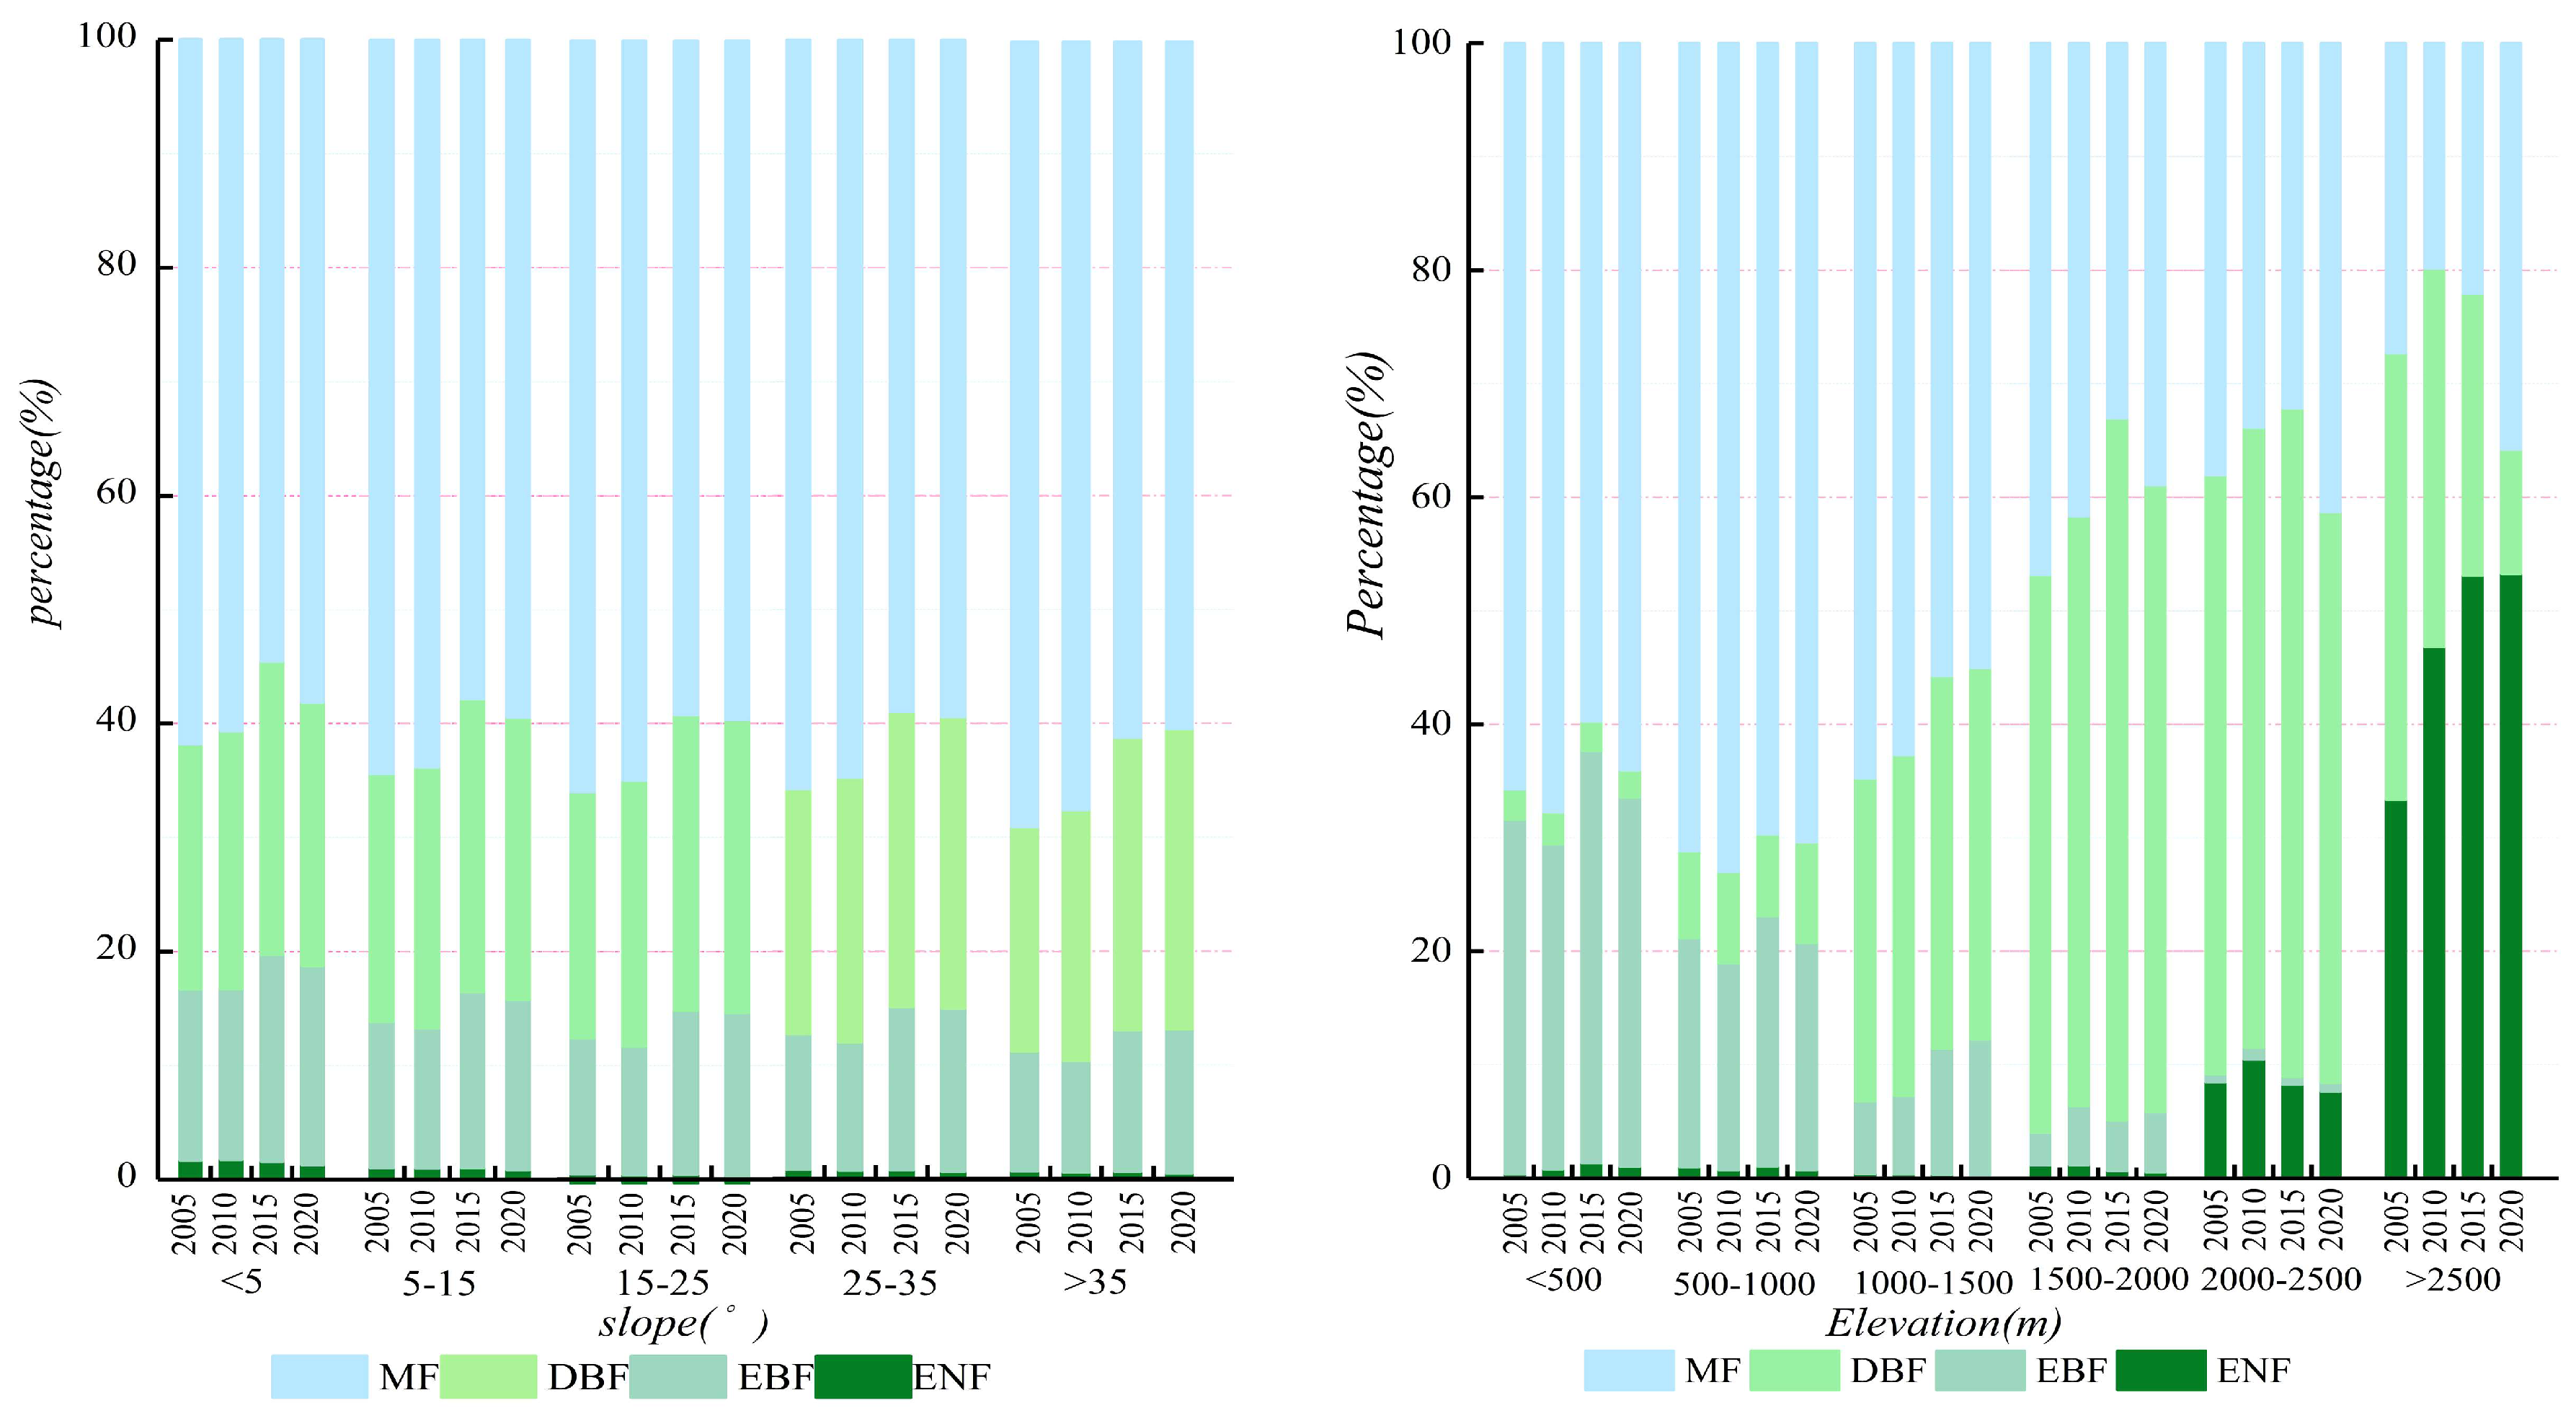
3.1.4. Slope and Elevation Changes
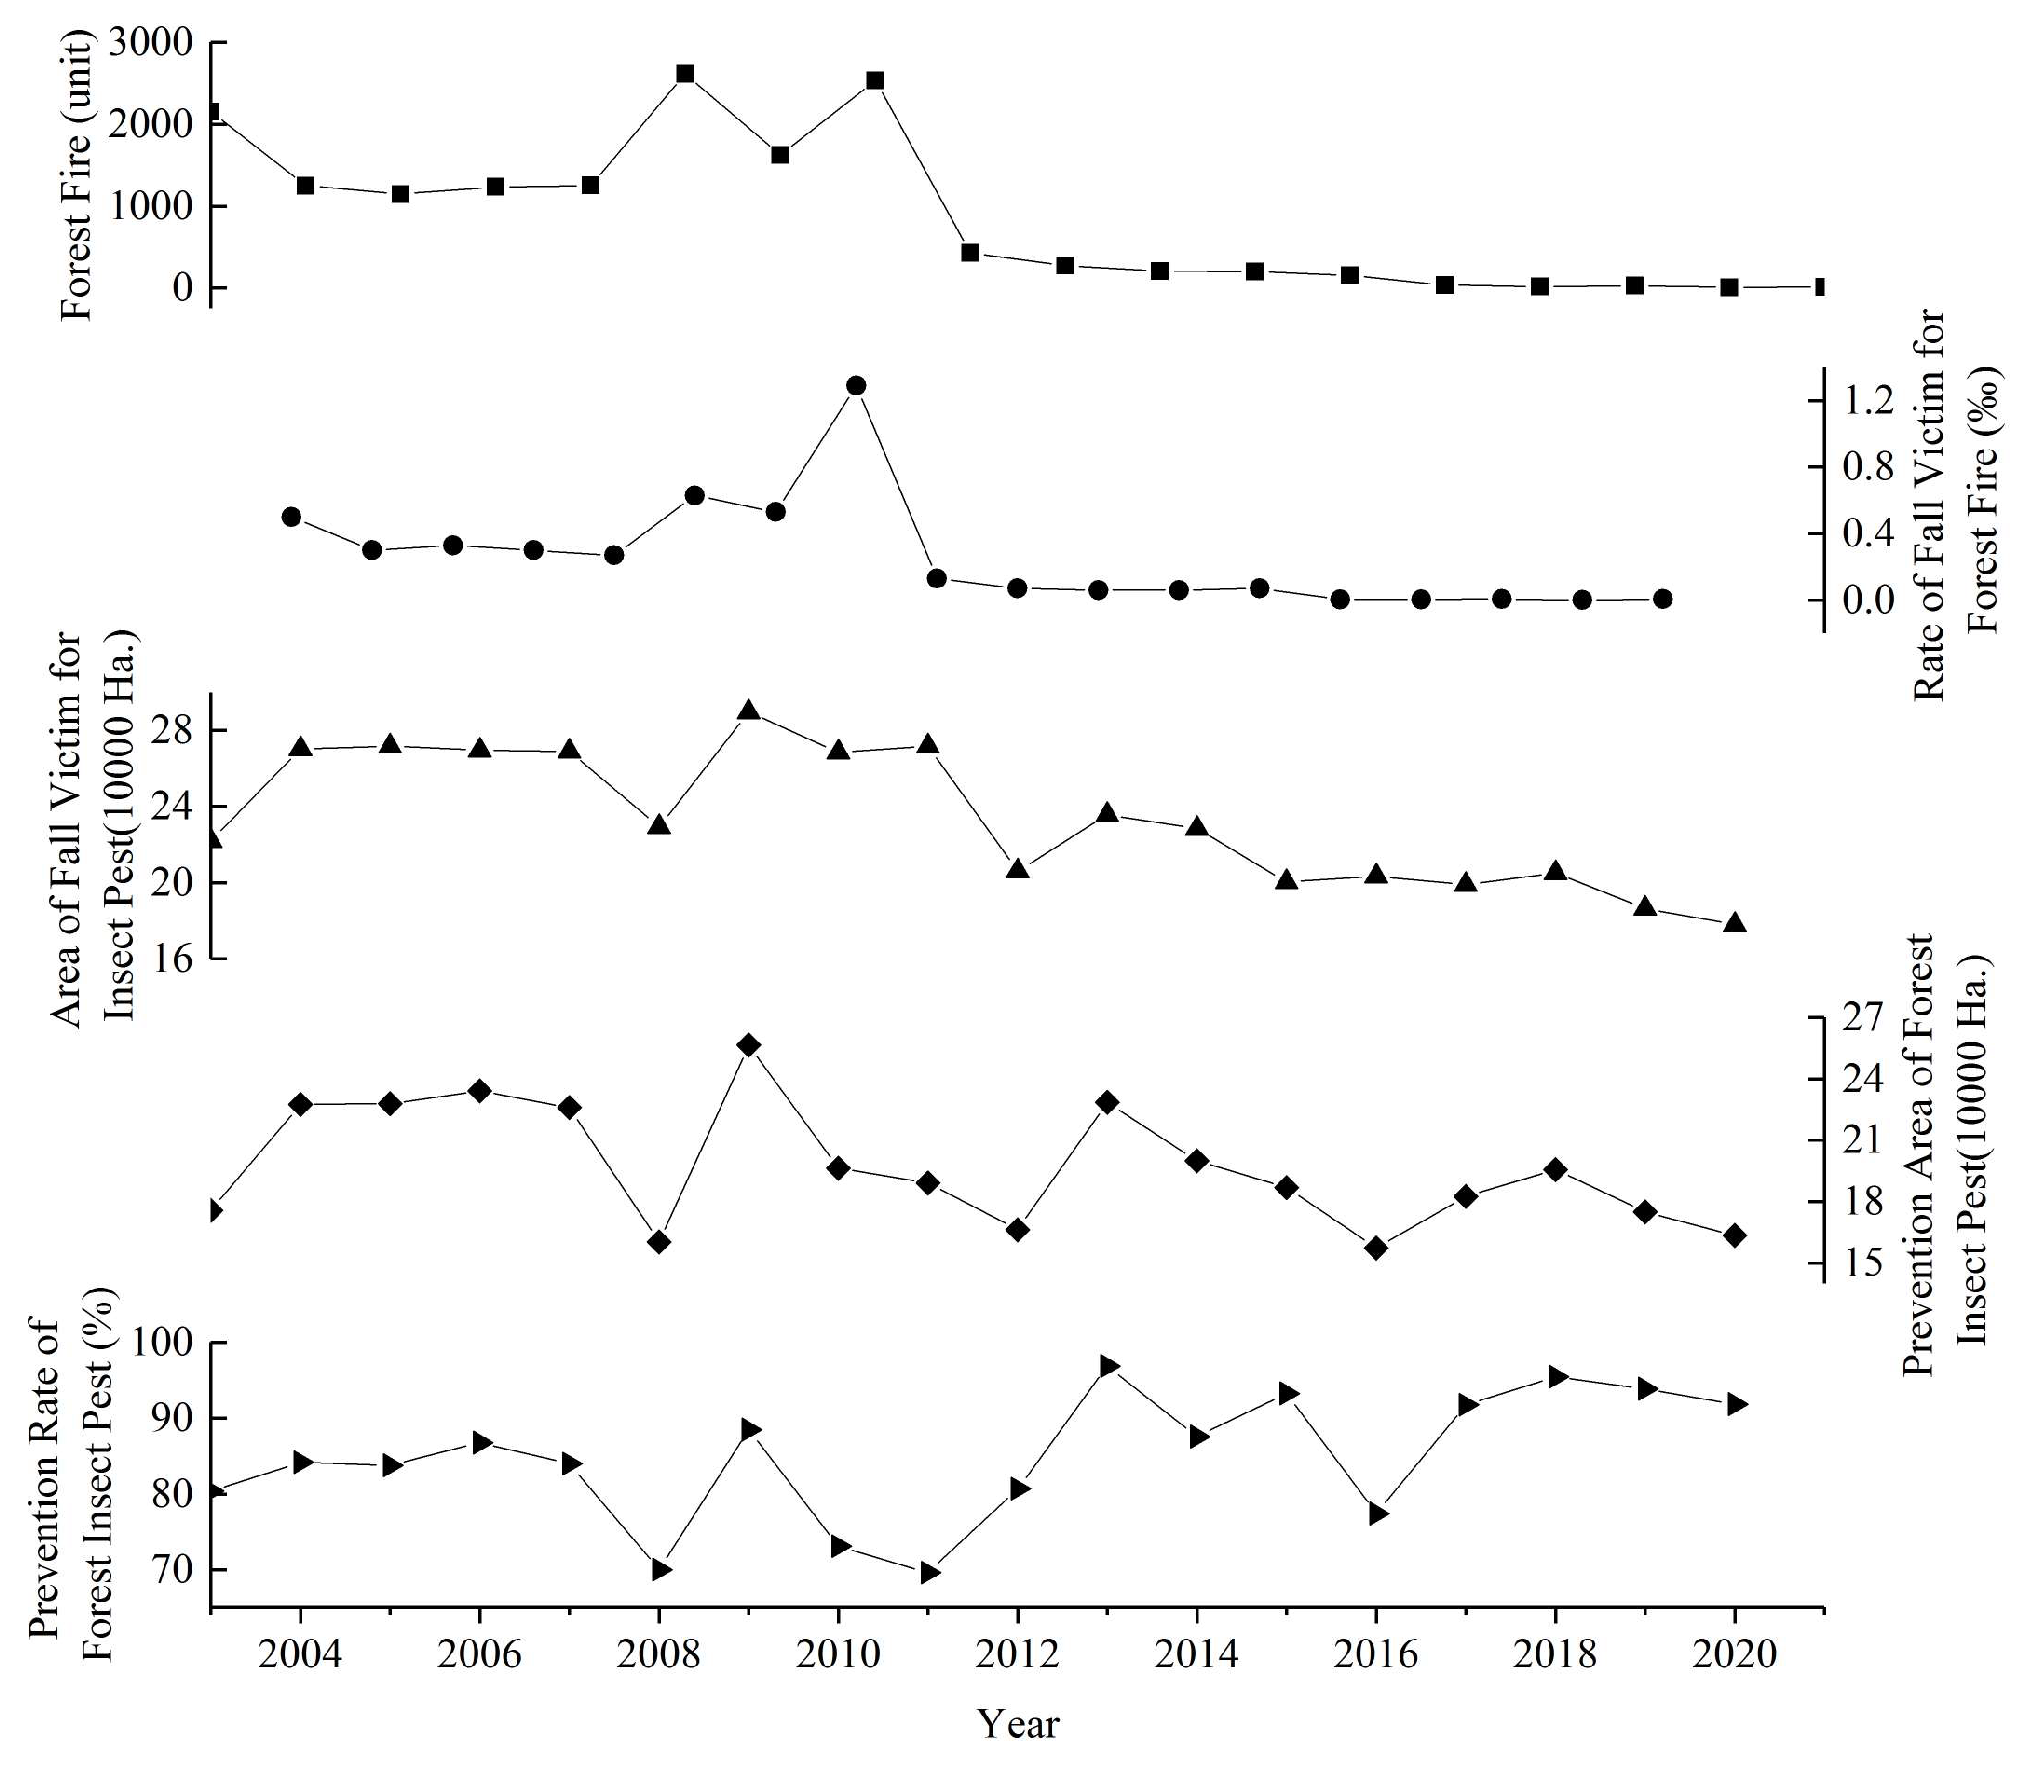
This study conducted statistics on the slope and elevation of forests at five-year intervals (Figure 6). The results revealed that the distribution of Mixed Forest and Deciduous Broadleaf Forest (Fagaceae) is essentially unrestricted by slope, while Evergreen Broadleaf Forest (Fagaceae) and Evergreen Coniferous Forest (Pinaceae) are more prevalently distributed in hilly regions with relatively gentle slopes. Concurrently, post-2015, the distribution proportion of Mixed Forests on all slopes has diminished, as the proportion of other Broadleaf Forests has escalated. Furthermore, through observing the elevation changes of various forests, it is discerned that Evergreen Broadleaf Forest and Mixed Forest tend to proliferate in low-altitude areas, constituting more than 90% of the forest types in areas below 500 m above sea level. However, Deciduous Broadleaf Forest is primarily distributed in the mid-altitude area. In the elevation range of 1500 m to 2500 m, the area of Deciduous Broadleaf Forest comprises more than half, and the high-altitude area is dominated by Coniferous Forest.

3.1.5. Threats

Mountain fires and insect pests pose significant threats to the vitality of forest ecosystems, potentially instigating drastic transformations in forest ecosystems and diminishing their ecological and economic functions. In alignment with the classification system provided by the International Union for Conservation of Nature (IUCN), wildfires fall under the broad category of “Changes to Natural Systems”, specifically as a threat pertaining to “Fire & Fire Suppression”. Concurrently, diseases and pest infestations can be classified within the sphere of “Invasive Species & Diseases” [54]. In addressing these menaces, it is paramount to diligently monitor and manage the distribution of pests and diseases as well as the impacts of wildfires. Furthermore, proactive measures should be implemented for prevention [55].
At the dawn of the 21st century, due to the obsolescence of forest management methodologies and awareness, the incidence rate of mountain fires remained elevated (Figure 7). For example, local funeral customs, such as the burning of incense, candles, and joss paper, can readily lead to forest fires. Moreover, due to the forest monitoring measures being limited to sporadic cameras and periodic drone inspections, it is challenging to detect fires promptly, resulting in the spread of wildfires [56]. There were 2154 forest fires in 2003 and 2612 in 2008. Although the scale of the fires was minimal and the proportion of affected forests was low, the local forest pattern would undergo alterations. Conversely, with the implementation of the disease and pest control project, the affected forests within the research zone have been promptly managed, and the prevention rate has exceeded 90% in the period from 2017 to 2020.

3.2. Changes in Ecosystem Services

3.2.1. Changes of Spatial-Temporal Pattern

In this investigation, we employed the value-equivalent model to compute the value of ecosystem services within the research zone [57,58]. We spatialized the calculation results of Provisioning Services Value (PSV), Regulating Services Value (RSV), Supporting Services Value (SSV), and Cultural Services Value (CSV) through the method of Geographic Information System (GIS), allowing for an intuitive representation of the spatial distribution of PS in the study area on the map (Figure 8). The study discovered that the high-value areas of forest ecosystem services were distributed in Zunyi City in the north, Tongren City in the east, and Qiandongnan Autonomous Prefecture in the southeast. Among these three cities, there are Alsophila spinulosa (Cyatheaceae) National Nature Reserve in the north, Fanjing Mountain National Nature Reserve in the east, and Leigong Mountain Nature Reserve in the southeast, thereby forming a forest cluster with high ecosystem service value. By comparing the ecosystem services value (ESV) data at five-year intervals, the service capacity of PSV and CSV remained nearly unchanged, and SSV improved in 2010 compared to 2005. Subsequently, compared to 2010, the maximum value of ESV in 2015 experienced a slight decline, but the distribution area of middle and low values significantly expanded, and a new high value-gathering area emerged. In 2020, the service value of the four ecosystems improved. Specifically, the high-value gathering area in the southeast expanded significantly, the low-value area in the southwest evolved into a median area, while the high-altitude area in the northwest formed a new ESV cluster.

3.2.2. Changes of Ecosystem Services Value

The value of ecosystem services within the research zone ranks foremost in terms of Regulating Services (RS), succeeded by Supporting Services (SS). This indicates that, compared to the circulation value of forest products as commodities in human society, the forest ecological utility in this area is more pronounced. Furthermore, the value of the four ecosystem services has amplified by 2.3–2.5 times over the past two decades (Table 5). However, the total regional ESV reached 7.25 billion dollars in 2020, of which 4.74 billion dollars is the contribution of RS. This implies that the value of RS surpasses the sum of the other three values, which is markedly unbalanced. It appears that a more effective forest policy is required to balance the ecological functions and the provision functions of forest products, thereby enabling forest resources to provide more sustainable support for local development.

4. Discussion

4.1. The Framework Design

The present study proposes an ecosystem service-evaluation method based on remote sensing data and socio-economic data. This approach, to a certain extent, alleviates the dilemma of inadequate on-site survey data in underdeveloped areas, enables GIS analysis, and facilitates swift and continuous monitoring of ecosystem changes, providing assistance to decision-makers. However, the improvement of this framework is an ongoing process.
The current framework has a limited selection of indicators. For example, only two categories of threats were selected, which might result in less accurate assessment results. Secondly, we found that, with the current framework, it is possible only to perform analysis and calculations on an annual basis. A smaller time interval of the research area would not allow for the collection of remote-sensing and socio-economic data to achieve variations.
Furthermore, this framework only conducts an evaluation from the overall perspective of the ecosystem. However, more detailed features, such as individual situations in the forest (crown width, diameter at breast height, plant height, age group), are overlooked, which may result in limited application scenarios of the evaluation results.

4.2. Insufficiency of the Value-Equivalent Model

While the value-equivalent model employed in this study provides an intuitive reflection of ecosystem value and is straightforward to calculate, it primarily focuses on the feedback of macro patterns and phenomena, thereby circumventing the mechanisms at play when the ecosystem performs its ecological functions.
Meanwhile, we also noticed that the unit value in this model is calculated through the willingness-to-pay method [59]; thus, the result depends heavily on the personal willingness of the respondents selected in the survey. Moreover, such willingness can change with the development of the economy and the guidance of public opinion. For instance, when people tend to choose virtual entertainment rather than getting close to nature, their willingness to pay for tourism will decline, and the corresponding value will change accordingly. However, since it is impossible to conduct the willingness-to-pay survey annually, this study used a fixed unit price for the calculation, which might cause some bias in the results.
Another point worth noting is that, although we attempted to make the value-equivalence factor more accurate and made some adjustments, our current adjustment method ignores the spatial heterogeneity of the entire research area. We simply treated the research area, taking the annual average precipitation, among other averages, for adjustment. However, due to the significant differences in area, altitude, and climatic conditions across the research area, it is still challenging to obtain accurate results even after adjustment.

5. Conclusions

Utilizing remote sensing images and socio-economic data, this study maps the transformations of the forest ecosystem in the core area of the karst mountain regions in southwest China from 2001 to 2020. Based on the analysis of alterations in the forest’s physical conditions and the calculation of the evolution pattern of its ecosystem service value, the following conclusions can be drawn:
  • Over the past two decades, forest rehabilitation within the study area has yielded commendable outcomes, substantially mitigating various ecological dilemmas instigated by rocky desertification in this region. The forested area has increased significantly, and the ecosystem service value has more than doubled.
  • The restoration of the forest ecosystem in the research area has clear stages. The physical accounts and ecosystem service accounts of the forest ecosystem in the second stage show more significant changes in terms of range expansion, area increase, and value enhancement compared to the first stage. The main reason is that a number of ecological restoration policies were implemented locally during this stage, including the conversion of farmland to forests, migration and relocation, and the promotion of the development of the forestry industry.
  • Human intervention has a significant impact on the changes in the ecosystem, and reasonable forestry management policies can effectively and quickly enhance the service value of the forest ecosystem. By establishing an evaluation system that combines remote-sensing data and socio-economic data, we can provide excellent technical support for finding a balance between the sustainable development of forests and human life.

Author Contributions

Conceptualization, Z.Z. and L.Z.; methodology, T.W.; software, T.W., L.W. and D.L; formal analysis, L.Z. and Q.C.; investigation, L.W., D.L. and T.W.; data curation, Q.F.; writing—original draft preparation, L.Z.; writing—review and editing, Z.Z. and Q.C.; visualization, L.Z.; supervision, Q.C.; project administration, L.Z.; funding acquisition, Z.Z. All authors have read and agreed to the published version of the manuscript.

Funding

This research was funded by the NSFC regional project, “Research on the coupling mechanism between ecological assets and regional poverty in karst rocky desertification areas (41661088)”, by “Guizhou Province’s high-level innovative talent training plan ‘hundred’ level talents (Qiankehe platform talents [2016] 5674)” and a special study of Guizhou Provincial Department of natural resources on the “Construction of evaluation system of real estate economic operation system in Guizhou Province” (520000215RSUFG5DLMENO/52000021C4D958906C150).

Institutional Review Board Statement

Not applicable.

Informed Consent Statement

Not applicable.

Data Availability Statement

Not applicable.

Acknowledgments

Our deepest appreciation goes to the funding bodies for their indispensable support. We also extend our gratitude to our esteemed colleagues, whose insightful expertise and contributions substantially enhanced this research. Our profound thanks go to the anonymous reviewers who generously gave their time and expertise in critiquing our manuscript. Their invaluable comments and suggestions have markedly elevated the quality of our work.

Conflicts of Interest

The authors declare no conflict of interest.

Appendix A

Table A1. International Geosphere-Biosphere Programme (IGBP) legend and class descriptions.
NameDescription
Evergreen Needleleaf ForestsDominated by evergreen conifer trees (canopy >2 m). Tree cover >60%.
Evergreen Broadleaf ForestsDominated by evergreen broadleaf and palmate trees (canopy >2 m).
Tree cover >60%.
Deciduous Needleleaf ForestsDominated by deciduous needleleaf (larch) trees (canopy >2 m).
Tree cover >60%.
Deciduous Broadleaf ForestsDominated by deciduous broadleaf trees (canopy >2 m). Tree cover >60%.
Mixed ForestsDominated by neither deciduous nor evergreen (40–60% of each) tree type (canopy >2 m). Tree cover >60%.
Closed ShrublandsDominated by woody perennials (1–2 m height) >60% cover.
Open ShrublandsDominated by woody perennials (1–2 m height) 10–60% cover.
Woody SavannasTree cover 30–60% (canopy >2 m).
SavannasTree cover 10–30% (canopy >2 m).
GrasslandsDominated by herbaceous annuals (<2 m)
Permanent WetlandsPermanently inundated lands with 30–60% water cover and >10% vegetated cover.
CroplandsAt least 60% of area is cultivated cropland.
Urban and Built-up LandsAt least 30% impervious surface area including building materials, asphalt, and vehicles.
Cropland/Natural Vegetation MosaicsMosaics of small-scale cultivation 40–60% with natural tree, shrub, or herbaceous vegetation.
Permanent Snow and IceAt least 60% of area is covered by snow and ice for at least 10 months of the year.
BarrenAt least 60% of area is non-vegetated barren (sand, rock, soil) areas with less than 10% vegetation.
Water BodiesAt least 60% of area is covered by permanent water bodies. Unclassified 255 Has not received a map label because of missing inputs.

References

  1. FAO. Global Forest Resources Assessment 2020—Key Findings; FAO: Rome, Italy, 2020. [Google Scholar]
  2. Available online: https://www.Fao.org/Forest-Resources-Assessment/En/ (accessed on 1 March 2023).
  3. Campbell, E.T.; Tilley, D.R. Valuing ecosystem services from Maryland forests using environmental accounting. Ecosyst. Serv. 2014, 7, 141–151. [Google Scholar] [CrossRef]
  4. FAO. Global Forest Resources Assessment 2020. Guidelines and Specifications Fra 2020; FAO: Rome, Italy, 2018. [Google Scholar]
  5. Grammatikopoulou, I.; Vačkářová, D. The value of forest ecosystem services: A meta-analysis at the European scale and application to national ecosystem accounting. Ecosyst. Serv. 2021, 48, 101262. [Google Scholar] [CrossRef]
  6. Helseth, E.V.; Vedeld, P.; Framstad, E.; Gómez-Baggethun, E. Forest Ecosystem Services in Norway: Trends, Condition, and Drivers of Change (1950–2020). Ecosyst. Serv. 2022, 58, 101491. [Google Scholar] [CrossRef]
  7. Available online: https://Sustainabledevelopment.un.org/ (accessed on 1 December 2022).
  8. Dardonville, M.; Legrand, B.; Clivot, H.; Bernardin, C.; Bockstaller, C.; Therond, O. Assessment of ecosystem services and natural capital dynamics in agroecosystems. Ecosyst. Serv. 2022, 54, 101415. [Google Scholar] [CrossRef]
  9. Edens, B.; Maes, J.; Hein, L.; Obst, C.; Siikamaki, J.; Schenau, S.; Javorsek, M.; Chow, J.; Chan, J.Y.; Steurer, A.; et al. Establishing the SEEA Ecosystem Accounting as a global standard. Ecosyst. Serv. 2022, 54, 101413. [Google Scholar] [CrossRef]
  10. UN; FAO. System of Environmental-Economic Accounting for Agriculture, Forestry and Fisheries (SEEA AFF); The Food and Agriculture Organization of the United Nations and United Nations Statistical Division: Rome, Italy, 2020. [Google Scholar]
  11. UN; EC; IMF; FAO; WB; OECD. System of Environmental-Economic Accounting (Central Framework); United Nations Department of Economic and Social Affairs: New York, NY, USA, 2014. [Google Scholar]
  12. Guerry, A.D.; Polasky, S.; Lubchenco, J.; Chaplin-Kramer, R.; Daily, G.C.; Griffin, R.; Ruckelshaus, M.H.; Bateman, I.J.; Duraiappah, A.; Elmqvist, T.; et al. Natural capital and ecosystem services informing decisions: From promise to practice. Proc. Natl. Acad. Sci. USA 2015, 112, 7348–7355. [Google Scholar] [CrossRef] [PubMed]
  13. Available online: https://Seea.un.org/Home/Natural-Capital-Accounting-Project (accessed on 1 March 2023).
  14. Available online: https://Seea.un.org/News/Release-Ncaves-China-Project-Reports-During-Closing-Workshop (accessed on 1 March 2023).
  15. Available online: https://Seea.un.org/Content/China-0 (accessed on 1 March 2023).
  16. Hein, L.; Bagstad, K.J.; Obst, C.; Edens, B.; Schenau, S.; Castillo, G.; Soulard, F.; Brown, C.; Driver, A.; Bordt, M.; et al. Progress in natural capital accounting for ecosystems. Science 2020, 367, 514–515. [Google Scholar] [CrossRef]
  17. Polasky, S.; Daily, G. An Introduction to the Economics of Natural Capital. Rev. Environ. Econ. Policy 2021, 15, 87–94. [Google Scholar] [CrossRef]
  18. Chen, C.; Park, T.; Wang, X.; Piao, S.; Xu, B.; Chaturvedi, R.K.; Fuchs, R.; Brovkin, V.; Ciais, P.; Fensholt, R.; et al. China and India lead in greening of the world through land-use management. Nat. Sustain. 2019, 2, 122–129. [Google Scholar] [CrossRef]
  19. Macias-Fauria, M. Satellite images show China going green. Nature 2018, 553, 411–413. [Google Scholar] [CrossRef]
  20. Bagstad, K.J.; Ingram, J.C.; Lange, G.M.; Masozera, M.; Ancona, Z.H.; Bana, M.; Kagabo, D.; Musana, B.; Nabahungu, N.L.; Rukundo, E.; et al. Towards Ecosystem Accounts for Rwanda: Tracking 25 Years of Change in Flows and Potential Supply of Ecosystem Services. People Nat. 2019, 2, 163–188. [Google Scholar] [CrossRef] [Green Version]
  21. Brandon, C.; Brandon, K.; Fairbrass, A.; Neugarten, R. Integrating Natural Capital into National Accounts: Three Decades of Promise and Challenge. Rev. Environ. Econ. Policy 2021, 15, 134–153. [Google Scholar] [CrossRef]
  22. Tong, X.; Brandt, M.; Yue, Y.; Horion, S.; Wang, K.; De Keersmaecker, W.; Tian, F.; Schurgers, G.; Xiao, X.; Luo, Y.; et al. Increased vegetation growth and carbon stock in China karst via ecological engineering. Nat. Sustain. 2018, 1, 44–50. [Google Scholar] [CrossRef]
  23. Zhang, C.; Qi, X.; Wang, K.; Zhang, M.; Yue, Y. The application of geospatial techniques in monitoring karst vegetation recovery in southwest China. Prog. Phys. Geogr. Earth Environ. 2017, 41, 450–477. [Google Scholar] [CrossRef]
  24. Chen, Q.; Xiong, K.; Dan, W.; Niu, L. Analysis of the coupling characteristics of ecology and poverty in typical karst areas: A case study of 9000 provincial poor villages in Guizhou Province. Acta Ecol. Sin. 2021, 41, 2968–2982. [Google Scholar]
  25. Wu, Y.; Zhou, Z.; Zhu, C.; Ma, G.; Huang, D. Measurement and spatial differentiation of rural poverty in karst mountainous areas: A case study of Panzhou City. Resour. Environ. Yangtze River Basin 2020, 29, 1247–1256. [Google Scholar]
  26. Yang, R.; Zhong, C.; Yang, Z.; Liu, F.; Peng, H. Analysis of Poverty Influencing Factors in Deep Poverty Counties of Southwest Karst Rocky Desertification. World Geogr. Res. 2022, 31, 1298–1309. [Google Scholar]
  27. Guizhou Provincial Local Chronicles Compilation Committee. Guizhou Provincial Chronicle Geographical Chronicles; Guizhou People’s Publishing House: Guiyang, China, 1988. [Google Scholar]
  28. Qian, C. Remote Sensing Inversion of Forest Biomass and Spatiotemporal Dynamic Analysis in Karst Region. Ph.D. Thesis, Nanjing Forestry University, Nanjing, China, 2022. [Google Scholar]
  29. Su, W. Current Causes of Rocky Desertification in Karst Mountainous Areas of Southwest China and Optimization Model of Governance. J. Soil Water Conserv. 2002, 2, 29–32+79. [Google Scholar]
  30. Xiong, K.; Li, J.; Long, M. Characteristics and key problems of soil erosion in typical karst rocky desertification control areas. Acta Geogr. 2012, 67, 878–888. [Google Scholar]
  31. Guizhou Provincial Local Chronicles Compilation Committee. Guizhou Province (1978–2010) Forestry; Guizhou People’s Publishing House: Guiyang, China, 2019; Volume 16. [Google Scholar]
  32. Feng, N.; Liu, D.; Li, Y.; Liu, P. Soil net N mineralization and hydraulic properties of carbonate-derived laterite under different vegetation types in Karst forests of China. Sci. Total. Environ. 2023, 856, 159116. [Google Scholar] [CrossRef] [PubMed]
  33. Peng, D.; Zhou, Q.; Tang, X.; Yan, W.; Chen, M. Changes in soil moisture caused solely by vegetation restoration in the karst region of southwest China. J. Hydrol. 2022, 613, 128460. [Google Scholar] [CrossRef]
  34. Zhong, F.; Xu, X.; Li, Z.; Zeng, X.; Yi, R.; Luo, W.; Zhang, Y.; Xu, C. Relationships between lithology, topography, soil, and vegetation, and their implications for karst vegetation restoration. Catena 2022, 209, 105831. [Google Scholar] [CrossRef]
  35. Guizhou Provincial Local Chronicles Compilation Committee. Guizhou Province Chronicle (1978–2010) XVI Vols; Guizhou People’s Publishing House: Guiyang, China, 2017; Volume Agriculture. [Google Scholar]
  36. He, Y.; Wang, L.; Niu, Z.; Nath, B. Vegetation recovery and recent degradation in different karst landforms of southwest China over the past two decades using GEE satellite archives. Ecol. Informatics 2022, 68, 101555. [Google Scholar] [CrossRef]
  37. Peng, J.; Jiang, H.; Liu, Q.; Green, S.M.; Quine, T.A.; Liu, H.; Qiu, S.; Liu, Y.; Meersmans, J. Human activity vs. climate change: Distinguishing dominant drivers on LAI dynamics in karst region of southwest China. Sci. Total. Environ. 2020, 769, 144297. [Google Scholar] [CrossRef] [PubMed]
  38. Available online: https://Doi.org/10.5067/Modis/Mcd12q1.061 (accessed on 6 July 2023).
  39. Hu, X.; Chen, Z.; Mo, L.; Yan, C.; Wang, W.; Luo, X. Analysis of Forest Landscape Pattern of Danxiashan National Nature Reserve Based on Remote Sensing Imagery. Ecol. Sci. 2023, 42, 155–163. [Google Scholar]
  40. Liu, Y.; Cai, X.; Ning, X.; Wang, H. Urban Forest Mapping Study of Landscape Ecological Index Model. Sci. Surv. Mapp. 2022, 47, 185–195. [Google Scholar]
  41. Chen, S.; Feng, X.; Ma, R.; Hong, Q. Evaluation Method and Empirical Study of Cultivated Land Fragmentation: A Case Study of Ningbo City, Zhejiang Province. China Land Sci. 2016, 30, 80–87. [Google Scholar]
  42. Liu, Y.; Liao, H.; Wu, X.; Guo, Q.; Mao, X.; Li, C. A Study on the Spatial Coupling Relationship between Arable Land Fragmentation and Poverty in Southwest Karst Region. J. Southwest Univ. Nat. Sci. Ed. 2019, 41, 10–20. [Google Scholar]
  43. Wang, S. Remote Sensing Monitoring and Spatiotemporal Analysis of Forest Change Characteristics in Southwest China in the Past 20 Years. Master’s Thesis, Southwest University, Chongqing, China, 2022. [Google Scholar]
  44. Xiong, C.; Wu, Z.; Zeng, Z.; Gong, J.; Li, J. Research on the temporal and spatial evolution of forest landscape pattern in the Guangdong-Hong Kong-Macao Greater Bay Area based on “spatial form-fragmentation-aggregation”. Acta Ecol. Sin. 2023, 43, 3032-44. [Google Scholar]
  45. Wan, W. Spatial differentiation of cultivated land fragmentation in Zhejiang Province based on county scale. Environ. Ecol. 2021, 3, 15–21+48. [Google Scholar]
  46. Yang, J.; Xie, B.; Zhang, D. Spatial–temporal evolution of ESV and its response to land use change in the Yellow River Basin, China. Sci. Rep. 2022, 12, 13103. [Google Scholar] [CrossRef]
  47. Costanza, R.; de Groot, R.; Farber, S.; Grasso, M.; Hannon, B.; Limburg, K.; Naeem, S.; Paruelo, J.; Raskin, R.G.; Sutton, P.; et al. The Value of the World’s Ecosystem Services and Natural Capital. Nature 1997, 387, 253–260. [Google Scholar] [CrossRef]
  48. Costanza, R.; Kubiszewski, I.; Giovannini, E.; Lovins, H.; McGlade, J.; Pickett, K.E.; Ragnarsdóttir, K.V.; Roberts, D.; De Vogli, R.; Wilkinson, R. Development: Time to Leave Gdp Behind. Nature 2014, 505, 283–285. [Google Scholar] [CrossRef] [Green Version]
  49. Costanza, R.; de Groot, R.; Sutton, P.; van der Ploeg, S.; Anderson, S.J.; Kubiszewski, I.; Farber, S.; Turner, R.K. Changes in the global value of ecosystem services. Glob. Environ. Chang. 2014, 26, 152–158. [Google Scholar] [CrossRef]
  50. Xie, G.; Zhang, C.; Zhang, L.; Chen, W.; Li, S. Improvement of Ecosystem Service Value Methodology Based on Value Equivalent Factor per Unit Area. J. Nat. Resour. 2015, 30, 1243–1254. [Google Scholar]
  51. Xie, G.; Zhen, L.; Lu, C.; Xiao, Y.; Chen, C. A Valinization Approach to Ecosystem Services Based on Expert Knowledge. J. Nat. Resour. 2008, 5, 911–919. [Google Scholar]
  52. Su, W.; Li, P.; He, W.; Zhu, W. Ecotourism in Guizhou Maolan Karst Forest Nature Reserve. Carsologica China 2001, 1, 67–71. [Google Scholar]
  53. Wang, X.; Long, J.; Li, J.; Liu, L.; Liao, H.; Li, Y.; Yang, R. Soil eukaryotic microbial diversity under different successions of Maolan karst forest in Guizhou. Environ. Sci. 2020, 41, 4314–4321. [Google Scholar]
  54. Su, W. The fragility of karst mountain ecosystems in Guizhou and its countermeasures. Sci. Soil Water Conserv. 2004, 3, 64–69. [Google Scholar]
  55. Salafsky, N.; Salzer, D.; Stattersfield, A.J.; Hilton-Taylor, C.; Neugarten, R.; Butchart, S.H.M.; Collen, B.; Cox, N.; Master, L.L.; O’Connor, S.; et al. A Standard Lexicon for Biodiversity Conservation: Unified Classifications of Threats and Actions. Conserv. Biol. 2008, 22, 897–911. [Google Scholar] [CrossRef]
  56. Salafsky, N.; Margoluis, R.; Redford, K.H.; Robinson, J.G. Improving the Practice of Conservation:A Conceptual Framework and Research Agenda for Conservation Science. Conserv. Biol. 2002, 16, 1469–1479. [Google Scholar] [CrossRef]
  57. Macroeconomic Database of Guizhou Province, China. Available online: http://hgk.guizhou.gov.cn/publish/tj/index.html (accessed on 12 July 2023).
  58. Xie, G.; Lu, C.; Leng, Y.; Zheng, D.; Li, S. Valuation of Ecological Assets on the Tibetan Plateau. J. Nat. Resour. 2003, 2, 189–196. [Google Scholar]
  59. Xie, G.; Zhang, C.; Zhang, C.; Xiao, Y.; Lu, C. The Value of Ecosystem Services in China. Resour. Sci. 2015, 37, 1740–1746. [Google Scholar]
Figure 1. Location of the study area.
Forests 14 01534 g001
Figure 2. Ecosystem services value-equivalent calculation.
Forests 14 01534 g002
Figure 3. Spatial and temporal pattern change of forests. (a) is the increase or loss of forests over the past 20 years. (b) is a characteristic area of forest increase or loss. (c) is the proportion of transfers in/out between various forest types. (d) is the transfer area between various land cover types.
Forests 14 01534 g003
Figure 4. Changes of main forest products in the study area. (a) is the yield of forest products. (b) is the economic fruit yield.
Forests 14 01534 g004
Figure 5. Temporal series diagram of landscape index.
Forests 14 01534 g005
Figure 6. Slope and elevation distribution of forests.
Forests 14 01534 g006
Figure 7. Forest-fire and insect-pest situation in the study area.
Forests 14 01534 g007
Figure 8. Spatial-temporal changes of ecosystem services.
Forests 14 01534 g008
Table 1. Data sources for assessing forest resources changes.
Resource TypeData Sources
Spatial DataDigital elevation models (DEM)Google Earth Engine Platform (https://developers.google.cn/earth-engine/datasets) accessed on 4 December 2022
Land Cover
Landsat net primary production (NPP)
Global precipitation measurement (GPM)
Socio-economic DataForest ProductsGuizhou Statistical Yearbook (2001–2021) (http://stjj.guizhou.gov.cn/) accessed on 4 December 2022
Forest Fire
Insect pests and rat infestations
Table 2. Indicators for assessing forests.
Account TypesFirst-Level IndicatorsSecond-Level Indicators
Physical ConditionExtentArea
Livelihood provisionForest Production
Site conditionsElevation
Slope
Landscape indexNP
PD
LPI
ED
AREA_MN
SHAPE_MN
FRAC_MN
COHESION
DIVISION
AI
ThreatsForest Fire
Pests and Rats
Ecosystem ServicesProvisioning ServicesFood production
Raw Material Production
Water Supply
Regulating ServicesGas Regulation
Climate Regulation
Environmental Purification
Hydrological Regulation
Supporting ServicesSoil Conservation
Maintenance of Nutrient Cycles
Biodiversity
Cultural ServicesAesthetic Landscape
Table 3. Landscape indexes.
Landscape
Index
Indicator DescriptionCalculation FormulaReference
Number of Patch (NP)The number of patches, or the number of patches of a certain type of landscapeN[42]
Patch Density (PD)PD represents the density of a certain patch in the landscape, which can reflect the heterogeneity and fragmentation of the landscape as a whole and the degree of fragmentation of a certain type, as well as the heterogeneity of the landscape per unit area. P D = N P A [42]
Largest Patch Index (LPI)LPI is the ratio of the largest patch area to the total area in line, which is a positive correlation indicator of the contiguous situation, reflecting the size of the dominant patch in the landscape. L P I = A m a x / A [41]
Edge Density (ED)ED is the ratio of the total perimeter to the total area of the patch, which is a negative correlation indicator of the contiguous situation, reflecting the degree of fragmentation of the patch. E D = P A [43]
Mean Area (AREA_MN)It represents an average situation, which indicates the degree of fragmentation of the landscape. A R E A M N = A / N [43]
Mean Shape (SHAPE_MN)It is the mean shape index, which reflects the degree of disturbance of human activities to the landscape pattern. S P I M N = i = 1 n 0.25 P i / a i N [44]
Mean Patch Fractal Dimension (FRAC_MN)It indicates the complexity of the plate. If the result is 1.0, it indicates the simplest square plate. F R A C M N = 2 l n ( P i 4 ) / l n 4 N [44]
Patch Cohesion Index (COHESION)It reflects the aggregation and dispersion of patches in the landscape, and the value is between −1 and 1. When the index result is −1, the patches are completely dispersed, and when the result is 1, the patches are clustered. C = ( 1 j = 1 m p i j j = 1 m p i j a i j ) ( 1 1 A ) × 100 [45]
Landscape Division Index (DIVISION)It refers to the separation degree of individual distribution of different plates in a certain landscape type. D = [ 1 j = 1 m ( a i j A ) 2 ] [45]
Aggregation Index (AI)AI examined the connectivity between patches of each landscape type. The smaller the value, the more discrete the landscape. A I = [ g i i max g i i ] ( 100 )[46]
A is the total area of landscape or patch (hm2). P is the total perimeter of all cropland patches. a i is the patch area. P i is the perimeter of the patch. g i i is the number of similar adjacent patches of the corresponding landscape type.
Table 4. Area of forest transferred in/out by year.
01–0202–0303–0404–0505–0606–0707–0808–0909–1010–1111–1212–1313–1414–1515–1616–1717–1818–1919–20
Trans-in Area (km2)833.88646.88605.63590.69639.13800.50865.00777.63874.94972.251339.131806.312786.442510.381548.193554.633708.443791.503895.06
Trans-out Area (km2)198.56248.63270.19337.75266.44317.25363.38361.44372.06423.06327.88216.75172.00154.06288.561290.941382.881001.751218.06
Ratio4.22.62.21.72.42.52.42.22.42.34.18.316.216.35.42.82.73.83.2
Table 5. Forest ecosystem services value of Guizhou Province. (Unit: 100 million dollars).
YearPSVRSVSSVCSVTotal
20011.7819.777.291.4730.31
20021.8520.487.551.5231.39
20031.8820.797.661.5431.87
20041.9021.107.771.5632.33
20051.9121.197.801.5732.47
20061.9421.567.931.5933.03
20071.9922.078.121.6333.80
20082.0322.558.301.6734.54
20092.0722.918.431.6935.11
20102.1123.478.631.7335.94
20112.1624.008.811.7736.75
20122.2825.439.321.8738.91
20132.4927.7110.152.0442.38
20142.8531.7811.622.3448.59
20153.1935.5913.002.6154.39
20163.3537.4813.692.7557.27
20173.5639.8114.522.9260.80
20183.7742.1815.383.0964.41
20194.0044.7016.343.2968.33
20204.2547.4417.353.4972.53
Disclaimer/Publisher’s Note: The statements, opinions and data contained in all publications are solely those of the individual author(s) and contributor(s) and not of MDPI and/or the editor(s). MDPI and/or the editor(s) disclaim responsibility for any injury to people or property resulting from any ideas, methods, instructions or products referred to in the content.

