Article

Moso Bamboo–Polygonatum cyrtonema Agroforestry Systems: Evaluation of Soil Quality and Polygonatum Yield

College of Forestry and Landscape Architecture, Anhui Agricultural University, Hefei 230036, China
*
Author to whom correspondence should be addressed.
Forests 2023, 14(7), 1426; https://doi.org/10.3390/f14071426
Submission received: 7 May 2023 / Revised: 2 July 2023 / Accepted: 10 July 2023 / Published: 12 July 2023
(This article belongs to the Section Forest Soil)

Abstract

:
Agroforestry has great potential for improving the ecological environment and raising the ecosystem productivity. This study is aim to evaluate the soil quality of bamboo forest and identify the main site factor that influencing the yield of Polygonatum tubers following the agroforestry practices. Four intercropping modes with different culm densities were conducted in Anhui, East China. The minimum data set method (MDS) was applied to evaluate soil quality index (SQI). Based on principal component analysis (PCA), microbial biomass carbon (MBC), available potassium (AK), altitude, and pH were selected as the MDS. The results showed that intercropping significantly increased SQI compared with moso bamboo monoculture. The mode M1(1750 culms/ha) was significantly better than other modes in improving soil fertility and increasing the yield of Polygonatum tubers. Results from random forest and structural equation model (SEM) showed the direct path coefficient of density on Polygonatum tubers yield was the largest, which was −0.83. Altitude, soil organic carbon (SOC) and nitrate nitrogen (NO3-N) had a small impact, with direct path coefficient of 0.16, 0.10, and 0.15 (p < 0.05), respectively. Our findings provide a theoretical basis for managing the moso bamboo and P. cyrtonema agroforestry system in a more effective manner.

1. Introduction

Soil is considered essential for maintaining plant growth and development. Excessive anthropogenic land development and utilization resulted in numerous soil issues that pose serious threats to food security [1]. Based on soil quality assessments, soil can be managed in a reasonable manner, with appropriate soil conservation measures and crop yield improvements [2]. To date, there are disparate views regarding the definition of soil quality. Generally, soil quality is defined as its capacity to maintain crop production levels and environment within specific ecosystems [3]. Since soil quality itself is challenging to directly quantify, it is typically achieved by combining data on various soil attributes for quantitative analysis. The minimum data set (MDS) can reflect soil quality to the maximum extent with the least indicators, and the soil quality index (SQI) method combines the evaluation indicators into a single index, which is convenient and flexible and widely used in agricultural, grassland and forest soil quality assessment [4,5].
There is a widespread acknowledgement that traditional agricultural management is unsustainable, which threatens food security, results in land degradation, and reduces biodiversity [6,7]. Forest ecosystems represent the largest part of the terrestrial ecosystem, and intensive management of forests resulted in many ecological problems, such as soil acidification and nutrient imbalance [8,9]. Agroforestry is an alternative land-use system paradigm that intentionally integrates woody perennials with crops or livestock in the same land-managed fields [10]. This was proven to be an effective strategy for land management with good ecological and economic benefits [11,12]. There is evidence that agroforestry systems can improve the microclimate, which is of great importance toward addressing climate change and improving soil ecosystems [13]. Agroforestry systems can improve soil quality by enhancing soil microbial communities, reducing soil water loss, and promoting nutrient cycling [14]. Previous studies showed that shaded coffee agroforestry systems reduced soil temperatures and water evaporation, thus improving soil water status compared to unshaded coffee systems [15]. Compared with coffee monocultures, its intercropping with Brazilian palms increased productivity and efficacy [16]. However, not all agroforestry systems offer the advantages of maintaining soil quality and stimulating productivity. In a soybean–tree intercropping system, competition between trees for light and soil water resulted in decreased net photosynthesis and soybean yields [17]. Therefore, it is critical for the implementation of agroforestry practice to fully consider the interactions between crops and trees.
Moso bamboo (Phyllostachys edulis (Carrière) J. Houz.) is an important bamboo species in China, which is widespread across an area of 4.68 million ha and accounts for 72.96% of the total area of bamboo forests [18]. Bamboo forest is an important natural resource providing bamboo shoots, woody material, bioenergy, and other economic products [19], and also serves a variety of ecological functions including carbon sequestration [20] and soil and water conservation [21]. However, the highly intensive management of bamboo forests brought about a series of ecological issues. Furthermore, the weak bamboo market, high costs, and the low enthusiasm of farmers are leading to the decline in the economic benefits of bamboo forests [22]. Therefore, scientific management measures should be adopted to alleviate the ecological challenges of bamboo forests, and to improve the productivity and economic benefits. Polygonatum cyrtonema Hua, a perennial herb of the family Liliaceae, is an essential component of traditional Chinese medicine as well as a functional food [23]. Due to the long-term overharvesting of wild P. cyrtonema, its resources are essentially exhausted, and large-scale artificial cultivation emerged. It was reported that Polygonatum tubers generally have improved quality after more than four years of growth [24], which means that farmers cannot recover economic benefits from this land for this time period. The intercropping of P. cyrtonema with moso bamboo forest may provide an effective strategy for its biomimetic cultivation, while improving the eco-economic effects of bamboo forests as a management strategy.
Moso bamboo–P. cyrtonema intercropping systems became an extensive cultivation mode in East China [25]. Studies revealed that the intercropping of moso bamboo and herbs significantly decreased the soil organic carbon (SOC) content and total nitrogen (TN) [26]. Our previous study demonstrated that moso bamboo–P. cyrtonema intercropping systems significantly reduced the soil bulk density, while increasing the soil SOC, available nitrogen, available phosphorus, and exchangeable magnesium content compared with moso bamboo monoculture [27].It was reported that stand density can impact soil quality and productivity by altering the understory microclimate [28,29]. Since P. cyrtonema prefers shade, the moderate intercropping density of stands is beneficial for its photosynthetic capacities, as well as improving its rhizome yields and quality. However, excessive shading often leads to reduced productivity, which is possibly due to the competition between trees and crops for light, nutrients, and other resources in the composite system. Excessive stand density may intensify interspecific competition in agroforestry systems to decrease site quality [30]. What remains unclear is which bamboo stand density will be optimal for use with P. cyrtonema to maximize yields, while translating the benefits of intercropping on soil quality. Soil quality was often interpreted as synonymous with plant yields in many studies [31]. The evaluation of soil quality may provide a theoretical basis for the efficient and sustainable management of the moso bamboo–P. cyrtonema agroforestry systems. Plant yields are typically affected by factors such as stand structures, soil nutrients, and management practices [32]. Earlier yield studies focused on specific areas and ignored the influences of site conditions on yields. Consequently, it is necessary to quantify the relationships between Polygonatum tuber yields and site factors, and to screen for those that are constraining. In general, Pearson correlation and multiple linear regression models have several limitations for the analysis of the complex relationships that exist between site factors and polygonatum tuber yields. The random forest can accommodate overfitting and multiple linearity, and evaluate the relative importance of variables [33]. Therefore, we hypothesized that moso bamboo–P. cyrtonema agroforestry systems could improve soil quality, and that increased bamboo density would result in decreased soil quality and Polygonatum tuber yields. The objectives of this study were to: (1) evaluate the soil quality of moso bamboo–P. cyrtonema agroforestry systems using the minimum data set method and (2) determine the key factors that affect Polygonatum tuber yields using random forest and structural equation models. This work provides a theoretical basis for the efficient management of moso bamboo–P. cyrtonema agroforestry systems.

2. Materials and Methods
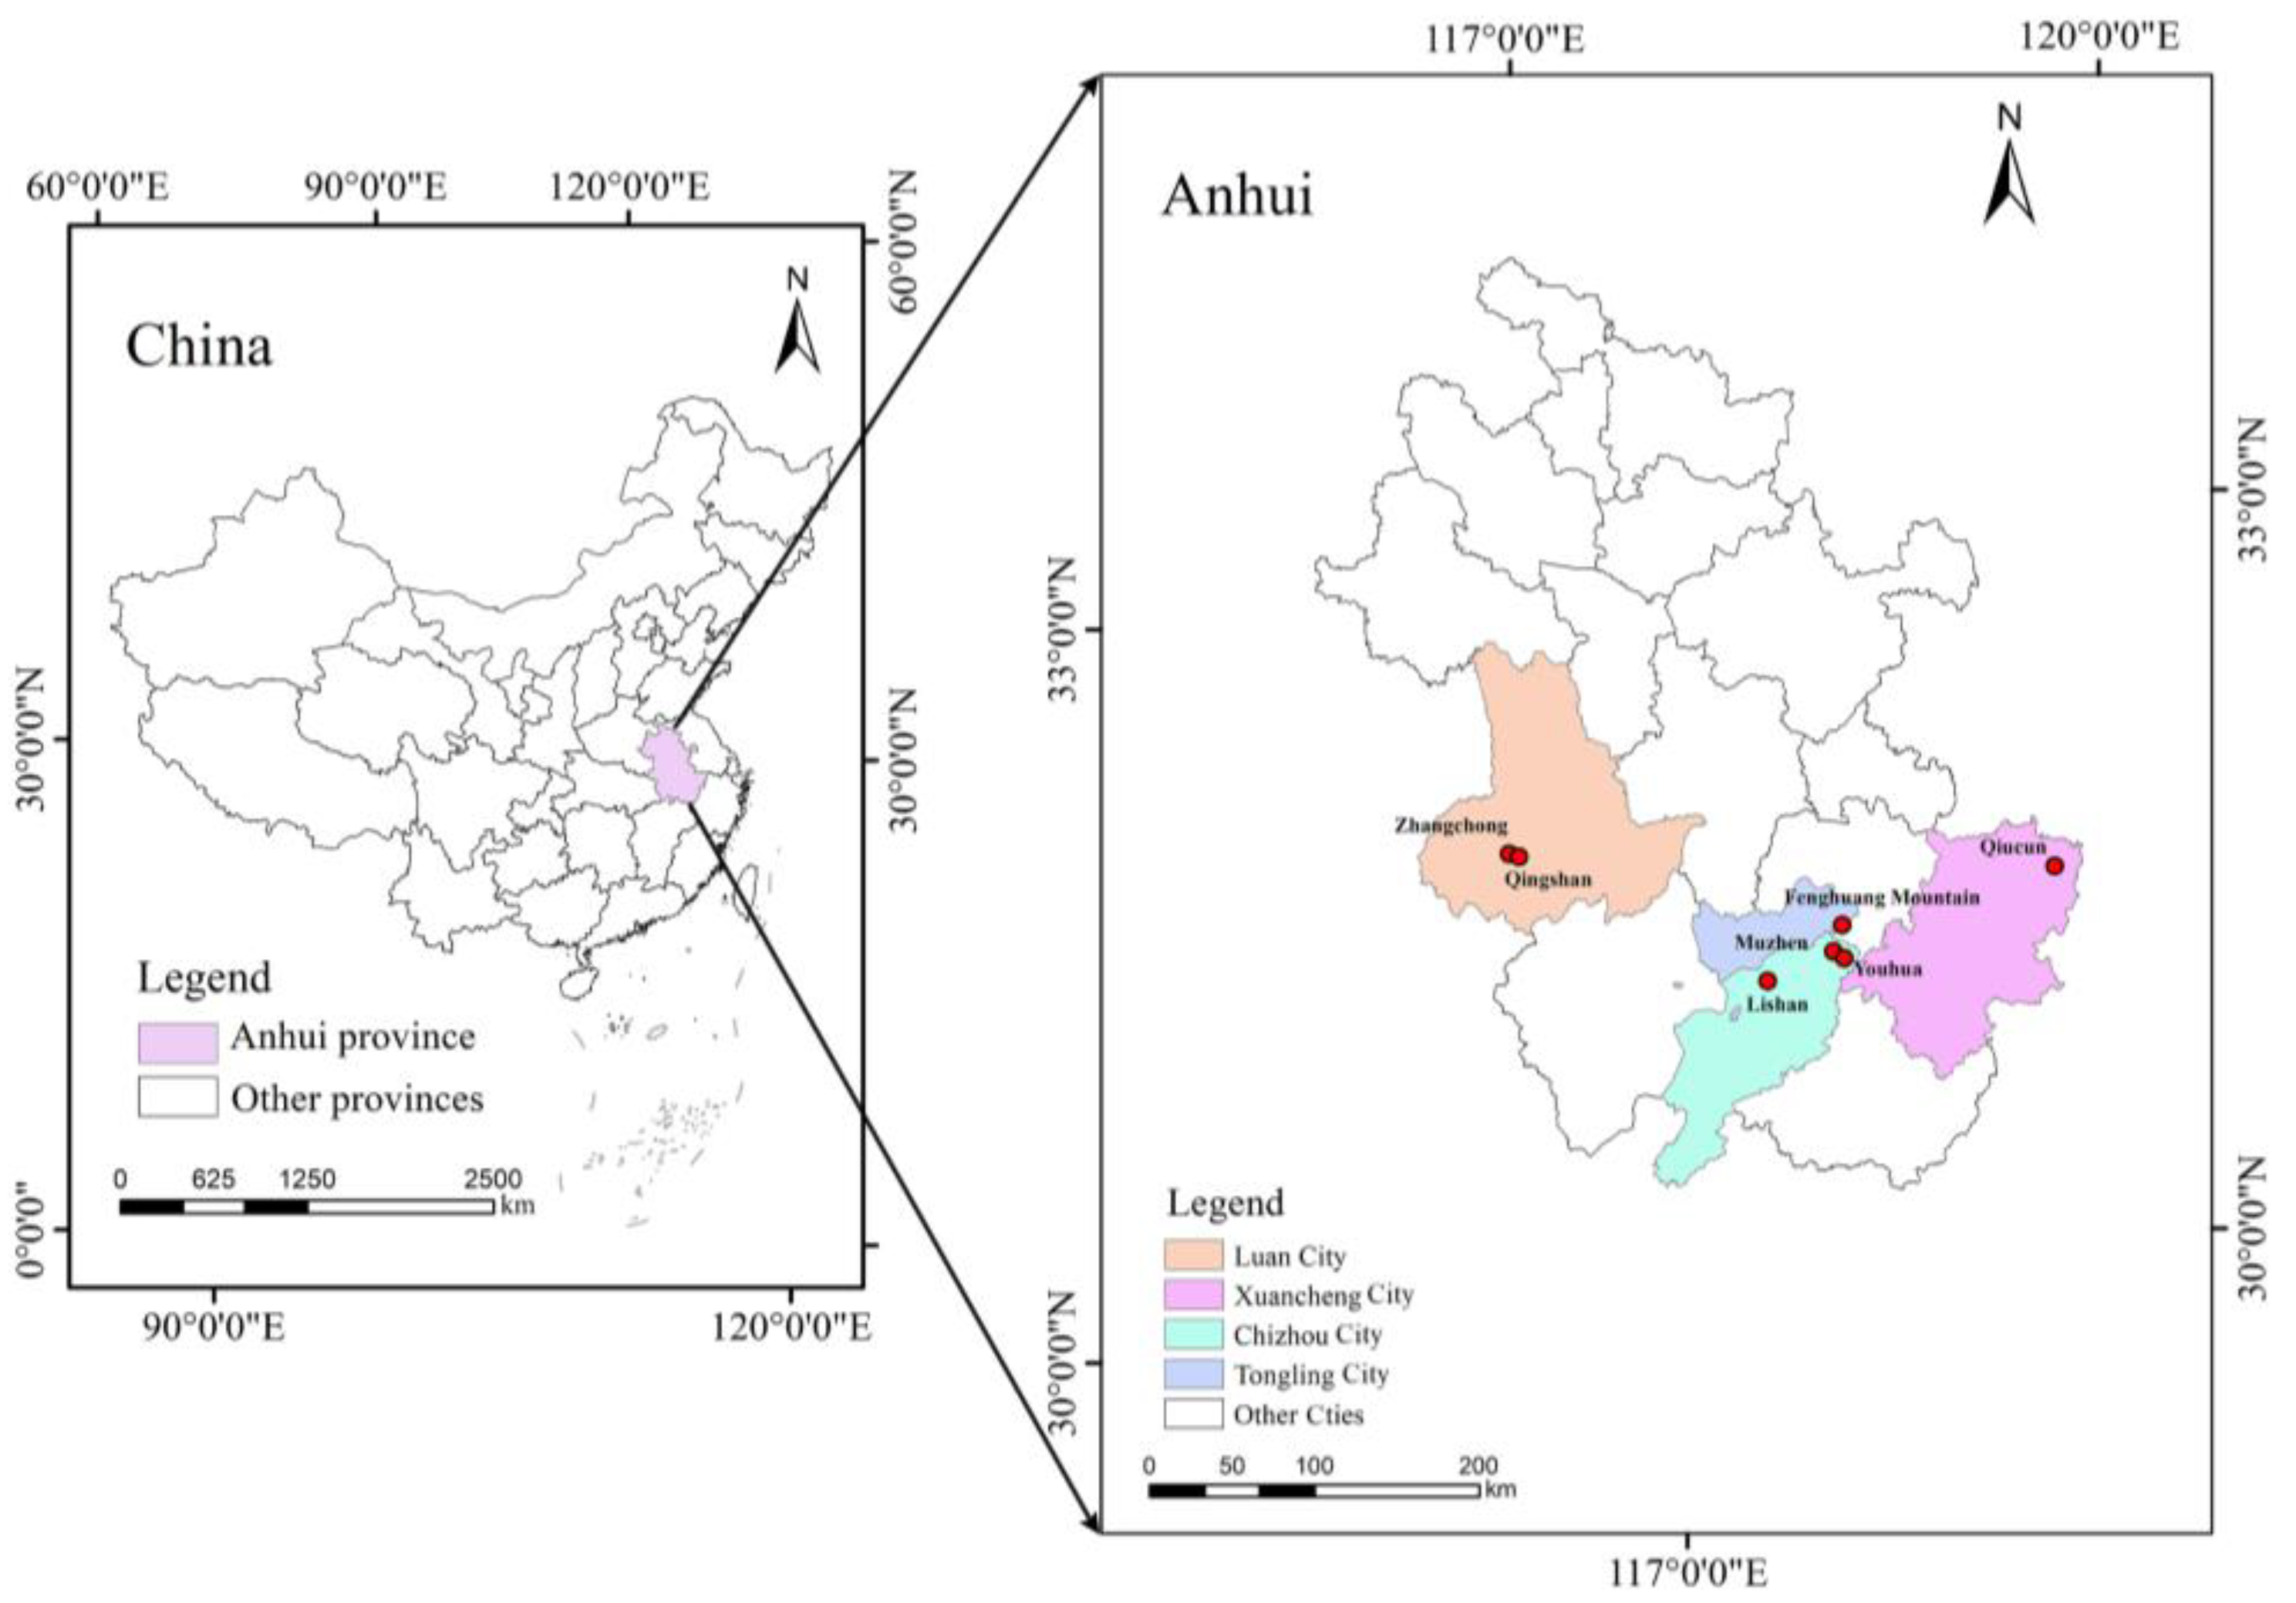
2.1. Study Area

According to the distribution of moso bamboo forest resources in Anhui, experiments involving moso-bamboo-based agroforestry intercropping with P. cyrtonema were conducted in Chizhou, Xuancheng, Tongling, and Lu’an Cities (Figure 1). The experimental area is home to a humid subtropical monsoon climate with average temperatures that range from 15.6 °C to 16.3 °C, an altitude of 500–1300 m, and an average annual precipitation of from 1360 to 1500 mm. The zonal forest vegetation are comprised of deciduous and evergreen broadleaved forest at the western site (Lu’an City) and evergreen broadleaved forest at the southern sites (Chizhou, Xuancheng, and Tongling Cities). The soil types are yellow brown soil at the western sites and reddish-yellow soil at the southern sites (Chinese Soil Survey Office, 1998), which are equivalent to Alfisol in FAO/UNESCO classification [34], with soil thickness that range from 80 cm to 100 cm. Moso bamboo forests are dominant at these sites, within which there are extensive Cunninghamia lanceolata (Lamb.) Hook. and Pinus massoniana Lam plantation forests.

2.2. Experimental Design

During December 2017 to January 2018, experimental intercropped moso bamboo–P. cyrtonema forests with different bamboo densities were established at the sites mentioned above, for a total of 29 sample plots. The designed initial density of the moso bamboo forests were M1 (1750 ± 25 culms/ha), M2 (2000 ± 73 culms/ha), M3 (2250 ± 10 culms/ha), and M4 (2500 ± 80 culms/ha), with five sample plots in each. Bamboo monoculture forest as the control (CK, 2500 ± 50 culms/ha), with nine sample plots. For each plot, three replicated sections of 20 m × 20 m were established for the different intercropping modes. The basic data of the experimental stands under different intercropping modes are presented in Table 1. Following soil reclamation and the application of 0.5 kg decomposed chicken manure fertilizer per planting hole, one-year-old P. cyrtonema seedlings were intercropped within the bamboo forests at a planting distance of 25 cm × 50 cm. The necessary harvest of bamboo shoots and old culms was adopted in the one-year to maintain the culm density of the experimental stands.
An investigation was conducted in September 2020, after three years of P. cyrtonema intercropping. Following the removal the litter layer, soil samples were randomly extracted at a 0–20 cm depth using a Ø6 cm soil auger at six points in each plot, which were then mixed to yield a single composite sample for each plot. The soil samples were then sealed in zip-lock bags and transferred to the laboratory in a cooler box with ice bags and treated soon thereafter. The samples for soil water determination were extracted and measured prior to pretreatment. Subsequently, all soil samples were sifted through a 2 mm sieve to remove roots, other organic debris, and coarse sand. The samples were divided into two portions; one portion was placed in a ventilated area and air-dried in the laboratory for the measurement of soil physiochemical properties. The other portion was stored in a refrigerator at 3–4 °C for pending ammonium (NH4+-N), nitrate (NO3-N), microbial biomass carbon (MBC), and nitrogen (MBN) measurements. Meanwhile, four 2 m × 2 m plots were randomly established in each plot, and all tubers of the P. cyrtonema plants were collected, sealed in zip-lock bags, and transferred to the laboratory for weight measurements.

2.3. Soil Analysis

The soil water content (SWC) was determined by a 105 °C drying method. The soil pH was measured using an Extech II pH meter in an aqueous solution at 1:2.5 (w/v). NH4+-N, NO3-N, total phosphorus (TP), and available phosphorus (AP) were analyzed using a flow injection automatic-analyzer (FIA Star 5000, FOSS, Stockholm, Sweden). The soil organic carbon (SOC) and total nitrogen (TN) were measured with a CN analyzer (EA 3000, Vector, Milan, Italy), while the available potassium (AK) was analyzed using atomic absorption spectrophotometry (D900, PinAAcle, Norwood, MA, USA). The soil microbial biomass carbon (MBC) and nitrogen (MBN) were determined using the chloroform fumigation-extraction method.

2.4. Soil Quality Assessment

When the soil quality index (SQI) is applied to evaluate soil quality, it is necessary to establish a minimum data set (MDS), where the MDS selection includes three main steps. The first step was to screen MDS reflecting soil characteristics from the total data set (TDS) via principal component analysis (PCA). PCA was performed to group the indices which load values were >0.5 in the components, where characteristic values >1 were grouped into one group. Secondly, the standard values of each indicator were calculated using Formula (1), and indicators with differences of <10% were screened from the highest standard value of each group. Thirdly, if multiple indicators were retained in a PC, Pearson’s correlation analysis was performed to determine whether these indicators could be deleted from the MDS [35].
N i k = Σ i k U i k 2 λ k
where Nik is the comprehensive load value of soil variable i on the first k principal components with characteristic values >1, and Uik is the load value of the ith evaluation index on the kth principal component, and λk is the eigenvalue of the k-th principal component.
After selecting the MDS indicators, the standard scoring function method was used to convert and normalize each MDS index to a value between 0 and 1. Generally, based on the contributions of each indicator to soil functionality, the scoring functions were developed into two types: “more is better” and “less is better” [36]. According to preceding reports and the impacts of different indicators on soil health and plant productivity [37,38], the pH, SWC, SOC, TN, TP, AP, NO3-N, NH4+-N, AK, MBN, and MBC were selected as S-type membership functions Formula (2), while altitude and slope were selected as anti-S membership functions Formula (3).
f x = 0.9 × x L U L + 0.1
f x = 1 0.9 × x L U L
where f(x) is the linear score of the soil index, x is the true value of the index, and L and U are the maximum and minimum values of the index, respectively.
The TDS and MDS indices were analyzed using principal component analysis (PCA) after dimensionless conversion to determine the weight (W) of each index with the obtained common factor variance Formula (4).
W i = C i Σ i = 1 n C i
where Wi is the weight of the indicator, Ci is the common factor variance of the indicator, and n is the number of indicators included in each data set (MDS or TDS).
Finally, the soil quality index was calculated after all indices were scored and weighted Formula (5). Furthermore, linear regression was fitted to quantify the relationship between MDS and TDS, which added to the interpretation ability of MDS with soil quality.
S Q I = Σ i = 1 n W i S i
where Wi is the weight of the indicator, Si is the linear score of the soil index, and n is the number of indicators included in each data set (MDS or TDS).

2.5. Statistical Analysis

Statistical analysis of the test data was performed using R4.2.1 and Excel 2020. A one-way ANOVA and least significant difference (LSD) test were used to evaluate the effects of stand density on soil physical and chemical properties and Polygonatum tuber growth. Pearson correlation coefficients were employed to quantify the correlations between soil indicators. Based on a random forest machine learning method, we analyzed the composite relationships between tuber yields and site conditions and identified the dominant factors that affected the tuber yields. To analyze the indirect impacts of the dominant factors, a structural equation model (SEM) was developed using Amos 23.0 software. All figures were drawn with Origin 2021.

3. Results

3.1. Soil Physicochemical Properties

There was a significant impact of the intercropping modes on the soil physical and chemical properties (p < 0.05), except for the soil pH (Table 2). The SWC, TN, SOC, NO3-N, NH4+-N, MBC, MBN, and AP contents were significantly higher in the intercropping system than in the moso bamboo monoculture (CK). The soil NO3-N, NH4+-N, MBC, MBN, and AP were significantly higher in M1 than in the other modes and CK. No significant differences in the soil TN and SOC appeared between the different modes, while they were significantly higher than those of the CK. It was found that there was no significant effect of intercropping on the soil pH (p > 0.05), with a slight decrease in M1 and increase under the other modes.

3.2. Soil Quality Evaluation

The results of PCA revealed that there were four principal components with eigenvalues of >1.0. PC1 explained 39.19% of the variance, whereas PC2, PC3, and PC4 explained 20.24%, 11.30%, and 9.02%, respectively. The cumulative contribution rate of variance was 79.75% (Table 3), which indicated that the four principal components had a strong explanatory capacity to the total variance. Based on the MDS establishment principle, NO3-N, NH4+-N, TP, AP, MBC, and MBN in the PC1 all met the absolute load higher than 0.5, where the deviation from the highest Norm (MBC = 2.012) was <10% for MBC and AP. Due to significant correlations between the MBC, MBN, and AP (p < 0.05) (Figure 2), only MBC in PC1 entered MDS. Similarly, altitude was retained in PC2, and AK was retained in PC3. The pH was selected into MDS because only one index load value in PC4 was >0.5. Finally, the MDS of soil quality evaluation indices were determined as MBC, altitude, AK, and pH (Table 4).
The soil quality indices (SQI-MDS) of the different intercropping modes were ranked as M1 (0.680) > M3 (0.577) > M2 (0.573) > M4 (0.568) > CK (0.498) (Figure 3), which indicated an improvement in the soil quality of bamboo forest through intercropping. It appeared that altitude (0.903) contributed to soil quality more than did the pH (0.690), AK (0.741), or MBC (0.561) via contribution rate analysis. To verify the MDS accuracy, linear regression was applied and the results revealed that there existed a significant correlation between TDS-SQI and MDS-SQI (p < 0.001), with R2 = 0.644 for the linear fit equation (p < 0.01; Figure 4). The results confirmed that the selected MDS indices for the soil quality evaluation in the study could provide an accurate assessment.

3.3. Main Factors Controlling Polygonatum Tuber Yields

The Polygonatum tuber yields showed an increasing trend with decreased stand density, with the highest in M1 and the lowest in M4 (Figure 5). The results of the random forest model showed that NO3-N, MBN, NH4+-N, and MBC were the most important factors that affected the Polygonatum tuber yield, followed by SOC and AK (p < 0.05; Figure 6).
Combined with the soil quality assessment results, we finally selected the culm density, altitude, SOC, MBN, AK, and NO3-N to develop the SEM to reveal the impact mechanism of the Polygonatum tuber yield. The results implied that SEM accounted for 89% of the variation in Polygonatum tuber yields. The variations in bamboo density not only had a direct significantly negative effect on the tuber yield (standardized path coefficient = −0.83, p < 0.001), but also had significant indirect effects by impacting the soil MBN (β = −0.64, p < 0.001), and then affecting NO3-N (standardized path coefficient = −0.33, p < 0.01), which in turn influenced the yield (β = −0.15, p < 0.05). Altitude had a direct significantly positive effect on the yield (β = 0.16, p < 0.01). Altitude also impacted the tuber yield by affecting the soil SOC (standardized path coefficient = 0.44, p < 0.001) and MBN (standardized path coefficient = 0.25, p < 0.05). SOC further impacted the yield by affecting the soil MBN (standardized path coefficient = 0.34, p < 0.01). The change in the soil SOC ultimately affected the change in yields (standardized path coefficient = 0.10, p = 0.05). The soil SOC (standardized path coefficient = 0.10, p = 0.05) and NO3-N had a direct significantly positive regulating effect on the tuber yields (standardized path coefficient = 0.15, p < 0.05) (Figure 7, Table S1).

4. Discussion

4.1. Effects of Intercropping on Soil Properties

Previous studies demonstrated that agroforestry systems were superior to monocultures in terms of improving soil structure and coordinating the relationships between soil moisture, nutrients, and microorganisms [39,40]. A wide variety of factors affect the physical and chemical properties of soil, including the quality and quantity of litterfall, distribution of root systems, microbial activities, and intercropping species, etc. [41,42]. In this study, we observed that intercropping increased soil water content. Wang found similar results in a Vicia sativa–Kiwifruit intercropping system [43]. This might have been due to the crop cover, where their litter reduced the evaporation of soil water and controlled the generation of surface runoff, thus increasing the SWC [44]. With increasing stand densities, the SWC initially increased and then decreased, reaching a maximum under the M2 mode (2000 ± 73 culms/ha). A potential explanation for this was that the lower stand density increased light transmission within the forest, thereby intensifying the evaporation of soil water. Moreover, high-density stands could lead to an increase in the water demands of the entire composite system due to its high leaf area index under the same site conditions [45]. In other words, more bamboo consumed more water. Therefore, changes in the culm density can regulate soil moisture regime.
In contrast to the moso bamboo monoculture, intercropping induced an increase in soil organic carbon, total N, and P in the topsoil, which was verified in multiple agroforestry systems [46,47]. Several studies indicated that dead plant matter and root exudates were important sources of soil organic matter; the presence of more dead matter and roots in the intercropping systems increased the inputs of organic matter into the soil [48,49]. The M1 mode (1750 ± 25 culms/ha) exhibited a higher soil organic carbon content, which may have been related to changes in the forest structure that led to modifications in the forest environment [50]. These changes might affect vegetation growth, litter production and decomposition. The total soil N showed a similar trend to soil organic carbon. A previous study proved that the soil C cycle was positively correlated with the N cycle [51]. Soil microbial carbon and nitrogen may be utilized for soil nutrient storage, and are closely related to the soil organic carbon and total N, which directly impacts soil nutrients [52]. It was reported that warm air, higher temperatures, and increased litter encourages the growth of soil microorganisms [53]. In this study, the highest soil microbial carbon and nitrogen contents were observed under the M1 mode (1750 ± 25 culms/ha), which suggested that a lower culm density was more conducive to soil microbial growth and nutrient cycling. There was no doubt that the total soil nutrients were critical for controlling its capacity to support plant growth; however, available nutrients were the primary factors that influenced the productivity of forest ecosystems [54]. Agroforestry significantly increased the nutrients availability of the soils.

4.2. Evaluation of Soil Quality

Lima proposed that eight indicators could provide sufficient data for the assessment of soil quality [55]. In this study, fifteen indicators including physical, chemical, and biological factors were selected as TDS. These were similar to the high-frequency indicators presented in related studies [56,57], which indicated that they were suitable for the evaluation of soil quality. Altitude, pH, AK, and MBC were selected into the MDS according to principal components and Norm values, of which the altitude weight was the greatest. This was because altitude can induce changes in environmental conditions (e.g., temperature, soil moisture, soil density, vegetation distribution, and light), which indirectly affect plant growth and the availability of soil nutrients [58]. Soil pH was a crucial indicator for evaluating soil quality, and played an important role in nutrient cycling, microbial activities, and plant growth [59]. Earlier investigations emphasized the importance of pH as a soil quality indicator for the assessment of different land use and forest conservation practices [60,61]. Microbial biomass nitrogen plays an important role in soil nutrient cycling, as it involves the decomposition of organic matter and regulation of C and N cycling. The available K is directly absorbed and utilized by plants [62], and participates in various physiological and biochemical processes such as carbohydrate metabolism and photosynthesis.
The order of SQI under different intercropping modes was M1 > M3 > M2 > M4 > CK, which indicated that intercropping systems were beneficial for the improvement of soil fertility. Compared with monocultures, agroforestry systems exhibited more abundant and diverse plant and microbial residues, as well as a more suitable microclimate, which stimulated soil microbial activities and litter decomposition, thus increasing soil nutrients [63]. The TDS-SQI and MDS-SQI were significantly positively correlated, which indicated that MDS can replace TDS in the evaluation of soil quality. TDS includes a more comprehensive set of soil indicators, while MDS can evaluate soil quality based on fewer indicators. The four MDS indices selected for this study can provide references for the assessment of soil quality in moso bamboo–P. cyrtonema intercropping systems.

4.3. Factors Affecting Polygonatum Tuber Yields

Our results revealed that stand density was the main factor that controlled the yields of Polygonatum tubers. Compared with monocultures, intercropping can alter the level of photosynthetic radiation and microclimate through shading, which proved to be the key factors that affected plant photosynthesis, particularly for shade tolerant P. cyrtonema [64]. Excessive shading can result in the lodging of P. cyrtonema, which is not conducive to its photosynthesis and growth [65]. High stand density may accelerate competition between trees and crops for sunlight and soil resources, which is also not conducive to crop growth. Altitude has a substantially positive impact on Polygonatum tuber yields at altitudes ranging from 100 to 500 m. Zhu reported that Polygonatum tuber yields were decreased along with higher altitudes ranging from 500 to 1200 m [66]. This was attributed to decreased temperatures across altitude gradient, which were found to exert indirect effects on tuber yields through correlations of density and altitude with MBN and SOC concentrations. Increased SOC contents might lead to increased soil productivity [67], while soil microorganisms contribute to nutrient cycling and organic matter decomposition. Increased microbial biomass can enhance soil fertility by increasing nutrient cycling rates and energy flows to promote plant growth [68]. The SOC and NO3-N were determined to be the predominant soil factors that influenced tuber yields. A high SOC content is conducive to maintaining soil fertility, promoting the formation of soil aggregates, and improving nutrient availability [69]. Further, NO3-N is mineralized form of N that may be directly absorbed and utilized by plants [70], which facilitates the growth of P. cyrtonema.

5. Conclusions

For this study, a minimum data set was employed to evaluate the soil quality of different moso bamboo–P. cyrtonem intercropping systems. The results indicated that altitude, MBC, AK, and pH were the primary site factors that controlled soil quality. Agroforestry management enhanced the soil quality due to the accumulation of soil organic matter and the improved availability of soil nutrients. Among the different intercropping modes, the culm density emerged as the dominant factor that impacted the soil quality, with the highest SQI under the M1 mode, with a stand density of 1750 culms/ha. The Polygonatum tuber yields decreased along with higher culm densities, which may have been associated with the competition between plants for sunlight, water, nutrients, and other resources. Random forest and structural equation modeling revealed the complex interactions between site factors and tuber yields. Both the stand density and altitude had direct significant impacts on tuber yields. Altitude had significant indirect effects on tube yields by positively affecting the soil MBN and SOC concentrations, while density had negative effects. Therefore, the regulation of stand density should be strengthened in actual management practices to ensure the efficacy and sustainability of moso bamboo–P. cyrtonem intercropping systems.

Supplementary Materials

The following supporting information can be downloaded at: https://www.mdpi.com/article/10.3390/f14071426/s1, Table S1: The direct, indirect, and total standardized effects on Polygonatum tuber yield based on SEM. Model is presented in Figure 7.

Author Contributions

Conceptualization, X.X.; methodology, H.X.; software, H.X. and F.W.; formal analysis, H.X. and F.W.; investigation, Z.H., Z.D. and L.C.; resources, X.X.; data curation, H.X. and L.C.; writing—original draft preparation, H.X.; writing—review and editing, X.X.; visualization, H.X.; supervision, X.X.; project administration, X.X.; funding acquisition, X.X. All authors have read and agreed to the published version of the manuscript.

Funding

This research was funded by National Key Research and Development Program of China (2018YFD060010503) and Key Research and Development Program of Anhui Province (202007d06020010).

Data Availability Statement

Not applicable.

Acknowledgments

The authors would like to thank Cheng Huang and Baoxu Pan (Anhui Agricultura University) for their support in data processing.

Conflicts of Interest

The authors declare no conflict of interest.

References

  1. Huang, W.P.; Zong, M.M.; Fan, Z.X.; Feng, Y.; Li, S.Y.; Duan, C.Q.; Li, H.X. Determining the impacts of deforestation and corn cultivation on soil quality in tropical acidic red soils using a soil quality index. Ecol. Indic. 2021, 125, 52–61. [Google Scholar] [CrossRef]
  2. Liu, J.; Wu, L.C.; Chen, D.; Li, M.; Wei, C.J. Soil quality assessment of different Camellia oleifera stands in mid-subtropical China. Appl. Soil Ecol. 2017, 113, 29–35. [Google Scholar] [CrossRef]
  3. Karlen, D.L.; Mausbach, M.J.; Doran, J.W.; Cline, R.G.; Harris, R.F.; Schuman, G.E. Soil quality: A concept, definition, and framework for evaluation. Soil Sci. Soc. Am. J. 1997, 61, 4. [Google Scholar] [CrossRef] [Green Version]
  4. Santos-Frances, F.; Martinez-Grana, A.; Avila-Zarza, C.; Criado, M.; Sanchez, Y. Comparison of methods for evaluating soil quality of semiarid ecosystem and evaluation of the effects of physico-chemical properties and factor soil erodibility (Northern Plateau, Spain). Geoderma 2019, 354, 113872. [Google Scholar] [CrossRef]
  5. Huang, C.; Wang, Z.C.; Ren, X.L.; Ma, X.M.; Zhou, M.Y.; Ge, X.; Liu, H.; Fu, S.L. Evaluation of Soil Quality in a Composite Pecan Orchard Agroforestry System Based on the Smallest Data Set. Sustainability 2022, 14, 10665. [Google Scholar] [CrossRef]
  6. Rosati, A.; Borek, R.; Canali, S. Agroforestry and organic agriculture. Agrofor. Syst. 2021, 95, 805–821. [Google Scholar] [CrossRef]
  7. Santiago-Freijanes, J.J.; Mosquera-Losada, M.R.; Rois-Diaz, M.; Ferreiro-Dominguez, N.; Pantera, A.; Aldrey, J.A.; Rigueiro-Rodriguez, A. Global and European policies to foster agricultural sustainability: Agroforestry. Agrofor. Syst. 2021, 95, 775–790. [Google Scholar] [CrossRef]
  8. Ni, H.J.; Su, W.H.; Fan, S.H.; Chu, H.Y. Effects of intensive management practices on rhizosphere soil properties, root growth, and nutrient uptake in Moso bamboo plantations in subtropical China. For. Ecol. Manag. 2021, 493, 119083. [Google Scholar] [CrossRef]
  9. Gui, R.Y.; Wu, W.; Zhuang, S.Y.; Zhong, Z.K. Intensive management increases soil acidification and phytotoxic Al content in Phyllostachys praecox stands in Southeast China. J. Sustain. For. 2018, 37, 46–55. [Google Scholar] [CrossRef]
  10. USDA. USDA Agroforestry Strategic Framework, Fiscal Year 2011–2016; U.S. Department of Agriculture: Washington, DC, USA, 2011. [Google Scholar]
  11. Muchane, M.N.; Sileshi, G.W.; Gripenberg, S.; Jonsson, M.; Pumarino, L.; Barrios, E. Agroforestry boosts soil health in the humid and sub-humid tropics: A meta-analysis. Agric. Ecosyst. Environ. 2020, 295, 106899. [Google Scholar] [CrossRef]
  12. Maney, C.; Sassen, M.; Hill, S.L.L. Modelling biodiversity responses to land use in areas of cocoa cultivation. Agric. Ecosyst. Environ. 2022, 324, 107712. [Google Scholar] [CrossRef]
  13. Muthee, K.; Duguma, L.; Majale, C.; Mucheru-Muna, M.; Wainaina, P.; Minang, P. A quantitative appraisal of selected agroforestry studies in the Sub-Saharan Africa. Heliyon 2022, 8, e10670. [Google Scholar] [CrossRef] [PubMed]
  14. Tang, X.M.; Jiang, J.; Huang, Z.P.; Wu, H.N.; Wang, J.; He, L.Q.; Xiong, F.Q.; Zhong, R.C.; Liu, J.; Han, Z.Q.; et al. Sugarcane/peanut intercropping system improves the soil quality and increases the abundance of beneficial microbes. J. Basic Microbiol. 2021, 61, 165–176. [Google Scholar] [CrossRef] [PubMed]
  15. Carvalho, A.F.D.; Fernandes-Filho, E.I.; Daher, M.; Gomes, L.D.C.; Schaefer, C.E.G.R.J.A.S. Microclimate and soil and water loss in shaded and unshaded agroforestry coffee systems. Agrofor. Syst. 2020, 95, 119–134. [Google Scholar] [CrossRef]
  16. Moreira, S.L.S.; Pires, C.V.; Marcatti, G.E.; Santos, R.H.S.; Imbuzeiro, H.M.A.; Fernandes, R.B.A. Intercropping of coffee with the palm tree, macauba, can mitigate climate change effects. Agric. For. Meteorol. 2018, 256, 379–390. [Google Scholar] [CrossRef]
  17. Peng, X.B.; Thevathasan, N.V.; Gordon, A.M.; Mohammed, I.; Gao, P.X. Photosynthetic Response of Soybean to Microclimate in 26-Year-Old Tree-Based Intercropping Systems in Southern Ontario, Canada. PLoS ONE 2015, 10, e0129467. [Google Scholar] [CrossRef] [Green Version]
  18. State Forestry and Grassland Administration. China Forest Resources Report (2014–2018); China Forestry Press: Beijing, China, 2019. [Google Scholar]
  19. Akoto, D.S.; Partey, S.T.; Denich, M.; Kwaku, M.; Borgemeister, C.B.; Schmitt, C.B. Towards bamboo agroforestry development in Ghana: Evaluation of crop performance, soil properties and economic benefit. Agrofor. Syst. 2020, 94, 1759–1780. [Google Scholar] [CrossRef]
  20. Gu, L.; Wu, W.G.; Ji, W.; Zhou, M.J.; Xu, L.; Zhu, W.Q. Evaluating the performance of bamboo forests managed for carbon sequestration and other co-benefits in Suichang and Anji, China. For. Policy Econ. 2019, 106, 101947. [Google Scholar] [CrossRef]
  21. Shinohara, Y.; Misumi, Y.; Kubota, T.; Nanko, K. Characteristics of soil erosion in a moso-bamboo forest of western Japan: Comparison with a broadleaved forest and a coniferous forest. Catena 2019, 172, 451–460. [Google Scholar] [CrossRef]
  22. Fan, S.H.; Liu, G.L.; Su, W.H.; Cai, W.H.; Guang, F.Y. Research progress in bamboo forest cultivation. For. Sci. Res. 2018, 31, 137–144. [Google Scholar] [CrossRef]
  23. Fan, B.L.; Wei, G.L.; Gan, X.F.; Li, T.T.; Qu, Z.Y.; Xu, S.; Liu, C.; Qian, C.Q. Study on the varied content of Polygonatum cyrtonema polysaccharides in the processing of steaming and shining for nine times based on HPLC-MS/MS and chemometrics. Microchem. J. 2020, 159, 105352. [Google Scholar] [CrossRef]
  24. Sun, L.; Wang, H.L.; Li, J.L.; Lu, W.J.; He, S.B.; Cheng, Z.H.; Li, Y.Y.; Luo, C.L. Study on the quality difference of Polygonatum in different growth years and harvest periods in Guizhou. Spec. Wild Econ. Anim. Plant Res. 2022, 44, 75–80. [Google Scholar] [CrossRef]
  25. Fan, Y.R.; Chen, S.L.; Yang, Q.P.; Li, C.Y.; Guo, Z.W.; Cheng, S. The impact of understory vegetation structure on growth of Polygonatum cyrtonema in extensively managed Phyllostachys edulis plantation. Acta Ecol. Sin. 2014, 34, 1471–1480. [Google Scholar] [CrossRef]
  26. Zhang, X.P.; Gao, G.B.; Wu, Z.Z.; Wen, X.; Zhong, H.; Zhong, Z.K.; Bian, F.Y.; Gai, X. Agroforestry alters the rhizosphere soil bacterial and fungal communities of moso bamboo plantations in subtropical China. Appl. Soil Ecol. 2019, 143, 192–200. [Google Scholar] [CrossRef]
  27. Wang, Q.; Sun, M.Y.; Xie, J.H.; Cao, X.Q.; Xu, X.N. Effects of different Phyllostachys pubescens-Polygonatum cyrtonema intercropping models on soil physicochemical properties. Ecol. Sci. 2020, 39, 54–59. [Google Scholar] [CrossRef]
  28. Crous-Duran, J.; Graves, A.R.; Paulo, J.A.; Mirck, J.; Oliveira, T.S.; Kay, S.; de Jalon, S.G.; Palma, J.H.N. Modelling tree density effects on provisioning ecosystem services in Europe. Agrofor. Syst. 2019, 93, 1985–2007. [Google Scholar] [CrossRef] [Green Version]
  29. Villwock, D.; Kurz, S.; Hartung, J.; Muller-Lindenlauf, M. Effects of Stand Density and N Fertilization on the Performance of Maize (Zea mays L.) Intercropped with Climbing Beans (Phaseolus vulgaris L.). Agriculture 2022, 12, 967. [Google Scholar] [CrossRef]
  30. Fan, S.H.; Zhao, J.C.; Su, W.H.; Yu, L.; Yan, Y. Comprehensive evaluation of soil quality of Phyllostachys pubescens forests with different densities. For. Sci. 2015, 51, 1–9. [Google Scholar]
  31. Biswas, S.; Hazra, G.C.; Purakayastha, T.J.; Saha, N.; Mitran, T.; Roy, S.S.; Basak, N.; Mandal, B. Establishment of critical limits of indicators and indices of soil quality in rice-rice cropping systems under different soil orders. Geoderma 2017, 292, 34–48. [Google Scholar] [CrossRef]
  32. Pedro, M.S.; Rammer, W.; Seidl, R. Disentangling the effects of compositional and structural diversity on forest productivity. J. Veg. Sci. 2017, 28, 649–658. [Google Scholar] [CrossRef]
  33. Pan, B.X.; Deng, Z.Q.; Yu, Y.C.; Xu, X.N.; Bi, L.L.; Tao, X. Differential Responses of Soil Respiration and Its Components to Nitrogen Application in Urban Forests. Forests 2022, 13, 2064. [Google Scholar] [CrossRef]
  34. Chen, Z.M.; Wang, Q.; Wang, H.Y.; Bao, L.; Zhou, J.M. Crop yields and soil organic carbon fractions as influenced by straw incorporation in a rice-wheat cropping system in southeastern China. Nutr. Cycl. Agroecosyst. 2018, 112, 61–73. [Google Scholar] [CrossRef]
  35. Zhang, Y.H.; Xu, X.L.; Li, Z.W.; Xu, C.H.; Luo, W. Improvements in soil quality with vegetation succession in subtropical China karst. Sci. Total Environ. 2021, 775, 145876. [Google Scholar] [CrossRef] [PubMed]
  36. Shao, G.D.; Ai, J.J.; Sun, Q.W.; Hou, L.Y.; Dong, Y.F. Soil quality assessment under different forest types in the Mount Tai, central Eastern China. Ecol. Indic. 2020, 115, 106439. [Google Scholar] [CrossRef]
  37. Karkaj, E.S.; Sepehry, A.; Barani, H.; Motamedi, J.; Shahbazi, F. Establishing a Suitable Soil Quality Index for Semi-arid Rangeland Ecosystems in Northwest of Iran. J. Soil Sci. Plant Nutr. 2019, 19, 648–658. [Google Scholar] [CrossRef]
  38. Qiu, X.C.; Peng, D.L.; Wang, H.B.; Wang, Z.Y.; Cheng, S. Minimum data set for evaluation of stand density effects on soil quality in Larix principis-rupprechtii plantations in North China. Ecol. Indic. 2019, 103, 236–247. [Google Scholar] [CrossRef]
  39. Wang, H.L.; Cao, X.Q.; Fan, W.; Deng, P.F.; Xu, X.N. Effects of intercropping systems of Phyllostachys edulis and Bletilla striata on soil bacterial community composition and function. Agrofor. Syst. 2023, 97, 617–630. [Google Scholar] [CrossRef]
  40. Beule, L.; Vaupel, A.; Moran-Rodas, V.E. Abundance, Diversity, and Function of Soil Microorganisms in Temperate Alley-Cropping Agroforestry Systems: A Review. Microorganisms 2022, 10, 616. [Google Scholar] [CrossRef]
  41. Suarez, L.R.; Salazar, J.C.S.; Casanoves, F.; Bieng, M.A.N. Cacao agroforestry systems improve soil fertility: Comparison of soil properties between forest, cacao agroforestry systems, and pasture in the Colombian Amazon. Agric. Ecosyst. Environ. 2021, 314, 107349. [Google Scholar] [CrossRef]
  42. Matos, P.S.; Fonte, S.J.; Lima, S.S.; Pereira, M.G.; Kelly, C.; Damian, J.M.; Fontes, M.A.; Chaer, G.M.; Brasil, F.C.; Zonta, E. Linkages among Soil Properties and Litter Quality in Agroforestry Systems of Southeastern Brazil. Sustainability 2020, 12, 9752. [Google Scholar] [CrossRef]
  43. Wang, Q.P.; Zhang, C.; Li, J.H.; Wu, X.M.; Long, Y.H.; Su, Y. Intercropping Vicia sativa L. Improves the Moisture, Microbial Community, Enzyme Activity and Nutrient in Rhizosphere Soils of Young Kiwifruit Plants and Enhances Plant Growth. Horticulturae 2021, 7, 335. [Google Scholar] [CrossRef]
  44. Wang, Z.C.; Zhou, M.Y.; Liu, H.; Huang, C.; Ma, Y.H.; Ge, H.X.; Ge, X.; Fu, S.L. Pecan agroforestry systems improve soil quality by stimulating enzyme activity. Peerj 2022, 9, e12663. [Google Scholar] [CrossRef] [PubMed]
  45. Zhang, M.; Chen, S.; Jiang, H.; Lin, Y.; Zhou, G.J.I.J.o.E.R.; Health, P. Water-Use Characteristics and Physiological Response of Moso Bamboo to Flash Droughts. Int. J. Environ. Res. Public Health 2019, 16, 2174. [Google Scholar] [CrossRef] [PubMed] [Green Version]
  46. Hu, L.N.; Huang, R.; Deng, H.; Li, K.; Peng, J.Y.; Zhou, L.Q.; Ou, H.P. Effects of Different Intercropping Methods on Soil Organic Carbon and Aggregate Stability in Sugarcane Field. Pol. J. Environ. Stud. 2021, 31, 3587–3596. [Google Scholar] [CrossRef]
  47. Shen, X.F.; Zhao, Z.H.; Chen, Y. Effects of Intercropping with Peanut and Silicon Application on Sugarcane Growth, Yield and Quality. Sugar Tech. 2019, 21, 437–443. [Google Scholar] [CrossRef]
  48. Abbas, F.; Hammad, H.M.; Fahad, S.; Cerda, A.; Rizwan, M.; Farhad, W.; Ehsan, S.; Bakhat, H.F. Agroforestry: A sustainable environmental practice for carbon sequestration under the climate change scenarios-a review. Environ. Sci. Pollut. Res. 2017, 24, 11177–11191. [Google Scholar] [CrossRef]
  49. Jobbagy, E.G.; Jackson, R.B. The vertical distribution of soil organic carbon and its relation to climate and vegetation. Ecol. Appl. 2000, 10, 423–436. [Google Scholar] [CrossRef]
  50. Ouyang, S.; Xiang, W.H.; Wang, X.P.; Xiao, W.F.; Chen, L.; Li, S.G.; Sun, H.; Deng, X.W.; Forrester, D.I.; Zeng, L.X.; et al. Effects of stand age, richness and density on productivity in subtropical forests in China. J. Ecol. 2019, 107, 2266–2277. [Google Scholar] [CrossRef]
  51. Jaman, M.S.; Muraina, T.O.; Dam, Q.; Zhang, X.; Jamil, M.; Bhattarai, S.; Islam, F. Effects of single and mixed plant types on soil carbon and nitrogen dynamics in homestead agroforestry systems in Northern Bangladesh. Agric. Ecosyst. Environ. 2021, 315, 107434. [Google Scholar] [CrossRef]
  52. Kononen, M.; Jauhiainen, J.; Strakova, P.; Heinonsalo, J.; Laiho, R.; Kusin, K.; Limin, S.; Vasander, H. Deforested and drained tropical peatland sites show poorer peat substrate quality and lower microbial biomass and activity than unmanaged swamp forest. Soil Biol. Biochem. 2018, 123, 229–241. [Google Scholar] [CrossRef]
  53. Xu, W.F.; Yuan, W.P. Responses of microbial biomass carbon and nitrogen to experimental warming: A meta-analysis. Soil Biol. Biochem. 2017, 115, 265–274. [Google Scholar] [CrossRef]
  54. Zhang, Z.; Hu, B.; Hu, G. Spatial heterogeneity of soil chemical properties in a subtropical karst forest, Southwest China. Sci. World J. 2014, 2014, 473651. [Google Scholar] [CrossRef] [PubMed] [Green Version]
  55. Lima, A.C.R.; Brussaard, L.; Totola, M.R.; Hoogmoed, W.B.; de Goede, R.G.M. A functional evaluation of three indicator sets for assessing soil quality. Appl. Soil Ecol. 2013, 64, 194–200. [Google Scholar] [CrossRef]
  56. Bünemann, E.; Bongiorno, G.; Bai, Z.; Creamer, R.E.; Brussaard, L.J.S.B. Soil quality—A critical review. Biochemistry 2018, 120, 105–125. [Google Scholar] [CrossRef]
  57. Chahal, I.; Van Eerd, L.L. Quantifying soil quality in a horticultural-cover cropping system. Geoderma 2019, 352, 38–48. [Google Scholar] [CrossRef]
  58. De Feudis, M.; Cardelli, V.; Massaccesi, L.; Lagomarsino, A.; Fornasier, F.; Westphalen, D.J.; Cocco, S.; Corti, G.; Agnelli, A. Influence of Altitude on Biochemical Properties of European Beech (Fagus sylvatica L.) Forest Soils. Forests 2017, 8, 213. [Google Scholar] [CrossRef] [Green Version]
  59. Hong, S.B.; Piao, S.L.; Chen, A.P.; Liu, Y.W.; Liu, L.L.; Peng, S.S.; Sardans, J.; Sun, Y.; Penuelas, J.; Zeng, H. Afforestation neutralizes soil pH. Nat. Commun. 2018, 9, 520. [Google Scholar] [CrossRef] [Green Version]
  60. Yu, Y.C.; Yang, J.Y.; Zeng, S.C.; Wu, D.M.; Jacobs, D.F.; Sloan, J.L. Soil pH, organic matter, and nutrient content change with the continuous cropping of Cunninghamia lanceolata plantations in South China. J. Soils Sediments 2017, 17, 2230–2238. [Google Scholar] [CrossRef]
  61. Fung, K.Y.; Leung, H.M.; Yung, K.K.L. Comparative assessment of soil quality parameters after implementing afforestation programme in forest areas of Hong Kong. Environ. Sci. Pollut. Res. 2021, 28, 25051–25059. [Google Scholar] [CrossRef]
  62. Zhang, S.L.; Zhang, X.Y.; Liu, X.B.; Liu, W.; Liu, Z.H. Spatial distribution of soil nutrient at depth in black soil of Northeast China: A case study of soil available potassium. Nutr. Cycl. Agroecosyst. 2013, 95, 319–331. [Google Scholar] [CrossRef]
  63. Udawatta, R.P.; Kremer, R.J.; Adamson, B.W.; Anderson, S.H. Variations in soil aggregate stability and enzyme activities in a temperate agroforestry practice. Appl. Soil Ecol. 2008, 39, 153–160. [Google Scholar] [CrossRef]
  64. Wang, L.; Zhou, T.; Cheng, B.; Du, Y.L.; Qin, S.S.; Gao, Y.; Xu, M.; Lu, J.J.; Liu, T.; Li, S.X.; et al. Variable Light Condition Improves Root Distribution Shallowness and P Uptake of Soybean in Maize/Soybean Relay Strip Intercropping System. Plants 2020, 9, 1204. [Google Scholar] [CrossRef] [PubMed]
  65. Gao, Q.M.; Ren, L.H.; Mi, Z.R.; Men, Q.F.; Dong, Q.Y.; Hang, J.L.; Wang, Z.F. Effects of different light intensities on the growth and photosynthetic characteristics of Polygonatum multiflorum. Shandong Agric. Sci. 2021, 53, 44–47. [Google Scholar] [CrossRef]
  66. Zhu, Z.L.; Xu, D.M.; Zhang, X.X.; Zhang, L.Z.; Cheng, Z.H. Effects of altitude on the growth of Polygonatum cyrtonema under the forest. J. Zhejiang Agric. Sci. 2022, 63, 500–502, 572. [Google Scholar] [CrossRef]
  67. Prade, T.; Katterer, T.; Bjornsson, L. Including a one-year grass ley increases soil organic carbon and decreases greenhouse gas emissions from cereal-dominated rotations—A Swedish farm case study. Biosys. Eng. 2017, 164, 200–212. [Google Scholar] [CrossRef]
  68. Pan, J.C.; Liu, C.; Li, H.L.; Wu, Q.C.; Dong, Z.; Dou, X.H. Soil-resistant organic carbon improves soil erosion resistance under agroforestry in the Yellow River Flood Plain, of China. Agrofor. Syst. 2022, 96, 997–1008. [Google Scholar] [CrossRef]
  69. Dhaliwal, J.; Kukal, S.S.; Sharma, S. Soil organic carbon stock in relation to aggregate size and stability under tree-based cropping systems in Typic Ustochrepts. Agrofor. Syst. 2018, 92, 275–284. [Google Scholar] [CrossRef]
  70. Wang, Y.; Li, X.; Zhang, C.; Wu, X.; Du, E.; Wu, H.; Yang, X.; Wang, P.; Bai, Y.; Wu, Y.; et al. Responses of soil respiration to rainfall addition in a desert ecosystem: Linking physiological activities and rainfall pattern. Sci. Total Environ. 2019, 650, 3007–3016. [Google Scholar] [CrossRef] [PubMed]
Figure 1. Map of study area and experimental sites.
Forests 14 01426 g001
Figure 2. Soil quality evaluation index correlation coefficient matrix. Significance is at p < 0.05 (*), 0.01 (**) and 0.001 (***), respectively.
Forests 14 01426 g002
Figure 3. Soil SQI accumulation map under different modes. Different lowercase letters indicate significant differences across MDS-SQI in the modes (p < 0.05).
Forests 14 01426 g003
Figure 4. Linear relationship between SQI-TDS and SQI-MDS.
Forests 14 01426 g004
Figure 5. Polygonatum tuber yield in different intercropping modes. Different lowercase letters indicate significant differences across Yield in the modes (p < 0.05).
Forests 14 01426 g005
Figure 6. Importance of soil factors to Polygonatum tuber yields. Significance is at p < 0.05 (*), 0.01 (**), and p > 0.05 (ns), respectively.
Forests 14 01426 g006
Figure 7. Results of structural equation modeling performed to evaluate the direct and indirect effects of the factors on Polygonatum tuber yields. Blue lines indicate significant positive effects and red lines indicate significant negative effects (p < 0.05), while non-significant effects are indicated by grey lines. Significance is at p < 0.05 (*), 0.01 (**) and 0.001 (***), respectively.
Forests 14 01426 g007
Table 1. Framework of the experimental forests of Phyllostachys edulis.
ModeBamboo DensityTree HeightDBHAltitudeSlopeSoil Thickness
(Culms/ha)(m)(cm)(m)(°)(cm)
CK2804 ± 3414.9 ± 0.269.9 ± 0.11261.7 ± 24.225.3 ± 0.686.6 ± 2.2
M11709 ± 1514.2 ± 0.199.8 ± 0.13240.0 ± 35.125.8 ± 0.783.4 ± 1.6
M22060 ± 3915.3 ± 0.3110.0 ± 0.08196.0 ± 12.124.6 ± 1.083.0 ± 3.1
M32283 ± 515.1 ± 0.3610.1 ± 0.16287.2 ± 26.625.9 ± 0.885.4 ± 2.3
M42590 ± 4515.4 ± 0.2610.2 ± 0.14266.6 ± 32.822.8 ± 0.891.2 ± 2.5
Note: DBH, Diameter at Breast Height.
Table 2. Outline of the experimental forests of Phyllostachys edulis.
IndicatorsIntercropping Mode
CKM1M2M3M4
SWC (%)19.01 ± 0.31 c19.64 ± 0.39 bc21.50 ± 0.30 a20.02 ± 0.33 b19.88 ± 0.43 bc
pH5.20 ± 0.04 a5.21 ± 0.03 a5.16 ± 0.04 a5.18 ± 0.02 a5.19 ± 0.03 a
SOC (g/kg)20.34 ± 0.39 b23.04 ± 0.30 a22.64 ± 0.38 a22.32 ± 0.41 a22.42 ± 0.39 a
TN (g/kg)1.79 ± 0.03 b1.98 ± 0.03 a1.97 ± 0.04 a1.92 ± 0.03 a1.96 ± 0.03 a
TP (g/kg)0.28 ± 0.01 b0.32 ± 0.00 a0.29 ± 0.01 b0.31 ± 0.01 ab0.29 ± 0.01 b
AK (mg/kg)68.10 ± 2.24 c86.27 ± 2.30 a72.31 ± 2.76 bc79.34 ± 2.27 ab77.62 ± 2.45 b
AP (mg/kg)1.38 ± 0.04 d2.41 ± 0.09 a2.07 ± 0.06 b1.99 ± 0.07 bc1.85 ± 0.08 c
NH4+-N (mg/kg)2.54 ± 0.09 c5.07 ± 0.11 a3.84 ± 0.28 b3.70 ± 0.30 b3.53 ± 0.20 b
NO3-N (mg/kg)1.67 ± 0.08 c3.05 ± 0.1 a2.51 ± 0.09 b2.32 ± 0.11 b2.25 ± 0.08 b
MBC (mg/kg)205.60 ± 6.02 c297.56 ± 13.67 a236.75 ± 7.95 b255.14 ± 7.84 b240.86 ± 7.36 b
MBN (mg/kg)23.68 ± 0.80 c42.78 ± 2.36 a34.04 ± 2.00 b34.55 ± 1.19 b30.67 ± 1.16 b
Note: The values in the table indicate mean ± standard error. Different letters in each row indicate significant differences (p < 0.05) of means under different intercropping modes.
Table 3. Loading matrix and norm values for each indicator.
IndicatorsPrincipal ComponentNorm
PC1PC2PC3PC4
Slope−0.0390.7310.172−0.3671.318
Altitude−0.2080.7900.385−0.1151.503
Thickness−0.398−0.6690.141−0.0141.473
SWC−0.113−0.7850.160−0.3991.435
pH0.071−0.0170.0710.9121.043
SOC0.2560.1570.879−0.2201.308
TN0.248−0.0200.8980.1851.286
NH4+-N0.682−0.1190.4770.2981.750
NO3-N0.670−0.1730.4800.2511.730
TP0.7180.3650.0100.0701.793
AP0.776−0.4780.079−0.0601.991
AK0.4800.4940.5360.3191.594
MBC0.8420.1820.1870.0632.012
MBN0.8120.1320.396−0.0681.979
Eigenvalue5.4872.8341.5821.263
Variance%39.19420.24311.2969.020
Cumulative Variance%39.19459.43770.73379.754
Table 4. Common factor variances and weights of the MDS and TDS for soil quality evaluation.
IndicatorsTDSMDS
CommunalityWeightCommunalityWeight
Slope0.7000.063
Altitude0.8290.0740.8100.263
Thickness0.6260.056
SWC0.8130.073
pH0.8410.0750.7190.233
SOC0.9110.082
TN0.9020.081
NH4+-N0.7950.071
NO3-N0.7720.069
TP0.6540.059
AP0.8400.075
AK0.8640.0770.9060.294
MBC0.7820.0700.6450.209
MBN0.8370.075
Disclaimer/Publisher’s Note: The statements, opinions and data contained in all publications are solely those of the individual author(s) and contributor(s) and not of MDPI and/or the editor(s). MDPI and/or the editor(s) disclaim responsibility for any injury to people or property resulting from any ideas, methods, instructions or products referred to in the content.

