Article

Response of Soil Microbial Communities and Functions to Long-Term Tea (Camellia sinensis L.) Planting in a Subtropical Region

Institute of Soil and Fertilizer, Fujian Academy of Agricultural Sciences/Fujian Key Laboratory of Plant Nutrition and Fertilizer, Fuzhou 350013, China
*
Author to whom correspondence should be addressed.
Forests 2023, 14(7), 1288; https://doi.org/10.3390/f14071288
Submission received: 24 May 2023 / Revised: 14 June 2023 / Accepted: 20 June 2023 / Published: 22 June 2023
(This article belongs to the Special Issue Soil Biology and Biochemistry of Forests)

Abstract

:
Soil microbes are the key to revealing the mechanisms driving variation in soil biogeochemical processes. In recent decades, forests in Southeast China have been widely transformed into tea plantations due to the drivers of economic benefits. However, the changes in the soil microbial community and their potential function during the transition from a typical forest ecosystem to tea plantations remain poorly understood. This study investigated the soil microbial community in tea plantation soils with different planting ages, i.e., 6, 12, 23 and 35 years, and in an adjacent woodland control. We discovered that tea planting significantly increased soil bacterial richness (ACE and Chao1) and decreased fungal richness, the diversity of bacteria (Simpson and Shannon) show a trend of initially decreasing and then increasing while there was no significant effect on fungal diversity. After tea planting, the relative abundances of Actinobacteria and Proteobacteria increased by 180.9%–386.6% and 62.3%–97.5%, respectively; the relative abundances of Acidobacteria decreased by 11.4%–66.8%. However, the fungal phyla were not significantly different among different aged tea plantations and woodlands. FAPROTAX and FUNGuild revealed that the transition of natural woodland to tea plantations significantly increased the relative abundances of aerobic_chemoheterotrophy (14.66%–22.69%), chemoheterotrophy (34.36%–37.04%), ureolysis (0.68%–1.35%) and pathogenic fungi (26.17%–37.02%). db-RDA proved that the bacterial community structure was more strongly related to soil pH and available nitrogen (AN), while the main determinants of the fungal community composition were soil pH and soil organic matter (SOM). These findings indicate that tea planting has a strong effect on the soil microbial community and potential function. The change in soil pH during tea planting was the most important factor affecting the soil microbial community, while soil bacteria were more sensitive to tea planting than fungi.

1. Introduction

Tea is the most common nonalcoholic beverage in the world and tea plantations have become one of the most widely planted economic crop plantations in Southeast Asia and China [1]. In 2018, the tea planting area reached 3.21 million hectares in China and has presented an upward trend over time. Fujian is one of the most important tea planting areas in China, with the highest tea output in China for many years. The growing population and economic demand have resulted in the extensive transformation from natural forest to tea plantation. Such areas spanned 219.8 thousand ha in 2019, and the gross crude tea production and unit yield rank first in China. After the tea is planted in natural soil, a unique tea garden soil ecosystem gradually forms due to the material circulation of the tea garden itself and typical tea plantation management measures [2]. However, the transition from a typical forest ecosystem to a monoculture tea plantation will lead to a series of soil degradation issues, such as soil erosion [3], acidification [4] and nutrient leaching, as well as accumulating aluminum and fluorine, structural destruction and beneficial microbial decreases [5], which have become the main constraint factor for sustainable tea production.
Soil microorganisms, including bacteria and fungi, play vital roles in many ecological processes, such as soil carbon and nitrogen cycling, the evolution of soil structure (Vezzani et al., 2018) and ecosystem function maintenance [6,7]. Therefore, the community structure and functional guilds of soil microorganisms can be used as an effective evaluation standard for soil fertility and health dynamics [8]. The soil environmental variations, including pH, SOM, water content, total nitrogen (TN) and C/N ratio, were considered to be key factors affecting the composition and function of soil microbial communities [9]. Previous research showed that tree species, planting ages and forest disturbance could directly or indirectly affect soil microorganisms by changing the soil nutrient status in forest ecosystems [10,11]. Xu et al. [12] and Liu et al. [13] found that the soil microbial community structure and diversity of plantations with different stand ages were distinctly different. The microbial diversity increased with plantation age [12,13], and the main functional groups involved in the carbon cycle were gradually replaced by groups related to nitrogen and sulfur cycling [14].
Although many studies have shown that long-term single planting will affect the physical and chemical properties of soil, change the soil structure and enzyme activity, and, thus, the soil microbial community structure [14,15,16]. However, it is currently unclear how monoculture tea plantations (especially in the chronosequence of tea plantations) may alter the soil microbial community and ecosystem functions. This is because the cultivation of tea trees may be completely different from that of other plantations, which may be attributed to the differences in management measures (such as long-term single application of nitrogen chemical fertilizers) and plant characteristics (such as aluminum rich litter and special root exudates) [5]. Firstly, the average amount of nitrogen application in Chinese tea plantations can reach 444 kg N ha−1y−1, and more than half of them use more than 450 kg N ha−1y−1 [17], which is much higher than that in other plantations. Furthermore, under long-term tea plantation conditions, the input of aluminum-rich litter and the decrease in pH lead to the accumulation of aluminum in soil [18], which may cause a decline in microbial activity and quantity [19]. In addition, most analyses of soil microbial communities were usually based on PLFAs [13,20], without information on specific taxa.
In this study, high-throughput sequencing coupled with FAPROTAX and FUNGuild analysis was used to study the soil bacterial and fungal community structure and functions in tea plantations with different planting ages. The aims of the present study were (1) to examine the microbial community composition of tea plantations with different cultivation years; (2) to elucidate the changes in soil bacterial and fungal functions (especially those related to nutrient cycling) in tea plantations with different planting ages; and (3) to determine the environmental factors driving soil microbial variation under chronosequence of tea plantations. The results have implications for the efficient and sustainable management of tea plantations in the future.

2. Materials and Methods
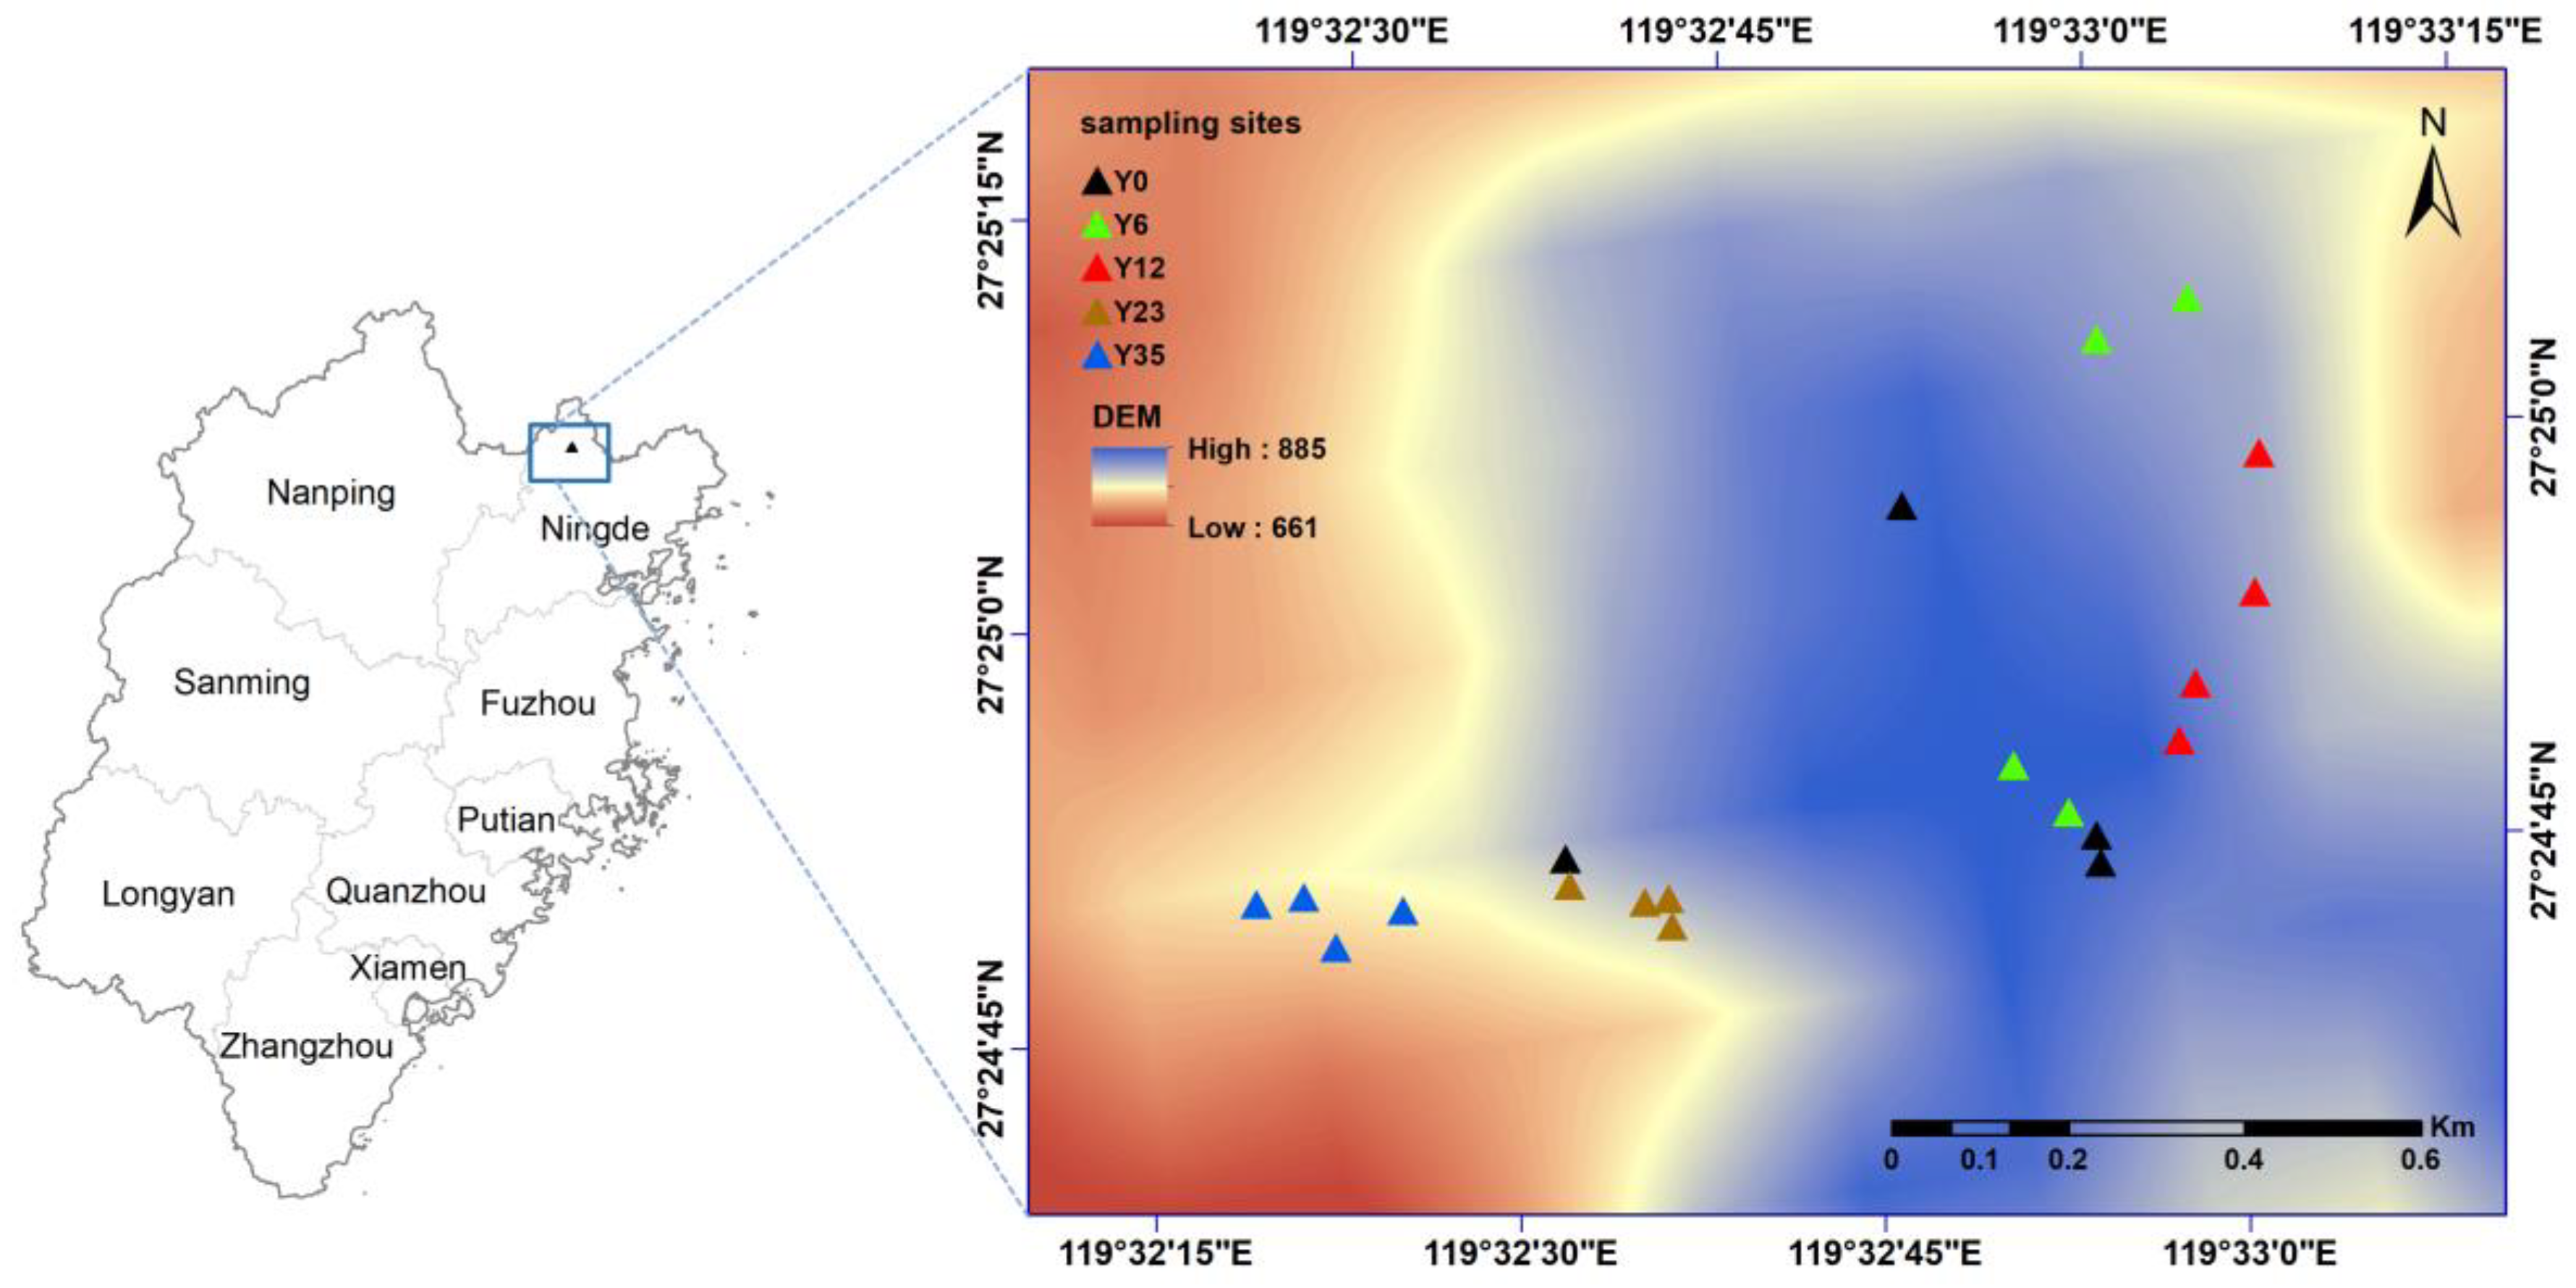
2.1. Study Site

The study area was situated in Nanyang Town, Shouning County, city of Ningde, Fujian Province, China (Figure 1). This area mainly has a subtropical monsoon climate, with an annual average temperature and precipitation of 15.1 °C and 1911 mm, respectively. The soil is developed from granites and is classified as red soil (Ultisols; US soil taxonomy). Previously, this region was converted to secondary woodland, dominated by Pinus massoniana, Castanopsis sclerophylla, Castanopsis eyrei, Schima superba and Machilus thunbergii. However, in the past two or three decades, to increase income, a large area of woodlands has been reclaimed to tea plantations. The tea plantation in this study covered approximately 70 ha, which is under unified management.
In May 2021, soil samples were collected from the Zhang Tianfu tea fields converted from woodland 6, 12, 23 and 35 years ago (denoted as Y6, Y12, Y23 and Y35, respectively), and an adjacent woodland (Y0) was used as a control. In each tea plantation and woodland, four representative sites were randomly selected from a total area of 2000 m × 4000 m. At each representative site, 3 plots (3 m × 3 m) were randomly selected at 50 m intervals. Five soil cores were collected in each plot, and all subsamples were pooled to form a composite sample for each representative site. Stones and debris were manually removed and then sieved using a 2-mm screen, after which the fresh samples within sterilized plastic bags were shipped to the laboratory. Each sample was subsequently further divided into two parts: one was stored at −80 °C for DNA extraction, and the other was air-dried for soil basic physiochemical analyses.

2.2. Soil Physiochemical Analyses

The soil bulk density was analyzed using the cutting ring method. Soil pH was determined in a 1:2.5 (w/v) soil:water slurry by a glass electrode. SOM and TN were determined using wet digestion with H2SO4-K2Cr2O7 and the semimicro Kjeldahl digestion method, respectively [21]. Inorganic nitrogen (NH4+-N and NO3-N) was measured by a continuous-flow analyzer (Skalar, Breda, The Netherlands). Soil available N, P and K were measured by NaOH hydrolyzable, molybdenum blue colorimetry and flame photometry methods, respectively [22].

2.3. DNA Extraction, Amplification and Sequencing

In accordance with the manufacturer’s instructions, DNA extraction was carried out using the PowerSoil® DNA Isolation Kit (MO BIO Laboratories, Elmwood Park, NJ, USA). A NanoDrop 2000 (NanoDrop Technologies Inc., Wilmington, NC, USA) was used to assess the quality and quantity of the extracted DNA. The primers 338F and 806R [23] and ITS1F and ITS2R [24] were utilized to amplify bacterial 16S rRNA (V3-V4 region) and the fungal ITS1 region, respectively.
Subsequently, purified PCR products were sent to Biomarker Technologies Co. (Beijing, China) for sequencing on an Illumina NovaSeq 6000 platform (Illumina Corporation, San Diego, CA, USA). The original sequences data were deposited into NCBI (SUB12113571 and SUB12114103).

2.4. Bioinformatic Processing and Statistical Analysis

The raw reads were assembled, quality-filtered, and processed using the QIIME platform. The remaining effective sequences of the bacteria and fungi were then assigned into operational taxonomic units (OTUs) at 97% similarity using USEARCH software (version 10.0) [25]. The taxonomic information of each OTU was annotated using the SILVA and UNITE databases for 16S rRNA and ITS, respectively. Alpha diversity indices were analyzed by using the Mothur software (version 1.35.1). FAPROTAX [26] and FUNGuild [27] were used to predict the potential functional traits of bacteria and fungi, respectively.
The changes in soil physicochemical properties, diversity indices and the relative abundance of bacterial or fungal communities among different tea planting ages were tested with one-way analysis of variance (ANOVA) in SPSS 26.0 (IBM SPSS Inc., Chicago, IL, USA). Principal coordinate analysis (PCoA) and distance-based redundancy analysis (db-RDA) were performed using R version 3.5.2. Pearson’s correlations among the soil microbial community and environmental factors were calculated and visualized in a heatmap using the ‘corrplot’ package in the R platform.

3. Results

3.1. Changes in Soil Physicochemical Properties

Substantial differences in soil physicochemical properties were observed between tea gardens and woodland (Table 1). Tea planting significantly increased the soil nutrients, and the contents of SOM, TN, TP, AN, AP and AK increased by 0.49–1.40, 1.01–1.62, 1.42–7.45, 1.51–3.84, 9.59–134.62 and 3.08–4.36 times, respectively, compared with the woodland. The contents of TN, SOM, TP, AP and AK increased with the extension of planting years, and the highest SOM (34.82 g kg−1), TN (1.80 g kg−1), TP (1.31 g kg−1), AP (140.03 mg kg−1) and AK (140.40 mg kg−1) were measured in Y35. Nevertheless, the tea plantation decreased the C/N ratio of the soil and was significantly lower in Y6 (9.10) than in the woodland (11.92) (p < 0.05, Table 1), but the C/N ratio recovered with increasing planting age. In addition, after the transition from woodland to tea plantations, the soil pH significantly decreased, from 5.0 for woodland land to 3.63–4.46 for tea plantations.

3.2. Alpha Diversity

For the soil bacterial community, there were significant differences in the alpha diversity, including the ACE, Chao1, Simpson and Shannon indices, among planting ages (Table 2). The ACE and Chao1 indices increased with the extension of planting years and were generally significantly higher in Y23 and Y35 than in the woodland, revealing that soil bacterial richness increased after long-term tea planting. However, the Simpson and Shannon indices show a trend of initially decreasing and then increasing. For the soil fungal community, the ACE and Chao1 indices indicated that fungal richness decreased with the extension of planting ages and was generally significantly lower in Y35 than in the woodland. Furthermore, the Simpson and Shannon indices suggested that the fungal diversity was not different among the different tea plantations and the control woodland.

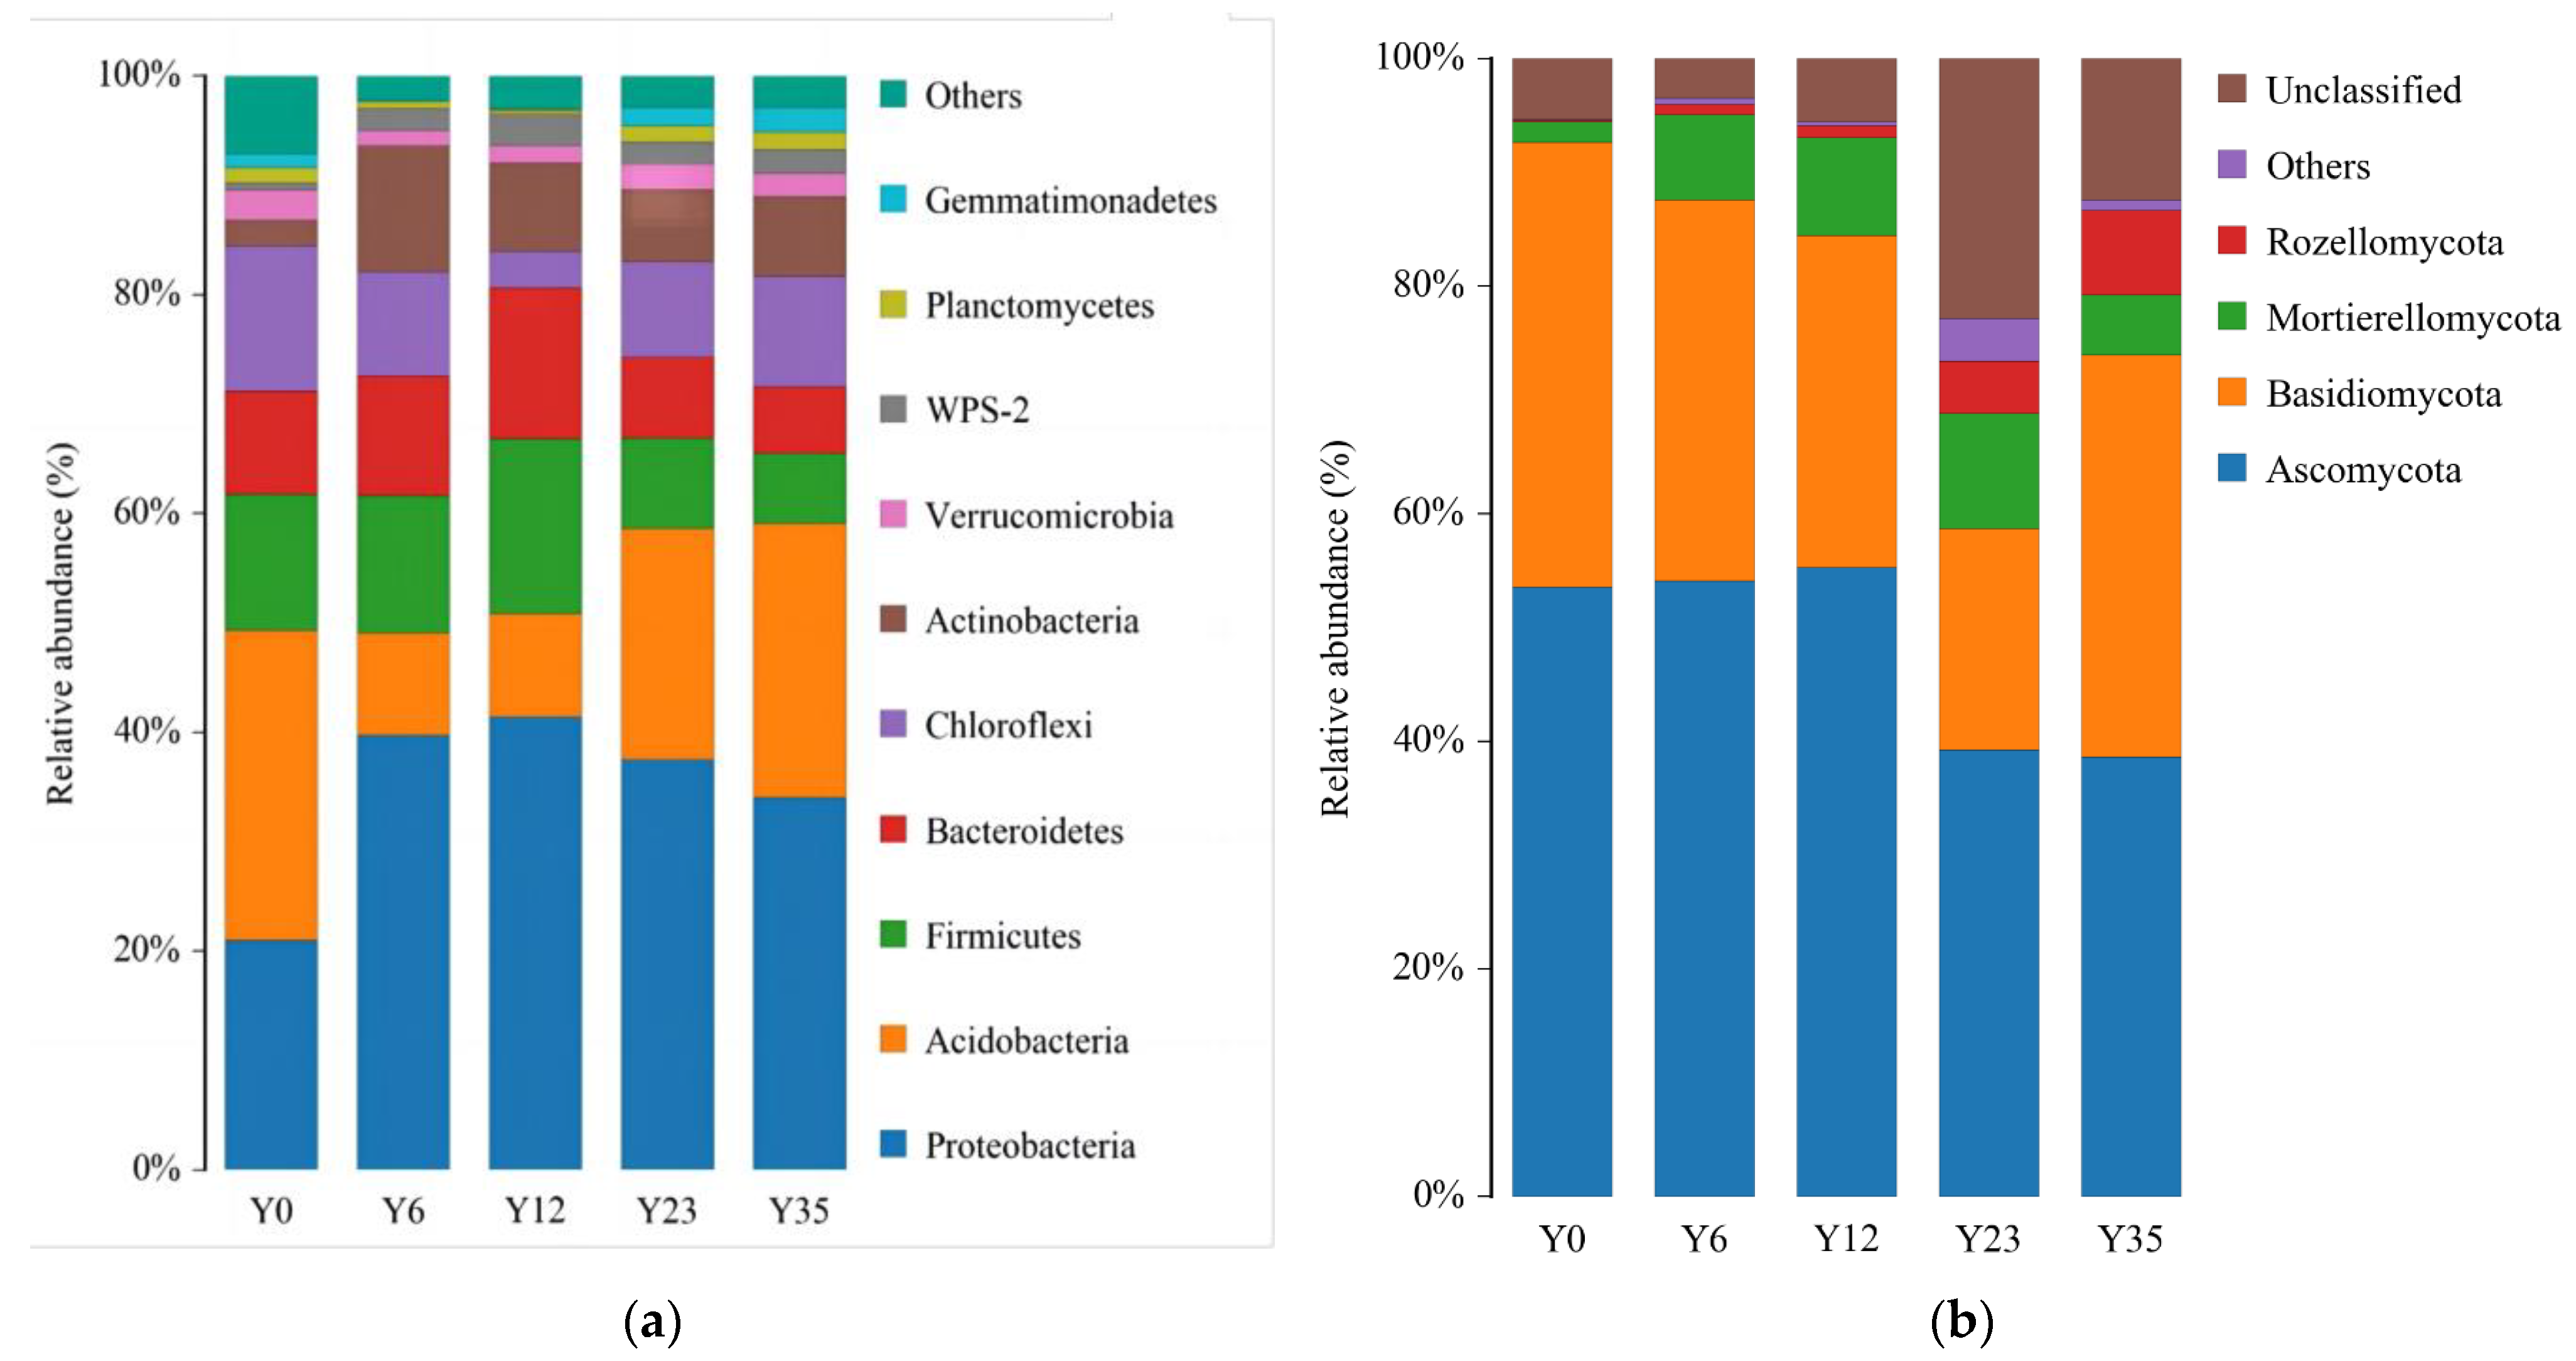
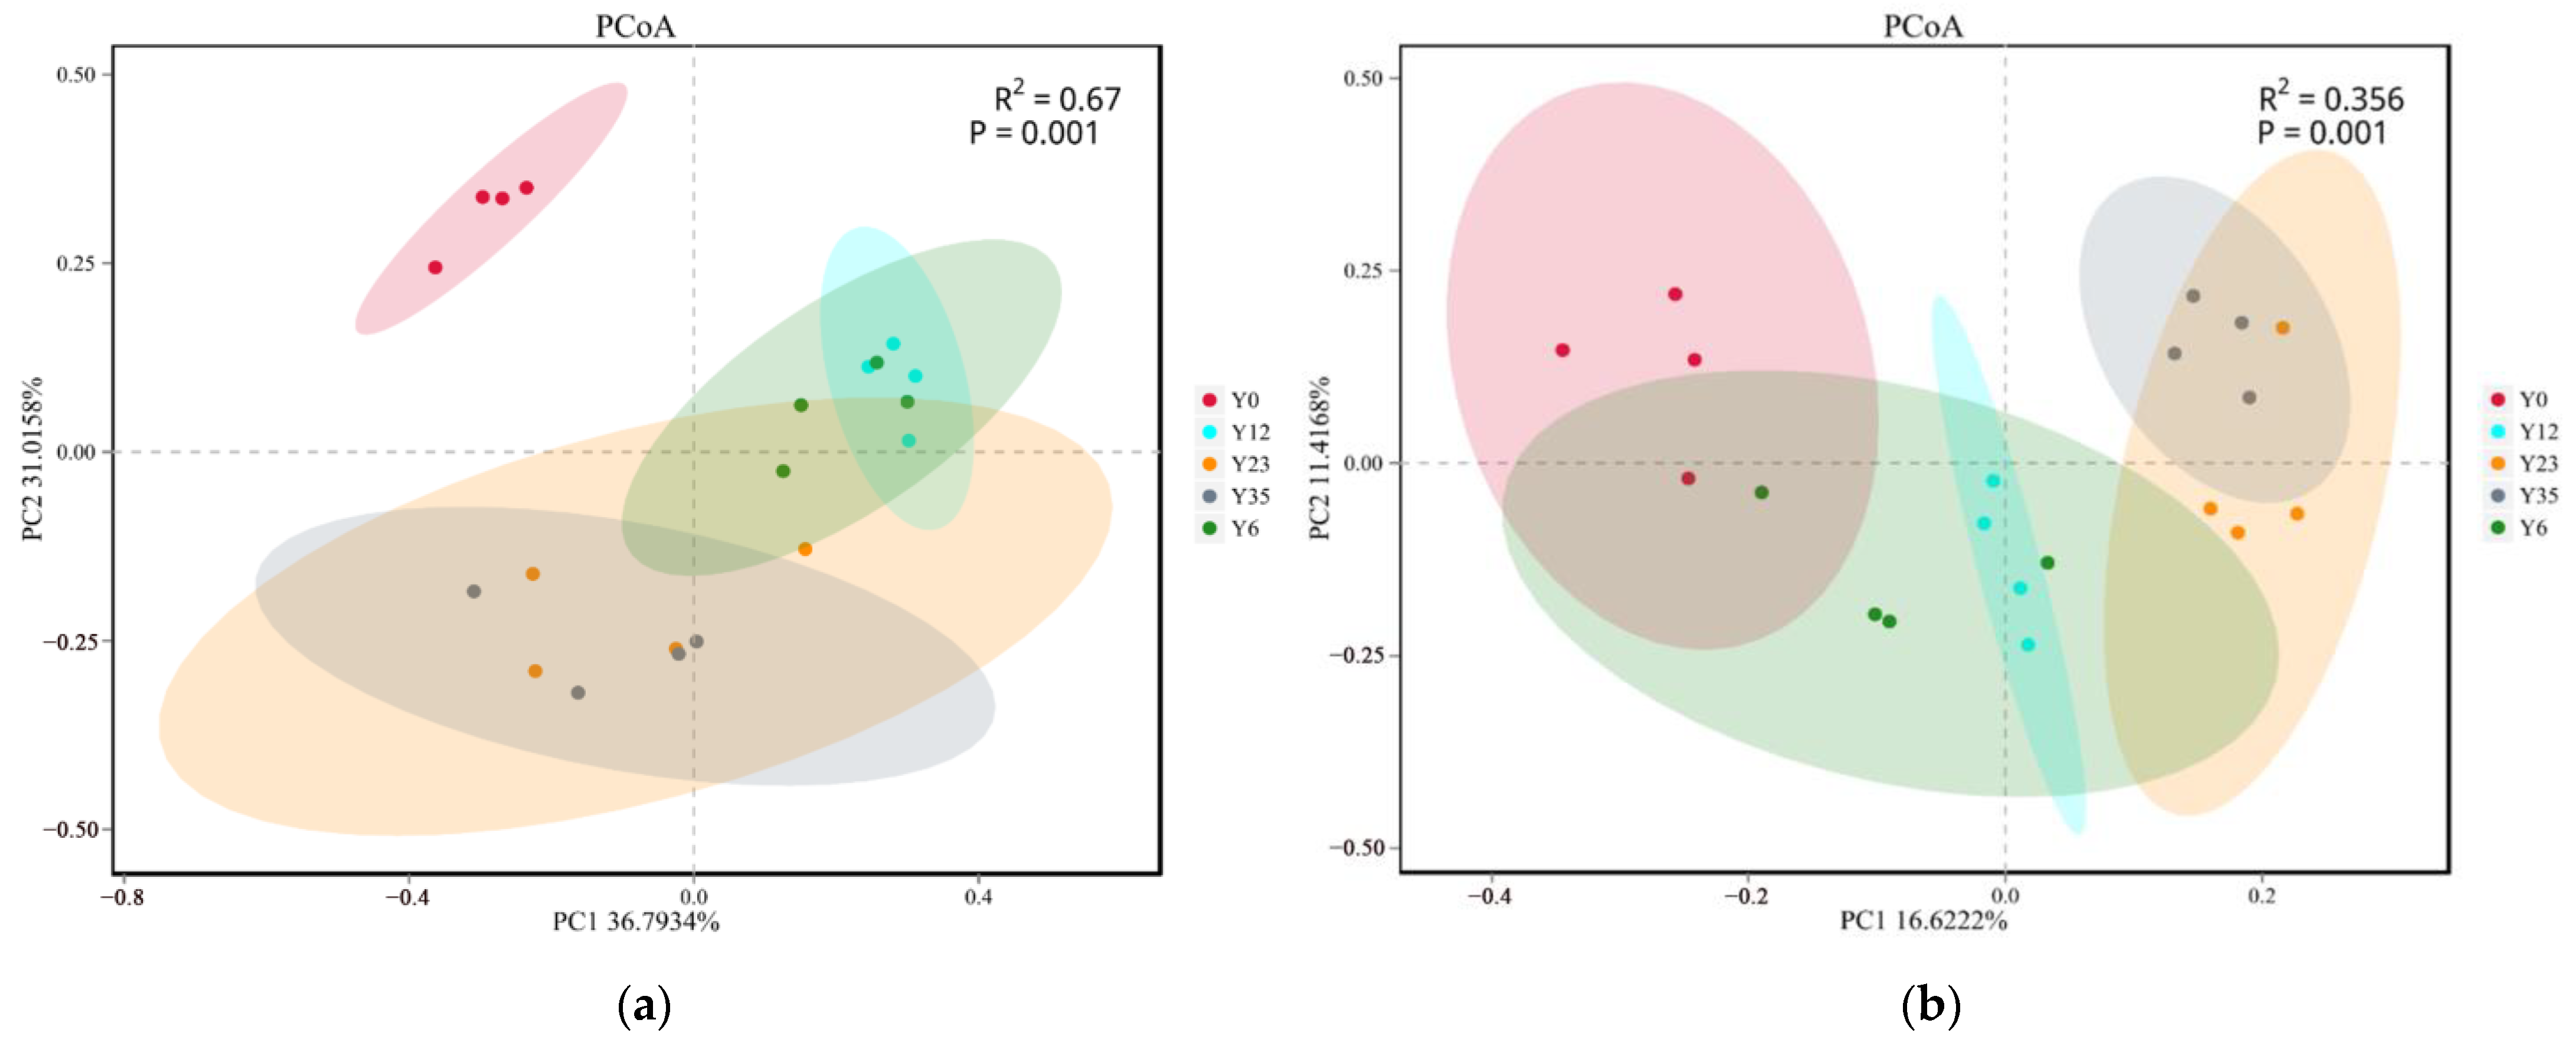
3.3. Structures of Soil Microbial Communities at Different Tea Planting Ages

The relative abundances of bacterial phyla were generally different among the different tea planting ages and woodlands (Figure 2a). There were 31 phyla in 20 soil samples. Proteobacteria (20.96%–41.40%), Acidobacteria (9.41%–28.34%), Firmicutes (6.39%–16.03%), Bacteroidetes (6.05%–13.80%), Chloroflexi (3.35%–13.27%) and Actinobacteria (2.37%–11.52%) were the dominant bacterial phyla, about 86.83%–93.61% of the total sequences (Figure 2a, Table S1). In addition, the relative abundances of GAL15, Verrucomicrobia, Rokubacteria, Planctomycetes, Gemmatimonadetes and WPS-2 in the tested soil were also higher than 1%. After tea planting, the relative abundances of Actinobacteria, Proteobacteria and WPS-2 were significantly increased (Figure S1a, p < 0.05); however, the relative abundances of Acidobacteria, GAL15 and Rokubacteria decreased (Figure S1b, p < 0.05). In addition, in tea plantations with different planting ages, the relative abundances of Proteobacteria, Actinobacteria, Firmicutes and Bacteroidetes first increased and then decreased, while those of Acidobacteria and Chloroflexi first decreased and then increased.
For soil fungi, Ascomycota (38.63%–55.27%), Basidiomycota (19.45%–39.13%), Mortierellomycota (1.8%–10.1%) and Rozellomycota (0.12%–7.41%) (Figure 2b, Table S2) were the dominate phyla among all samples, and there were no differences among the four phyla between tea plantations and woodland (Table S2). Although the relative abundances of the genera Glutinomyces, Hanseniaspora, Helvella, Hymenogaster, Neofabraea, Oidiodendron, Sebacina and Trigonopsis significantly decreased after tea planting, they were all detected at very low levels (<1%).
In order to further understand the microbial community differences across the different planting ages of the tea plantations and woodland, PCoA based on OTUs was conducted. The first two PCoA axes accounted for 67.81% and 28.04% of the variation in the bacterial and fungal communities, respectively (Figure 3). PERMANOVA demonstrated that the bacterial (R2 = 0.67, p = 0.001) and fungal (R2 = 0.356, p = 0.001) community compositions were significantly affected by the planting age. The bacterial communities in the woodland were obviously separated from those in tea plantation soil under different planting years, indicating that tea planting had a distinct effect on the soil bacterial community (Figure 3a). Nevertheless, for fungal communities, Y0 and Y6 were closer together (Figure 3b).

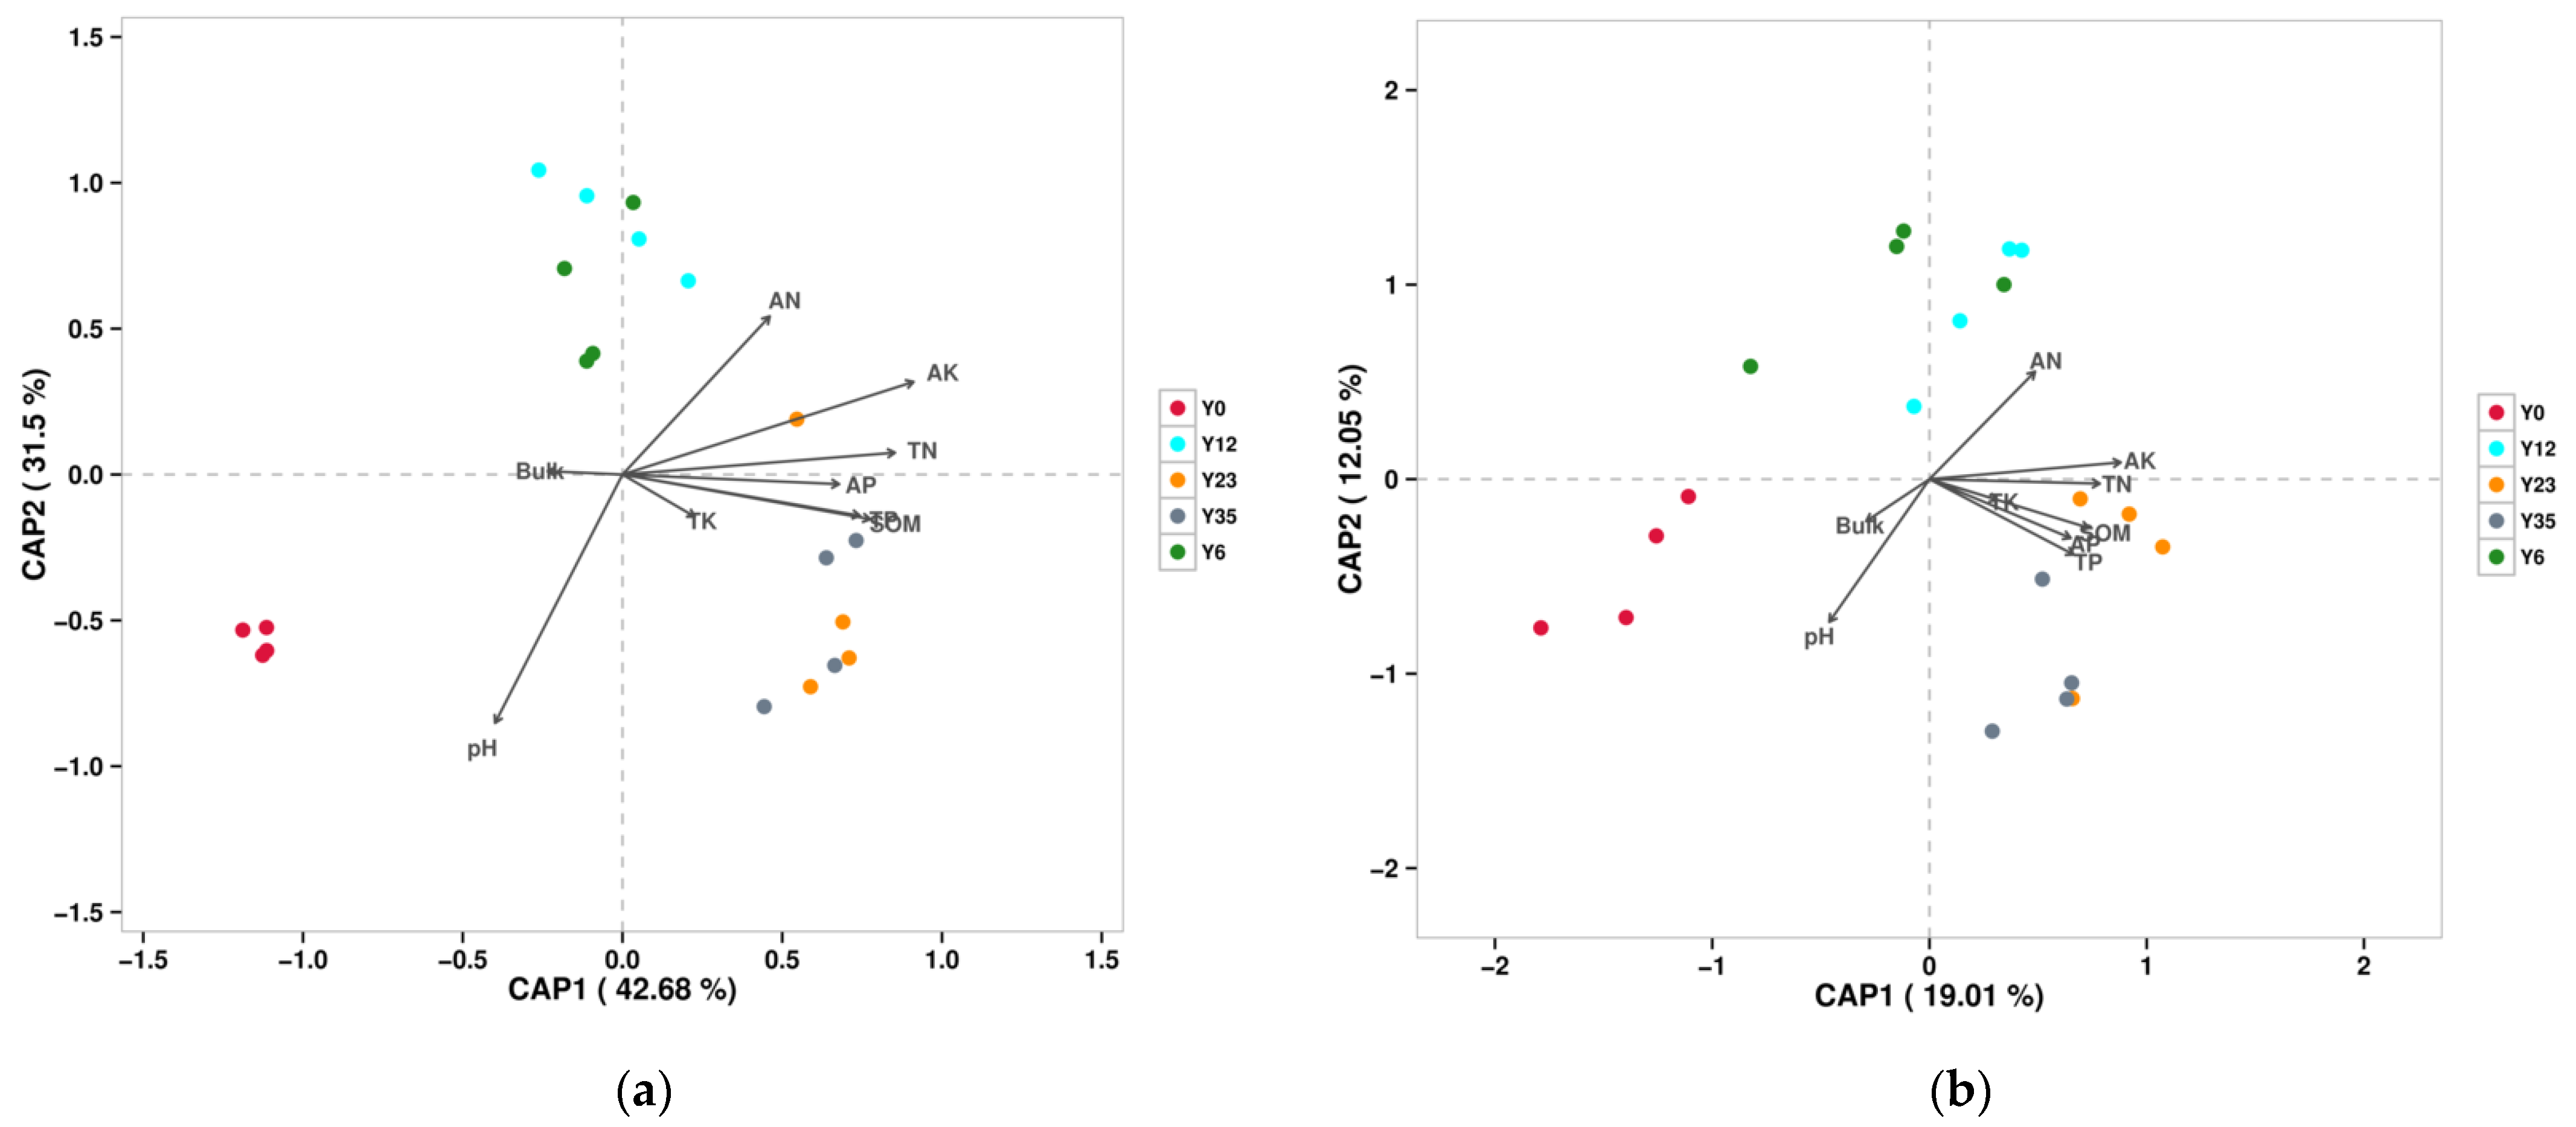
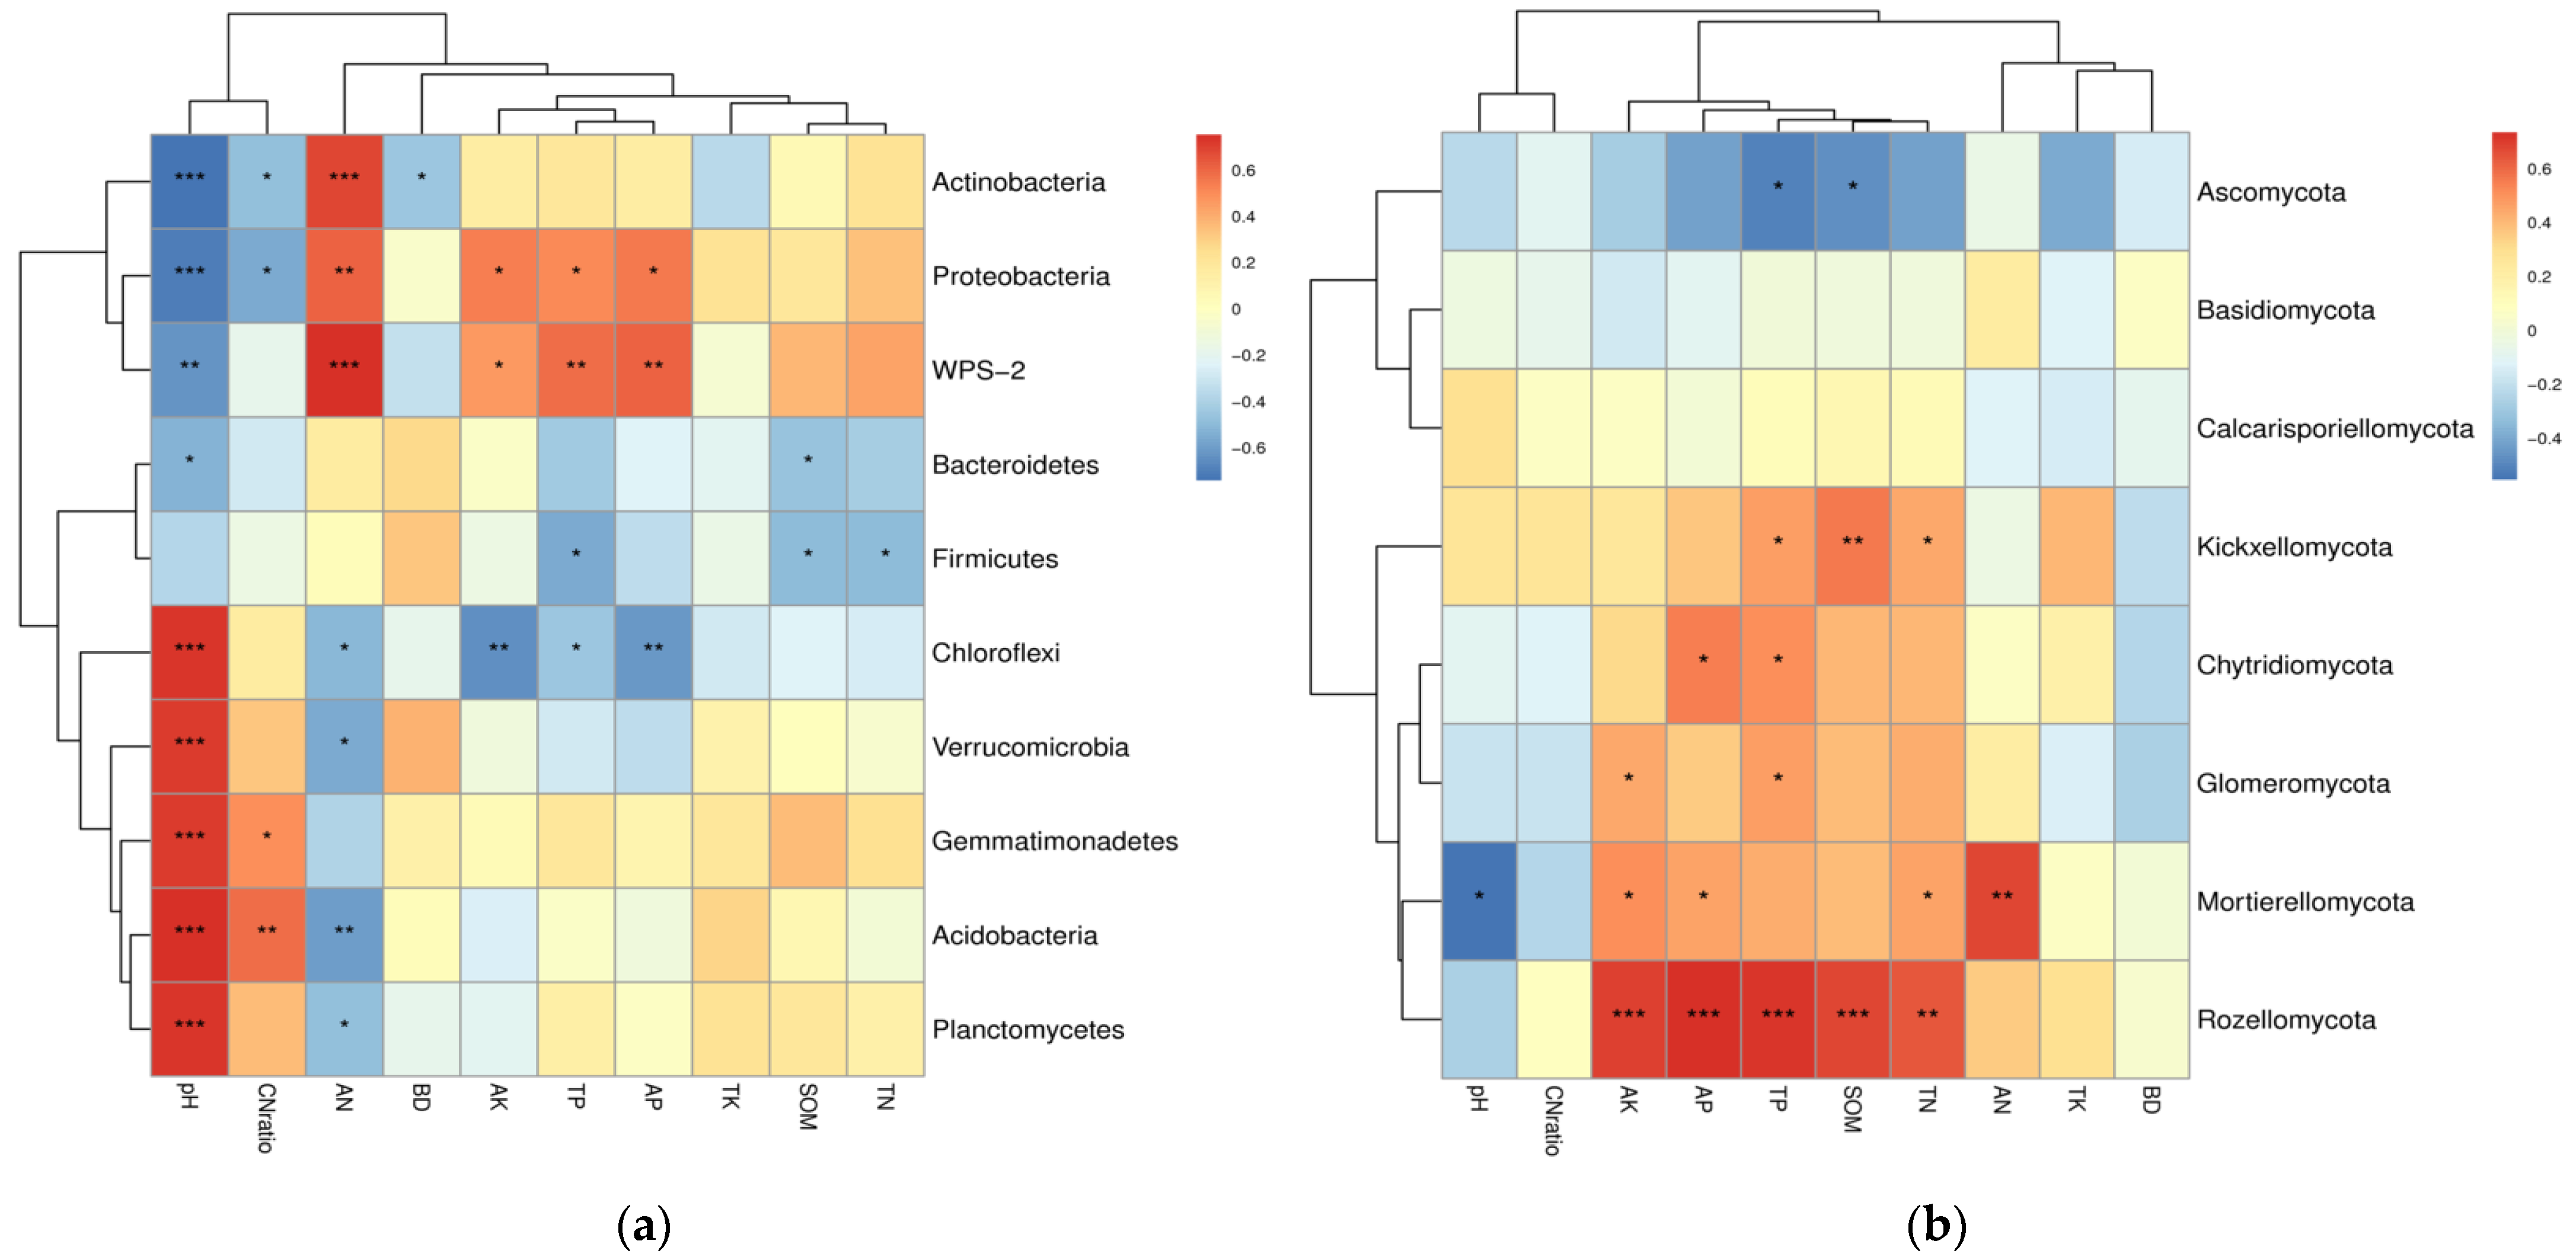
3.4. Correlations between Soil Microbial Community and Environmental Factors

There were close correlations between bacterial ACE, Chao1, Simpson, Shannon index and physicochemical factors (Table 3). Bacterial ACE and Chao1 index were positively correlated to SOM, TN and TP (p < 0.01 or 0.05); the Simpson and Shannon index positively correlated with pH (p < 0.01 or 0.05). However, although fungi ACE showed negative correlations with TN, TP and AK, the fungi Chao1, Simpson and Shannon index showed no significant correlations with physicochemical factors. The influences of soil physicochemical properties on bacterial and fungal communities were determined by db-RDA (Figure 4). The physicochemical variables explained 74.18% and 31.06% of the total variance in the bacterial and fungal community composition, respectively. Soil pH was the most dominant environmental variable explaining the total variation in bacterial and fungal structure.
Correlation analyses between the soil environmental factors and the microbial taxa are shown in Figure 5. The bacterial phyla Actinobacteria, Proteobacteria and WPS-2 were significantly and negatively correlated to the soil pH, while positively correlated to AN (Figure 5a). In contrast, Chloroflexi, Verrucomicrobia, Acidobacteria and Planctomycetes showed the opposite trend (Figure 5a). In addition, AK, AP and TP correlated negatively with Chloroflexi but positively with Proteobacteria and WPS-2. In the case of fungi, the most dominant phylum, Ascomycota, was negatively correlated with SOM and TP (Figure 5b); Mortierellomycota was significantly and positively correlated with AN, AP, AK and TN, but negatively correlated with soil pH (Figure 5b). In addition, soil nutrients (SOM, TN, TP, AP and AK) correlated positively with Rozellomycota (Figure 5b).

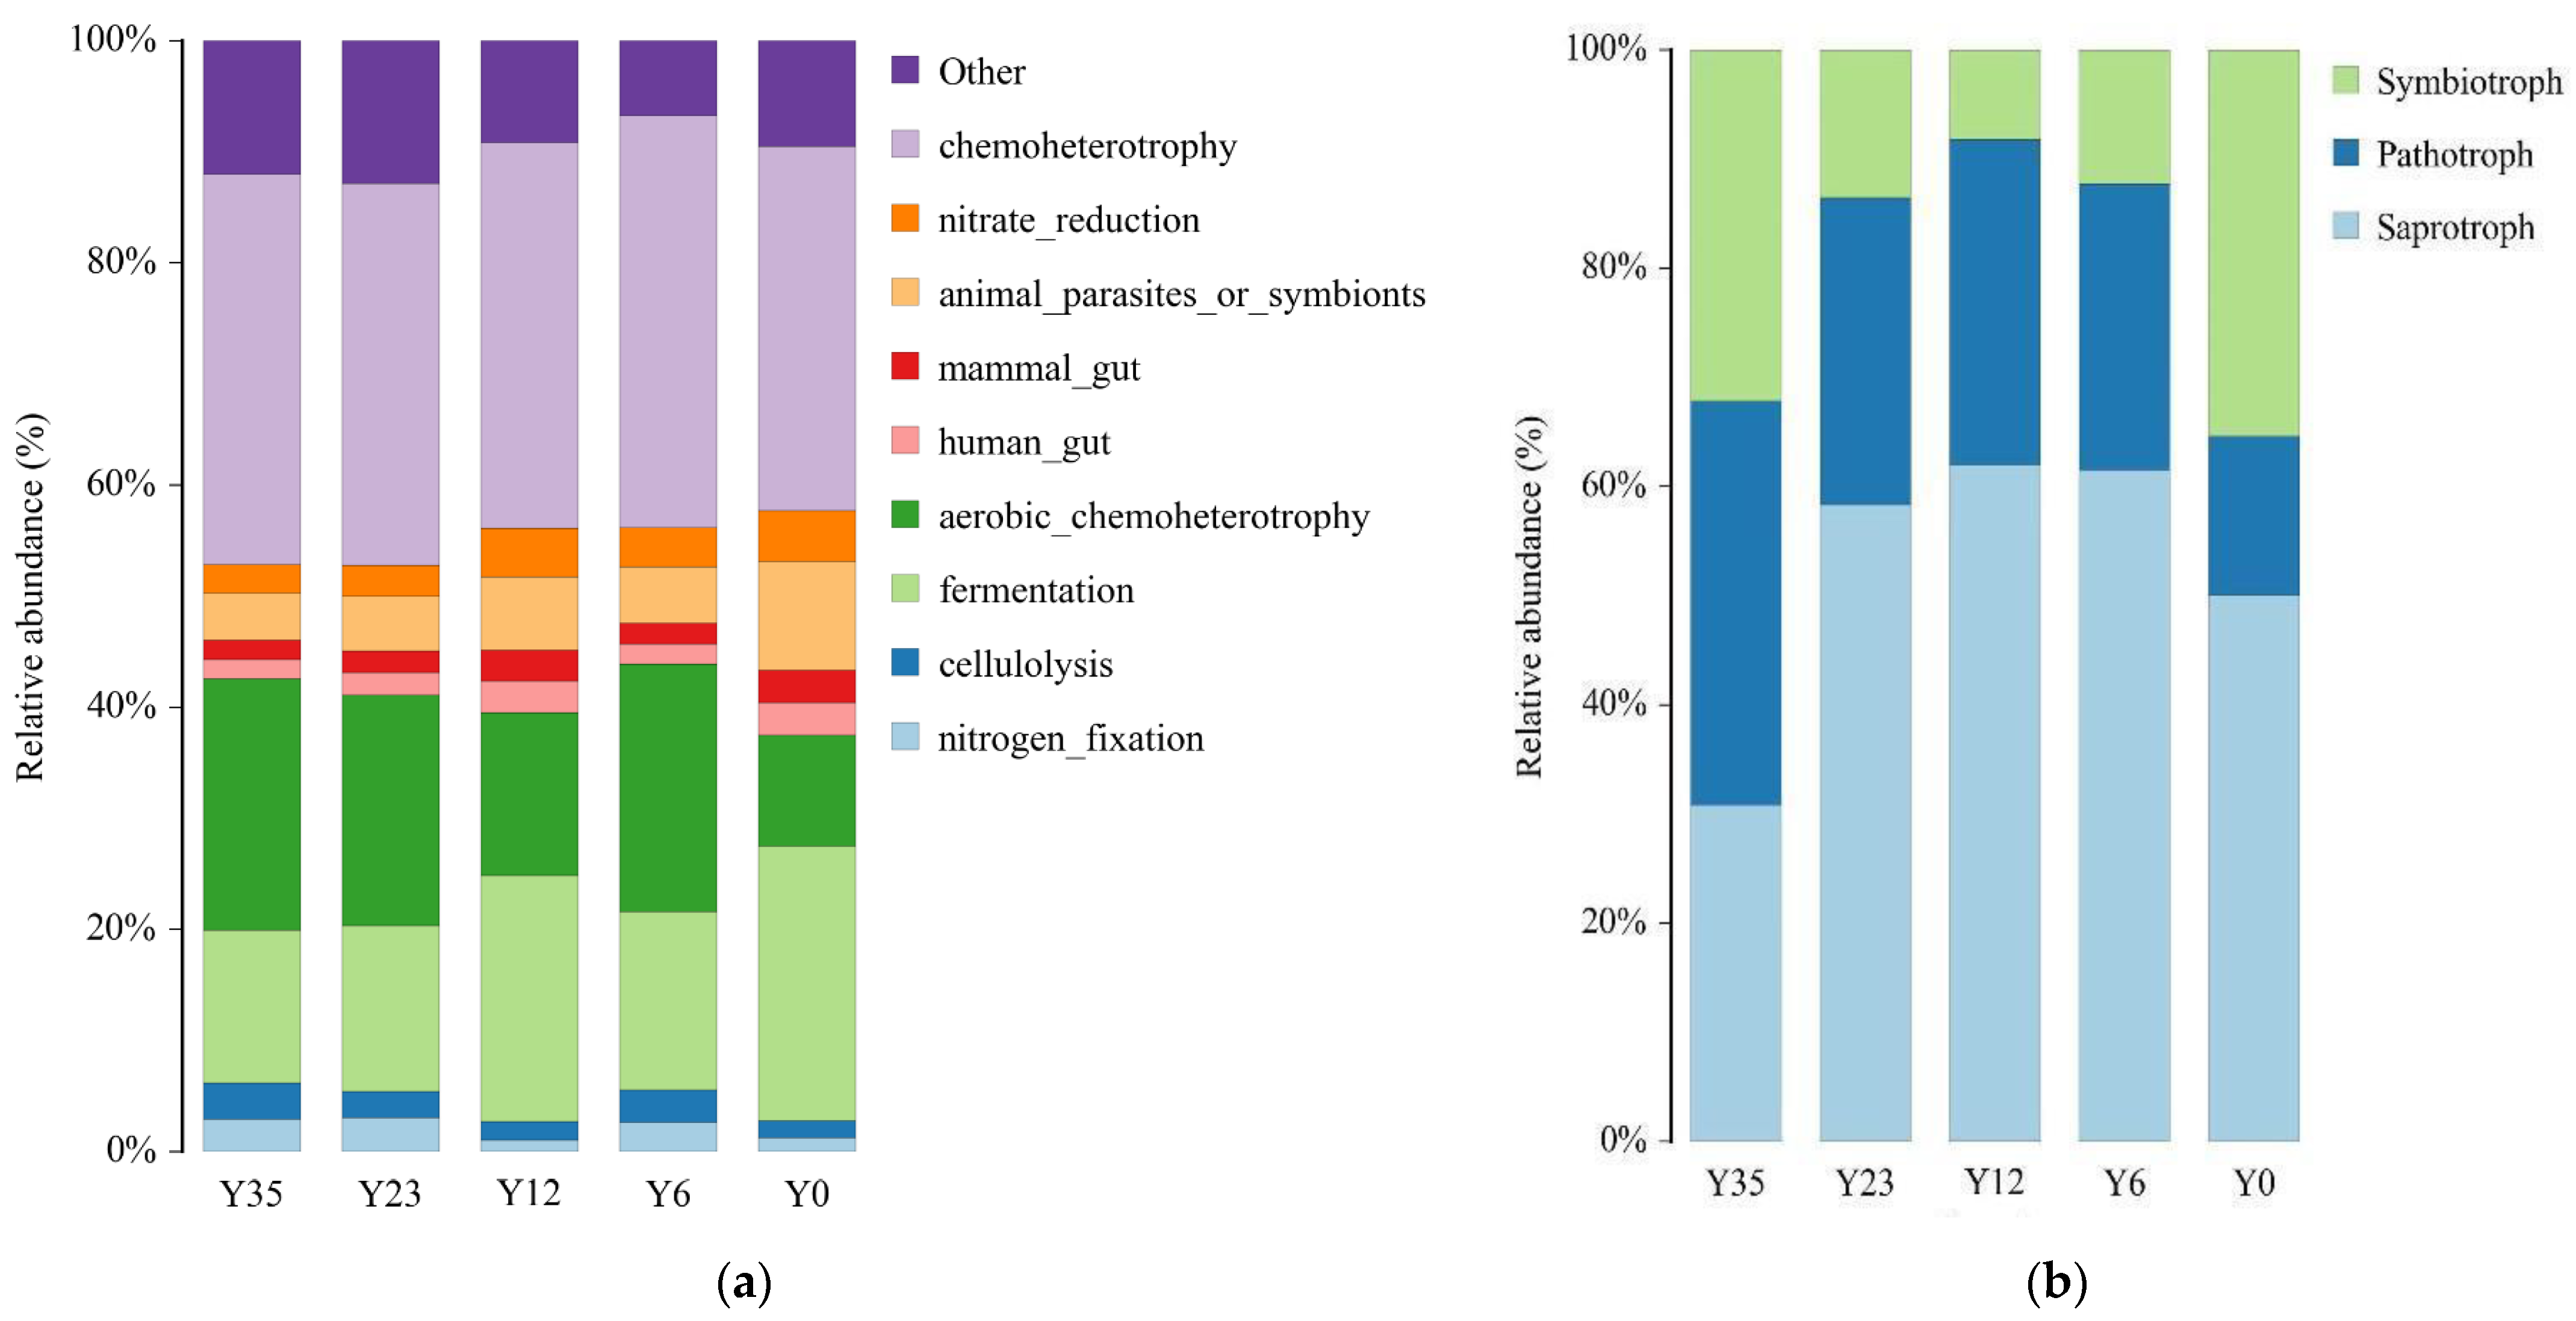
3.5. Microbial Function Potential

As shown in Figure 6a, soil bacterial function groups in the present study were highly enriched (>1%) in chemoheterotrophy (32.75%–37.04%); fermentation (13.75%–24.74%); aerobic_chemoheterotrophy (9.95%–22.69%); animal_parasites_or_symbionts (4.24%–9.82%); nitrate_reduction (2.59%–4.57%); human_gut (1.70%–2.93%); mammal_gut (1.70%–2.93%); cellulolysis (1.51%–3.22%); and nitrogen_fixation (1.08%–3.10%). Tea planting significantly increased the relative abundance of Aerobic_chemoheterotrophy, chemoheterotrophy and nitrogen_fixation by 101.96%, 7.85% and 90.06% compared with the adjacent woodland (Figure S2a). However, Nitrate_reduction, animal_parasites_or_symbionts and fermentation were significantly decreased in the tea plantations (about 27.39%, 47.02% and 32.39%, respectively) compared with the adjacent woodland (Figure S2a).
For fungi, all OTUs from 20 soil samples were identified as trophic modes with pathotrophs, symbiotrophs and saprotrophs (Figure 6b). Regarding the functional groups, saprotrophs were the most dominant trophic modes in the tea plantations and woodland, accounting for approximately 50% of all functions. The proportion of pathotrophs in tea plantations (30.26%) was obviously richer than in woodland (14.51%).

4. Discussion

4.1. Long-Term Tea Plantation Increased Soil Bacterial Richness and Diversity but Decreased Fungal Richness

The richness and diversity of soil microbial play an integral role in the maintenance of sustainable agricultural development [28]. Our results demonstrated that deforestation for tea plantations had a great impact on soil microbial diversity in southeastern China, but the effects on fungi and bacteria were completely different. The bacterial richness generally increased after long-term tea planting, but the fungal richness decreased. This phenomenon may be due to the long-term application of nitrogen fertilizer, which is more conducive to the multiplication of bacteria than fungi [29]. In addition, the strong positive relationships among various soil nutrient content (including soil SOM, TN and TP) with the ACE and Chao1 indices, further indicate that the increase in bacterial richness in tea garden soil can be attributed to the improvement of soil fertility after planting. However, no significant correlations were detected for the Chao1, Shannon and Simpson indices of fungi, implying that soil bacterial richness and diversity responded more sensitively to environmental changes than fungi. Additionally, numerous studies have proved that soil pH is a prevailing determinant of soil bacterial diversity in many ecosystems [29,30]. In the present study, there was a strong positive correlation between soil pH and bacterial diversity index (Shannon and Simpson), but not with the fungal diversity, which further showed that bacteria were more sensitive to soil environmental changes than fungi in tea plantations.

4.2. Different Tea Planting Ages Shift the Soil Microbial Community Structure

Similar to a previous research study [31], the transition from forest ecosystems to economic plantations significantly affected the construction of soil microbial communities. Planting management measures (such as fertilization and irrigation) have an important influence on soil environmental indices, which may directly or indirectly influence soil microbial communities [32]. In this paper, the PCoA demonstrated that for both bacteria and fungi, four soil samples with the same tea planting age were aggregated, whereas the soil samples with different cultivation years were dispersed. It was confirmed that the composition of the soil microbial community changed significantly with the extension of tea planting. However, the fungal communities of Y0 and Y6 were closer than those of bacteria, indicating more sensitive responses of soil bacteria to tea planting.
Long-term typical tea plantation management practices (including fertilization and leaf and root litter) could change the soil nutritional status from oligotrophic to copiotrophic conditions, and then change the associated soil bacterial community structure. Similar to the study reported by Nie et al. [33] that proposed that copiotrophic microorganisms, including for example, Actinobacteria and Proteobacteria, generally increase under nutrient-rich conditions, while oligotrophic taxa, like Acidobacteria, show the opposite trend. Furthermore, RDA demonstrated that pH was the most important environmental variable driving the temporal and spatial distribution of bacteria in this paper, which is in line with previous studies [30,34]. However, we found a positive relationship between soil pH and Acidobacteria in this study, which contradicts most previous results [35], which may contribute to the inconsistent response of different Acidobacteria subgroups to changes in soil pH [36]. In summary, due to significant changes in soil nutrients and pH values over time, the bacterial community was strongly influenced by the age of the tea garden.
In terms of fungal community, Ascomycota and Basidiomycota were generally considered to be the most dominant phyla in the tea plantations [16], which is consistent with the present study. However, significantly different phyla were not found among different aged tea plantations and woodlands. This may suggest that, compared with the soil bacterial community, the soil fungal community is more resistant to tea planting. The RDA analysis indicated that pH, SOM, TN and AK were the dominant environmental variables affecting the fungal communities, which confirmed the results of Ji et al. [37] and Nie et al. [33], who found that the soil fungal community was mainly affected by nutrient availability. Similar to the results presented by Yang et al. [16] and Bai et al. [38], the relative abundance of Rozellomycota was increased with the improvement of soil nutrients (SOM, TN, TP, AP and AK) in this study. It has been reported that most taxa belonging to Rozellomycota prefer to consume organic fragments [39], so these taxa increased in the tea plantations, especially after 23 years.

4.3. Potential Microbial Functional Variations Influenced by Tea Planting

Woodland conversion to tea plantations not only influenced the soil microbial community structure but also formed a distinct functional group. Changes in the microbial community structure can reflect shifts in the community function. FAPROTAX and FUNGuild did give some useful information that could be used to explore the impacts of the application of inorganic fertilizer on microbial community functions. Due to the application of urea and organic fertilizer in the process of tea plantation management, the functional groups involved in aerobic chemoheterotrophy, chemoheterotrophy and ureolysis in the tea plantation were significantly increased compared with adjacent woodland. which is consistent with prior research on Eucalyptus plantations [14]. These functions were beneficial for the transformation of SOM in tea garden soil. The decomposition and transformation of SOM can increase nutrient supply and improve soil physical, chemical, and biochemical characteristics, thereby providing nutrients for crops and creating a favorable soil environment [40]. In addition, it is generally considered that transformation from natural forests to tillable fields would significantly stimulate autotrophic nitrification due to the application of chemical nitrogen fertilizers [5]. However, in this study, the bacteria nitrification function group (involving nitrification, aerobic_ammonia_oxidation and aerobic_nitrite_oxidation) decreased significantly in the young tea plantations (Y6 and Y12) but increased significantly in the middle-aged tea plantations (Y23 and Y35), showing the order of Y35 > Y23 > Y0 > Y12 > Y6. This may be because ammonia-oxidizing bacteria are inhibited under strong acidic conditions [41]. After 23 years, with the increase in the soil pH, the bacterial community involved in nitrification increased significantly.
Another interesting change in the fungal function groups was the significant increase in the pathogenic fungi in the tea plantations, which confirmed the previous study that showed that tea planting decreased the relative abundance of saprotrophs, whereas it increased the relative abundance of pathogenic and pathotrophic–saprotrophic fungi [42]. Generally, the potential fungal pathogens are thought to cause disease or have a negative effect on plant growth by attacking host cells for nutrients [43]. The results above indicated that under the existing tea plantation management mode, cleaning the tea garden and long-term applying chemical fertilizers only, may cause the overgrowth of pathogenic fungi, which is in line with a previous study that found that long-term crop monoculture may lead to borne diseases [1]. Furthermore, the richness of soil fungi (ACE index) significantly decreased after forest land reclamation into tea gardens, indicating that continuous monoculture may have a far-reaching negative impact on the fungal community structure and further affect the ecosystem of a tea plantation.

5. Conclusions

In conclusion, this study indicated that the conversion of natural woodlands to tea plantations had a significant effect on soil microbial diversity, community structure and their potential functions. Specifically, the tea plantations significantly increased the richness of bacteria and the diversity show a trend of initially decreasing and then increasing the richness of fungi decreased after tea planting; however, this had no effect on fungal diversity. Tea planting markedly improved the nutrient status of the soil, and with the increase in soil nutrient content, the abundance of Proteobacteria and Actinobacteria increased significantly, but that of Acidobacteria decreased. However, significantly different fungal phyla were not found among different aged tea plantations and the woodland. Thus, soil bacteria were more sensitive to tea planting than fungi. The functional predictions based on FAPROTAX and FUNGuild revealed that the relative abundances of the aerobic_chemoheterotrophy, chemoheterotrophy, ureolysis and pathogenic fungi were significantly richer in the tea plantations compared with woodland. The present study provides useful insights into the composition and potential functions of microbial communities after the conversion of woodlands to tea plantations.

Supplementary Materials

The following supporting information can be downloaded at: https://www.mdpi.com/article/10.3390/f14071288/s1. Table S1: Relative abundance of the most abundant bacterial phyla (>1%) present in the different planting ages tea plantations; Table S2: Relative abundance of the most abundant fungal phyla (>1%) present in the different planting ages tea plantations; Table S3: Bacterial function group (Top10) present in the different planting ages tea plantations; Table S4: Fungal function group present in the different planting ages tea plantations; Figure S1: Analysis of variance analyses (ANOVA) showing the differential distribution of soil bacterial (a) and fungal (b) community between tea plantations and wood land; Figure S2: Statistically significant differences in the bacterial(a) and fungal(b) function group between tea plantations and wood land.

Author Contributions

Conceptualization, X.Z. and Y.Z.; data curation, X.Z.; formal analysis, C.L.; funding acquisition, Y.Z.; investigation, Y.W. and C.L.; methodology, X.Z.; project administration, Y.Z.; software, X.Z.; supervision, Y.Z.; validation, Y.W.; visualization, X.Z. and A.X.; writing—original draft, X.Z.; writing—review and editing, H.W., J.Y. and H.D. All authors have read and agreed to the published version of the manuscript.

Funding

This research was funded by the following project: the National Natural Science Foundation of China (41907077) and Fujian province (2022J01464, 2023J01194), the special research projects of Fujian Public Welfare Research Institute (2021R1025001, 2019R1025-3) and the Foundation of Fujian Academic of Agricultural Sciences (CXPT202106, CXTD2021012-2 and XTCXGC2021009).

Data Availability Statement

Data will be made available on request.

Acknowledgments

We acknowledge Jianrong Qiu for the laboratory assistance.

Conflicts of Interest

The authors declare no conflict of interest.

References

  1. Arafat, Y.; Ud Din, I.; Tayyab, M.; Jiang, Y.; Chen, T.; Cai, Z.; Zhao, H.; Lin, X.; Lin, W.; Lin, S. Soil Sickness in Aged Tea Plantation Is Associated With a Shift in Microbial Communities as a Result of Plant Polyphenol Accumulation in the Tea Gardens. Front. Plant Sci. 2020, 11, 601. [Google Scholar] [CrossRef] [PubMed]
  2. Wang, S.; Yao, X.; Ye, S. Soil Aggregate-Related Organic Carbon and Relevant Enzyme Activities as Affected by Tea (Camellia Sinensis L.) Planting Age in Hilly Region of Southern Guangxi, China. Appl. Soil Ecol. 2020, 150, 103444. [Google Scholar] [CrossRef]
  3. Sidle, R.C.; Ziegler, A.D.; Negishi, J.N.; Nik, A.R.; Siew, R.; Turkelboom, F. Erosion Processes in Steep Terrain—Truths, Myths, and Uncertainties Related to Forest Management in Southeast Asia. For. Ecol. Manage. 2006, 224, 199–225. [Google Scholar] [CrossRef]
  4. Zhang, Y.; Zhang, J.; Zhu, T.; Müller, C.; Cai, Z. ScienceDirect Effect of Orchard Age on Soil Nitrogen Transformation in Subtropical China and Implications. J. Environ. Sci. 2015, 34, 10–19. [Google Scholar] [CrossRef]
  5. Zhang, Y.; Zhang, J.; Chapman, S.J.; Yao, H.; Zheng, N.; Müller, C. Tea Plantation Affects Soil Nitrogen Transformations in Subtropical China. J. Soils Sediments 2021, 21, 441–451. [Google Scholar] [CrossRef]
  6. Kamaa, M.; Mburu, H.; Blanchart, E.; Chibole, L.; Chotte, J.-L.; Kibunja, C.; Lesueur, D. Effects of Organic and Inorganic Fertilization on Soil Bacterial and Fungal Microbial Diversity in the Kabete Long-Term Trial, Kenya. Biol. Fertil. Soils 2011, 47, 315–321. [Google Scholar] [CrossRef]
  7. Chen, Y.; Deng, Y.; Ding, J.; Hu, H.; Xu, T.; Li, F.; Yang, G.; Yang, Y. Distinct Microbial Communities in the Active and Permafrost Layers on the Tibetan Plateau. Mol. Ecol. 2017, 26, 6608–6620. [Google Scholar] [CrossRef]
  8. Wu, X.; Xu, H.; Tuo, D.; Wang, C.; Fu, B.; Lv, Y.; Liu, G. Land Use Change and Stand Age Regulate Soil Respiration by Influencing Soil Substrate Supply and Microbial Community. Geoderma 2020, 359, 113991. [Google Scholar] [CrossRef]
  9. Fierer, N.; Bradford, M.A.; Jackson, R.B. Toward an Ecological Classification of Soil Bacteria. Ecology 2007, 88, 1354–1364. [Google Scholar] [CrossRef]
  10. Sun, L.; Xun, W.; Huang, T.; Zhang, G.; Gao, J.; Ran, W.; Li, D.; Shen, Q.; Zhang, R. Alteration of the Soil Bacterial Community during Parent Material Maturation Driven by Different Fertilization Treatments. Soil Biol. Biochem. 2016, 96, 207–215. [Google Scholar] [CrossRef]
  11. Du, C.; Xu, C.; Jian, J.; He, W.; Hou, L.; Geng, Z. Seasonal Dynamics of Bacterial Communities in a Betula Albosinensis Forest. Eur. J. Soil Sci. 2018, 69, 666–674. [Google Scholar] [CrossRef]
  12. Xu, Y.; Du, A.; Wang, Z.; Zhu, W.; Li, C.; Wu, L. Effects of Different Rotation Periods of Eucalyptus Plantations on Soil Physiochemical Properties, Enzyme Activities, Microbial Biomass and Microbial Community Structure and Diversity. For. Ecol. Manage. 2020, 456, 117683. [Google Scholar] [CrossRef]
  13. Liu, D.; Huang, Y.; Sun, H.; An, S. The Restoration Age of Robinia Pseudoacacia Plantation Impacts Soil Microbial Biomass and Microbial Community Structure in the Loess Plateau. Catena 2018, 165, 192–200. [Google Scholar] [CrossRef]
  14. Qu, Z.; Liu, B.; Ma, Y.; Sun, H. Differences in Bacterial Community Structure and Potential Functions among Eucalyptus Plantations with Different Ages and Species of Trees. Appl. Soil Ecol. 2020, 149, 103515. [Google Scholar] [CrossRef]
  15. Dang, P.; Yu, X.; Le, H.; Liu, J.; Shen, Z.; Zhao, Z. Effects of Stand Age and Soil Properties on Soil Bacterial and Fungal Community Composition in Chinese Pine Plantations on the Loess Plateau. PLoS ONE 2017, 12, e0186501. [Google Scholar] [CrossRef] [PubMed] [Green Version]
  16. Yang, W.; Li, C.; Wang, S.; Zhou, B.; Mao, Y.; Rensing, C.; Xing, S. Influence of Biochar and Biochar-Based Fertilizer on Yield, Quality of Tea and Microbial Community in an Acid Tea Orchard Soil. Appl. Soil Ecol. 2021, 166, 104005. [Google Scholar] [CrossRef]
  17. Ni, K.; Liao, W.; Yi, X.; Niu, S.; Ma, L.; Shi, Y.; Zhang, Q.; Liu, M.; Ruan, J. Fertilization Status and Reduction Potential in Tea Gardens of China. J. Plant Nutr. Fer. 2019, 25, 421–432. [Google Scholar]
  18. Sae-Lee, N.; Kerdchoechuen, O.; Laohakunjit, N. Chemical Qualities and Phenolic Compounds of Assam Tea after Soil Drench Application of Selenium and Aluminium. Plant Soil 2012, 356, 381–393. [Google Scholar] [CrossRef]
  19. Wang, S.; Li, T.; Zheng, Z. Distribution of Microbial Biomass and Activity within Soil Aggregates as Affected by Tea Plantation Age. Catena 2017, 153, 1–8. [Google Scholar] [CrossRef]
  20. Bai, Y.; Zha, X.; Chen, S. Effects of the Vegetation Restoration Years on Soil Microbial Community Composition and Biomass in Degraded Lands in Changting County, China. J. For. Res. 2019, 31, 1295–1308. [Google Scholar] [CrossRef]
  21. Nelson, D.W.; Sommers, L. Total carbon, organic carbon, and organic matter. In Methods of Soil Analysis: Part 2 Chemical and Microbiological Properties; Wiley Online Library: Hoboken, NJ, USA, 1983; Volume 9, pp. 539–579. [Google Scholar]
  22. Lu, R.K. Soil Agricultural Chemical Analysis Methods; China Agricultural Science and Technology: Beijing, China, 2000; pp. 154–196. [Google Scholar]
  23. Huse, S.M.; Dethlefsen, L.; Huber, J.A.; Welch, D.M.; Relman, D.A.; Sogin, M.L. Exploring Microbial Diversity and Taxonomy Using SSU RRNA Hypervariable Tag Sequencing. PLoS Genet. 2008, 4, e1000255. [Google Scholar] [CrossRef]
  24. Gardes, M.; Bruns, T.D. ITS Primers with Enhanced Specificity for Basidiomycetes-application to the Identification of Mycorrhizae and Rusts. Mol. Ecol. 1993, 2, 113–118. [Google Scholar] [CrossRef]
  25. Edgar, R.C. Search and Clustering Orders of Magnitude Faster than BLAST. Bioinformatics 2010, 26, 2460–2461. [Google Scholar] [CrossRef] [Green Version]
  26. Louca, S.; Parfrey, L.W.; Doebeli, M. Decoupling Function and Taxonomy in the Global Ocean Microbiome. Science 2016, 353, 1272–1277. [Google Scholar] [CrossRef]
  27. Nguyen, N.H.; Song, Z.; Bates, S.T.; Branco, S.; Tedersoo, L.; Menke, J.; Schilling, J.S.; Kennedy, P.G. FUNGuild: An Open Annotation Tool for Parsing Fungal Community Datasets by Ecological Guild. Fungal Ecol. 2016, 20, 241–248. [Google Scholar] [CrossRef]
  28. Wang, S.; Li, T.; Zheng, Z.; Chen, H.Y.H. Soil Aggregate-Associated Bacterial Metabolic Activity and Community Structure in Different Aged Tea Plantations. Sci. Total Environ. 2019, 654, 1023–1032. [Google Scholar] [CrossRef] [PubMed]
  29. Rousk, J.; Bååth, E.; Brookes, P.C.; Lauber, C.L.; Lozupone, C.; Caporaso, J.G.; Knight, R.; Fierer, N. Soil Bacterial and Fungal Communities across a PH Gradient in an Arable Soil. ISME J. 2010, 4, 1340–1351. [Google Scholar] [CrossRef] [PubMed]
  30. Zheng, X.; Yan, M.; Lin, C.; Guo, B.; Ding, H.; Yu, J.; Peng, S.; Sveen, T.R.; Zhang, Y. Vegetation Restoration Types Affect Soil Bacterial Community Composition and Diversity in Degraded Lands in Subtropical of China. Restor. Ecol. 2022, 30, e13494. [Google Scholar] [CrossRef]
  31. De Gannes, V.; Bekele, I.; Dipchansingh, D.; Wuddivira, M.N.; De Cairies, S.; Boman, M.; Hickey, W.J. Microbial Community Structure and Function of Soil Following Ecosystem Conversion from Native Forests to Teak Plantation Forests. Front. Microbiol. 2016, 7, 1976. [Google Scholar] [CrossRef] [Green Version]
  32. Yu, Y.; Shen, W.; Yin, Y.; Zhang, J.; Cai, Z.; Zhong, W. Response of Soil Microbial Diversity to Land-Use Conversion of Natural Forests to Plantations in a Subtropical Mountainous Area of Southern China. Soil Sci. Plant Nutr. 2012, 58, 450–461. [Google Scholar] [CrossRef]
  33. Nie, S.; Lei, X.; Zhao, L.; Brookes, P.C.; Wang, F.; Chen, C.; Yang, W.; Xing, S. Fungal Communities and Functions Response to Long-Term Fertilization in Paddy Soils. Appl. Soil Ecol. 2018, 130, 251–258. [Google Scholar] [CrossRef]
  34. Husson, O. Redox Potential (Eh) and PH as Drivers of Soil/Plant/Microorganism Systems: A Transdisciplinary Overview Pointing to Integrative Opportunities for Agronomy. Plant Soil 2013, 362, 389–417. [Google Scholar] [CrossRef] [Green Version]
  35. Griffiths, R.I.; Thomson, B.C.; James, P.; Bell, T.; Bailey, M.J.; Whiteley, A.S. The Bacterial Biogeography of British Soils. Environ. Microbiol. 2011, 13, 1642–1654. [Google Scholar] [CrossRef] [PubMed]
  36. Liu, J.; Sui, Y.; Yu, Z.; Shi, Y.U.; Chu, H.; Jin, J.; Liu, X.; Wang, G. High Throughput Sequencing Analysis of Biogeographical Distribution of Bacterial Communities in the Black Soils of Northeast China. Soil Biol. Biochem. 2014, 70, 113–122. [Google Scholar] [CrossRef]
  37. Ji, L.; Ni, K.; Wu, Z.; Zhang, J.; Yi, X.; Yang, X.; Ling, N.; You, Z.; Guo, S.; Ruan, J. Effect of Organic Substitution Rates on Soil Quality and Fungal Community Composition in a Tea Plantation with Long-Term Fertilization. Biol. Fertil. Soils 2020, 56, 633–646. [Google Scholar] [CrossRef]
  38. Bai, Z.; Wu, X.; Lin, J.-J.; Xie, H.-T.; Yuan, H.-S.; Liang, C. Litter-, Soil-and C: N-Stoichiometry-Associated Shifts in Fungal Communities along a Subtropical Forest Succession. Catena 2019, 178, 350–358. [Google Scholar] [CrossRef]
  39. Tedersoo, L.; Bahram, M.; Puusepp, R.; Nilsson, R.H.; James, T.Y. Novel Soil-Inhabiting Clades Fill Gaps in the Fungal Tree of Life. Microbiome 2017, 5, 42. [Google Scholar] [CrossRef] [Green Version]
  40. Zhao, S.; Li, K.; Zhou, W.; Qiu, S.; Huang, S.; He, P. Changes in Soil Microbial Community, Enzyme Activities and Organic Matter Fractions under Long-Term Straw Return in North-Central China. Agric. Ecosyst. Environ. 2016, 216, 82–88. [Google Scholar] [CrossRef]
  41. Zhang, J.B.; Zhu, T.B.; Cai, Z.C.; Qin, S.W.; Müller, C. Effects of Long-term Repeated Mineral and Organic Fertilizer Applications on Soil Nitrogen Transformations. Eur. J. Soil Sci. 2012, 63, 75–85. [Google Scholar] [CrossRef]
  42. Wang, F.; Chen, Y.; Yu, X.; Yu, W.; You, Z.; Yang, Z. Response of the Soil Fungal Community and Its Function during the Conversion of Forestland to Tea Plantations: A Case Study in Southeast China. Forests 2023, 14, 209. [Google Scholar] [CrossRef]
  43. Guo, X.; Yang, Y.; Niu, Z.; Lu, D.P.; Zhu, C.; Feng, J.; Wu, J.; Chen, Y.; Tou, F.; Liu, M.; et al. Characteristics of Microbial Community Indicate Anthropogenic Impact on the Sediments along the Yangtze Estuary and Its Coastal Area, China. Sci. Total Environ. 2019, 648, 306–314. [Google Scholar] [CrossRef] [PubMed]
Figure 1. Study site.
Forests 14 01288 g001
Figure 2. Relative abundance of the bacterial (a) and fungal (b) community at the phylum level (>1%) in the different stages of tea plantation. Y0 represents woodland; Y6, Y12, Y23 and Y35 represent tea planting for 6, 12, 23 and 35 years.
Forests 14 01288 g002
Figure 3. Principle coordinates analysis (PCoA) of bacterial (a) and fungal (b) based on operational taxonomic units. Y0 represents woodland; Y6, Y12, Y23 and Y35 represent tea planting for 6, 12, 23 and 35 years.
Forests 14 01288 g003
Figure 4. Distance-based redundancy analysis (db-RDA) of soil bacterial (a) and fungal (b) community structure and soil properties. pH: soil pH value; SOM: soil organic matter; TN: soil total nitrogen; TP: soil total phosphorus; TK: soil total potassium; AN: soil available nitrogen; AP: available phosphorus; and AK: available potassium.
Forests 14 01288 g004
Figure 5. Relationships between soil properties and bacterial dominant bacterial (a) and fungal (b) taxa (n = 20). * indicates significance at p < 0.05, ** indicates significance at p < 0.01, *** indicates significance at p < 0.001. pH: soil pH value; SOM: soil organic matter; TN: soil total nitrogen; TP: soil total phosphorus; TK: soil total potassium; AN: soil available nitrogen; AP: available phosphorus; AK: available potassium; BD: bulk density; and CNratio: SOC/TN.
Forests 14 01288 g005
Figure 6. Relative abundances of soil bacterial (top 10) (a) and fungal (b) functional groups in the different stages of tea plantation. Y0 represents woodland; Y6, Y12, Y23 and Y35 represent tea planting for 6, 12, 23 and 35 years.
Forests 14 01288 g006
Table 1. Soil properties across different plantation ages 1.
Soil PropertiesY0 2Y6Y12Y23Y35
pH 35.0 ± 0.22 4,a3.84 ± 0.16 c3.63 ± 0.2 c4.46 ± 0.16 b4.25 ± 0.34 b
SOM (g kg−1)14.5 ± 5.81 c21.67 ± 4.85 bc26.04 ± 4.82 ab28.84 ± 8.14 ab34.82 ± 6.26 a
TN (g kg−1)0.69 ± 0.16 b1.38 ± 0.22 a1.48 ± 0.39 a1.52 ± 0.28 a1.8 ± 0.2 a
C/N11.92 ± 2.17 a9.1 ± 1.0 b10.43 ± 1.72 ab10.86 ± 1.4 ab11.25 ± 1.6 ab
TP (g kg−1)0.16 ± 0.03 c0.38 ± 0.02 bc0.53 ± 0.14 bc0.81 ± 0.32 b1.31 ± 0.61 a
TK (g kg−1)11.28 ± 4.98 b7.82 ± 1.89 b10.3 ± 3.34 b19.16 ± 7.91 a9.06 ± 1.05 b
AN (mg kg−1)53.82 ± 17.54 c202.04 ± 33.85 ab260.58 ± 128.66 a135.01 ± 28.16 bc181.27 ± 28.76 ab
AP (mg kg−1)1.03 ± 0.24 b10.94 ± 3.58 b70.26 ± 22.99 ab102.67 ± 68.66 a140.03 ± 95.06 a
AK (mg kg−1)26.19 ± 5.74 c106.81 ± 17.85 b134.52 ± 7.26 a135.36 ± 22.51 a140.4 ± 24.59 a
BD1.13 ± 0.07 a1.04 ± 0.1 a1.11 ± 0.12 a1.1 ± 0.03 a1.05 ± 0.08 a
1 Data are mean values ± standard deviation (n = 4); 2 Y0 represents woodland; Y6, Y12, Y23 and Y35 represent tea planting for 6, 12, 23 and 35 years; 3 pH: soil pH value; SOM: soil organic matter; TN: soil total nitrogen; TP: soil total phosphorus; TK: soil total potassium; AN: soil available nitrogen; AP: available phosphorus; AK: available potassium; BD: bulk density and C/N: soil organic carbon (SOC)/TN. 4 Lowercase letters indicate significant differences between different treatments at p < 0.05.
Table 2. OTU richness and diversity indices of bacteria and fungi across planting ages 1.
Microbial
Community
Diversity IndicesY0 2Y6Y12Y23Y35
BacteriaACE1168.22 ± 21.47 b, 31209.66 ± 43.74 b1156.59 ± 65.86 b1402.17 ± 86.74 a1392.16 ± 30.82 a
Chao11205.3 ± 33.18 b1239.94 ± 37.74 b1201.53 ± 50.16 b1419.15 ± 74.38 a1408.89 ± 35.78 a
Simpson0.9909 ± 0.0008 ab0.9834 ± 0.0074 bc0.9776 ± 0.0099 c0.9924 ± 0.0042 ab0.9932 ± 0.0031 a
Shannon8.07 ± 0.14 b7.86 ± 0.24 b7.63 ± 0.37 b8.58 ± 0.45 a8.57 ± 0.29 a
FungiACE509.44 ± 70.33 a454.6 ± 63.29 b458.99 ± 52.06 b420.81 ± 57.71 bc357.49 ± 24.78 c
Chao1427.79 ± 69.7 ab468.44 ± 64.67 a456.59 ± 35.8 a430.18 ± 38.97 ab368.84 ± 30 b
Simpson0.891 ± 0.0343 a0.9435 ± 0.0268 a0.9303 ± 0.0131 a0.9401 ± 0.0445 a0.8828 ± 0.0569 a
Shannon4.67 ± 0.52 a5.62 ± 0.72 a5.05 ± 0.3 a5.5 ± 0.86 a4.65 ± 0.65 a
1 Data are mean values ± standard deviation (n = 4); 2 Y0 represents woodland; Y6, Y12, Y23 and Y35 represent tea planting for 6, 12, 23 and 35 years. 3 Lowercase letters indicate significant differences between different treatments at p < 0.05.
Table 3. Relationships between soil properties and microbial (bacteria and fungi) diversity indices (n =20) 1.
Microbial
Community
FactorpH 2SOMTNTPTKANAPAKBDC/N
BacteriaACE0.1950.681 **0.615 **0.543 *0.1890.0590.4120.443−0.2930.132
Chao10.1790.703 **0.614 **0.536 *0.2060.0720.4150.450 *−0.2700.190
Simpson0.625 **0.179−0.0440.166−0.029−0.515 *0.064−0.163−0.0210.428
Shannon0.484 *0.4360.2770.3070.038−0.2760.1590.157−0.0510.327
FungiACE0.059−0.429−0.549 *−0.508 *0.096−0.246−0.360−0.582 **−0.0650.197
Chao1−0.332−0.174−0.142−0.3020.0430.112−0.217−0.125−0.409−0.135
Simpson−0.2600.2580.243−0.187−0.1400.220−0.2150.263−0.0080.058
Shannon−0.2360.3200.282−0.100−0.1670.149−0.1480.226−0.2420.086
1 Data in the table are shown as R2 of the Pearson correlation; * indicates significance at p < 0.05, ** indicates significance at p < 0.01. 2 pH: soil pH value; SOM: soil organic matter; TN: soil total nitrogen; TP: soil total phosphorus; TK: soil total potassium; AN: soil available nitrogen; AP: available phosphorus; AK: available potassium; BD: bulk density; and C/N: SOC/TN.
Disclaimer/Publisher’s Note: The statements, opinions and data contained in all publications are solely those of the individual author(s) and contributor(s) and not of MDPI and/or the editor(s). MDPI and/or the editor(s) disclaim responsibility for any injury to people or property resulting from any ideas, methods, instructions or products referred to in the content.

