Article

Drivers of Net Primary Productivity Spatio-Temporal Variation in Ningxia, China

1
State Key Laboratory of Eco-Hydraulics in Northwest Arid Region, Xi’an University of Technology, Xi’an 710048, China
2
Key Laboratory National Forestry Administration on Ecological Hydrology and Disaster Prevention in Arid Regions, Xi’an University of Technology, Xi’an 710048, China
3
Ningxia Soil and Water Conservation Monitoring Station, Ningxia Water Conservancy, Yinchuan 750002, China
*
Authors to whom correspondence should be addressed.
Forests 2023, 14(6), 1170; https://doi.org/10.3390/f14061170
Submission received: 8 April 2023 / Revised: 27 May 2023 / Accepted: 3 June 2023 / Published: 6 June 2023
(This article belongs to the Special Issue Hydrology and Ecosystem Services in Forests)

Abstract

:
The drivers and spatial distribution trends for net primary productivity (NPP) in Ningxia were studied to determine the priority vegetation restoration areas. NPP data from MOD17 A3 were used to determine the future NPP trends through slope trend analysis and the Hurst index. Spatial drivers were defined by a geographic detector and correlation analysis. Results indicate that NPP positively fluctuated from 2000 to 2020 with an average range between 119.98 and 249.66 gC/m2a, and a multi-year average of 190.15 gC/m2a. The spatial distribution has more obvious divergent characteristics, showing distribution characteristics of low in the central and northern sides and high in the southern and northern middle. Superimposed on the analysis of slope and Hurst indices, the future vegetation NPP in Ningxia will show four scenarios of continuous increase, continuous decrease, change from increase to decrease and change from decrease to increase, accounting for 22.35%, 1.36%, 71.42% and 2.86% of the area of the region, respectively. Driving factor influence can be divided into dominant factors and important factors. The interaction between the two factors is positive, and the maximum q value under the interaction of precipitation and temperature is 0.687. NPP is mainly driven by climatic factors in 50.92% of the area and is mainly distributed in the central, western and southern parts of Ningxia. The non-climatic-factor-driven areas can be used as priority vegetation restoration areas, which accounting for 47.08%, are mainly concentrated in the northern Yellow River irrigation area, the desert steppe in the central and eastern parts, and a small part in the southern Liupan Mountains.

1. Introduction

The net primary productivity (NPP) of vegetation refers to the total amount of organic matter fixed by photosynthesis per unit area per unit time after deducting autotrophic respiration consumption [1]. NPP reflects the ability of vegetation to fix CO2 under natural conditions [2], is an important part of the carbon cycle and carbon budget of terrestrial ecosystem, and is a key indicator for evaluating the health and potential sustainable development of regional ecosystems of the Earth [3].
Vegetation NPP measurements are mainly divided into the field measurement method and the model estimation method [4]. The field measurement method is based on harvest weighing of the sample plot and is often used to test the effectiveness of other methods [5]. However, due to time and labor costs, this method is only suitable for small-scale ecosystem monitoring and cannot predict the response relationship and variation trends of NPP to future climate change [6]. Currently, to accurately reflect spatial and temporal patterns, most scholars use the NPP estimation model supplemented by remote sensing data to apply real-time simulation and dynamic monitoring on medium to large scales. NPP estimation models can be roughly divided into climate-related statistical models (Miami [7], Thornthwaite Menorial [8] and Chikugo [9], etc.), ecosystem process models ([10], BIOME-BGC [11] and BEPS [12], etc.) and light utility rate models (CASA [13] and GLO-PEM [14]) [15]. The light utility rate model is used to establish an empirical equation and combine remote sensing data to invert the regional NPP, which is suitable for large-scale estimation. This model integrates the advantages of remote sensing data, geographic information system, and model simulation, and is widely used to study vegetation NPP [16]. The NPP of vegetation is jointly affected by the physiological and ecological characteristics associated with the plants themselves [17] and external environmental factors (precipitation, temperature, etc.) [18]. Different climatic factors play different roles in the process of vegetation mechanisms. Ge et al. [19] found that the average contributions of precipitation, temperature, solar radiation and other climatic factors to China’s NPP were 0.72, 0.24, 0.61 and 0.31 g C m−2 a−1, respectively. Precipitation plays a decisive role in vegetation changes in arid and semi-arid regions, and temperature is the dominant factor in vegetation dynamics in alpine regions. Solar radiation is beneficial to the growth of vegetation in most regions, and there is a hysteresis effect on the response of vegetation NPP to precipitation [20]. Additionally, different timings and distributions of precipitation lead to variations in the temporal distributions of water in the rhizosphere soil [21], which influences the productivity of vegetation [22].
Ningxia is an important ecological safety barrier, node, and channel in China and creates a monsoon boundary, regulates water–vapor exchange, and preserves the climate in the northwest. However, the region faces a series of environmental issues such as: increasing water pollution, destruction of grassland vegetation, and desertification. Few studies have focused on vegetation NPP in this region, and the studies that have been conducted are short-term. Here, we analyze the temporal and spatial variation pattern and future variation trend of vegetation NPP in Ningxia from 2000 to 2020. A geographic detector was used to analyze the driving factors of NPP from the aspects of natural environment and human activities. The spatial distribution of driving types of vegetation NPP were obtained through a correlation analysis and significance test. Using the main drivers governing vegetation NPP, a priority vegetation restoration area was determined. Our suggestions and theoretical basis are provided for vegetation restoration and construction work in Ningxia.

2. Materials and Methods
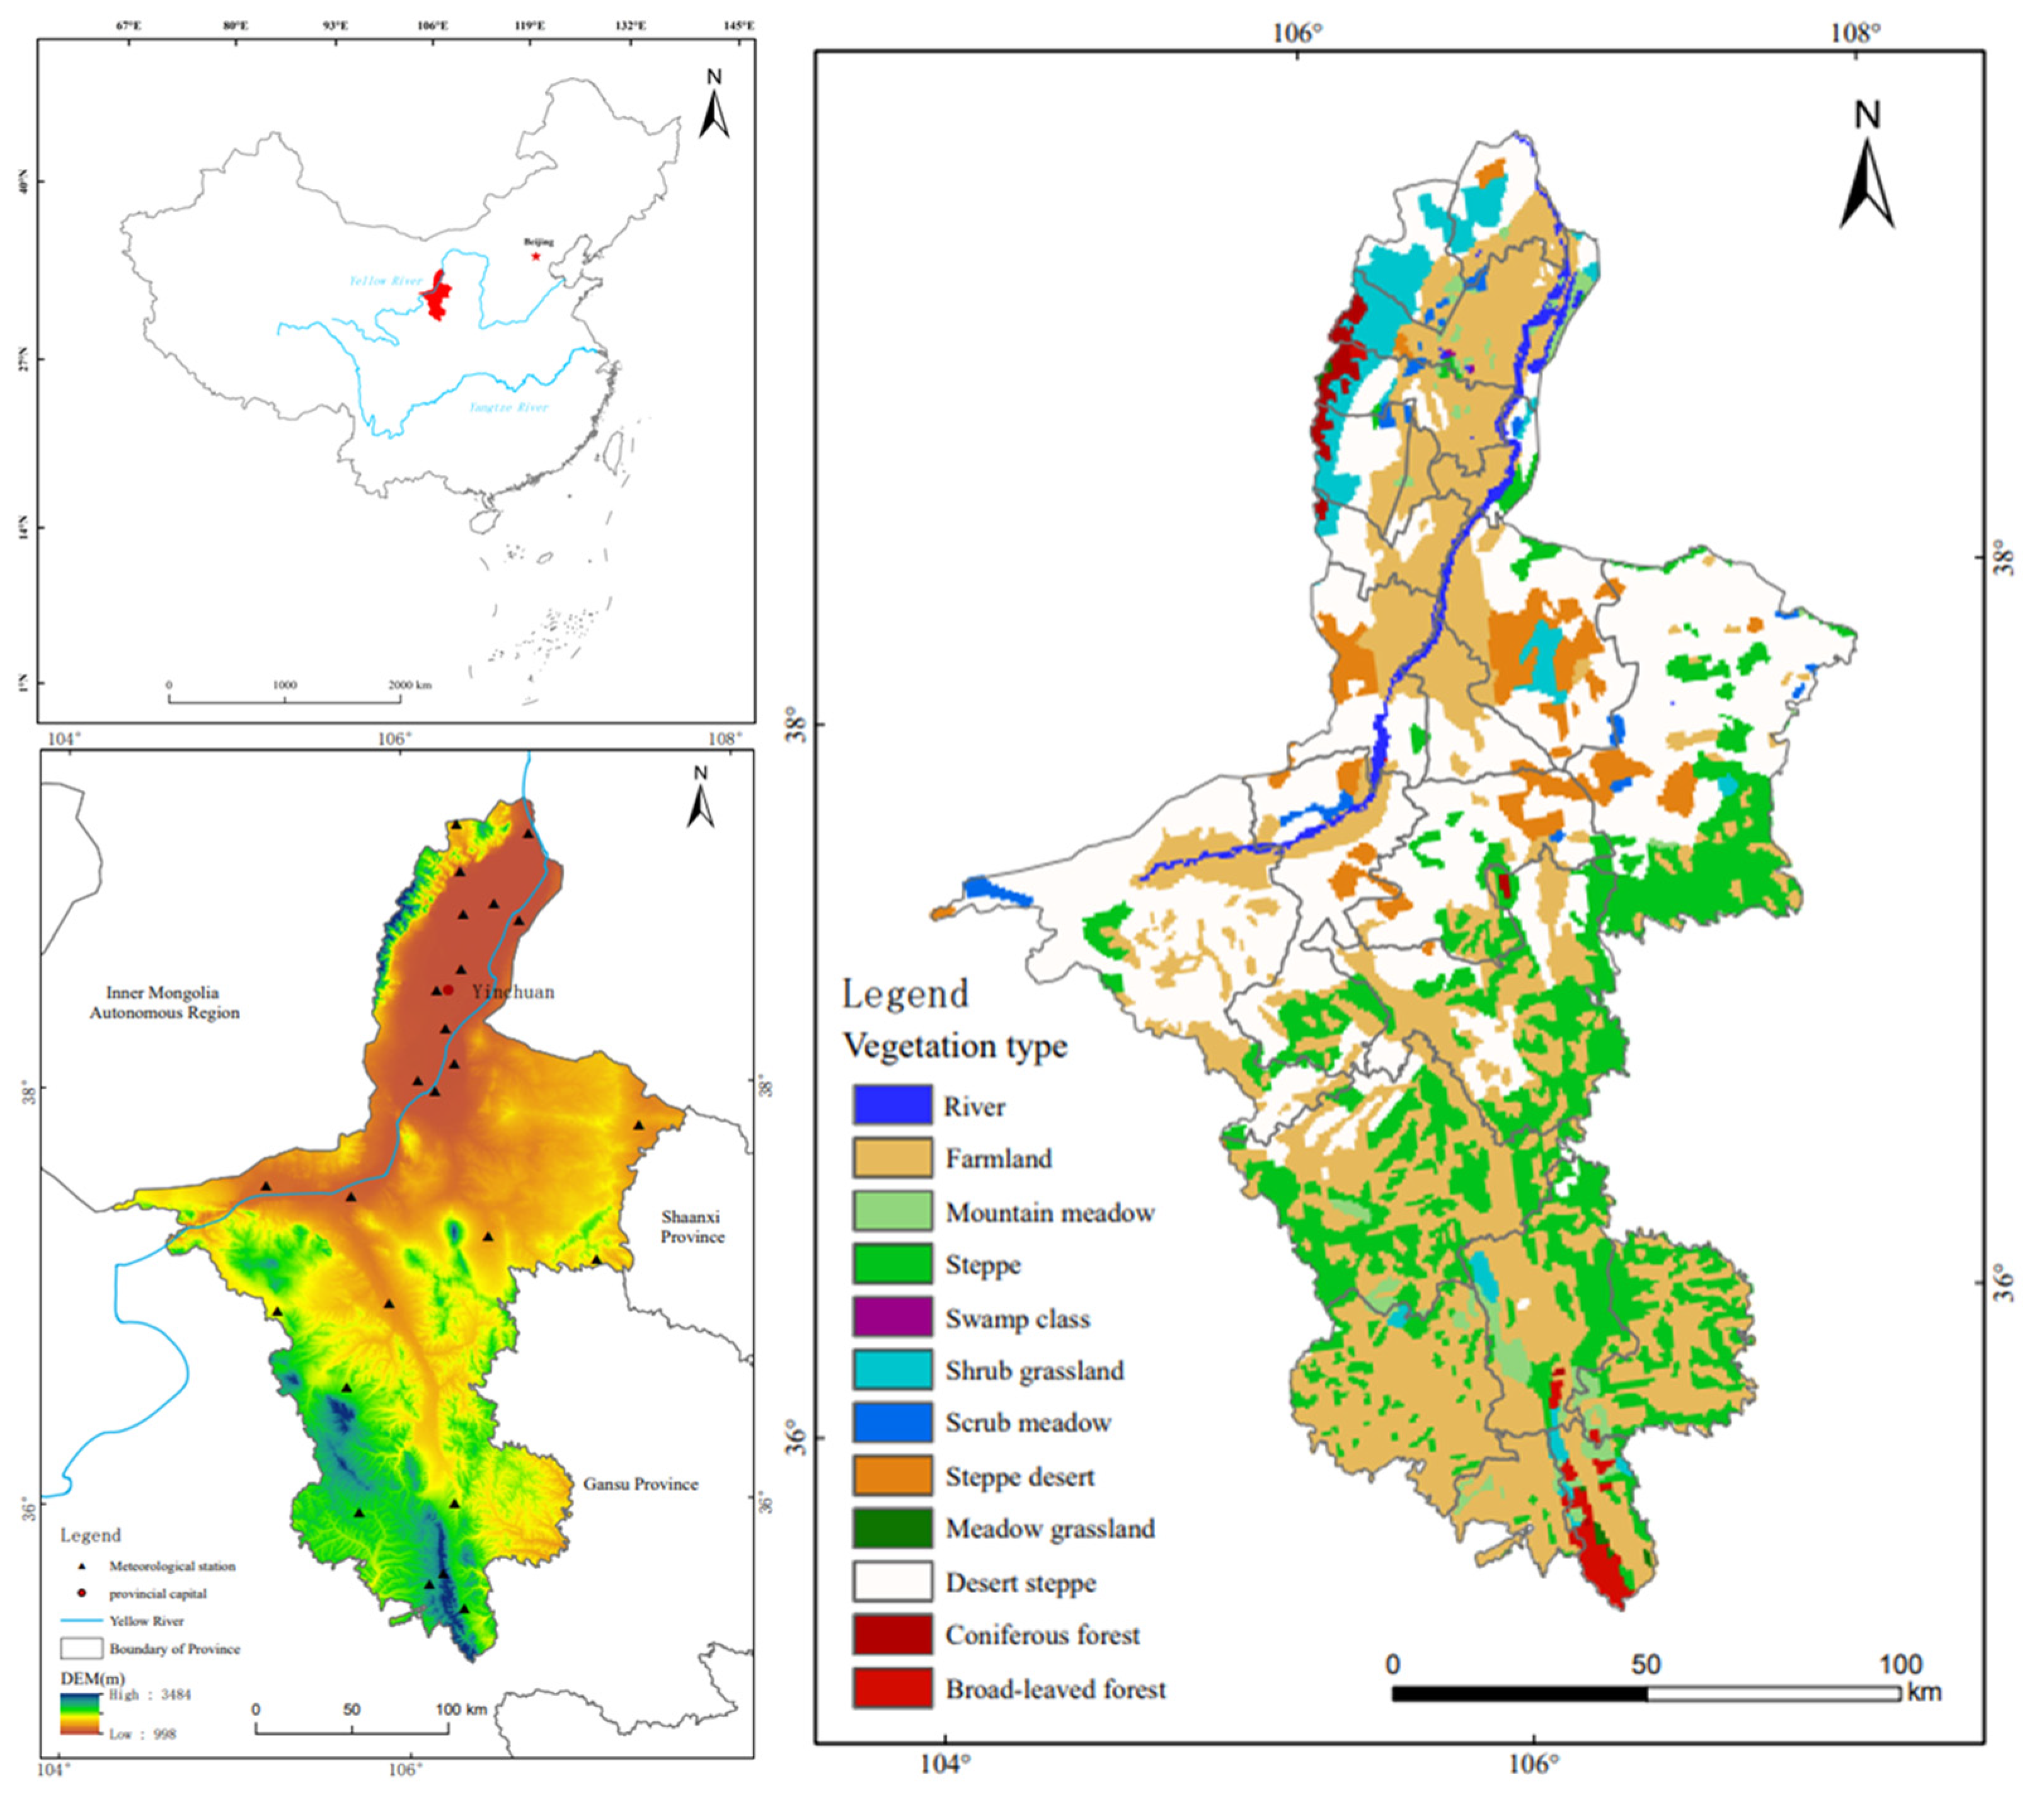
2.1. Study Area

The Ningxia Hui Autonomous Region (35°14–39°23 N, 104°17–107°39 E) is located in the western region of China. The central and northern parts of the territory are irrigated and nourished by the Yellow River, with a total flow of 397 km. Ningxia’s territory is long from north to south and short from east to west, resembling the shape of a cross. The terrain is high in the south and low in the north. The landform is divided into three parts: the Northern Yellow River irrigation area, the central arid zone, and the southern mountainous area, all with an altitude above 1000 m and a total area of about 66,400 km2. The climate type is a typical continental semi-humid and semi-arid climate with strong solar radiation, high evaporation, and poor water resources. The rainfall is scarce with a multi-year average precipitation of approximately 300 mm. The primary vegetation types are coniferous forests and broad-leaved forests in the south, desert and grassland in the middle, and farmland in the north (Figure 1). Grassland coverage accounts for 79.5% of the natural vegetation, and forest coverage accounts for 15.8%. Ningxia has unique geographical advantages for ecological safety barriers, such as the Helan Mountains, Liupan Mountains and Luo Mountains.

2.2. Data sources and Processing

The 2000–2020 NPP data come from the MOD17A3HGF v006 series products released by NASA and have a resolution of 500 m (https://lpdaac.usgs.gov/) (accessed on 23 March 2022). The MOD17A3 NPP dataset was obtained by combining the BIOME-BGC model and the light utility rate model on the basis of MODIS remote-sensing monitoring [22]. This uses meteorological factors, soil conditions, atmospheric CO2 concentration, and plant physical indicators, and is widely used in global and regional carbon cycle studies [16]. The data were re-projected, unit converted, and cropped in ArcGIS to obtain the NPP data for the entire Ningxia region. Any invalid values in the dataset were eliminated. Precipitation and temperature data from 2000 to 2020 were obtained from the daily values of 25 meteorological stations throughout Ningxia, which were collated and interpolated by inverse distance in ArcGIS. The accuracy of the free-grid dataset is mostly 1 km, and considering that Ningxia is not a large area, the interpolation method is used to make the accuracy higher. Population, GDP, land use, DEM, and vegetation type data were sourced from the Resource and Environment Science and Data Center of Chinese Academy of Sciences (https://www.resdc.cn/) (accessed on 1 April 2022). This dataset divides land types into 6 first-level categories: cultivated land, water area, grassland, forest land, construction land, and unused land. DEM was used to extract and classify slope information.

2.3. Methods

2.3.1. Variation Trend Analysis

Unary linear regression was used to analyze the temporal variation trend of vegetation NPP in the Ningxia Hui Autonomous Region from 2000 to 2020. This method reflects the temporal and spatial distribution characteristics of vegetation NPP variation over time. When slope > 0, NPP showed a positive trend with time and when slope < 0, NPP showed a negative trend. The magnitude of the slope value reflects the rate at which the NPP rises or falls. The calculation formula is as follows:
s l o p e = n × i = 1 n i × N P P i i = 1 n i i = 1 n N P P i n × i = 1 n i 2 i = 1 n i 2
where n is the length of the study year (2000–2020, a total of 21 years); i represents the i-th year; NPPi represents the NPP value of vegetation in the i-th year; slope represents the slope of the trend line.
The Hurst index was used to explore the persistence of the NPP variation trend in Ningxia. The Hurst index is an analysis method based on rescaled range (R/S) and is used to quantitatively describe the long-term dependence of NPP time series information. The calculation formula is as follows:
N P P t ¯ = 1 t × i = 1 t N P P t   ( t = 1 ,   2 ,     n )
X i , t = i = 1 t N P P i N P P t ¯
R t = m a x X i , t m i n X ( i , t )  
S t = 1 t × i = 1 t N P P i N P P t ¯ 2 1 2  
where R t , S t and t satisfy the following relationship:
R t S t = c × t H
where c is a constant, R(t) is the extreme deviation, S(t) is the standard deviation, and R(t)/S(t) is the rescaled extreme deviation; the Hurst index ranges from 0 to 1. If H > 0.5, the study series has positive persistence in time, i.e., there is a positive long-term dependence between the past and the future, and the closer the H value is to 1, the stronger the persistence is; if H = 0.5, the series has no correlation between the past and the future; if H < 0.5, the series has reverse persistence, i.e., there will be an increase in the past but a decrease trend in the future, and the closer the H value is to 0, the stronger the reverse persistence.

2.3.2. Geographic Detector

The geographic detector explains the spatial differentiation and reveals the driving factors [23]. The impact factors of vegetation NPP mainly include vegetation type [24], topography [25], soil moisture [26], meteorological factors, and human activities [27]. Vegetation cover and soil moisture are mainly affected by precipitation, temperature, and topography. The land use type, population density, and GDP quantify the impact of human activities. Therefore, precipitation, temperature, elevation, slope, land use, population density, and GDP were selected as the driving factors to explore the differences in vegetation spatial pattern for NPP in Ningxia. Differentiation, factor detection, and interaction detection were used to explore the magnitude of influence for each driving factor on vegetation NPP.

2.3.3. Single Correlation Analysis with Climatic Factors

The main controlling factors were analyzed from the results of the geographic detector. Precipitation and temperature are the two most important climatic factors affecting the variation of NPP in Ningxia. Based on raster data, precipitation and temperature from 2000 to 2020 were used as the main controlling factors affecting the temporal and spatial variation in the correlation analysis. The calculation formula is as follows [28]:
R x y = i = 1 n x i x ¯ y i y ¯ i = 1 n x i x ¯ 2 i = 1 n y i y ¯ 2
where Rxy denotes the correlation coefficient between variable x and variable y; xi is the value of NPP in year i (gC/m2a); yi is the value of the climate factor in year i (precipitation/mm or temperature/°C); x ¯ and y ¯ denote the average of NPP and climate factor in n years, respectively.

2.3.4. Bias Correlation Analysis with Climate Factors

The degree of correlation between the two factors (NPP and air temperature; NPP and precipitation) is expressed by introducing the bias correlation coefficient, i.e., the interference of precipitation (air temperature) needs to be excluded when studying the effect of air temperature (precipitation) on NPP, and the bias correlation coefficient is calculated as follows [29]:
R x y , z = R x y R x z × R y z 1 R x z 2 1 R y z 2
where Rxy, Rxz, Ryz denote the correlation coefficients between NPP and air temperature, NPP and precipitation, and air temperature and precipitation, respectively; and Rxy,z refers to the bias correlation coefficient between NPP and air temperature when precipitation is constant, i.e., the effect of precipitation is excluded when analyzing the correlation between NPP and air temperature. The bias correlation coefficients were subsequently tested for significance (t test method), and the statistics were calculated as follows [30]:
t = R x y , z 1 R x y , z 2 n m 1
where Rxy,z is the bias correlation coefficient, n is the number of samples (n = 21), and m is the number of independent variables.

2.3.5. Multi-Correlation Analysis with Climatic Factors

A variable is often affected by multiple factors, and the factors affect and relate to each other. Therefore, we introduced a multi-correlation coefficient to calculate the correlation degree of multiple factors. The correlation of NPP with precipitation and temperature is studied in this paper. The calculation formula is as follows:
R x , y z = 1 1 R x y 2 1 R x z , y 2
where Rx,yz is the multi-correlation coefficient of NPP with temperature and precipitation; Rxy is the correlation coefficient of NPP with temperature; Rxz,y is the bias correlation coefficient of NPP with precipitation when the temperature is constant. A significance test (F test method) was performed on the multi-correlation coefficients, and the statistics were calculated as follows:
F = R x , y z 2 1 R x , y z 2 × n k 1 k
where Rx,yz is the complex coefficient, n is the number of samples, and k is the number of independent variables.

2.3.6. NPP Driver Partition

Combining the results of the bias correlation coefficient (α = 0.01) and the significance test (α = 0.05) of the NPP and climate factor, the driving partition of Ningxia NPP was delineated according to the guidelines of the driving partition of NPP and the driving factor [31] (Table 1).

3. Results and Analysis

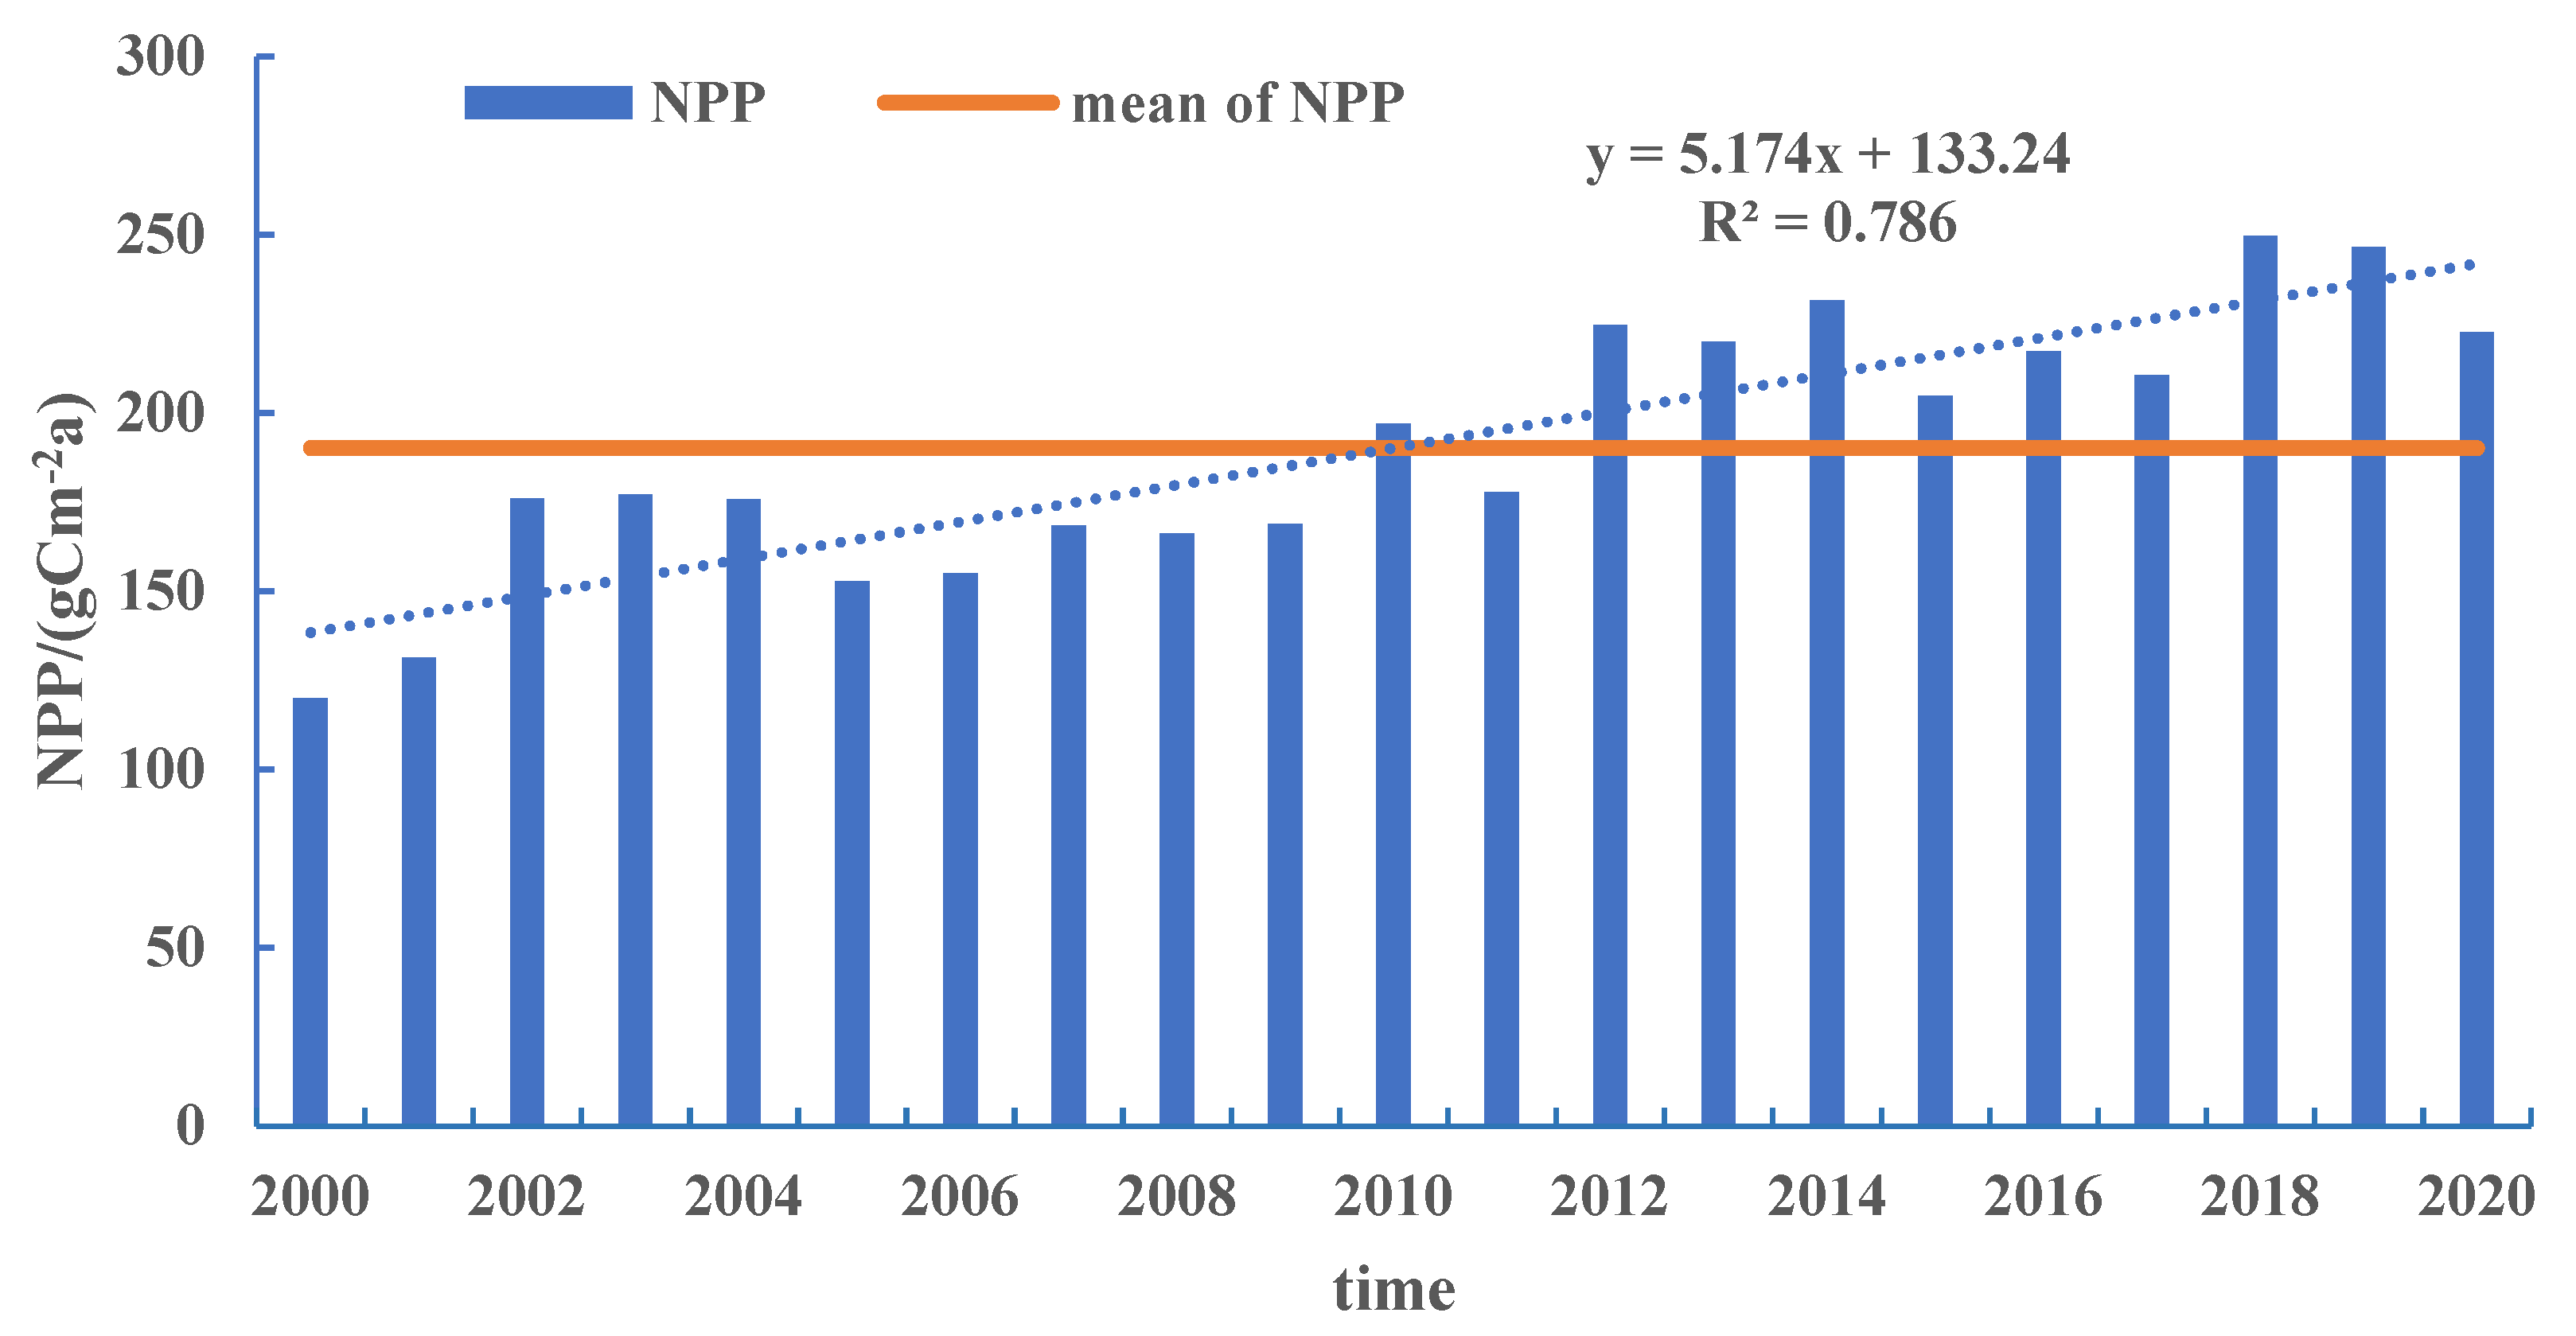
3.1. Temporal and Spatial Variation Characteristics of Vegetation NPP

The variation of NPP in the Ningxia terrestrial ecosystem from 2000 to 2020 is shown in Figure 2, and its annual mean fluctuated between 119.98 and 249.66 gC/m2a, with a multi-year mean of 190.15 gC/m2a. The annual average NPP exceeded the multi-year average for 10 years, all of which were after 2010. This indicated that the Ningxia ecological protection and restoration project was effective. The linear trend analysis of the NPP variation value in 21 years showed an annual growth rate of 5.17 gC/m2a, indicating that the NPP showed a fluctuating rise. The ecosystem NPP peaked in 2018 at 249.66 gC/m2a. The minimum value appeared in 2000 at 119.98 gC/m2a. The difference between the highest value and the lowest value was 129.68 gC/m2a.
The spatial distribution of the multi-year average NPP value in Ningxia from 2000 to 2020 is shown in Figure 3, with obvious differentiation in characteristics. There are more obvious divergent characteristics, showing distribution characteristics of low in the central and northern sides and high in the southern and northern middle. Vegetation types mainly included: forest land, shrub grassland, mountain meadows, meadow grassland, desert steppe, and farmland. The vegetation NPP ranges primarily between 200 and 300 gC/m2a. The Liupan Mountains and Nanhua Mountains have high altitudes and abundant precipitation with rich forest resources. The vegetation NPP was higher than 400 gC/m2a. Thus, the vegetation NPP level in southern Guyuan City is 77.17% higher than the multi-year average level of the whole region. The central part of Ningxia is an arid zone, the central and southern parts are steppe grasslands, and the central and northern parts are desert steppes. The vegetation NPP ranges mainly between 100 and 200 gC/m2a. The steppe desert vegetation in the piedmont plain of the Helan Mountains on both sides of the north and the edge of the Ordos platform have low vegetation coverage and the lowest vegetation NPP (>100 gC/m2a). The northern Yellow River is nourished by Yellow River irrigation, and a modern agricultural system was formed. The NPP of vegetation is slightly higher than on both sides, at 200–400 gC/m2a. The multi-year average vegetation NPP of each city in Ningxia is: Guyuan City (336.89 gC/m2a) > Yinchuan City (167.75 gC/m2a) > Zhongwei City (159.85 gC/m2a) > Wuzhong City (153.31 gC/m2a) > Shizuishan City (144.46 gC/m2a).

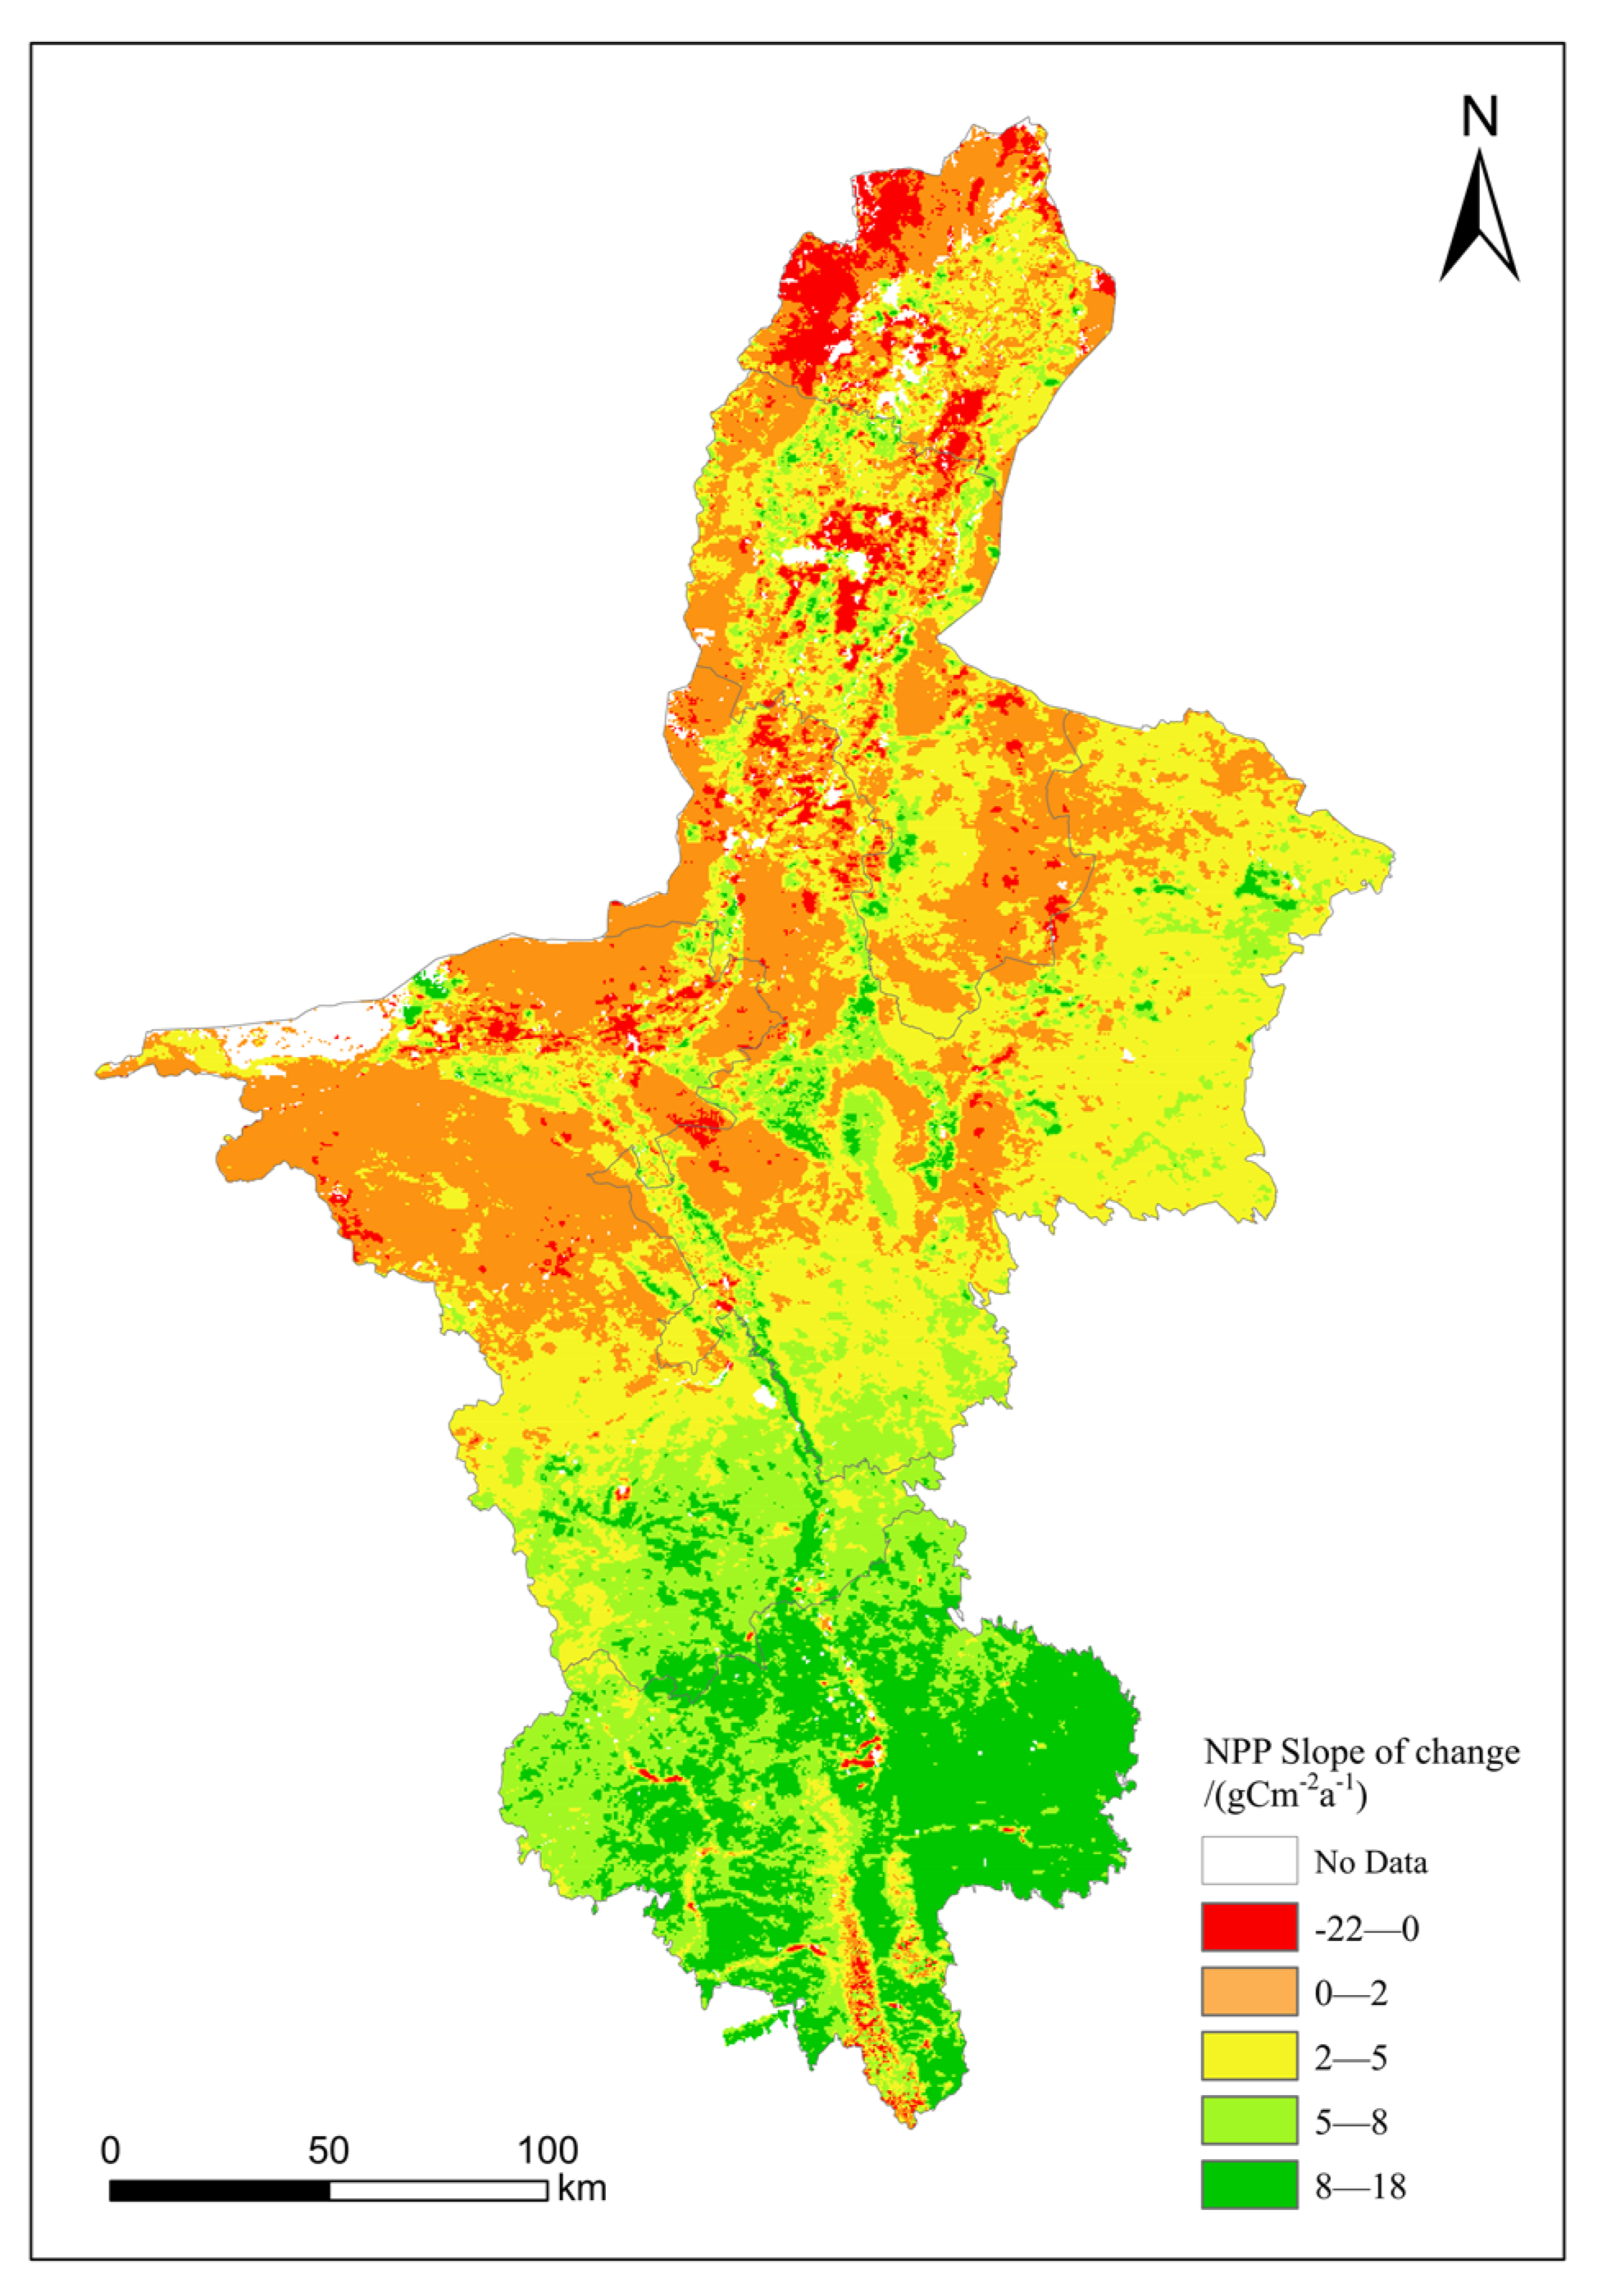
3.2. Analysis of Vegetation NPP Variation Trend

The annual average vegetation NPP interannual variation value slope from 2000 to 2020 in Ningxia was between −21 and 18 gC/m2a (Figure 4). The NPP area with an increasing trend (slope > 0) accounted for 93.78% of the area. The NPP area with a decreasing trend (slope < 0) accounted for 4.22% and was partially concentrated in a shrub grassland zone in the Helan Mountains and the northern Yellow River irrigation area and was sporadically distributed in the desert steppe zone in central Ningxia. The interannual spatial variation of the region gradually increased from north to south. The interannual variation value of the desert steppe in the central and northern parts of Ningxia was between 0 and 2 gC/m2a, accounting for 28.63% of total area in the region. The interannual variation value of the steppe in the northern Yellow River irrigation area and the central and southern regions was between 2 and 6 gC/m2a, accounting for 32.87% of the area of the region. The interannual variation value of the forest grassland zone in the south was 6–18 gC/m2a, accounting for 32.28% of the area of the region. Overall, the interannual variation value of vegetation NPP in Ningxia was 4.89 gC/m2a, showing an increasing trend over the past 21 years.
The Hurst index of vegetation NPP from 2000 to 2020 was calculated to predict the future sustainability of NPP variation trends in Ningxia. Through spatial analysis, the Hurst index range of Ningxia was between 0.13 and 0.88, and the regional average was 0.45 (Figure 5). H < 0.5 accounted for 74.28%, and H > 0.5 only accounted for 23.72% of the total area. This indicated that vegetation NPP variation in Ningxia has a strong reverse persistence. Most areas in Ningxia will have a reverse trend of vegetation NPP variation in the future. Using superposition analysis of the interannual variation slope and Hurst index of regional vegetation NPP, five variation trends of NPP in the future were obtained (Table 2). In the future, the vegetation NPP will be continuously increasing, decreasing, changing from increasing to decreasing and from decreasing to increasing, accounting for 22.35%, 1.36%, 71.42% and 2.86% of the whole area, respectively. The areas that show a change from decreasing to increasing will be concentrated in the northern Helan Mountain front. The areas that continue to increase will be mainly distributed in the southern hilly mountains, the central and southern steppe, and the central and eastern desert steppe.

3.3. Analysis of Vegetation NPP Driving Factors

The multi-year average vegetation NPP was selected as the variable Y. The multi-year average temperature, multi-year average precipitation, elevation, slope and land use, population density, and GDP were selected as the driving factors X. The influence of each driving factor X on the variable Y is measured by the value q, and the range is between 0 and 1. The larger the q value, the stronger the influence of X on Y. Results from the differentiation and factor detector show that the magnitude of value q for different factors was ranked as precipitation (0.6646) > temperature (0.6286) > population density (0.0675) > GDP (0.0283) > land use (0.0086) > elevation (0.0040) > slope (0.0034).
Driving factors on vegetation NPP were divided into two categories: dominant factors at q ≥ 0.5 (precipitation and temperature) and important factors at q < 0.5 (population density, GDP, land use, elevation, and slope). The interaction detector can assess whether the influence on the variable Y is enhanced or diminished when the driving factors X1 and X2 act together. As can be seen from Table 3, whether it is: dominant factor dominant factor, important factor important factor, or dominant factor important factor, the metric q has increased, which is two-factor enhancement. Therefore, the spatial and temporal differentiation pattern of vegetation NPP in Ningxia is the result of the interaction and comprehensive action of multiple factors.

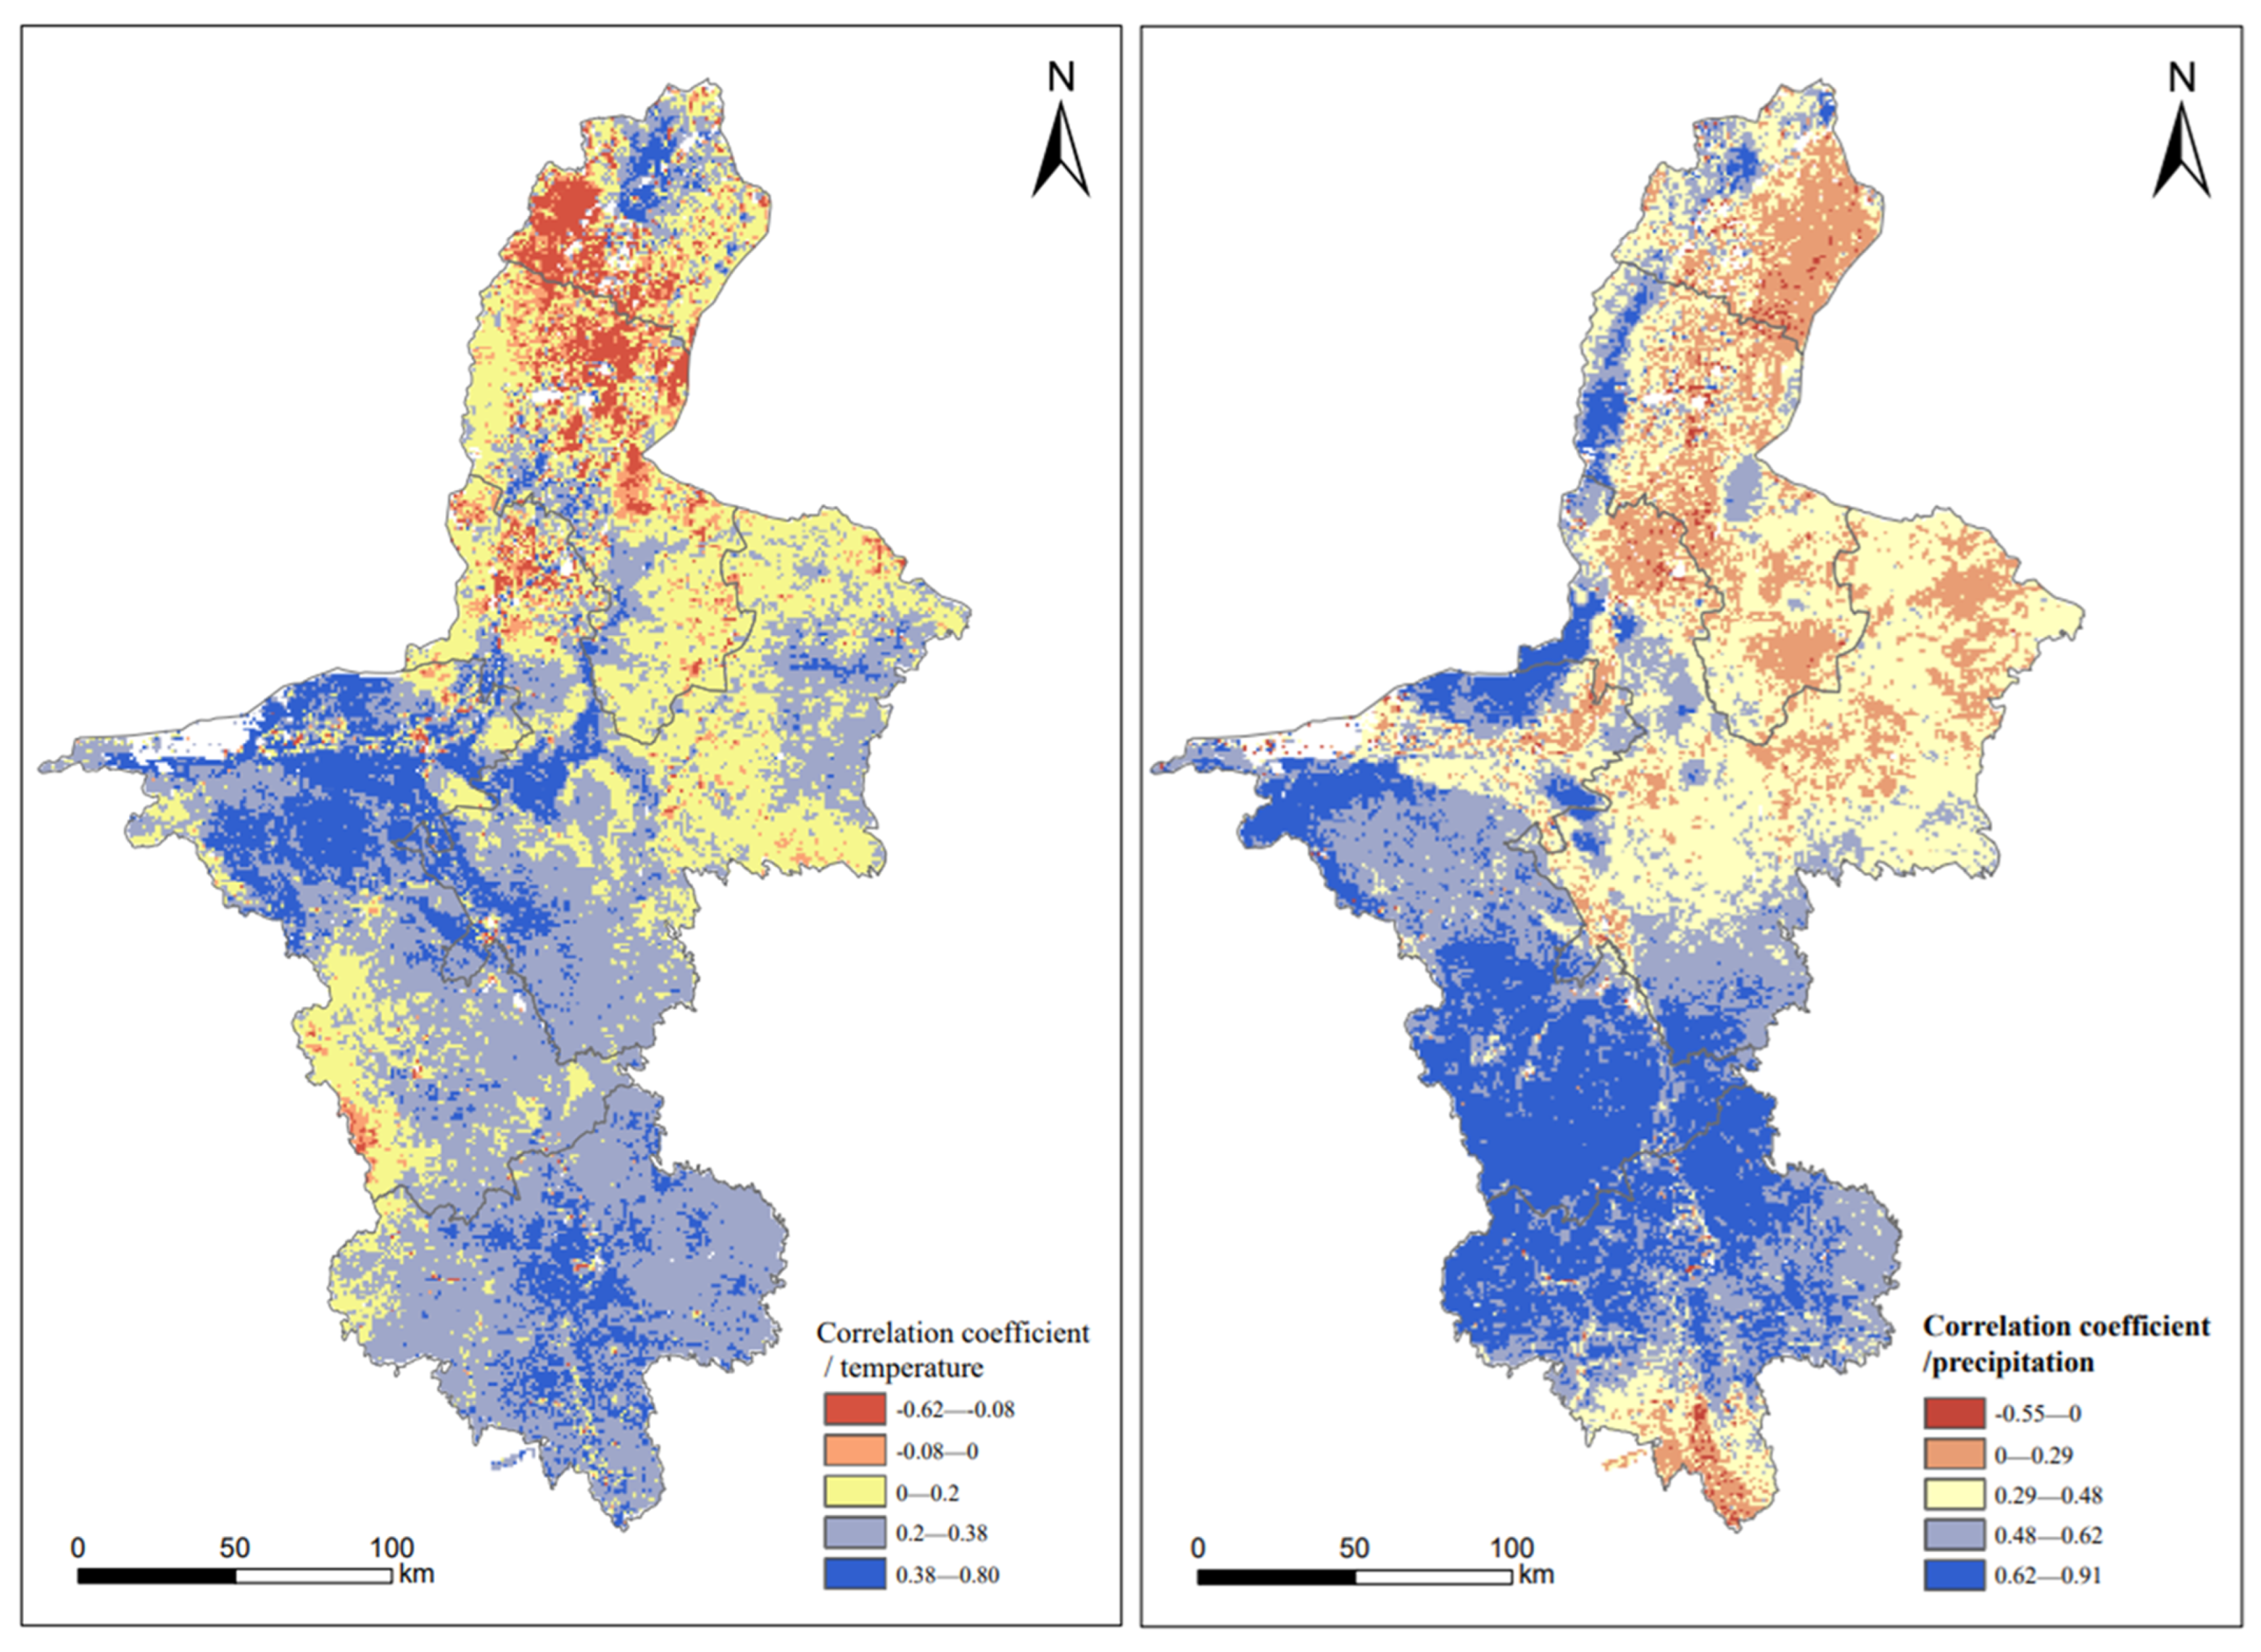
3.4. Correlation Analysis between NPP and Climatic Factors

3.4.1. Single Correlation Analysis between NPP and Climatic Factors

The spatial distribution of the correlation coefficient between the multi-year average vegetation NPP and temperature in Ningxia is shown in Figure 6, which was between −0.62 and 0.80. The average correlation coefficient for the region is 0.23. The regions showing negative and positive correlations were 8.88% and 89.12%, respectively. The negative correlation areas were mainly concentrated in the northern Yellow River irrigation area, Helan Mountains area, and the central cultivated land with an area of about 5896.07 km2. The very weak correlation (0–0.2) areas were concentrated in the desert steppe in the central and eastern parts, with an area of about 18,931.21 km2. The weak correlation (0.2–0.4) areas were mainly concentrated in the steppe of the eastern and central south of Yanchi County and Guyuan City in the south, with an area of 49.22%. This indicated that most of the study area is weakly correlated with temperature. The intermediate correlation (0.4–0.6) and strong correlation (0.6–0.8) areas were sporadically distributed in the Liupan Mountains and the desert steppe in the central and western regions.
The correlation coefficient between the multi-year average vegetation NPP and precipitation ranged from −0.55 to 0.91, and the average correlation coefficient of the whole region was 0.47. The negative correlation area was less than 1%. The weak correlation areas were mainly concentrated in the northern, central and eastern parts, at about 28.96%. The intermediate correlation and strong correlation areas were mainly concentrated in the central and southern parts and in the hilly mountains in the south, at about 62.88%. These regions have low temperature, higher precipitation, and less human disturbance. Therefore, vegetation NPP was more dependent on precipitation. The areas where vegetation NPP showed consistent correlation with temperature and precipitation were Xiji, Yuanzhou and Pengyang counties in the central and western parts of Ningxia.

3.4.2. Bias Correlation Analysis between NPP and Climatic Factors

According to the bias correlation analysis (Figure 7), the bias correlation coefficient between vegetation NPP and temperature in Ningxia fluctuated from −0.78 to 0.86. The average correlation coefficient of the whole region was 0.21, showing an overall weak correlation. The areas with bias correlation showed a positive and negative correlation, accounting for 97% and 1.02% of the total regional area, respectively. The negative correlation area was the central part of the Yellow River irrigation area in northern Ningxia. Results from the two-sided t test show that the bias correlation coefficient between NPP and temperature passed the significance test (|t| > t α = 0.01 ) in an area of about 729.07 km2 (Table 4), concentrated in the northeastern part of Shapotou District in the central and western regions. The bias correlation coefficient between vegetation NPP and precipitation fluctuated from −0.55 to 0.97. The average correlation coefficient for the region was 0.47, showing an overall moderate correlation. The area with bias correlation showed that the negative correlation was less than 1%. Results from the two-sided t test show that the bias correlation coefficient between NPP and precipitation passed the significance test (|t| > t α = 0.01 ) in an area of 21,728.45 km2 (Table 4). Approximately 32.72% was concentrated in Haiyuan County in the central and southern parts, the edge of Shapotou District, and Yuanzhou District and Xiji County in the south of Ningxia. In general, the bias correlation between vegetation NPP and precipitation in Ningxia was stronger than temperature.

3.4.3. Multi-Correlation Analysis between NPP and Climatic Factors

The spatial distribution of the multi-correlation coefficient between vegetation NPP, precipitation, and temperature is shown in Figure 8. The coefficients ranged between 0.01 and 0.97, and the spatial mean was 0.53, indicating that regional multi-correlation is evident between vegetation NPP and precipitation and temperature. The correlation is significant in Haiyuan County in the central and western parts, and in Shapotou District and Pengyang County, Yuanzhou District and Xiji County in the south of Ningxia. The areas with weak multi-correlation were mainly concentrated in the northern Yellow River irrigation area, the desert steppe in the central and eastern parts, and some mountainous areas of the Liupan Mountains. Results from the F test show that the multi-correlation coefficient between NPP and precipitation and temperature passed the significance test (F > F α = 0.05 ) in an area of 33,814.24 km2. Approximately 50.93% was consistent with the multi-correlation significance area.

3.4.4. Driving Space Distribution

The spatial distribution of driving factors was determined according to the above-mentioned driver partition criteria (Figure 8), which have strong spatial differentiation characteristics. (1) The non-climatic factor-driven area was 31,258.39 km2, accounting for 47.08% of the entire area (Table 5). The slope is primarily below 6°, and the terrain is relatively flat and is mainly concentrated in the northern Yellow River irrigation area and in the desert steppe in the central and eastern parts. A small part is in the Liupan Mountains in the south, with a higher altitude. (2) The area where precipitation is the main driving factor of vegetation NPP accounted for 32.49% of the study area, with an area of 21,575.38 km2. This area is mainly concentrated in Haiyuan County in the central and southern parts and Xiji County, Pengyang County and Yuanzhou District in the south, and a small part is in the Helan Mountains on the west side of the northern Yellow River irrigation area. (3) Less than 1% of the area was driven by temperature as the main factor and was distributed in the northeastern part of the Shapotou District. (4) The area is weakly driven by rainfall and temperature. The size was 11,508.36 km2, about 17.33%, concentrated in the Shapotou-Zhongning–Tongxin area and the east side of Pengyang County. The remaining areas were strongly driven by rainfall and temperature, sporadically distributed, and occupy a small area.

4. Discussions

The vegetation NPP in Ningxia fluctuated with an annual growth rate of 5.17 gC/m2a from 2000 to 2020. In addition to being related to the ecological restoration project carried out in Ningxia, it may also be related to the CO2 concentration. Increases in CO2 concentration, promoted by CO2 fertilization, can promote the improvement of vegetation productivity [32]. Vegetation NPP spatial patterns showed low distribution on both sides in the middle and north, and high in the middle in the south and north. Precipitation in Ningxia decreased from south to north [33]. The southern mountainous areas have high altitude and abundant precipitation. The Liupan Mountains and Yunwu Mountains have abundant forest resources. The central area has scarce rain and large evaporation and is located in the arid zone with serious grassland desertification and a low vegetation NPP value. The northern Yellow River irrigation area is nourished by the Yellow River, forming a modern agricultural system. The interannual variation value, slope, and Hurst index of the vegetation NPP in Ningxia show that the area has an increasing trend of NPP in Ningxia (slope > 0). This accounts for 93.78% of the whole area, but with a strong reverse persistence. Therefore, the future vegetation NPP changing from increasing to decreasing will account for 71.42% of the whole area, most of which belong to non-climatic-driven areas and may be related to human activities and economic development [34,35]. This should be considered a key area for soil and water conservation and ecological restoration projects.
The spatial differentiation pattern of vegetation NPP in Ningxia is comprehensively influenced by various factors. The geographic detector analysis shows that climatic factors (temperature and precipitation) played a dominant role. When quantifying the impact of human activities on vegetation NPP, three indicators of population density, GDP and land use were selected. However, the effect was not ideal because human activities are a complex and continuous process. The effect cannot be summarized by three indicators alone, and the lag effect of human activities on changing the environment was not considered.
The results of the correlation analysis between vegetation NPP and climatic factors showed that the positive correlation between NPP and precipitation was significantly stronger than temperature. This may be related to the fact that Ningxia is located in a semi-arid and semi-humid zone [36]. In the multi-correlation analysis between vegetation NPP and climatic factors, the areas with weak multi-correlation may be related to important factors in the driving factors of vegetation NPP. For example, they are related to vegetation type, slope, land use type, etc. The terrain of Ningxia is high in the south and low in the north, and the altitude difference is large. The vegetation types show the horizontal distribution of forest grassland–steppe–desert steppe–steppe desertification from south to north. Zhu et al. points out that the vegetation NPP in different grasslands in Ningxia from large to small was: mountain meadows, grassland meadows, shrub meadows and low wetland meadows, steppe meadows and desert steppes. The multi-year average NPP for each vegetation type of land use is also different [37]: forest land (249.19 gC/m2a) > cultivated land (229.47 gC/m2a) > grassland (176.89 gC/m2a) > bare land (113.46 gC/m2a). According to Zhu et al. [37], the multi-year average grassland NPP in Ningxia from 2010 to 2015 was 148.28 gC/m2a, which was not meaningfully different from the results in this paper.
The non-climatic factors driving space distribution of vegetation NPP in Ningxia were mainly concentrated in the northern Yellow River irrigation area and the desert steppe in the central and eastern parts. Most of this area is cultivated or construction land, and human activities are frequent. This area is greatly affected by human activities and less affected by climatic factors; thus, it can be used as a priority vegetation restoration area. The vegetation in the climatic factor-driven area should be protected. The carrying capacity of water and soil resources in each area can be calculated to determine the vegetation carrying capacity. Vegetation restoration and governance can be carried out in combination with driver partition.

5. Conclusions

In this paper, the NPP data of MOD17 A3 were used to determine the future NPP trend of Ningxia via slope trend analysis and the Hurst index. Spatial drivers were defined by geographic detector and correlation analysis. The results showed that: (1) The NPP of Ningxia fluctuated from 2000 to 2020. The annual average range was between 119.98 and 249.66 gC/m2a, and the multi-year average was 190.15 gC/m2a. The spatial distribution has more obvious divergent characteristics, showing the distribution characteristics of low in the central and northern sides and high in the southern and northern middle. (2) By superposition analysis of the slope and Hurst index, vegetation NPP in Ningxia will be continuously increasing, decreasing, changing from increasing to decreasing and from decreasing to increasing, accounting for 22.35%, 1.36%, 71.42% and 2.86% of the whole area, respectively. (3) The influence of driving factors can be divided into dominant factors and important factors. The interaction between the two factors is positive, and the maximum q value under the interaction of precipitation and temperature is 0.6871. (4) The vegetation NPP in Ningxia is mainly driven by climate factors in 50.92% of the area (32.49% driven by rainfall, less than 1% driven by temperature, and 17.33% driven by rainfall and temperature) and is mainly distributed in the central, western and southern parts of Ningxia. The non-climatic factor-driven areas can be used as priority vegetation restoration areas, which account for 47.08%, mainly concentrated in the northern Yellow River irrigation area and the desert steppe in the central and eastern parts, and in a small part in the southern Liupan Mountains. In the future, the area of vegetation NPP from increasing to decreasing should be taken as the key area of a soil and water conservation and ecological restoration project. This study provides some theoretical basis for regional vegetation restoration and high-quality development of the Yellow River Basin.

Author Contributions

B.Z., Z.M. and P.L. conceived the main idea of the paper. B.Z., Z.M. and Y.X. wrote the manuscript. G.Z. and W.M. revised the abstract. Z.M. revised the figures. Z.R. revised the tables, and all authors contributed to improving the paper. All authors have read and agreed to the published version of the manuscript.

Funding

This research was funded by the National Natural Science Foundation of China (grant numbers 42007070, U2040208 and 42277359), the Key Laboratory Project of Shaanxi Provincial Education Department (grant number 20JS100), the Water conservancy science and technology project of Ningxia (grant number SBZZ-J-2021-13) and the Shaanxi Province Innovation Capability Support Plan in 2022 (grant number 2022KJXX-86).

Institutional Review Board Statement

Not applicable.

Informed Consent Statement

Not applicable.

Data Availability Statement

Not applicable.

Acknowledgments

We would like to thank Joseph Elliot at the University of Kansas for her assistance with English language and grammatical editing of the manuscript.

Conflicts of Interest

The authors declare no conflict of interest.

References

  1. Lieth, H.; Box, E. Evapotranspiration and primary productivity. Publ. Climatol. 1972, 25, 37–46. [Google Scholar]
  2. Zhang, F.Y.; Zhang, Z.X.; Kong, R.; Chang, J.; Tian, J.X.; Zhu, B.; Jiang, S.S.; Chen, X.; Xu, C.Y. Changes in forest net primary productivity in the Yangtze River Basin and its relationship with climate change and human activities. Remote Sens. 2019, 11, 1451. [Google Scholar] [CrossRef] [Green Version]
  3. Liu, Y.Y.; Yang, Y.; Wang, Q.; Du, X.L.; Li, J.L.; Gang, C.C.; Zhou, W.; Wang, Z.Q. Evaluating the responses of net primary productivity and carbon use efficiency of global grassland to climate variability along an aridity gradient. Sci. Total Environ. 2019, 652, 671–682. [Google Scholar] [CrossRef]
  4. Steele, S.J.; Gower, S.T.; Vogel, J.G.; Norman, J.M. Root mass, net primary production and turnover in aspen, jack pine and black spruce forests in Saskatchewan and Manitoba, Canada. Tree Physiol. 1997, 17, 577–587. [Google Scholar] [CrossRef] [PubMed] [Green Version]
  5. Becknell, J.M.; Vargas, G.G.; Pérez-Aviles, D.; Medvigy, D.; Powers, J.S. Above-ground net primary productivity in regenerating seasonally dry tropical forest: Contributions of rainfall, forest age and soil. J. Ecol. 2021, 109, 3903–3915. [Google Scholar] [CrossRef]
  6. Zhao, F.; Xu, B.; Yang, X.C.; Jin, Y.X.; Li, J.Y.; Xia, L.; Chen, S.; Ma, H.L. Remote sensing estimates of grassland aboveground biomass based on MODIS Net Primary Productivity (NPP): A case study in the Xilingol grassland of northern China. Remote Sens. 2014, 6, 5368–5386. [Google Scholar] [CrossRef] [Green Version]
  7. Wang, H.; Liu, G.H.; Li, Z.S.; Wang, P.T.; Wang, Z.Z. Assessing the Driving Forces in Vegetation Dynamics Using Net Primary Productivity as the Indicator: A Case Study in Jinghe River Basin in the Loess Plateau. Forests 2018, 9, 374. [Google Scholar] [CrossRef] [Green Version]
  8. Yin, L.; Dai, E.; Zheng, D.; Wang, Y.H.; Ma, L.; Tong, M. What drives the vegetation dynamics in the Hengduan Mountain region, southwest China: Climate change or human activity? Ecol. Indic. 2020, 112, 106013. [Google Scholar] [CrossRef]
  9. Zenbei, U.; Hiroshi, S. Agroclimatic Evaluation of Net Primary Productivity of Natural Vegetations. J. Agric. Meteorol. 1985, 40, 343–352. [Google Scholar]
  10. Sellers, P.J.; Randall, D.A.; Collatz, G.J.; Berry, J.A.; Field, C.B.; Dazlich, D.A.; Zhang, C.; Collelo, G.D.; Bounoua, L. A revised land surface parameterization (sib2) for atmospheric gcms. part i: Model formulation. J. Clim. 1996, 9, 676–705. [Google Scholar] [CrossRef]
  11. Behera, S.K.; Tripathi, P.; Behera, M.D.; Tuli, R. Modeling net primary productivity of tropical deciduous forests in North India using bio-geochemical model. Biodivers. Conserv. 2019, 28, 2105–2121. [Google Scholar] [CrossRef]
  12. Nanzad, L.; Zhang, J.H.; Tuvdendorj, B.; Yang, S.S.; Rinzin, S.; Prodhan, F.A.; Sharma, T.P.P. Assessment of drought impact on net primary productivity in the terrestrial ecosystems of Mongolia from 2003 to 2018. Remote Sens. 2021, 13, 2522. [Google Scholar] [CrossRef]
  13. Xiao, F.J.; Liu, Q.F.; Xu, Y.Q. Estimation of terrestrial net primary productivity in the Yellow River Basin of China using light use efficiency model. Sustainability 2022, 14, 7399. [Google Scholar] [CrossRef]
  14. Wang, J.B.; Liu, J.Y.; Shao, Q.Q. Spatial-Temporal patterns of net primary productivity for 1988–2004 based on Glopem-Cevsa model in the ‘Three-River Headwaters’ region of Qinghai province, China. Chin. J. Plant Ecol. 2009, 33, 254–269. [Google Scholar]
  15. He, Y.L.; Yan, W.B.; Cai, Y.; Deng, F.Y.; Qu, X.X.; Cui, X.L. How does the Net primary productivity respond to the extreme climate under elevation constraints in mountainous areas of Yunnan, China? Ecol. Indic. 2022, 138, 108817. [Google Scholar] [CrossRef]
  16. Liu, Z.H.; Hu, M.Q.; Hu, Y.M.; Wang, G.X. Estimation of net primary productivity of forests by modified CASA models and remotely sensed data. Int. J. Remote Sens. 2018, 39, 1092–1116. [Google Scholar] [CrossRef]
  17. Murphy, P.C.; Knowles, J.F.; Moore, D.J.P.; Anchukaitis, K.; Potts, D.L.; Barron-Gafford, G.A. Topography influences species-specific patterns of seasonal primary productivity in a semiarid montane forest. Tree Physiol. 2020, 40, 1343–1354. [Google Scholar]
  18. Wang, Y.H.; Dai, E.F.; Wu, C.S. Spatiotemporal heterogeneity of net primary productivity and response to climate change in the mountain regions of southwest China. Ecol. Indic. 2021, 132, 108273. [Google Scholar] [CrossRef]
  19. Ge, W.Y.; Deng, L.Q.; Wang, F.; Han, J.Q. Quantifying the contributions of human activities and climate change to vegetation net primary productivity dynamics in China from 2001 to 2016. Sci. Total Environ. 2021, 773, 145648. [Google Scholar] [CrossRef]
  20. Vasconcelos, S.S.; Zarin, D.J.; Araujo, M.M.; Miranda, I.D. Aboveground net primary productivity in tropical forest regrowth increases following wetter dry-seasons. For. Ecol. Manag. 2012, 276, 82–87. [Google Scholar] [CrossRef] [Green Version]
  21. Gang, C.; Zhao, W.; Zhao, T.; Zhang, Y.; Gao, X.; Wen, Z. The impacts of land conversion and management measures on the grassland net primary productivity over the Loess Plateau, Northern China. Sci. Total Environ. 2018, 645, 827–836. [Google Scholar] [CrossRef]
  22. Liu, L.; Lim, S.S.; Shen, X.S.; Yebra, M. Assessment of generalized allometric models for aboveground biomass estimation: A case study in Australia. Comput. Electron. Agric. 2020, 175, 105610. [Google Scholar] [CrossRef]
  23. Li, D.P.; Tian, L.; Li, M.Y.; Li, T.; Ren, F.; Tian, C.H.; Yang, C. Spatiotemporal Variation of Net Primary Productivity and Its Response to Climate Change and Human Activities in the Yangtze River Delta, China. Appl. Sci. 2022, 12, 10546. [Google Scholar] [CrossRef]
  24. Wang, R.J.; Zhang, J.F.; Zhang, D.S.; Dong, L.S.; Qin, G.H.; Wang, S.F. Impacts of climate change on forest growth in saline-alkali land of Yellow River Delta, North China. Dendrochronologia 2022, 74, 125975. [Google Scholar] [CrossRef]
  25. Bian, J.; Li, A.; Wei, D. Estimation and analysis of net primary productivity of ruoergai wetland in china for the recent 10 years based on remote sensing. Procedia Environ. Sci. 2010, 2, 288–301. [Google Scholar] [CrossRef] [Green Version]
  26. Li, C.H.; Sun, H.; Wu, X.D.; Han, H.Y. An approach for improving soil water content for modeling net primary production on the Qinghai-Tibetan Plateau using Biome-BGC model. Catena 2019, 184, 104253. [Google Scholar] [CrossRef]
  27. Zhou, X.F.; Peng, B.B.; Zhou, Y.; Yu, F.; Wang, X.C. Quantifying the Influence of Climate Change and Anthropogenic Activities on the Net Primary Productivity of China’s Grasslands. Remote Sens. 2022, 14, 4844. [Google Scholar] [CrossRef]
  28. Smith, A.A.; Welch, C.; Stadnyk, T.A. Assessing the seasonality and uncertainty in evapotranspiration partitioning using a tracer-aided model. J. Hydrol. 2018, 560, 595–613. [Google Scholar] [CrossRef]
  29. Jia, L.; Yu, K.X.; Deng, M.J.; Li, P.; Li, Z.B.; Shi, P.; Xu, G.C. Spatio-temporal Changes of Annual NPP in the Heihe River Basin and Its Response to Climate Factors. J. Basic Sci. Eng. 2023, 31, 523–540. (In Chinese) [Google Scholar]
  30. Chen, T.T.; Huang, Q.; Li, P.; Wang, Q. Spatiotemporal Variation Characteristics and Impact Factors of Vegetation Coverage in the Three Gorges Reservoir Area. J. Basic Sci. Eng. 2023, 31, 296–308. (In Chinese) [Google Scholar]
  31. Shi, J.; Zhang, X.; Li, H.J.; Shen, Y. Spatial-temporal changes in green water and its driving factors in the Bashang area of Hebei Province. Chin. J. Eco-Agric. 2021, 29, 1030–1041. [Google Scholar]
  32. Wang, S.; Zhang, Y.; Ju, W.; Chen, J.M.; Ciais, P.; Cescatti, A.; Sardans, J.; Janssens, I.A.; Wu, M.; Berry, J.A.; et al. Recent global decline of CO2 fertilization effects on vegetation photosynthesis. Science 2021, 371, 1295–1300. [Google Scholar]
  33. Zhao, Z.W.; Zhang, L.P.; Wang, S.L. Correlation between NDVI and meteorological factors of different vegetation types in Ningxia. Sci. Surv. Mapp. 2016, 41, 98–103. (In Chinese) [Google Scholar]
  34. Li, Z.J.; Chen, J.P.; Chen, Z.P.; Sha, Z.Y.; Yin, J.H.; Chen, Z.T. Quantifying the contributions of climate factors and human activities to variations of net primary productivity in China from 2000 to 2020. Front. Earth Sci. 2023, 11, 1084399. [Google Scholar] [CrossRef]
  35. Yang, D.; Wang, X.F. Contribution of climatic change and human activities to changes in net primary productivity in the Loess Plateau. Arid Zone Res. 2022, 39, 584–593. (In Chinese) [Google Scholar]
  36. Li, R.; Hua, Z.; Huang, B.; Xu, H.; Li, Y. Dynamic impacts of climate and land-use changes on surface runoff in the mountainous region of the haihe river basin, China. Adv. Meteorol. 2018, 2018, 3287343. [Google Scholar] [CrossRef] [Green Version]
  37. Zhu, Y.G.; Du, L.T.; Xie, Y.Z.; Liu, K.; Gong, F.; Dan, Y.; Wang, L.; Zheng, Q.Q. Spatiotemporal characteristics of grassland net primary production in Ningxia Province from 2000-2015 and its response to climate change. Acta Ecol. Sin. 2019, 39, 518–529. (In Chinese) [Google Scholar]
Figure 1. Study area overview and vegetation type map.
Forests 14 01170 g001
Figure 2. Interannual variation characteristics of NPP in Ningxia from 2000 to 2020.
Forests 14 01170 g002
Figure 3. Spatial distribution of net primary productivity of vegetation in Ningxia from 2000 to 2020.
Forests 14 01170 g003
Figure 4. Variation trend of annual average NPP in Ningxia.
Forests 14 01170 g004
Figure 5. Hurst index and future trend of vegetation NPP in Ningxia.
Forests 14 01170 g005
Figure 6. Spatial distribution of correlation coefficients between vegetation NPP and temperature and precipitation in Ningxia from 2000 to 2020.
Forests 14 01170 g006
Figure 7. Spatial distribution of bias correlation coefficients between vegetation NPP and temperature and precipitation in Ningxia from 2000 to 2020.
Forests 14 01170 g007
Figure 8. The complex correlation coefficient and driving space distribution of vegetation NPP, temperature and precipitation in Ningxia from 2000 to 2020.
Forests 14 01170 g008
Table 1. Ningxia NPP driver partition guidelines.
NPP Drive TypeT Test (Temperature)T Test (Precipitation)F Test
Temperature, precipitation intensity drive|t| > t α = 0.01 |t| > t α = 0.01 F > F α = 0.05
Temperature dominated|t| > t α = 0.01 /F > F α = 0.05
Precipitation dominated/|t| > t α = 0.01 F > F α = 0.05
Temperature, precipitation weakly driven|t| ≤ t α = 0.01 |t| ≤ t α = 0.01 F > F α = 0.05
Non-climate driven//F F α = 0.05
Table 2. Classification of future trends in NPP.
Range of ValuesFuture Trends of ChangeRange of ValuesFuture Trends of Change
Slope > 0, H > 0.5Continuous increaseSlope < 0, H < 0.5Change from decrease to increase
Slope < 0, H > 0.5Continuous reductionH = 0.5Unpredictable
Slope > 0, H < 0.5Change from increase to decrease
Table 3. Interactions between different factors.
FactorsTemperaturesPrecipitationSlopeElevationPopulation
Density
GDPLand Utilization
Temperatures0.6286
Precipitation0.68710.6646
Slope0.62940.66540.0034
Elevation0.62920.66510.00580.0040
Population
Density
0.68750.69730.07120.07170.0675
GDP0.65140.68790.03150.03340.22030.0283
Land Utilization0.63640.67230.01610.01830.07560.03810.0086
Table 4. Significance test statistics table.
Significance TestArea (km2)Percentage (%)
Precipitation bias correlation (|t| > t α = 0.01 )21,728.4532.72%
Temperature bias correlation (|t| > t α = 0.01 )729.071.10%
Precipitation temperature complex correlation (F > F α = 0.05 )33,814.2450.93%
Table 5. Driving space statistics.
Drive TypeArea (km2)Percentage (%)
Precipitation dominated21,575.3832.49%
Temperature dominated577.030.87%
Temperature and precipitation strong drive1408.722.23%
Temperature and precipitation weakly driven11,508.3617.33%
Non-climatic factors31,258.3947.08%
Disclaimer/Publisher’s Note: The statements, opinions and data contained in all publications are solely those of the individual author(s) and contributor(s) and not of MDPI and/or the editor(s). MDPI and/or the editor(s) disclaim responsibility for any injury to people or property resulting from any ideas, methods, instructions or products referred to in the content.

