
The Response of Mesofauna to Nitrogen Deposition and Reduced Precipitation during Litter Decomposition

 ,
,
Abstract
:1. Introduction
2. Materials and Methods
2.1. Study Site
2.2. Experimental Design
2.3. Mesofauna Species Identification
2.4. Litter Mass Loss and Moisture
2.5. Statistical Analyses
3. Results
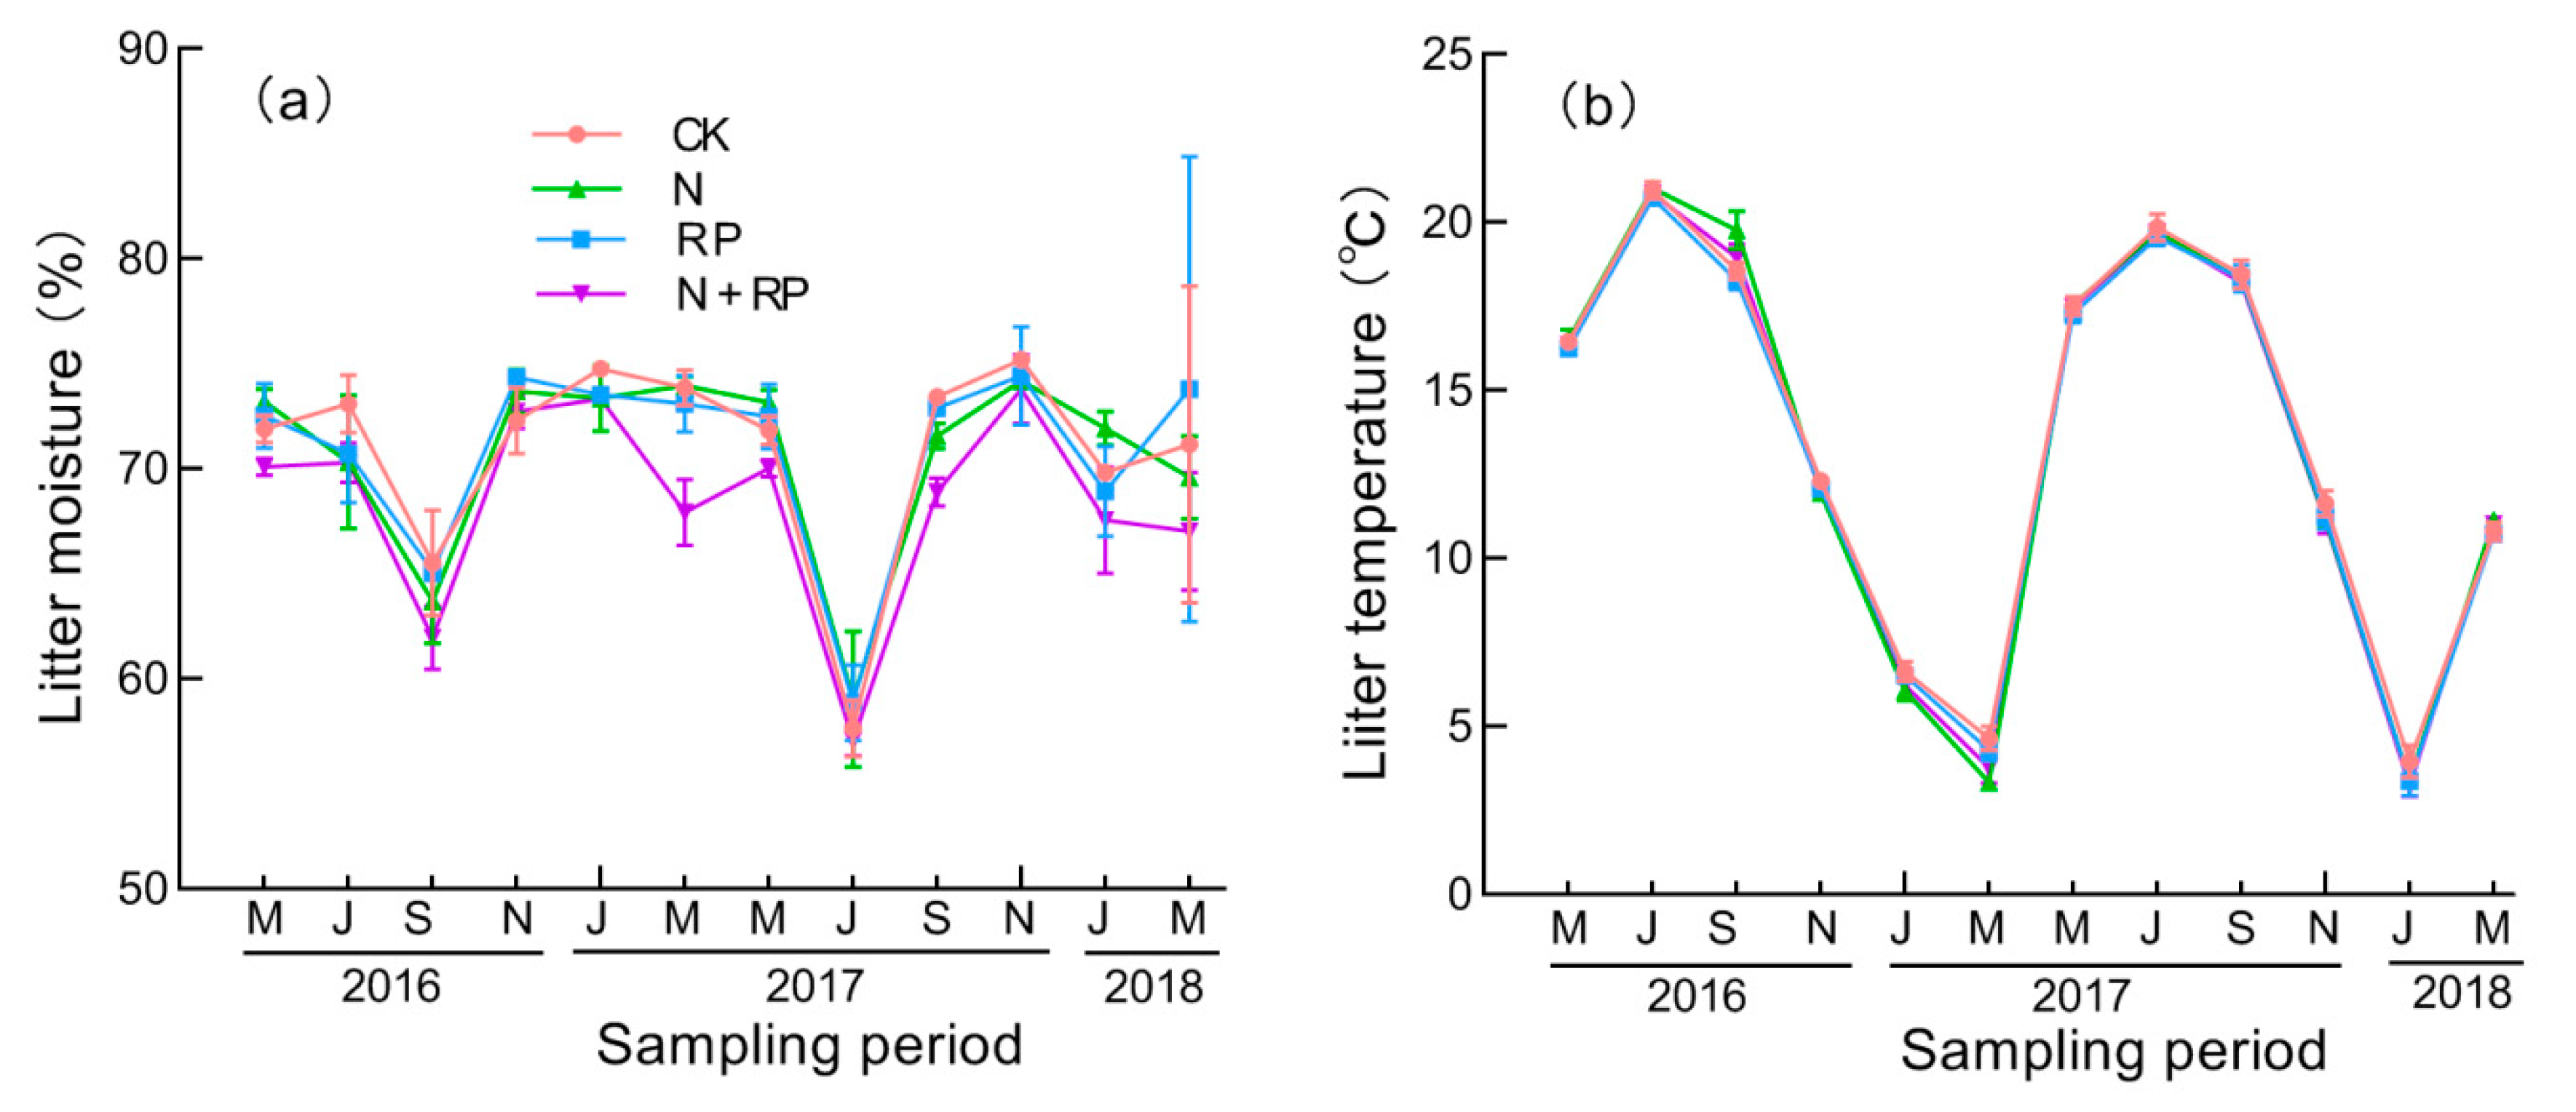
3.1. Microclimate
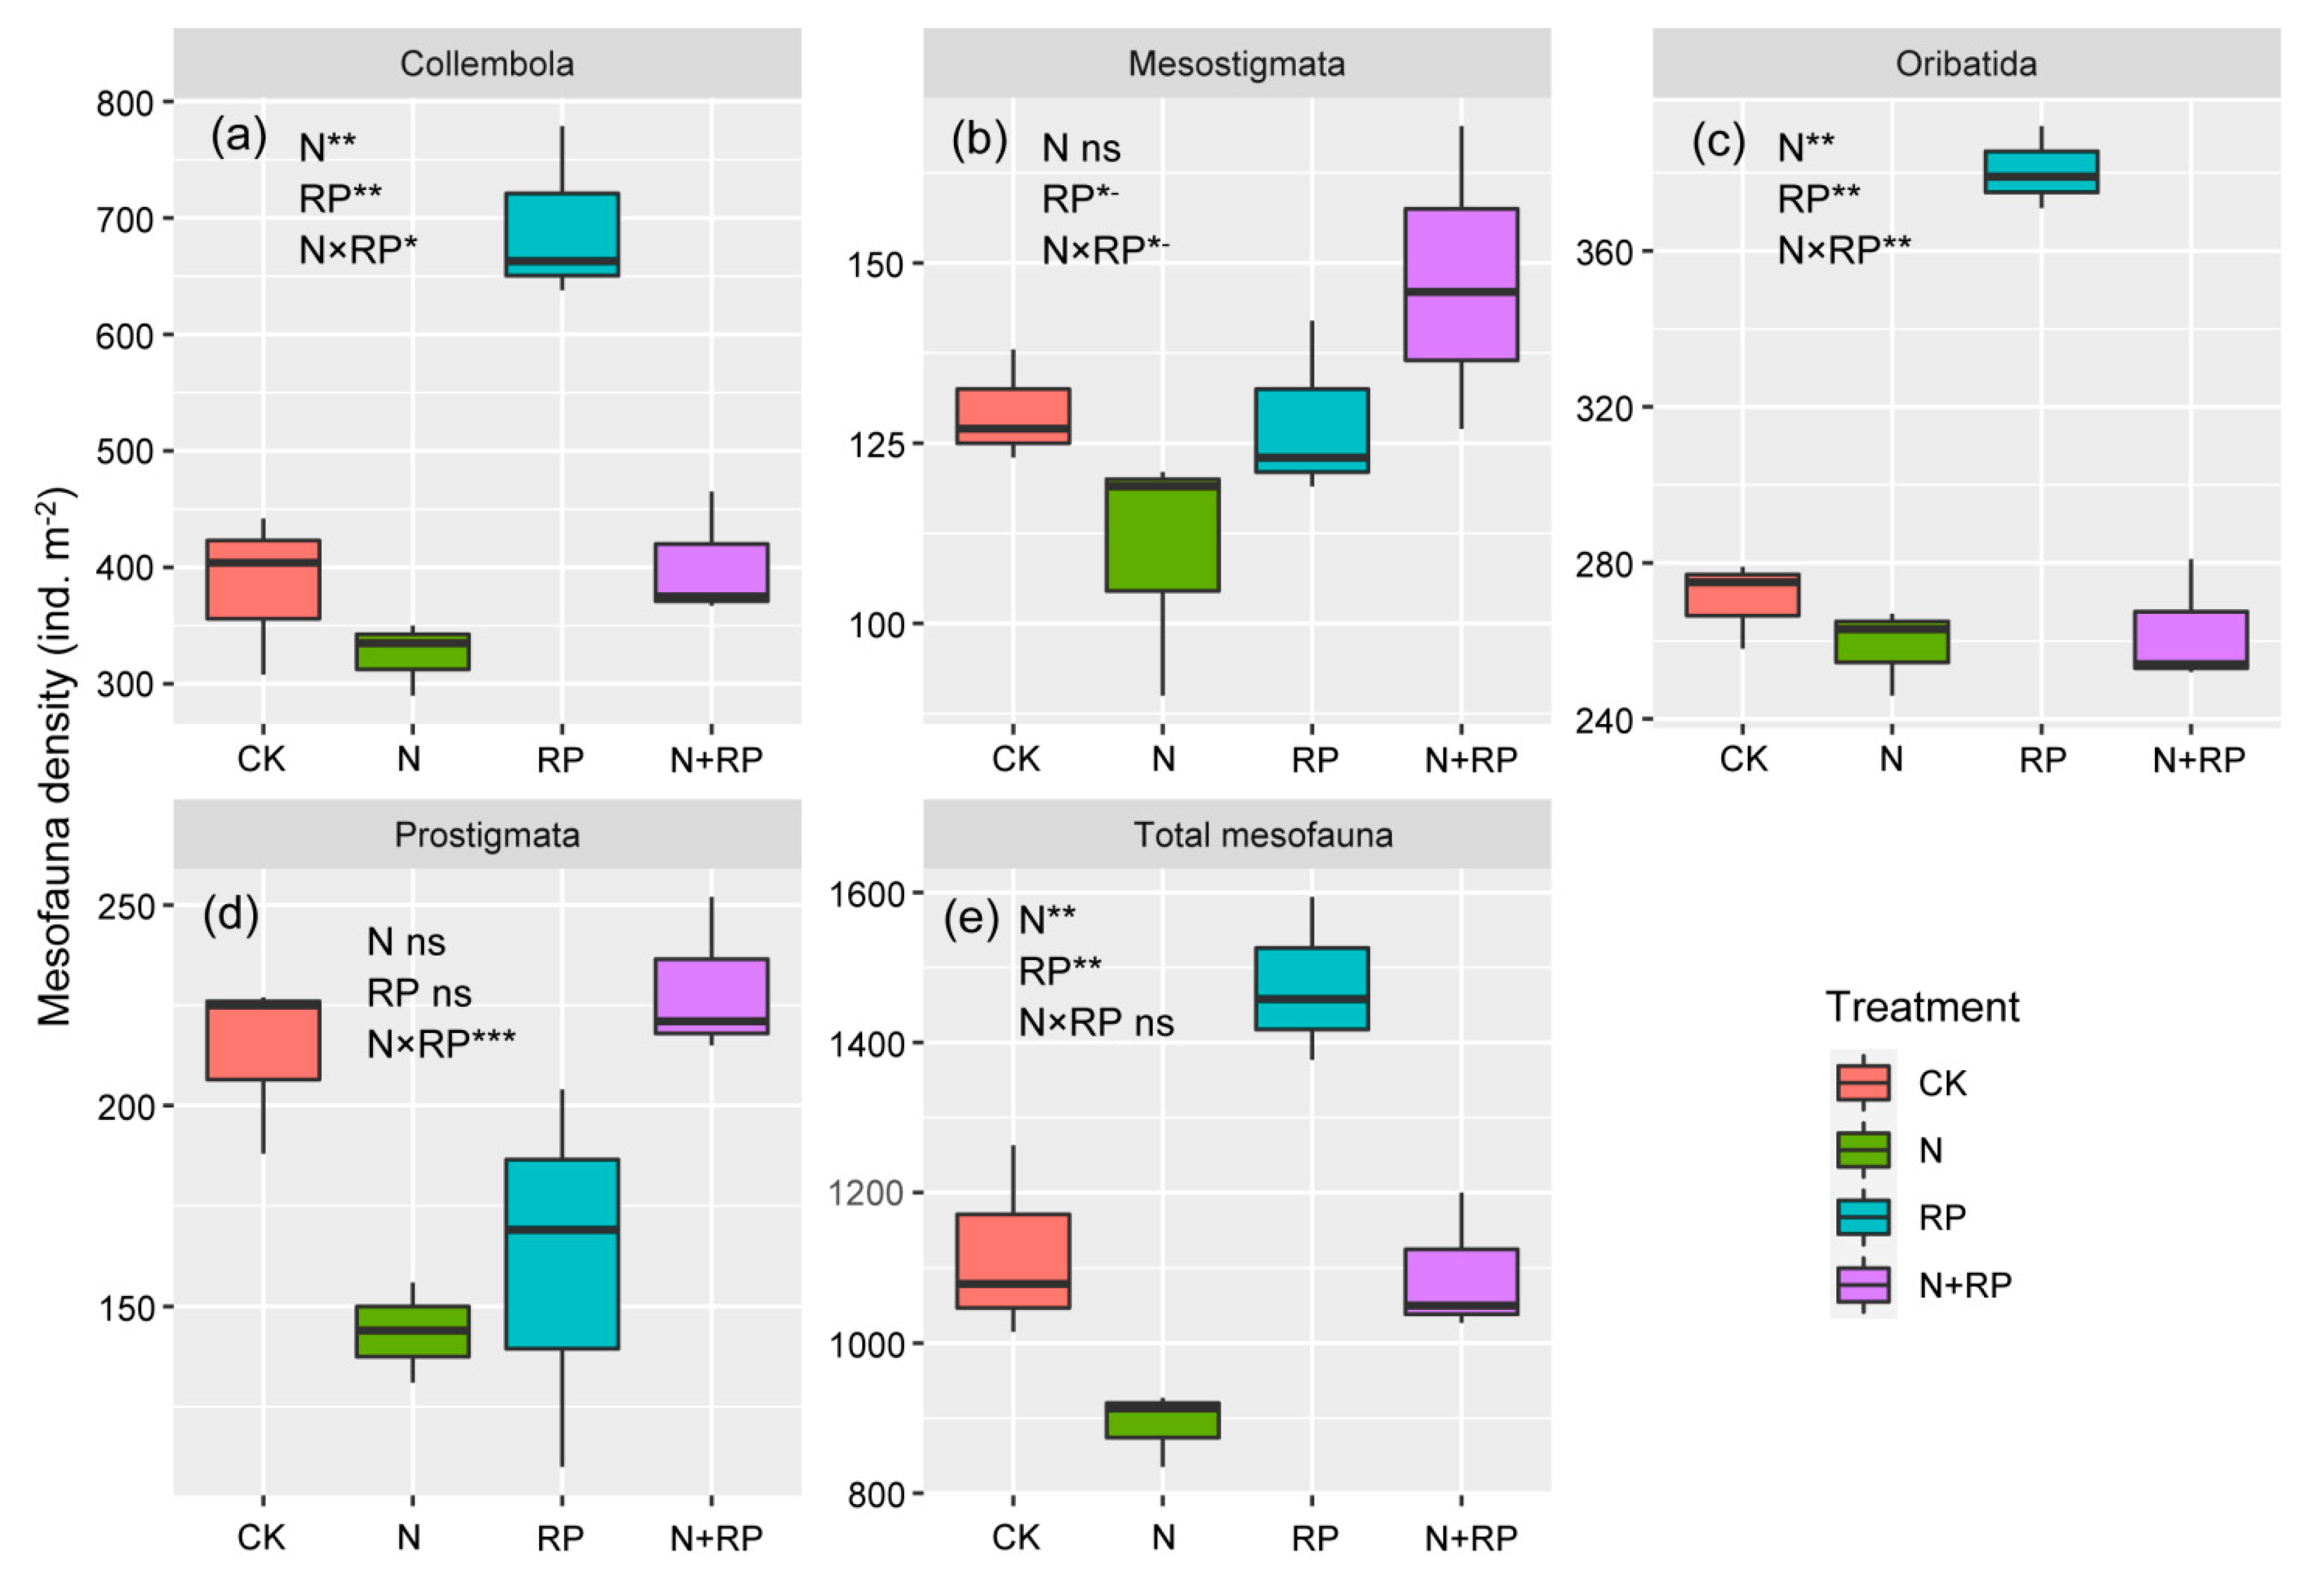
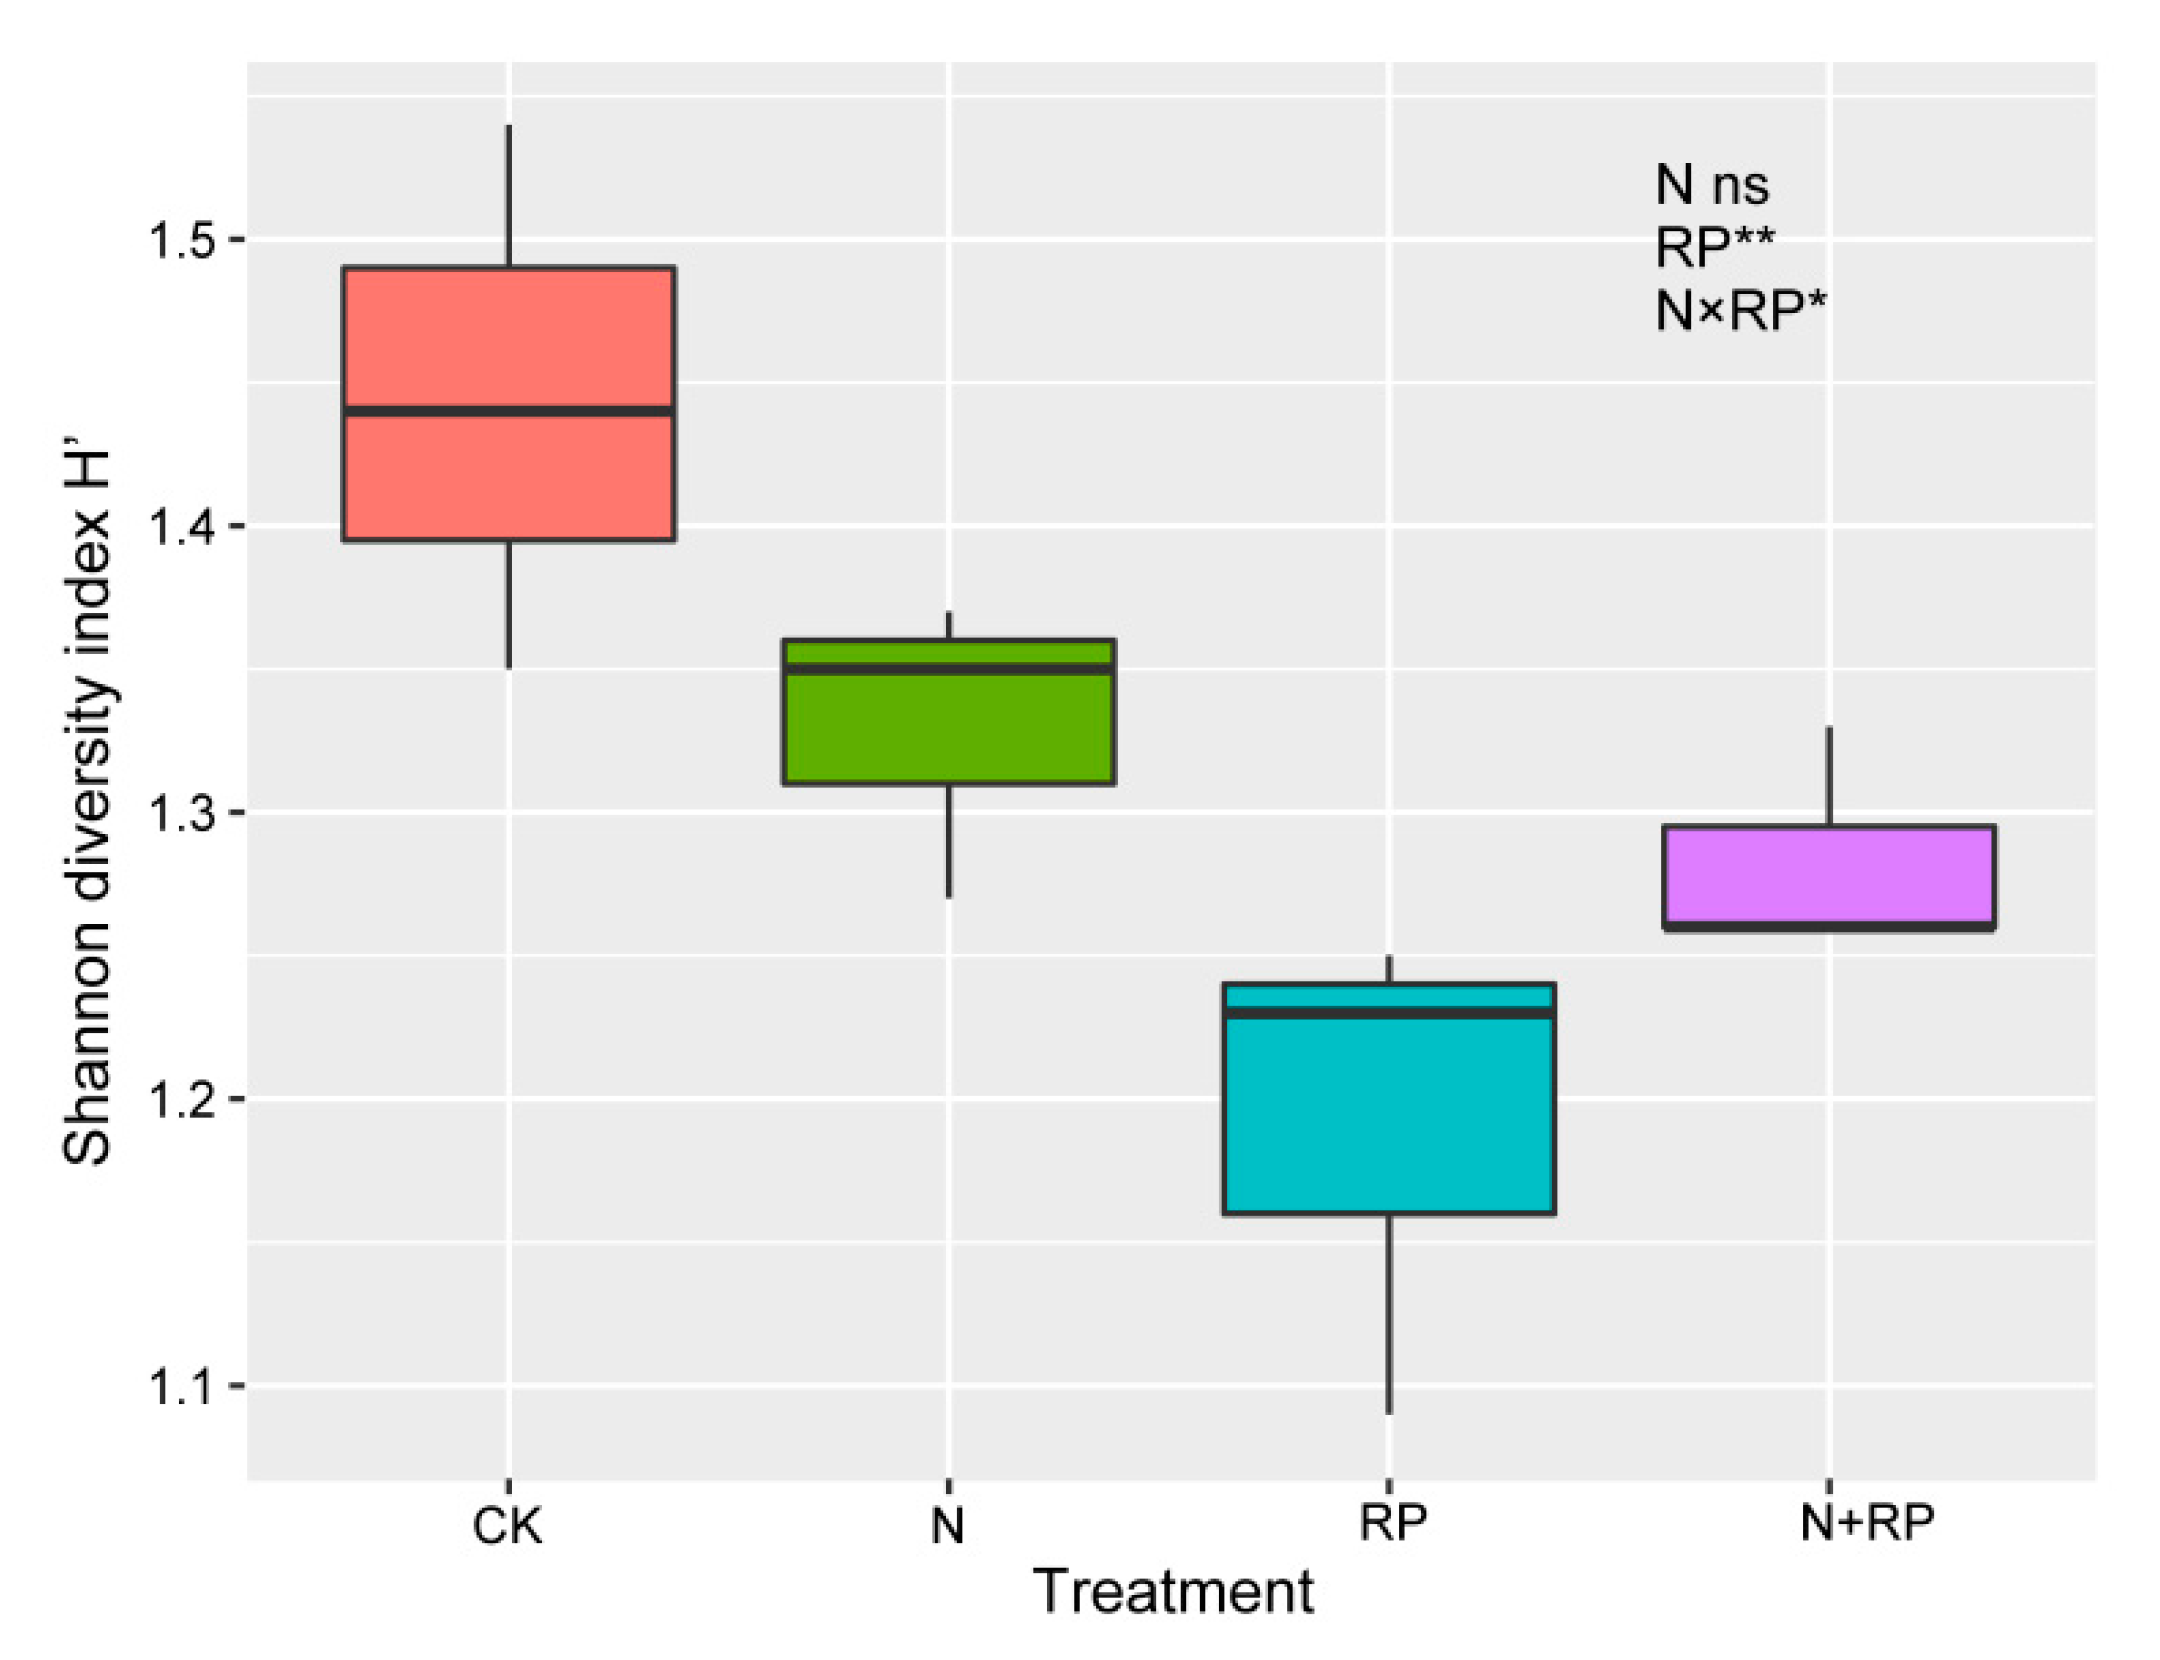
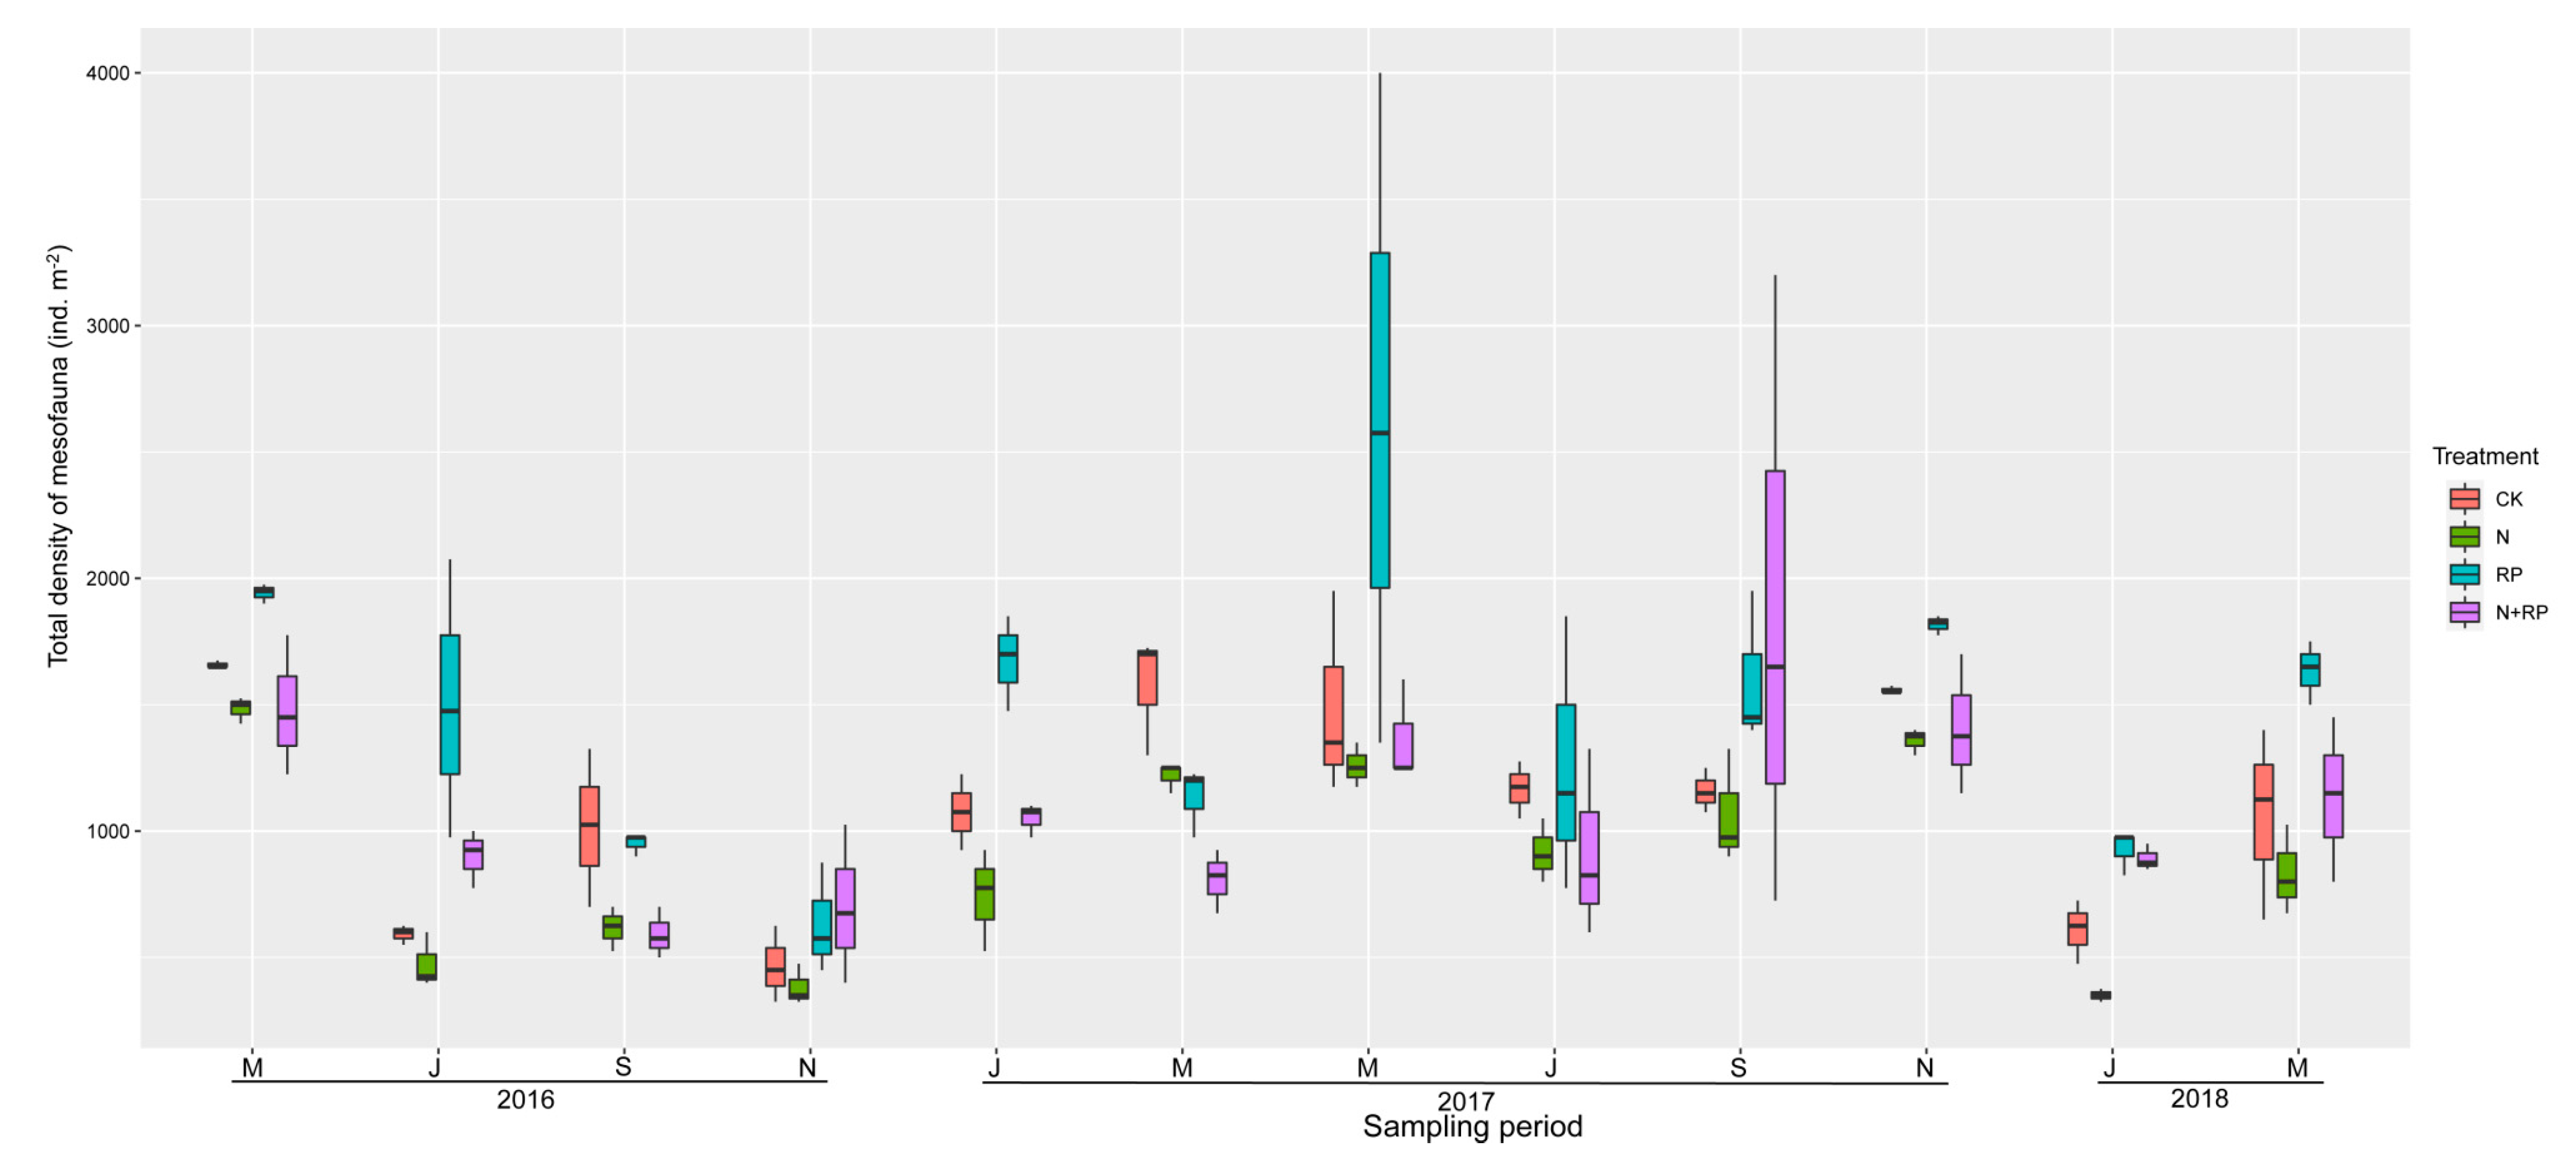
3.2. Density and Diversity of Mesofauna
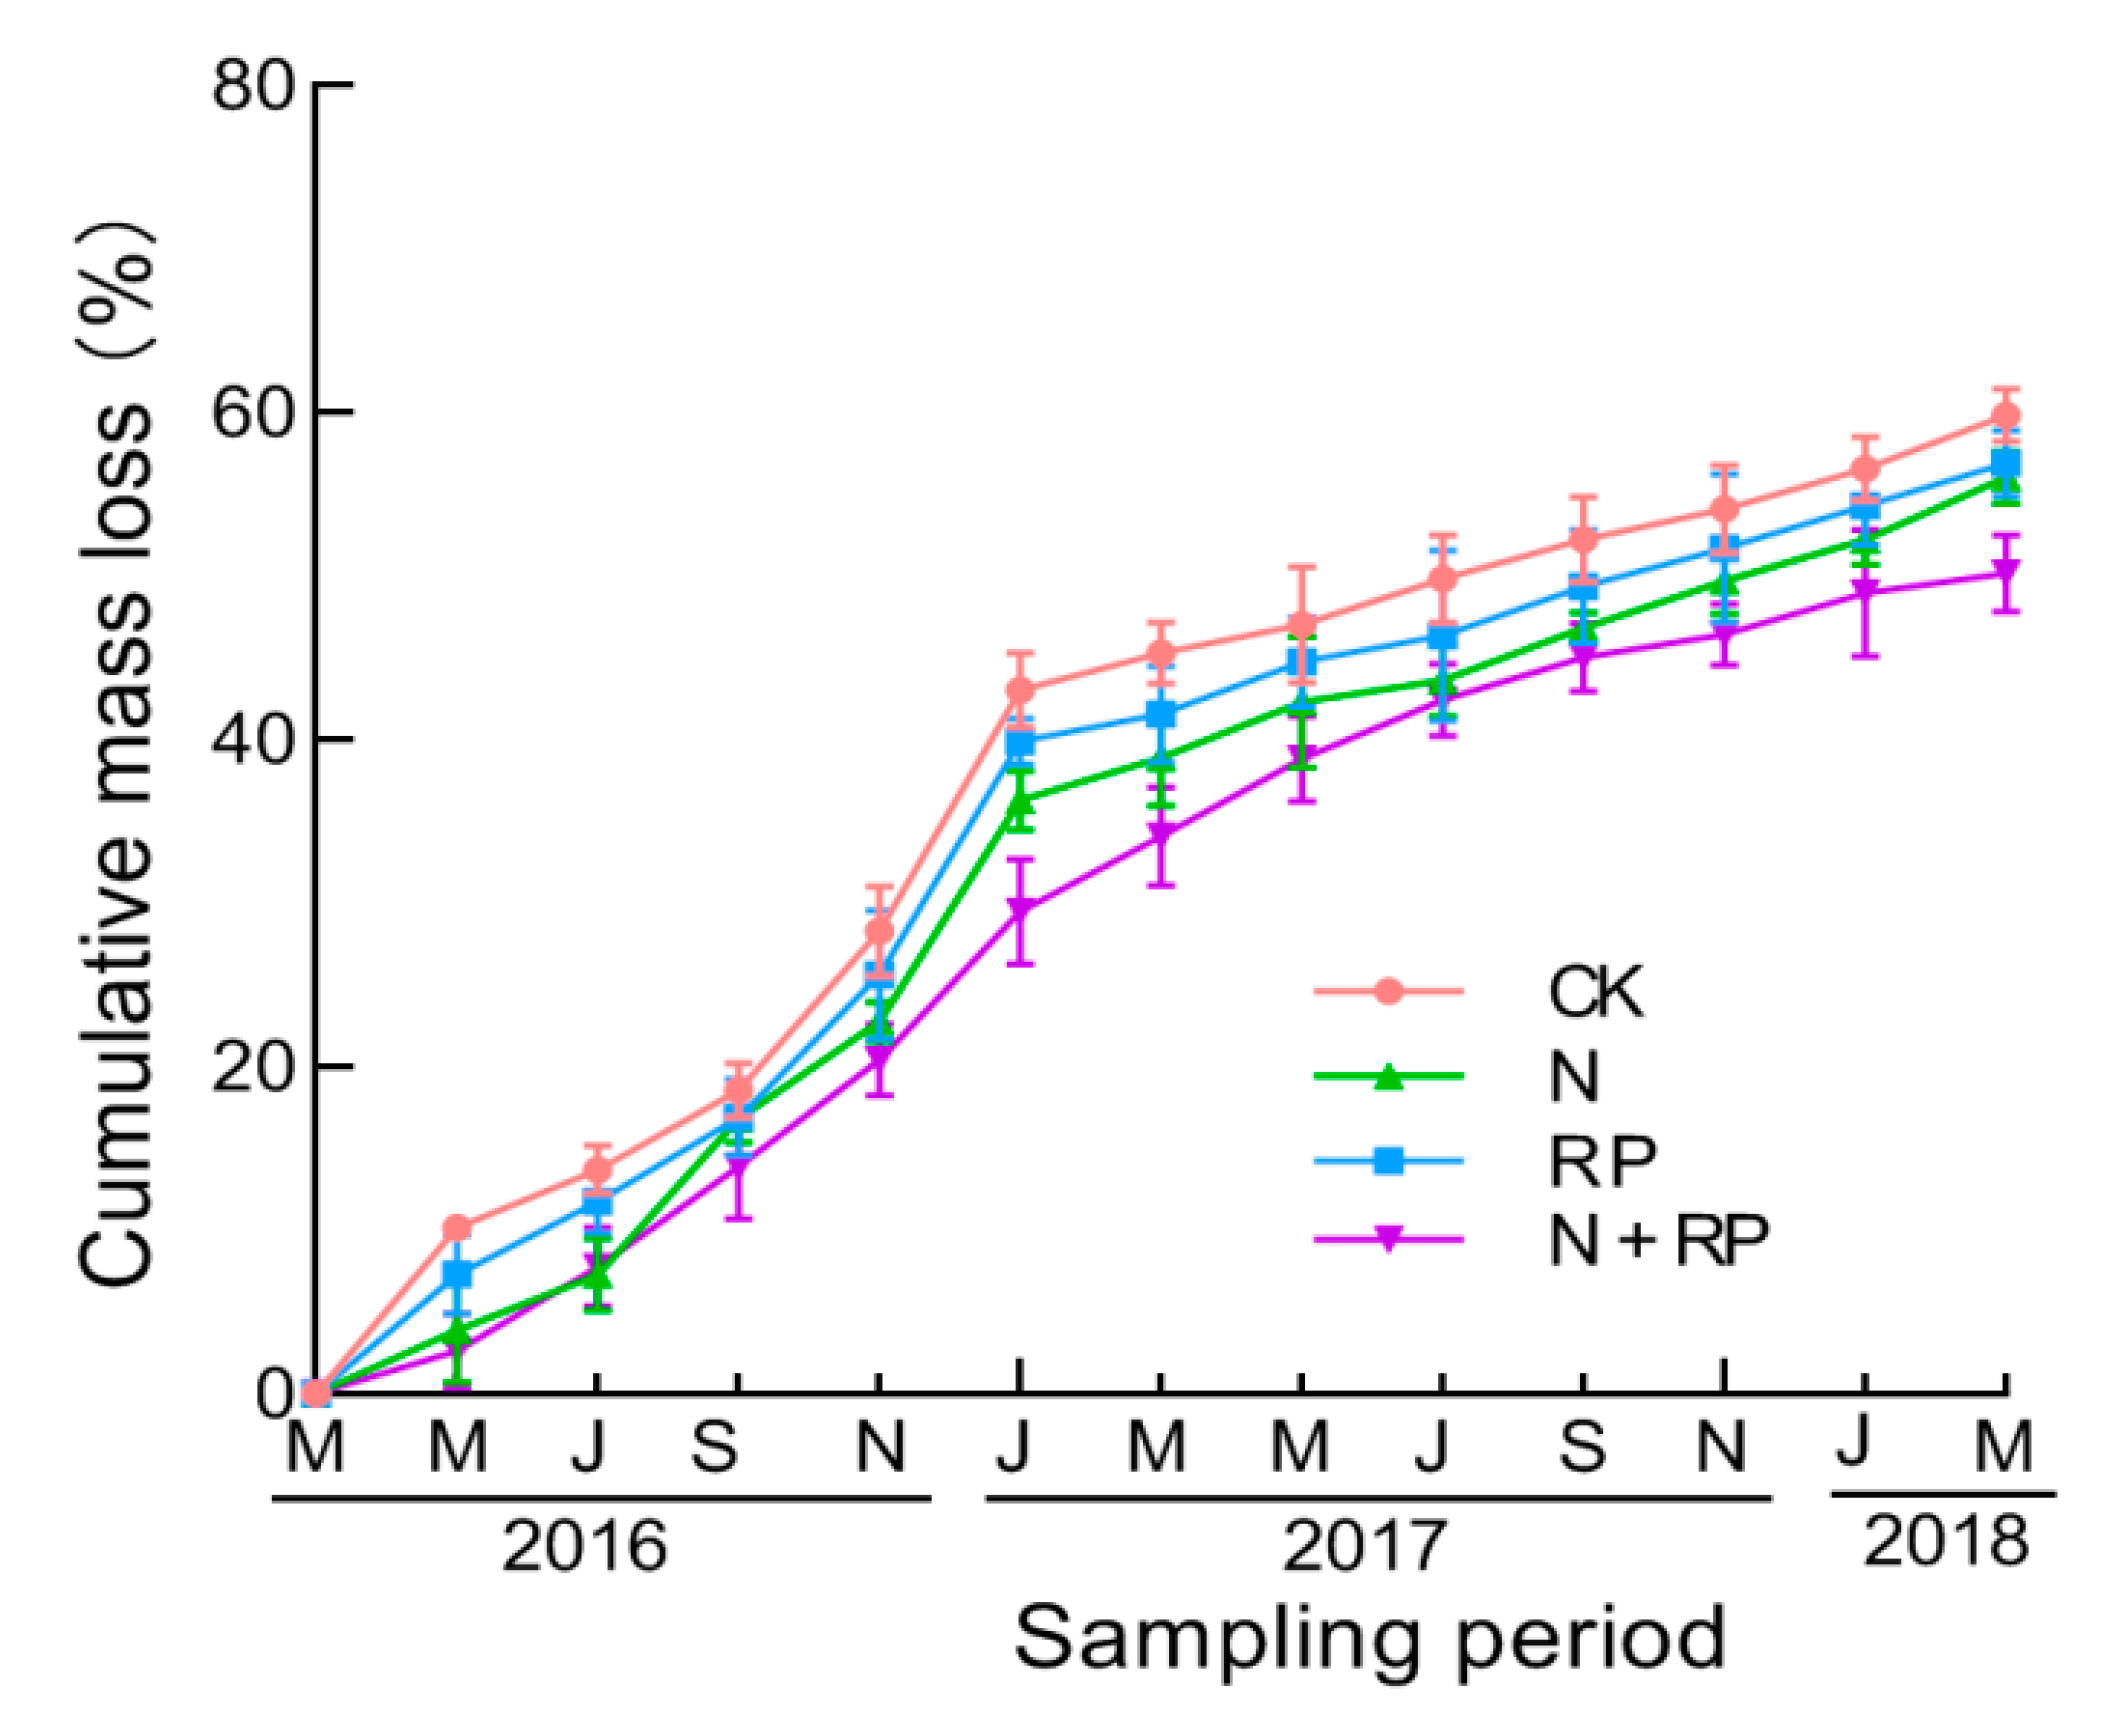
3.3. Litter Cumulative Mass Loss
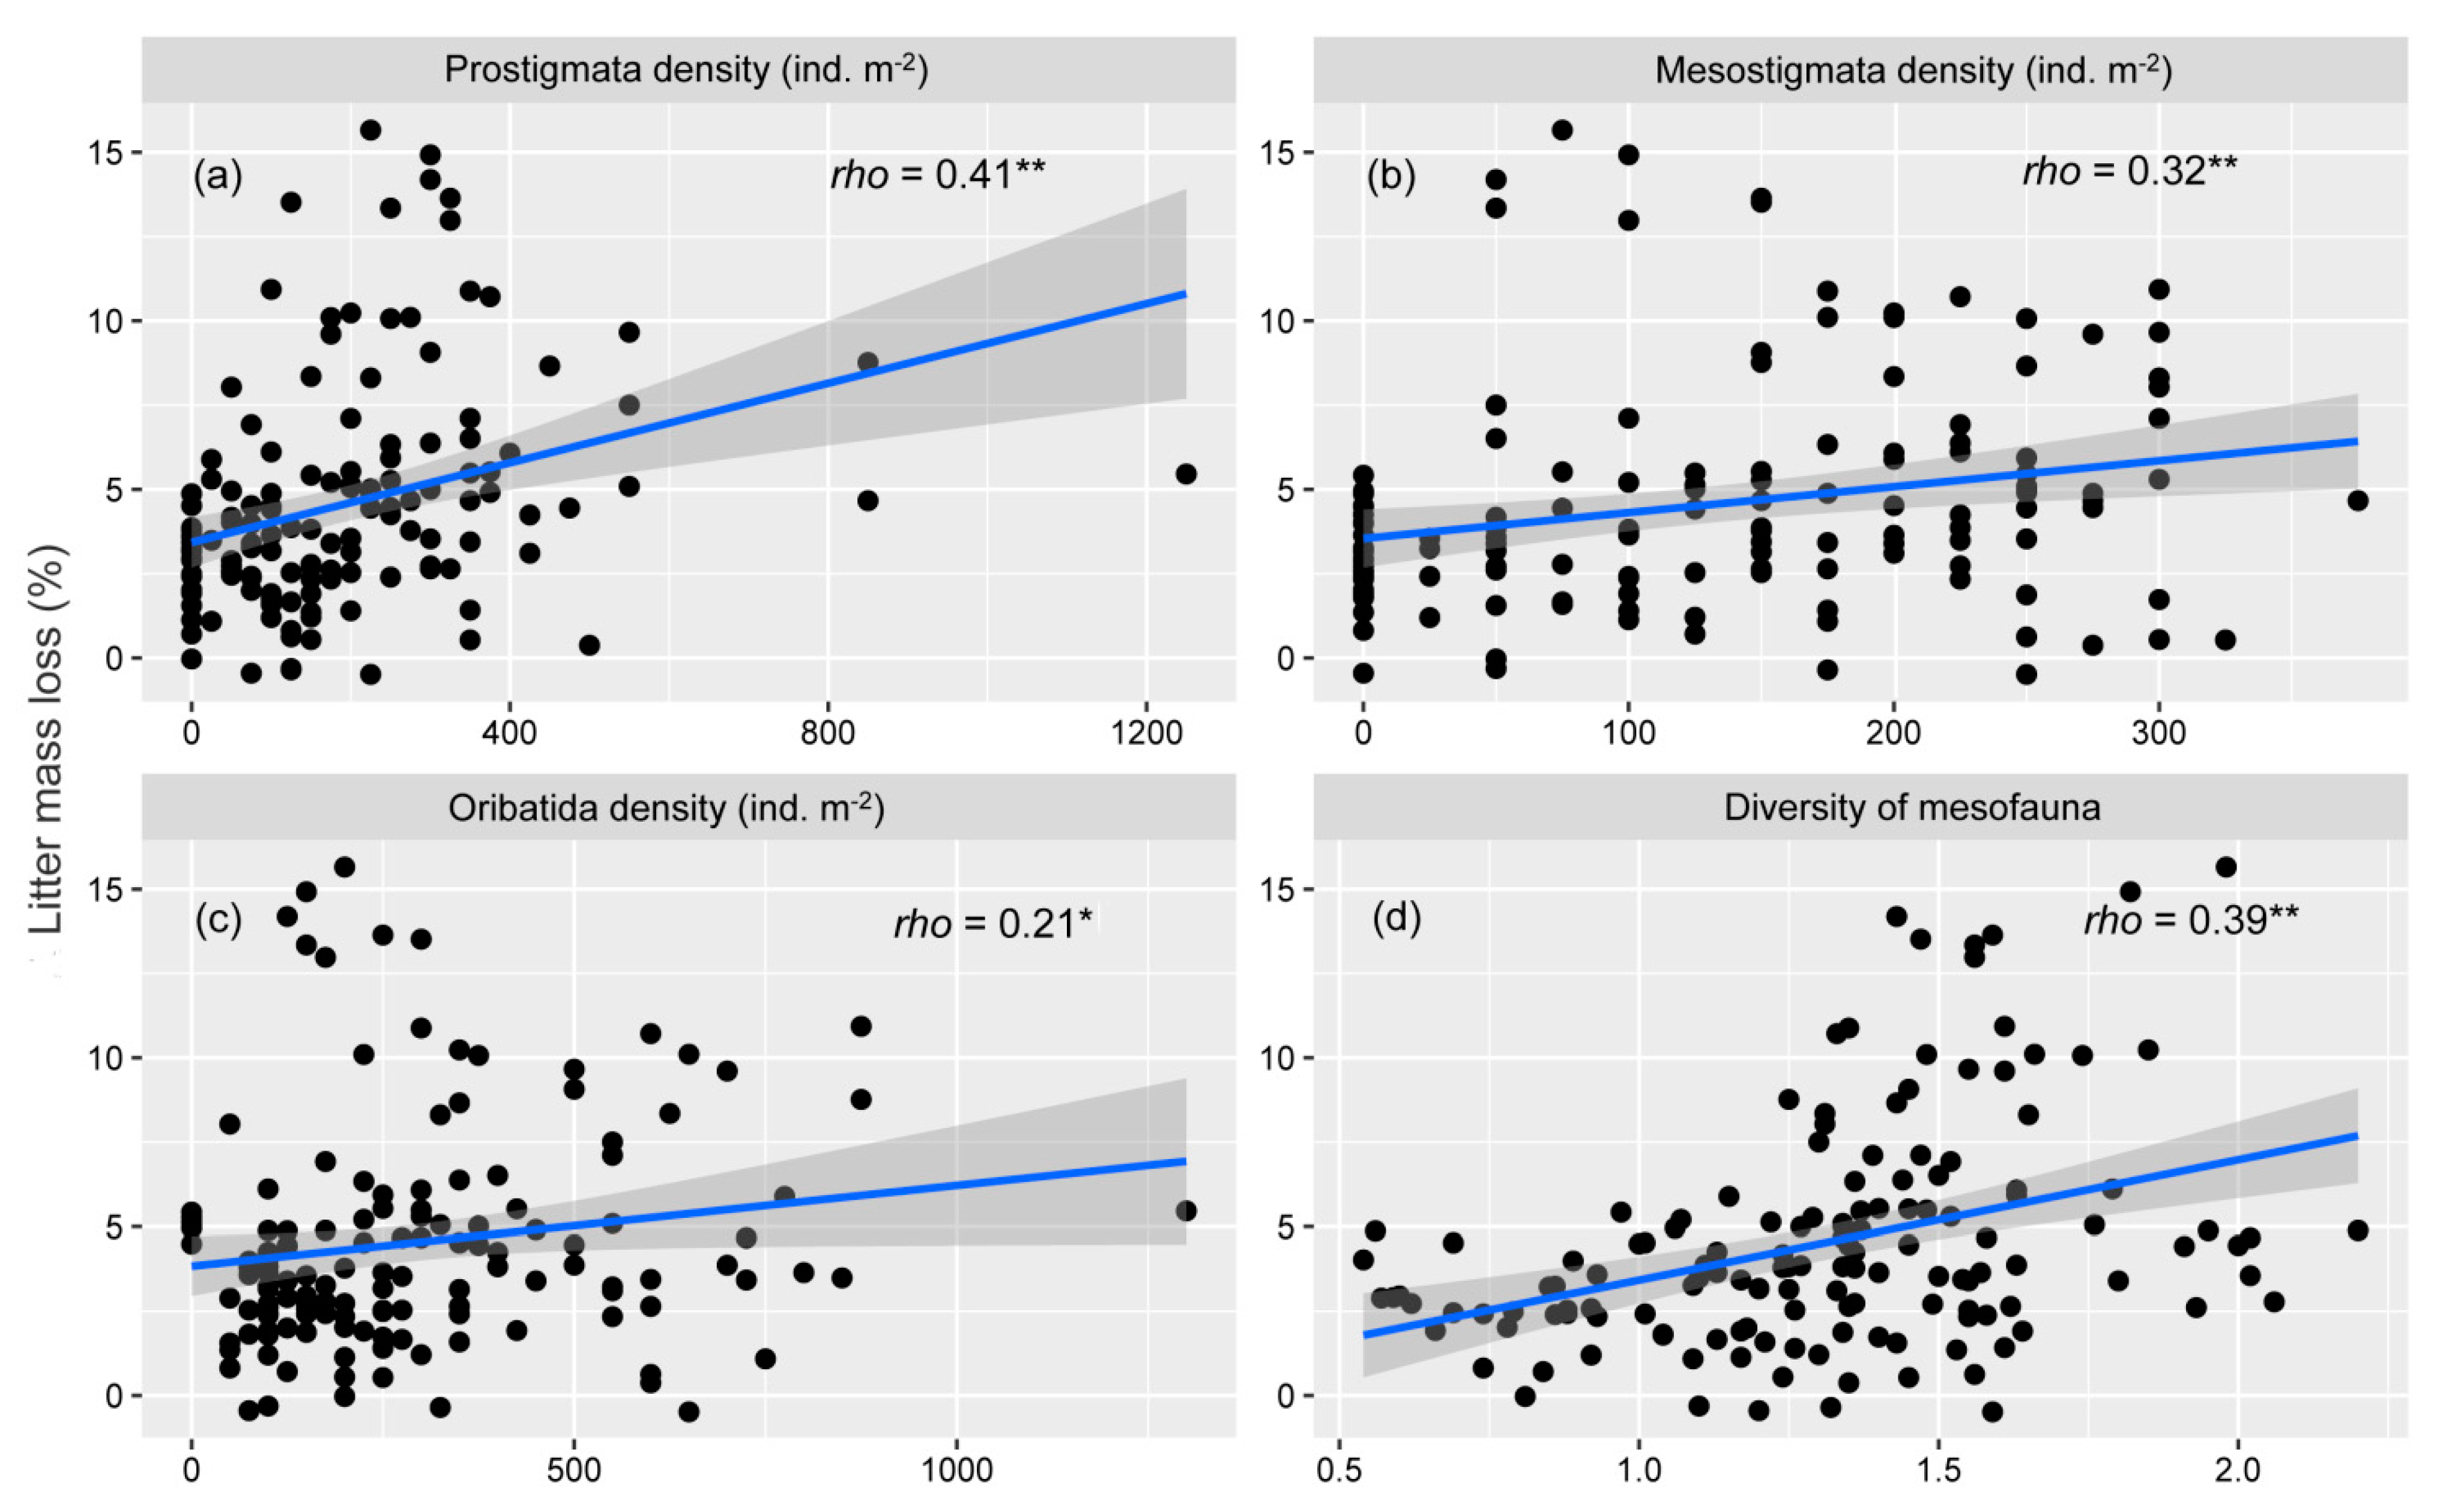
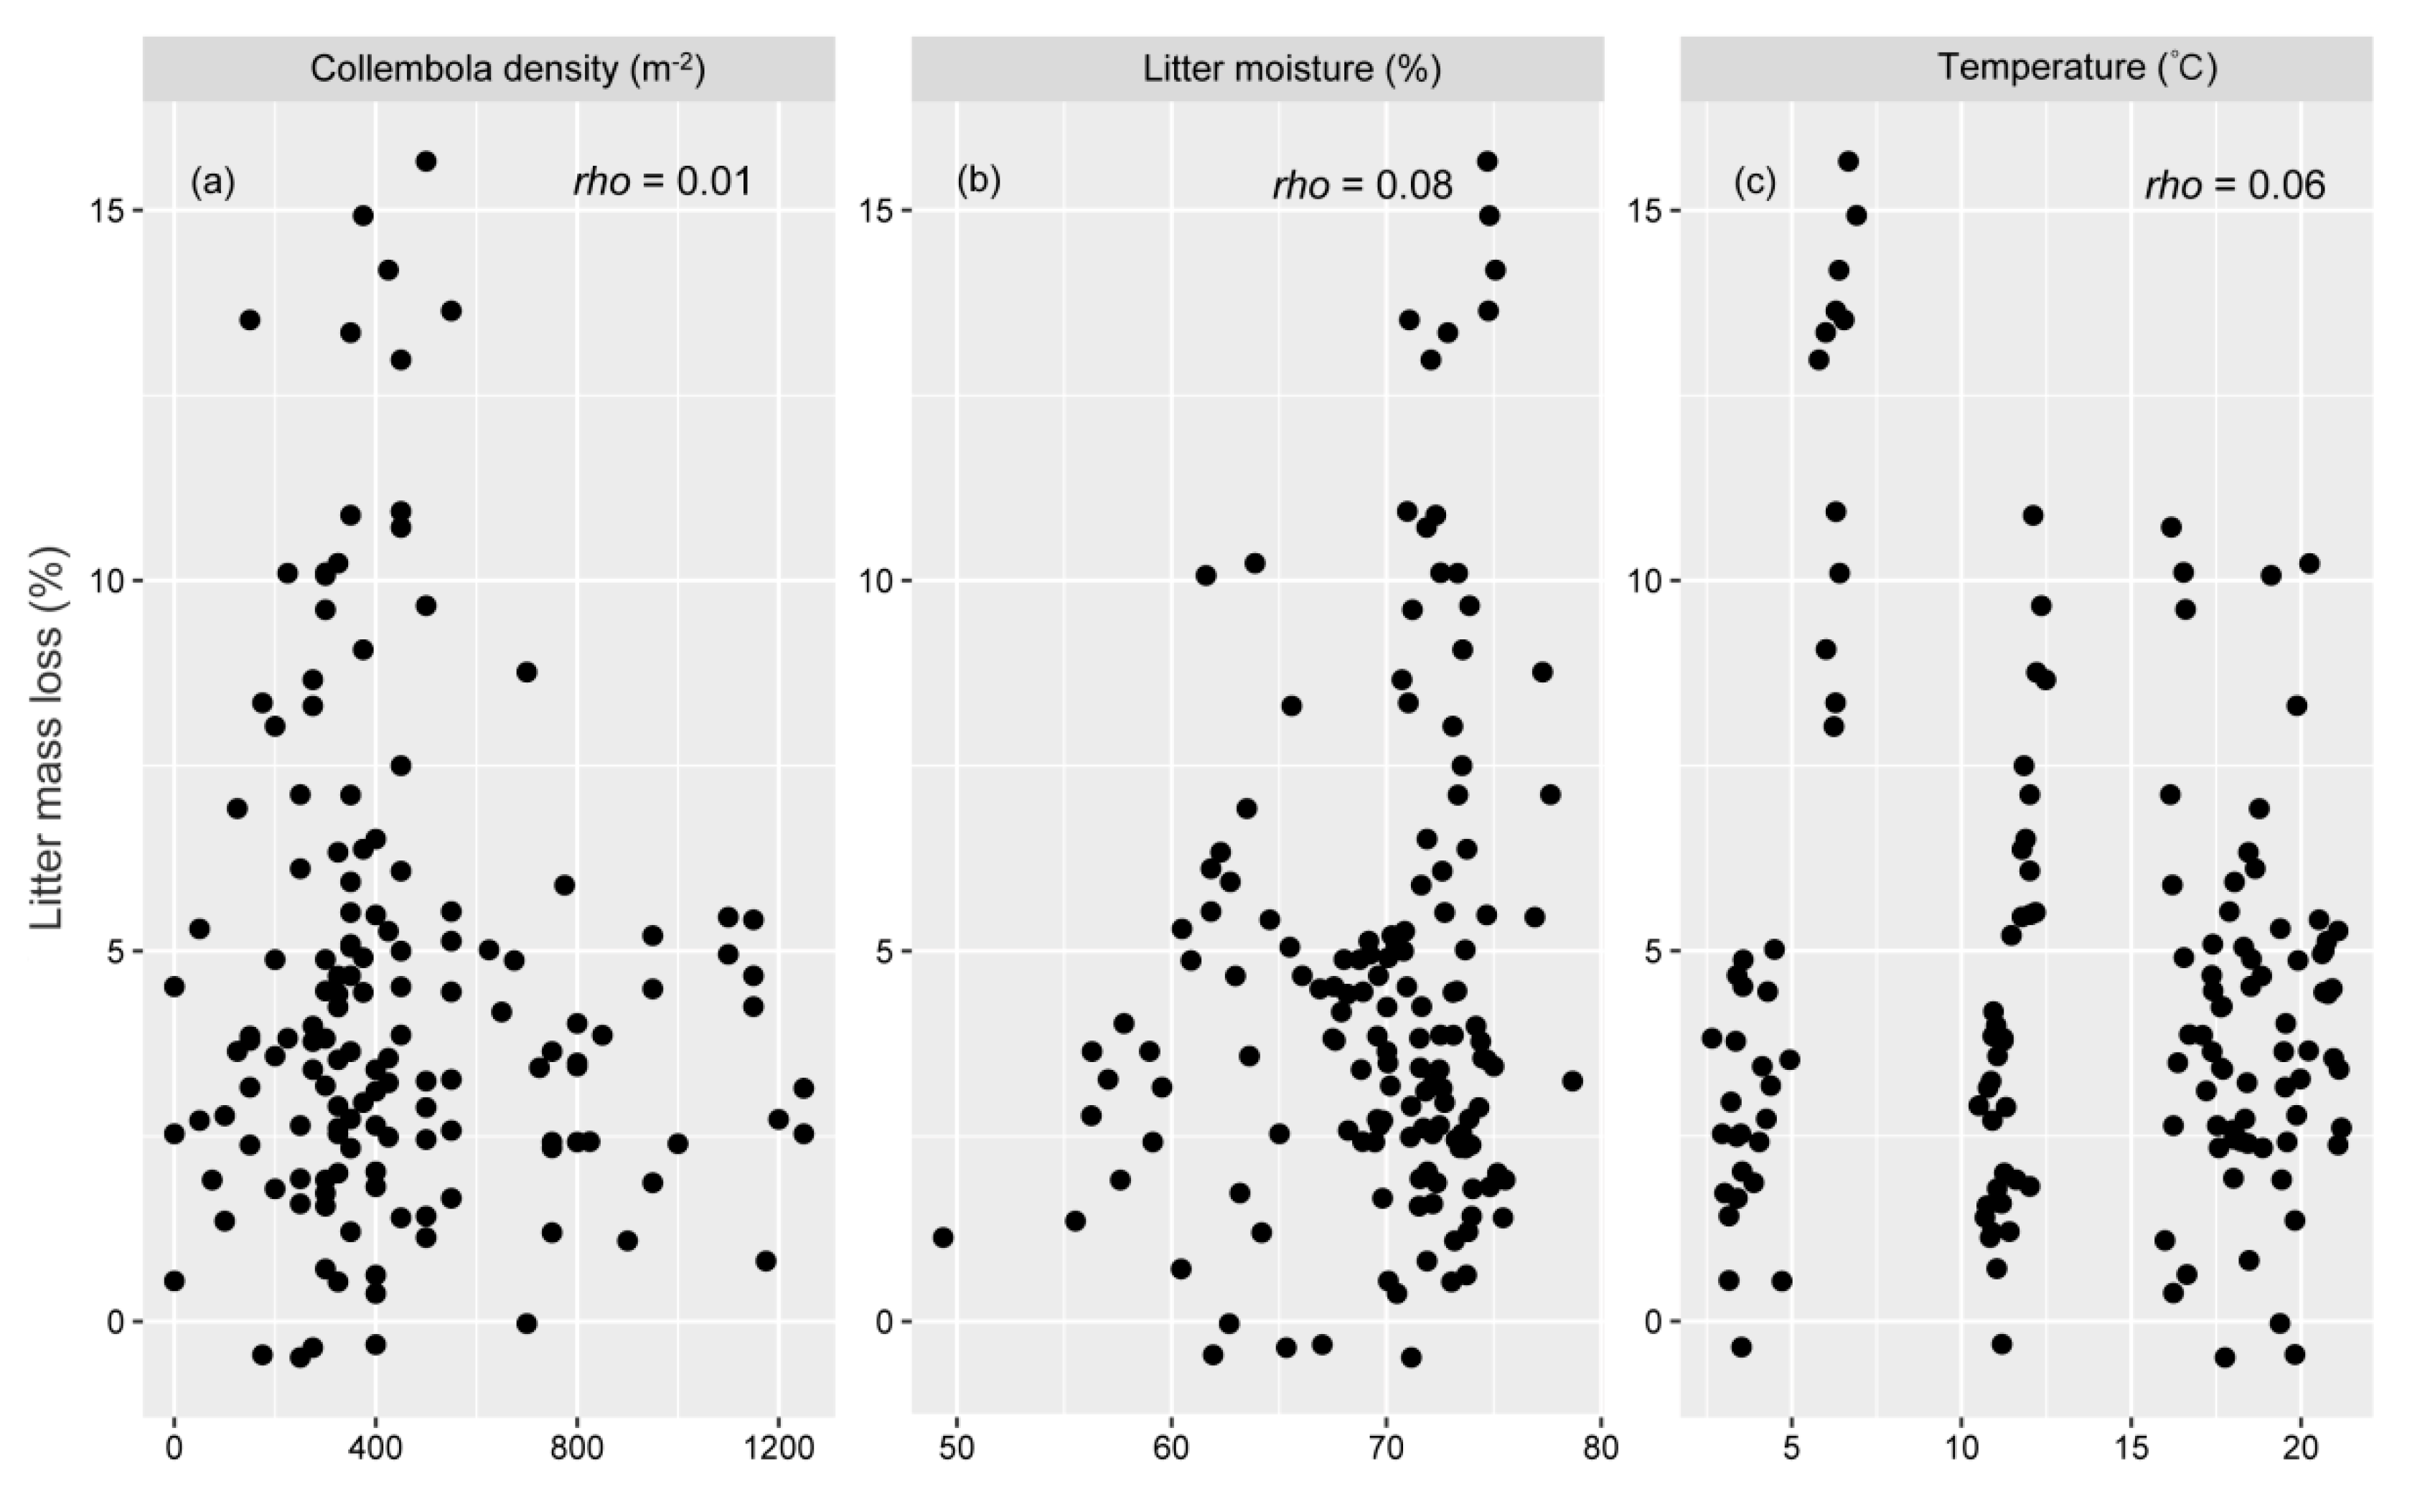
3.4. The Relationship between Litter Mass Loss and the Mesofaunal Community as well as Microclimate
4. Discussion
5. Conclusions
Author Contributions
Funding
Data Availability Statement
Conflicts of Interest
Appendix A


References
- Vitousek, P.M.; Aber, J.D.; Howarth, R.W.; Likens, G.E.; Matson, P.A.; Schindler, D.W.; Schlesinger, W.H.; Tilman, D.G. Human alteration of the global nitrogen cycle: Sources and consequences. Ecol. Appl. 1997, 7, 737–750. [Google Scholar] [CrossRef]
- Galloway, J.N.; Townsend, A.R.; Erisman, J.W.; Bekunda, M.; Cai, Z.; Freney, J.R.; Martinelli, L.A.; Seitzinger, S.P.; Sutton, M.A. Transformation of the nitrogen cycle: Recent trends, questions, and potential solutions. Science 2008, 320, 889–892. [Google Scholar] [CrossRef] [PubMed]
- Kanakidou, M.; Myriokefalitakis, S.; Daskalakis, N.; Fanourgakis, G.; Nenes, A.; Baker, A.R.; Tsigaridis, K.; Mihalopoulos, N. Past, Present, and Future Atmospheric Nitrogen Deposition. J. Atmos. Sci. 2016, 73, 2039–2047. [Google Scholar] [CrossRef] [PubMed]
- Dore, M.H.I. Climate change and changes in global precipitation patterns: What do we know? Environ. Int. 2005, 31, 1167–1181. [Google Scholar] [CrossRef] [PubMed]
- Rillig, M.C.; Ryo, M.; Lehmann, A.; Aguilar-Trigueros, C.A.; Buchert, S.; Wulf, A.; Iwasaki, A.; Roy, J.; Yang, G. The role of multiple global change factors in driving soil functions and microbial biodiversity. Science 2019, 366, 886–890. [Google Scholar] [CrossRef]
- Bradford, M.A.; Berg, B.; Maynard, D.S.; Wieder, W.R.; Wood, S.A. Understanding the dominant controls on litter decomposition. J. Ecol. 2016, 104, 229–238. [Google Scholar] [CrossRef]
- Handa, I.T.; Aerts, R.; Berendse, F.; Berg, M.P.; Bruder, A.; Butenschoen, O.; Chauvet, E.; Gessner, M.O.; Jabiol, J.; Makkonen, M.; et al. Consequences of biodiversity loss for litter decomposition across biomes. Nature 2014, 509, 218–221. [Google Scholar] [CrossRef]
- Frouz, J. Effects of soil macro- and mesofauna on litter decomposition and soil organic matter stabilization. Geoderma 2018, 332, 161–172. [Google Scholar] [CrossRef]
- Peng, Y.; Vesterdal, L.; Peñuelas, J.; Peguero, G.; Wu, Q.; Heděnec, P.; Yue, K.; Wu, F. Soil fauna effects on litter decomposition are better predicted by fauna communities within litterbags than by ambient soil fauna communities. Plant Soil 2023, 1–11. [Google Scholar] [CrossRef]
- Fujii, S.; Berg, M.P.; Cornelissen, J.H.C. Living litter: Dynamic trait spectra predict fauna composition. Trends Ecol. Evol. 2020, 35, 886–896. [Google Scholar] [CrossRef]
- Ke, X.; Winter, K.; Filser, J. Effects of soil mesofauna and farming management on decomposition of clover litter: A microcosm experiment. Soil Biol. Biochem. 2005, 37, 731–738. [Google Scholar] [CrossRef]
- Wall, D.H.; Bradford, M.A.; St John, M.G.; Trofymow, J.A.; Behan-Pelletier, V.; Bignell, D.D.E.; Dangerfield, J.M.; Parton, W.J.; Rusek, J.; Voigt, W.; et al. Global decomposition experiment shows soil animal impacts on decomposition are climate-dependent. Glob. Change Biol. 2008, 14, 2661–2677. [Google Scholar] [CrossRef]
- Schaefer, M.; Migge-Kleian, S.; Scheu, S. The role of soil fauna for decomposition of plant residues. In Functioning and Management of European Beech Ecosystems; Springer: Berlin, Germany, 2009; pp. 207–230. [Google Scholar] [CrossRef]
- Nijssen, M.E.; WallisDeVries, M.F.; Siepel, H. Pathways for the effects of increased nitrogen deposition on fauna. Biol. Conserv. 2017, 212, 423–431. [Google Scholar] [CrossRef]
- Hu, J.; Zhou, S.; Tie, L.; Liu, X.; Liu, X.; Zhao, A.; Lai, J.; Xiao, L.; You, C.; Huang, C. Effects of nitrogen addition on soil faunal abundance: A global meta-analysis. Glob. Ecol. Biogeogr. 2022, 31, 1655–1666. [Google Scholar] [CrossRef]
- Tie, L.; Wei, S.; Peñuelas, J.; Sardans, J.; Peguero, G.; Zhou, S.; Liu, X.; Hu, J.; Huang, C. Phosphorus addition reverses the negative effect of nitrogen addition on soil arthropods during litter decomposition in a subtropical forest. Sci. Total Environ. 2021, 781, 146786. [Google Scholar] [CrossRef]
- Van der Wal, A.; Geerts, R.; Korevaar, H.; Schouten, A.; op Akkerhuis, G.J.; Rutgers, M.; Mulder, C. Dissimilar response of plant and soil biota communities to long-term nutrient addition in grasslands. Biol. Fertil. Soils 2009, 45, 663–667. [Google Scholar] [CrossRef]
- Sjursen, H.; Michelsen, A.; Jonasson, S. Effects of long-term soil warming and fertilisation on microarthropod abundances in three sub-arctic ecosystems. Appl. Soil Ecol. 2005, 30, 148–161. [Google Scholar] [CrossRef]
- Xu, G.-L.; Schleppi, P.; Li, M.-H.; Fu, S.-L. Negative responses of Collembola in a forest soil (Alptal, Switzerland) under experimentally increased N deposition. Environ. Pollut. 2009, 157, 2030–2036. [Google Scholar] [CrossRef]
- Song, L.; Liu, J.; Yan, X.; Chang, L.; Wu, D. Euedaphic and hemiedaphic Collembola suffer larger damages than epedaphic species to nitrogen input. Environ. Pollut. 2016, 208, 413–415. [Google Scholar] [CrossRef]
- Trentini, C.P.; Villagra, M.; Gómez Pámies, D.; Laborde, V.B.; Bedano, J.C.; Campanello, P.I. Effect of nitrogen addition and litter removal on understory vegetation, soil mesofauna, and litter decomposition in loblolly pine plantations in subtropical Argentina. For. Ecol. Manag. 2018, 429, 133–142. [Google Scholar] [CrossRef]
- Cole, L.; Buckland, S.M.; Bardgett, R.D. Influence of disturbance and nitrogen addition on plant and soil animal diversity in grassland. Soil Biol. Biochem. 2008, 40, 505–514. [Google Scholar] [CrossRef]
- Zhao, J.; Zhang, W.; Wang, K.; Song, T.; Du, H. Responses of the soil nematode community to management of hybrid napiergrass: The trade-off between positive and negative effects. Appl. Soil Ecol. 2014, 75, 134–144. [Google Scholar] [CrossRef]
- Liu, T.; Chen, X.; Hu, F.; Ran, W.; Shen, Q.; Li, H.; Whalen, J.K. Carbon-rich organic fertilizers to increase soil biodiversity: Evidence from a meta-analysis of nematode communities. Agric. Ecosyst. Environ. 2016, 232, 199–207. [Google Scholar] [CrossRef]
- Blankinship, J.C.; Niklaus, P.A.; Hungate, B.A. A meta-analysis of responses of soil biota to global change. Oecologia 2011, 165, 553–565. [Google Scholar] [CrossRef] [PubMed]
- Nielsen, U.N.; Ball, B.A. Impacts of altered precipitation regimes on soil communities and biogeochemistry in arid and semi-arid ecosystems. Glob. Change Biol. 2015, 21, 1407–1421. [Google Scholar] [CrossRef]
- Thakur, M.P.; Del Real, I.M.; Cesarz, S.; Steinauer, K.; Reich, P.B.; Hobbie, S.; Ciobanu, M.; Rich, R.; Worm, K.; Eisenhauer, N. Soil microbial, nematode, and enzymatic responses to elevated CO2, N fertilization, warming, and reduced precipitation. Soil Biol. Biochem. 2019, 135, 184–193. [Google Scholar] [CrossRef]
- Santonja, M.; Rancon, A.; Fromin, N.; Baldy, V.; Hättenschwiler, S.; Fernandez, C.; Montès, N.; Mirleau, P. Plant litter diversity increases microbial abundance, fungal diversity, and carbon and nitrogen cycling in a Mediterranean shrubland. Soil Biol. Biochem. 2017, 111, 124–134. [Google Scholar] [CrossRef]
- Eisenhauer, N.; Cesarz, S.; Koller, R.; Worm, K.; Reich, P.B. Global change belowground: Impacts of elevated CO2, nitrogen, and summer drought on soil food webs and biodiversity. Glob. Change Biol. 2012, 18, 435–447. [Google Scholar] [CrossRef]
- Bardgett, R.D.; van der Putten, W.H. Belowground biodiversity and ecosystem functioning. Nature 2014, 515, 505–511. [Google Scholar] [CrossRef]
- Zhou, S.; Xiang, Y.; Tie, L.; Han, B.; Huang, C. Simulated nitrogen deposition significantly reduces soil respiration in an evergreen broadleaf forest in western China. PLoS ONE 2018, 13, e0204661. [Google Scholar] [CrossRef]
- Lindberg, N.; Persson, T. Effects of long-term nutrient fertilisation and irrigation on the microarthropod community in a boreal Norway spruce stand. For. Ecol. Manag. 2004, 188, 125–135. [Google Scholar] [CrossRef]
- Sylvain, Z.A.; Wall, D.H.; Cherwin, K.L.; Peters, D.P.C.; Reichmann, L.G.; Sala, O.E. Soil animal responses to moisture availability are largely scale, not ecosystem dependent: Insight from a cross-site study. Glob. Change Biol. 2014, 20, 2631–2643. [Google Scholar] [CrossRef]
- Zhu, J.; He, N.; Wang, Q.; Yuan, G.; Wen, D.; Yu, G.; Jia, Y. The composition, spatial patterns, and influencing factors of atmospheric wet nitrogen deposition in Chinese terrestrial ecosystems. Sci. Total Environ. 2015, 511, 777–785. [Google Scholar] [CrossRef] [PubMed]
- Zhou, S.; Butenschoen, O.; Barantal, S.; Handa, I.T.; Makkonen, M.; Vos, V.; Aerts, R.; Berg, M.P.; McKie, B.; Van Ruijven, J.; et al. Decomposition of leaf litter mixtures across biomes: The role of litter identity, diversity and soil fauna. J. Ecol. 2020, 108, 2283–2297. [Google Scholar] [CrossRef]
- Bradford, M.A.; Tordoff, G.M.; Eggers, T.; Jones, T.H.; Newington, J.E. Microbiota, fauna, and mesh size interactions in litter decomposition. Oikos 2002, 99, 317–323. [Google Scholar] [CrossRef]
- Tu, L.H.; Chen, G.; Peng, Y.; Hu, H.L.; Hu, T.X.; Zhang, J.; Li, X.W.; Liu, L.; Tang, Y. Soil biochemical responses to nitrogen addition in a bamboo forest. PLoS ONE 2014, 9, e102315. [Google Scholar] [CrossRef] [PubMed]
- Zhou, S.; Huang, C.; Xiang, Y.; Tie, L.; Han, B.; Scheu, S. Effects of reduced precipitation on litter decomposition in an evergreen broad-leaved forest in western China. For. Ecol. Manag. 2018, 430, 219–227. [Google Scholar] [CrossRef]
- Zhou, S.; Yan, G.; Hu, J.; Liu, X.; Zou, X.; Tie, L.; Yuan, R.; Yang, Y.; Xiao, L.; Cui, X.; et al. The responses of leaf litter calcium, magnesium, and manganese dynamics to simulated nitrogen deposition and reduced precipitation vary with different decomposition stages. Forests 2021, 12, 1473. [Google Scholar] [CrossRef]
- Zhou, S.; Huang, C.; Han, B.; Xiao, Y.; Tang, J.; Xiang, Y.; Luo, C. Simulated nitrogen deposition significantly suppresses the decomposition of forest litter in a natural evergreen broad-leaved forest in the Rainy Area of Western China. Plant Soil 2017, 420, 135–145. [Google Scholar] [CrossRef]
- Zhou, C.; Cen, S.; Li, Y.; Peng, G.; Yang, S.; Peng, J. Precipitation variation and its impacts in Sichuan in the last 50 years. Acta Geogr. Sin. 2011, 66, 619–630. [Google Scholar]
- Yin, W. Pictorical Keys to Soil Animals of China; Science Press: Beijing, China, 1998. [Google Scholar]
- R Core Team. R: A Language and Environment for Statistical Computing; R Foundation for Statistical Computing: Vienna, Austria, 2020; Available online: https://www.R-project.org/ (accessed on 24 April 2020).
- Treseder, K.K.; Berlemont, R.; Allison, S.D.; Martiny, A.C. Nitrogen enrichment shifts functional genes related to nitrogen and carbon acquisition in the fungal community. Soil Biol. Biochem. 2018, 123, 87–96. [Google Scholar] [CrossRef]
- Meunier, C.L.; Gundale, M.J.; Sánchez, I.S.; Liess, A. Impact of nitrogen deposition on forest and lake food webs in nitrogen-limited environments. Glob. Change Biol. 2016, 22, 164–179. [Google Scholar] [CrossRef] [PubMed]
- Adair, K.L.; Lindgreen, S.; Poole, A.M.; Young, L.M.; Bernard-Verdier, M.; Wardle, D.A.; Tylianakis, J.M. Above and belowground community strategies respond to different global change drivers. Sci. Rep. 2019, 9, 2540. [Google Scholar] [CrossRef] [PubMed]
- Peng, Y.; Li, Y.; Song, S.; Chen, Y.; Chen, G.; Tu, L. Nitrogen addition slows litter decomposition accompanied by accelerated manganese release: A five-year experiment in a subtropical evergreen broadleaf forest. Soil Biol. Biochem. 2022, 165, 108511. [Google Scholar] [CrossRef]
- Treseder, K.K. Nitrogen additions and microbial biomass: A meta-analysis of ecosystem studies. Ecol. Lett. 2008, 11, 1111–1120. [Google Scholar] [CrossRef] [PubMed]
- Greaver, T.L.; Clark, C.M.; Compton, J.E.; Vallano, D.; Talhelm, A.F.; Weaver, C.P.; Band, L.E.; Baron, J.S.; Davidson, E.A.; Tague, C.L.; et al. Key ecological responses to nitrogen are altered by climate change. Nat. Clim. Change 2016, 6, 836–843. [Google Scholar] [CrossRef]
- Bowman, W.D.; Cleveland, C.C.; Halada, Ĺ.; Hreško, J.; Baron, J.S. Negative impact of nitrogen deposition on soil buffering capacity. Nat. Geosci. 2008, 1, 767–770. [Google Scholar] [CrossRef]
- Cole, L.; Buckland, S.M.; Bardgett, R.D. Relating microarthropod community structure and diversity to soil fertility manipulations in temperate grassland. Soil Biol. Biochem. 2005, 37, 1707–1717. [Google Scholar] [CrossRef]
- Fujii, S.; Takeda, H. Succession of soil microarthropod communities during the aboveground and belowground litter decomposition processes. Soil Biol. Biochem. 2017, 110, 95–102. [Google Scholar] [CrossRef]
- Melguizo-Ruiz, N.; Jimenez-Navarro, G.; De Mas, E.; Pato, J.; Scheu, S.; Austin, A.T.; Wise, D.H.; Moya-Larano, J. Field exclusion of large soil predators impacts lower trophic levels, and decreases leaf-litter decomposition in dry forests. J. Anim. Ecol. 2019, 89, 334–346. [Google Scholar] [CrossRef]
- Li, Y.; Li, D.; Yang, S.; Liu, C.; Zhong, A.; Li, Y. Characteristics of the precipitation over the eastern edge of the Tibetan Plateau. Meteorol. Atmos. Phys. 2010, 106, 49–56. [Google Scholar] [CrossRef]
- Turnbull, M.S.; Lindo, Z. Combined effects of abiotic factors on Collembola communities reveal precipitation may act as a disturbance. Soil Biol. Biochem. 2015, 82, 36–43. [Google Scholar] [CrossRef]
- Wei, X.; Cao, R.; Wu, X.; Eisenhauer, N.; Sun, S. Effect of water table decline on the abundances of soil mites, springtails, and nematodes in the Zoige peatland of eastern Tibetan Plateau. Appl. Soil Ecol. 2018, 129, 77–83. [Google Scholar] [CrossRef]
- Lindberg, N.; Engtsson, J.B.; Persson, T. Effects of experimental irrigation and drought on the composition and diversity of soil fauna in a coniferous stand. J. Appl. Ecol. 2002, 39, 924–936. [Google Scholar] [CrossRef]
- Makkonen, M.; Berg, M.P.; van Hal, J.R.; Callaghan, T.V.; Press, M.C.; Aerts, R. Traits explain the responses of a sub-arctic Collembola community to climate manipulation. Soil Biol. Biochem. 2011, 43, 377–384. [Google Scholar] [CrossRef]
- Maraldo, K.; Krogh, P.H.; van der Linden, L.; Christensen, B.; Mikkelsen, T.N.; Beier, C.; Holmstrup, M. The counteracting effects of elevated atmospheric CO2 concentrations and drought episodes: Studies of enchytraeid communities in a dry heathland. Soil Biol. Biochem. 2010, 42, 1958–1966. [Google Scholar] [CrossRef]


| Factors | N | RP | Sampling Period | N × RP | N × Sampling Period | RP × Sampling Period | N × RP × Sampling Period | |
|---|---|---|---|---|---|---|---|---|
| Litter moisture | F | 0.10 | 16.90 | 45.33 | 0.01 | 1.56 | 2.73 | 3.16 |
| P | 0.757 | 0.003 | <0.001 | 0.943 | 0.126 | 0.004 | 0.001 | |
| Litter temperature | F | 0.07 | 3.12 | 10,814.15 | 1.02 | 13.16 | 2.48 | 2.27 |
| P | 0.799 | 0.115 | <0.001 | 0.342 | <0.001 | 0.009 | 0.017 | |
| Litter cumulative mass loss | F | 4.70 | 12.77 | 4368.03 | 2.09 | 3.18 | 11.34 | 2.63 |
| P | 0.062 | 0.007 | <0.001 | 0.187 | 0.001 | <0.001 | 0.006 | |
| Taxa | Treatment | ||||
|---|---|---|---|---|---|
| CK | N | RP | N + RP | ||
| Araneae | Segestriidae | 9 | 0 | 0 | 0 |
| Pholcidae | 12 | 0 | 0 | 0 | |
| Filistatidae | 51 | 54 | 132 | 60 | |
| Theridiidae | 30 | 9 | 0 | 12 | |
| Oonopidae | 24 | 0 | 0 | 0 | |
| Prostigmata | Pygmephoridae | 921 | 621 | 696 | 990 |
| Mesostigmata | Laelapidae | 558 | 450 | 552 | 636 |
| Parasitidae | 0 | 12 | 0 | 0 | |
| Veigaiidae | 0 | 12 | 0 | 0 | |
| Oribatida | Damaeidae | 1170 | 1104 | 1644 | 1134 |
| Phthiracaridae | 0 | 12 | 0 | 0 | |
| Diptera larvae | Therevidae | 0 | 3 | 0 | 0 |
| Phoridae | 0 | 0 | 9 | 0 | |
| Trichoceridae | 24 | 9 | 3 | 12 | |
| Pachyneuridae | 9 | 0 | 0 | 0 | |
| Ceratopogonidae | 0 | 0 | 0 | 42 | |
| Rhagionidae | 0 | 0 | 6 | 0 | |
| Tabanidae | 0 | 0 | 6 | 12 | |
| Lonchaeidae | 9 | 0 | 0 | 0 | |
| Scatopsidae | 30 | 66 | 60 | 18 | |
| Muscidae | 9 | 0 | 9 | 0 | |
| Mycetophilidae | 0 | 0 | 9 | 0 | |
| Collembola | Poduridae | 45 | 33 | 12 | 0 |
| Sminthuridae | 51 | 45 | 15 | 36 | |
| Paronellidae | 9 | 12 | 9 | 0 | |
| Isotomidae | 0 | 0 | 42 | 27 | |
| Onychiuridae | 1557 | 1314 | 2916 | 1674 | |
| Isopoda | Porcellionidae | 6 | 0 | 0 | 0 |
| Armadillidiidae | 0 | 6 | 0 | 0 | |
| Trachelipidae | 48 | 9 | 0 | 6 | |
| Lepidoptera larvae | Noctuidae | 6 | 0 | 0 | 0 |
| Notodontidae | 0 | 18 | 0 | 0 | |
| Hepialidae | 0 | 0 | 9 | 0 | |
| Tortricidae | 9 | 0 | 6 | 0 | |
| Saturniidae | 9 | 0 | 6 | 0 | |
| Geometridae | 21 | 0 | 6 | 0 | |
| Pseudoscorpionida | Chthonidae | 9 | 12 | 33 | 9 |
| Coleoptera larvae | Endomychidae | 0 | 0 | 6 | 0 |
| Ptiliidae | 0 | 0 | 0 | 6 | |
| Silphidae | 0 | 0 | 9 | 6 | |
| Mycetophagidae | 0 | 6 | 12 | 0 | |
| Staphylinidae | 18 | 0 | 0 | 0 | |
| Scydmaenidae | 15 | 0 | 0 | 0 | |
| Thysanoptera | Phlaeothripidae | 0 | 0 | 9 | 0 |
| Hymenoptera | Formicidae | 138 | 24 | 153 | 21 |
| Isoptera | Termitidae | 12 | 21 | 0 | 12 |
| Geophilomorpha | Geophilidae | 24 | 0 | 9 | 6 |
| ∑ | 4833 | 3852 | 6378 | 4719 | |
| Factors | N | RP | Sampling Period | N × RP | N × Sampling Period | RP × Sampling Period | N × RP × Sampling Period | |
|---|---|---|---|---|---|---|---|---|
| Total density of mesofauna | F | 28.17 | 23.52 | 14.86 | 1.86 | 1.23 | 2.79 | 0.92 |
| P | 0.001 | 0.001 | <0.001 | 0.210 | 0.281 | 0.004 | 0.528 | |
| Prostigmata density | F | 0.00 | 0.95 | 19.84 | 16.15 | 3.63 | 2.44 | 4.21 |
| P | 0.968 | 0.332 | <0.001 | <0.001 | <0.001 | <0.001 | <0.001 | |
| Mesostigmata density | F | 0.00 | 4.13 | 43.32 | 4.80 | 3.65 | 9.13 | 2.78 |
| P | 1.000 | 0.076 | <0.001 | 0.060 | <0.001 | <0.001 | 0.004 | |
| Oribatida density | F | 12.76 | 9.71 | 33.11 | 8.34 | 4.42 | 5.56 | 1.66 |
| P | 0.001 | 0.002 | < 0.001 | 0.005 | <0.001 | <0.001 | 0.094 | |
| Collembola density | F | 25.65 | 30.98 | 10.04 | 11.15 | 1.78 | 9.06 | 2.01 |
| P | 0.001 | 0.001 | <0.001 | 0.010 | 0.069 | < 0.001 | 0.037 | |
| Shannon diversity of mesofauna | F | 0.04 | 13.36 | 35.376 | 6.87 | 3.13 | 16.03 | 2.99 |
| P | 0.848 | 0.006 | <0.001 | 0.031 | 0.001 | <0.001 | 0.002 | |
Disclaimer/Publisher’s Note: The statements, opinions and data contained in all publications are solely those of the individual author(s) and contributor(s) and not of MDPI and/or the editor(s). MDPI and/or the editor(s) disclaim responsibility for any injury to people or property resulting from any ideas, methods, instructions or products referred to in the content. |
© 2023 by the authors. Licensee MDPI, Basel, Switzerland. This article is an open access article distributed under the terms and conditions of the Creative Commons Attribution (CC BY) license (https://creativecommons.org/licenses/by/4.0/).
Share and Cite
Zhou, S.; Hu, J.; Liu, X.; Zou, X.; Xiao, L.; Cao, D.; Tu, L.; Cui, X.; Huang, C. The Response of Mesofauna to Nitrogen Deposition and Reduced Precipitation during Litter Decomposition. Forests 2023, 14, 1112. https://doi.org/10.3390/f14061112
Zhou S, Hu J, Liu X, Zou X, Xiao L, Cao D, Tu L, Cui X, Huang C. The Response of Mesofauna to Nitrogen Deposition and Reduced Precipitation during Litter Decomposition. Forests. 2023; 14(6):1112. https://doi.org/10.3390/f14061112
Chicago/Turabian StyleZhou, Shixing, Junxi Hu, Xiong Liu, Xingcheng Zou, Lin Xiao, Dongyu Cao, Lihua Tu, Xinglei Cui, and Congde Huang. 2023. "The Response of Mesofauna to Nitrogen Deposition and Reduced Precipitation during Litter Decomposition" Forests 14, no. 6: 1112. https://doi.org/10.3390/f14061112