
Use of Functional Traits to Distinguish Successional Guilds of Tree Species for Restoring Forest Ecosystems
 , ,
, ,
Abstract
:1. Introduction
2. Materials and Methods
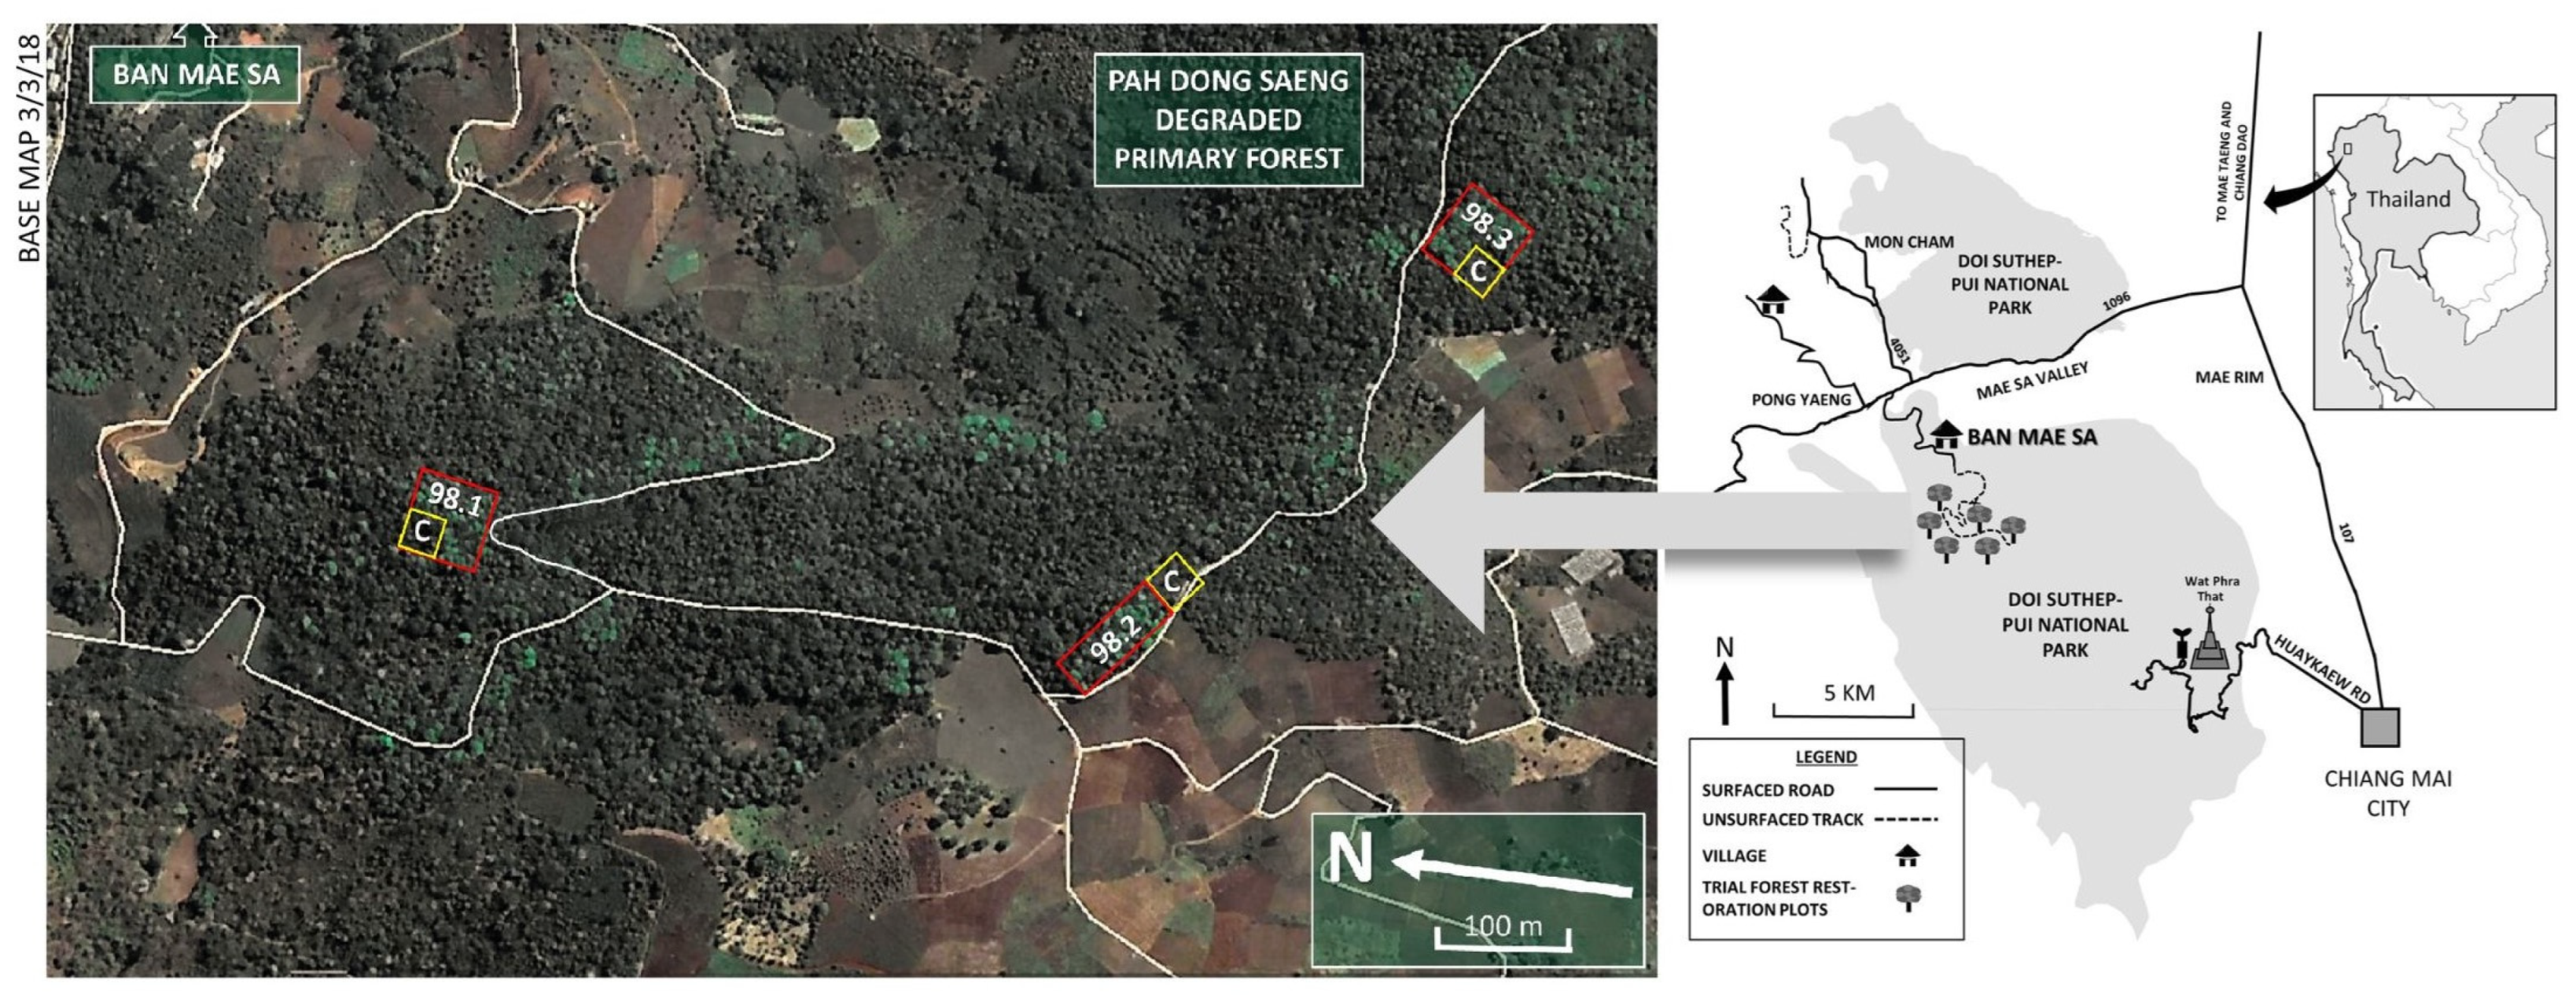
2.1. Study Site
2.2. Plot Establishment and Monitoring
2.3. Links between Functional Traits and Successional Status Used in This Study
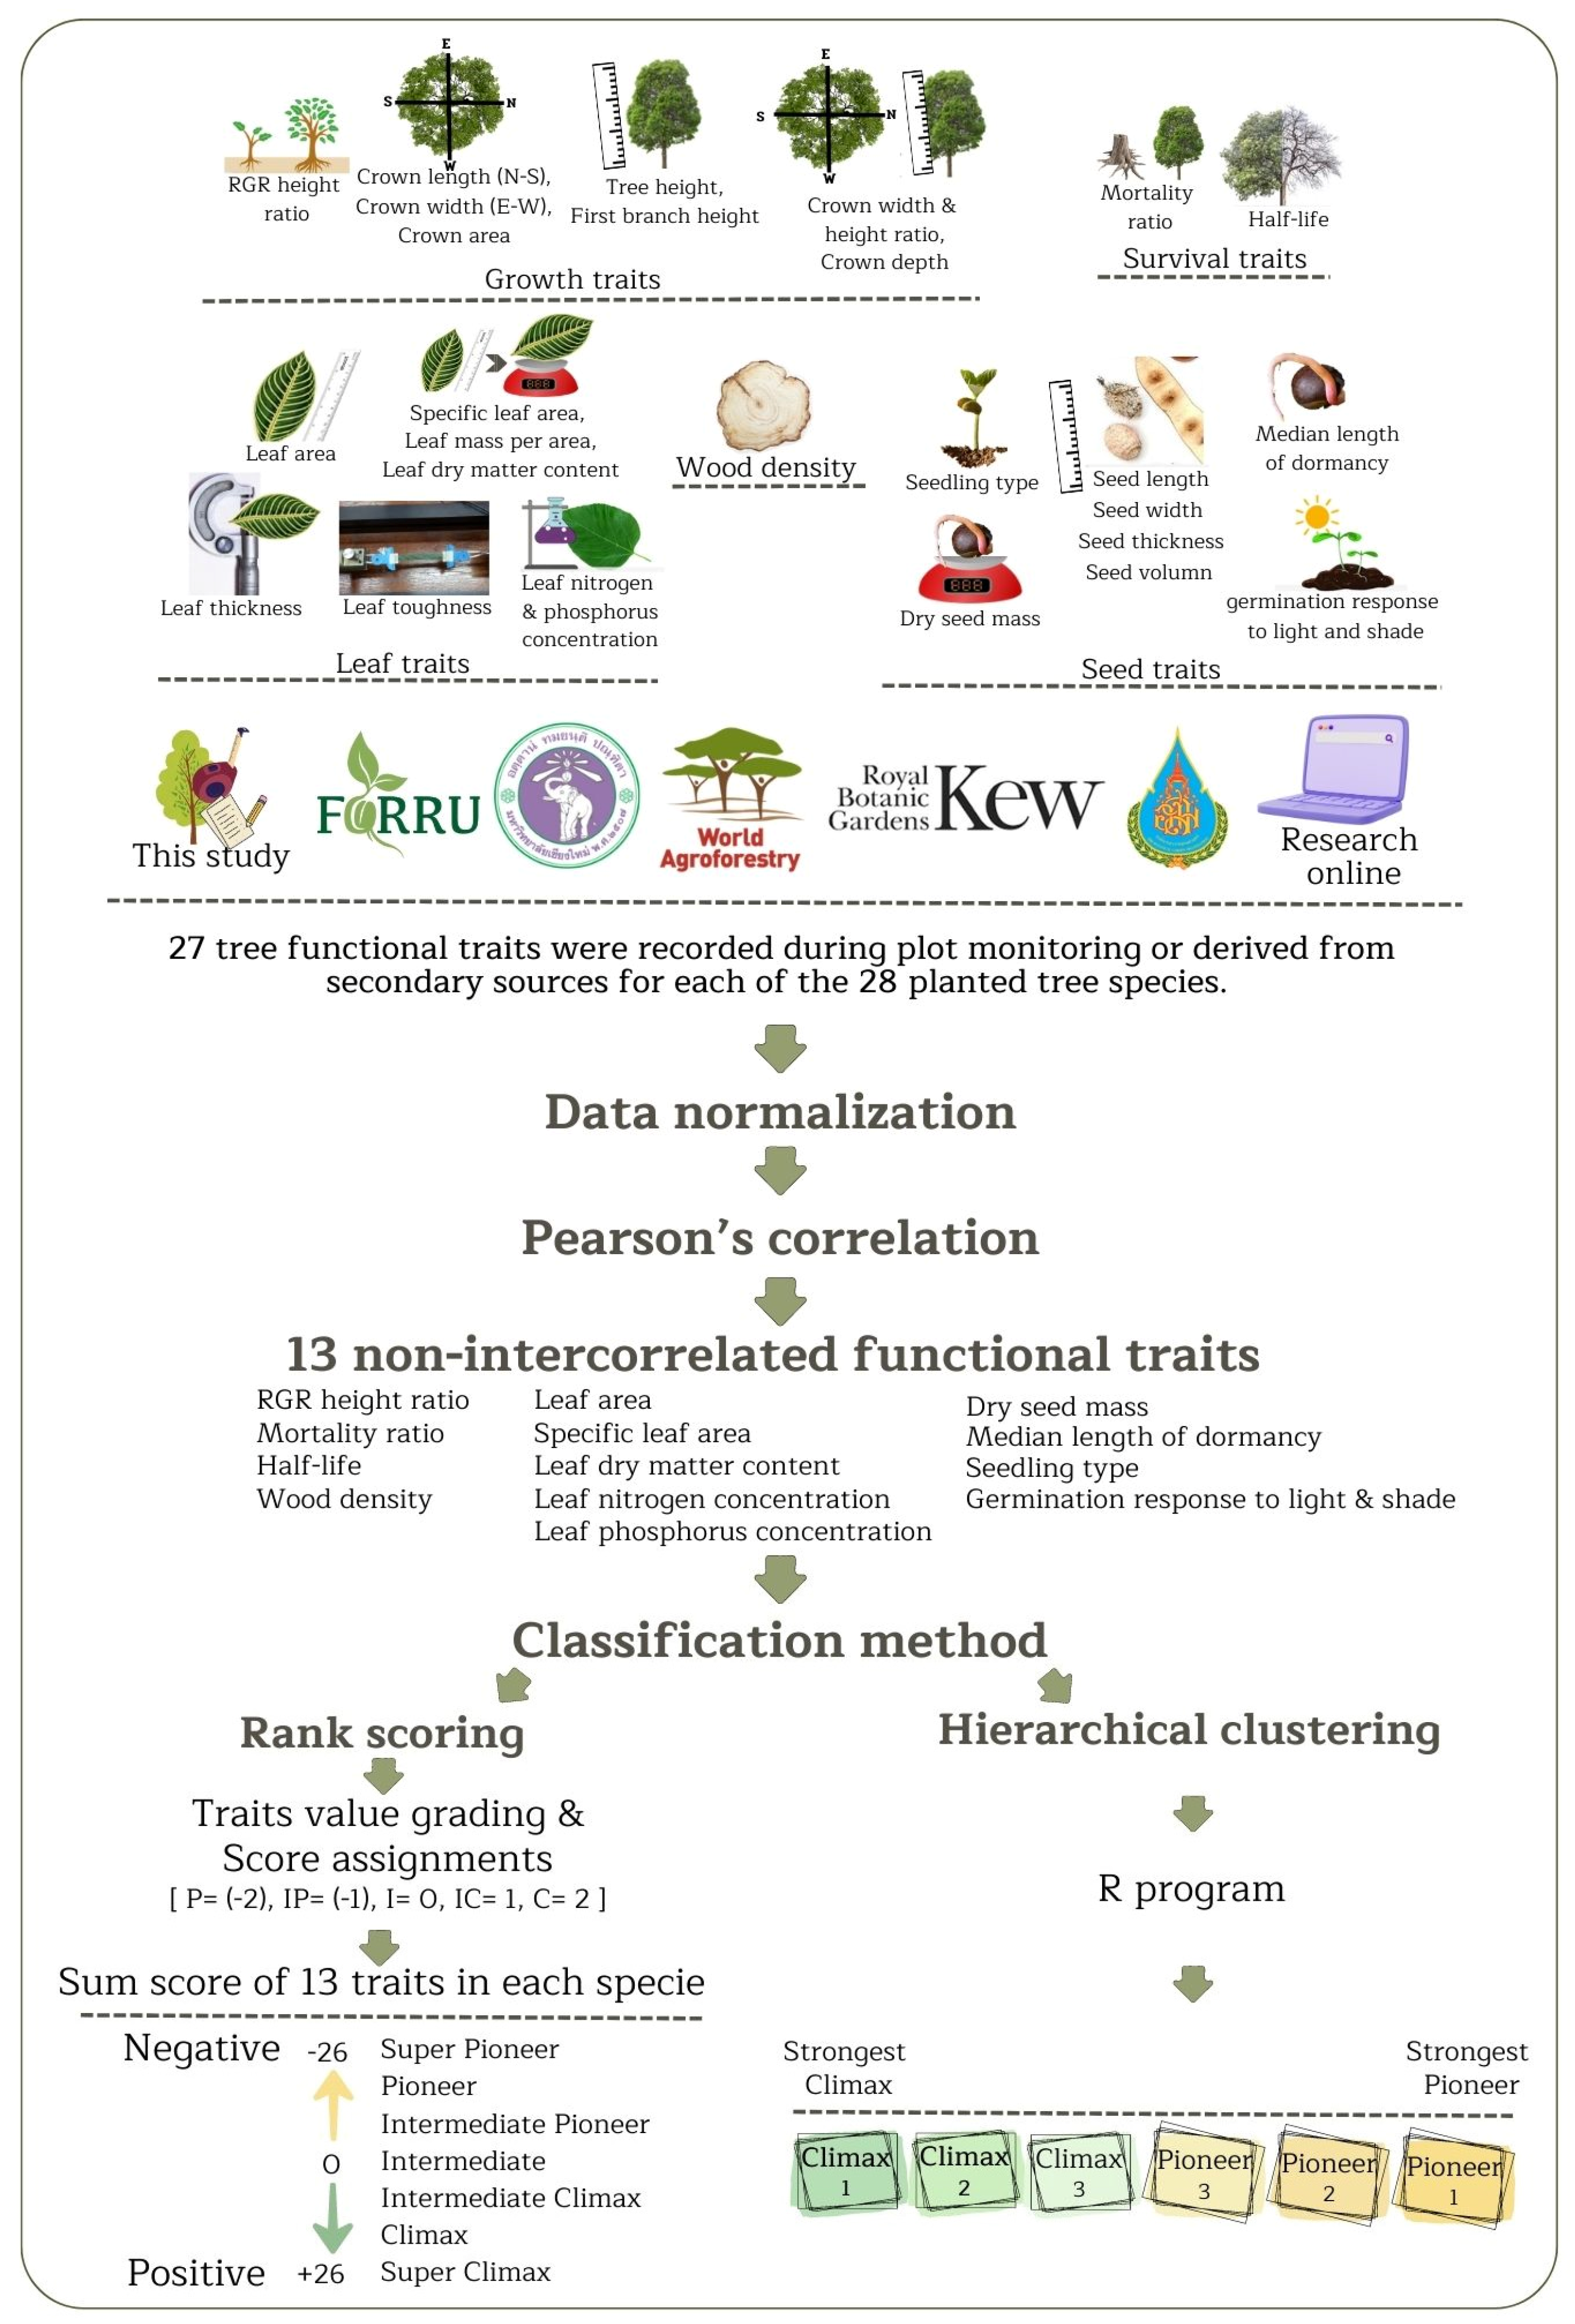
2.4. Functional Traits Data Collection
2.4.1. Growth and Survival Traits from Field Measurements
2.4.2. Wood Density (WD)
2.4.3. Seed Traits
2.4.4. Leaf Traits
2.5. Data Analysis
3. Results
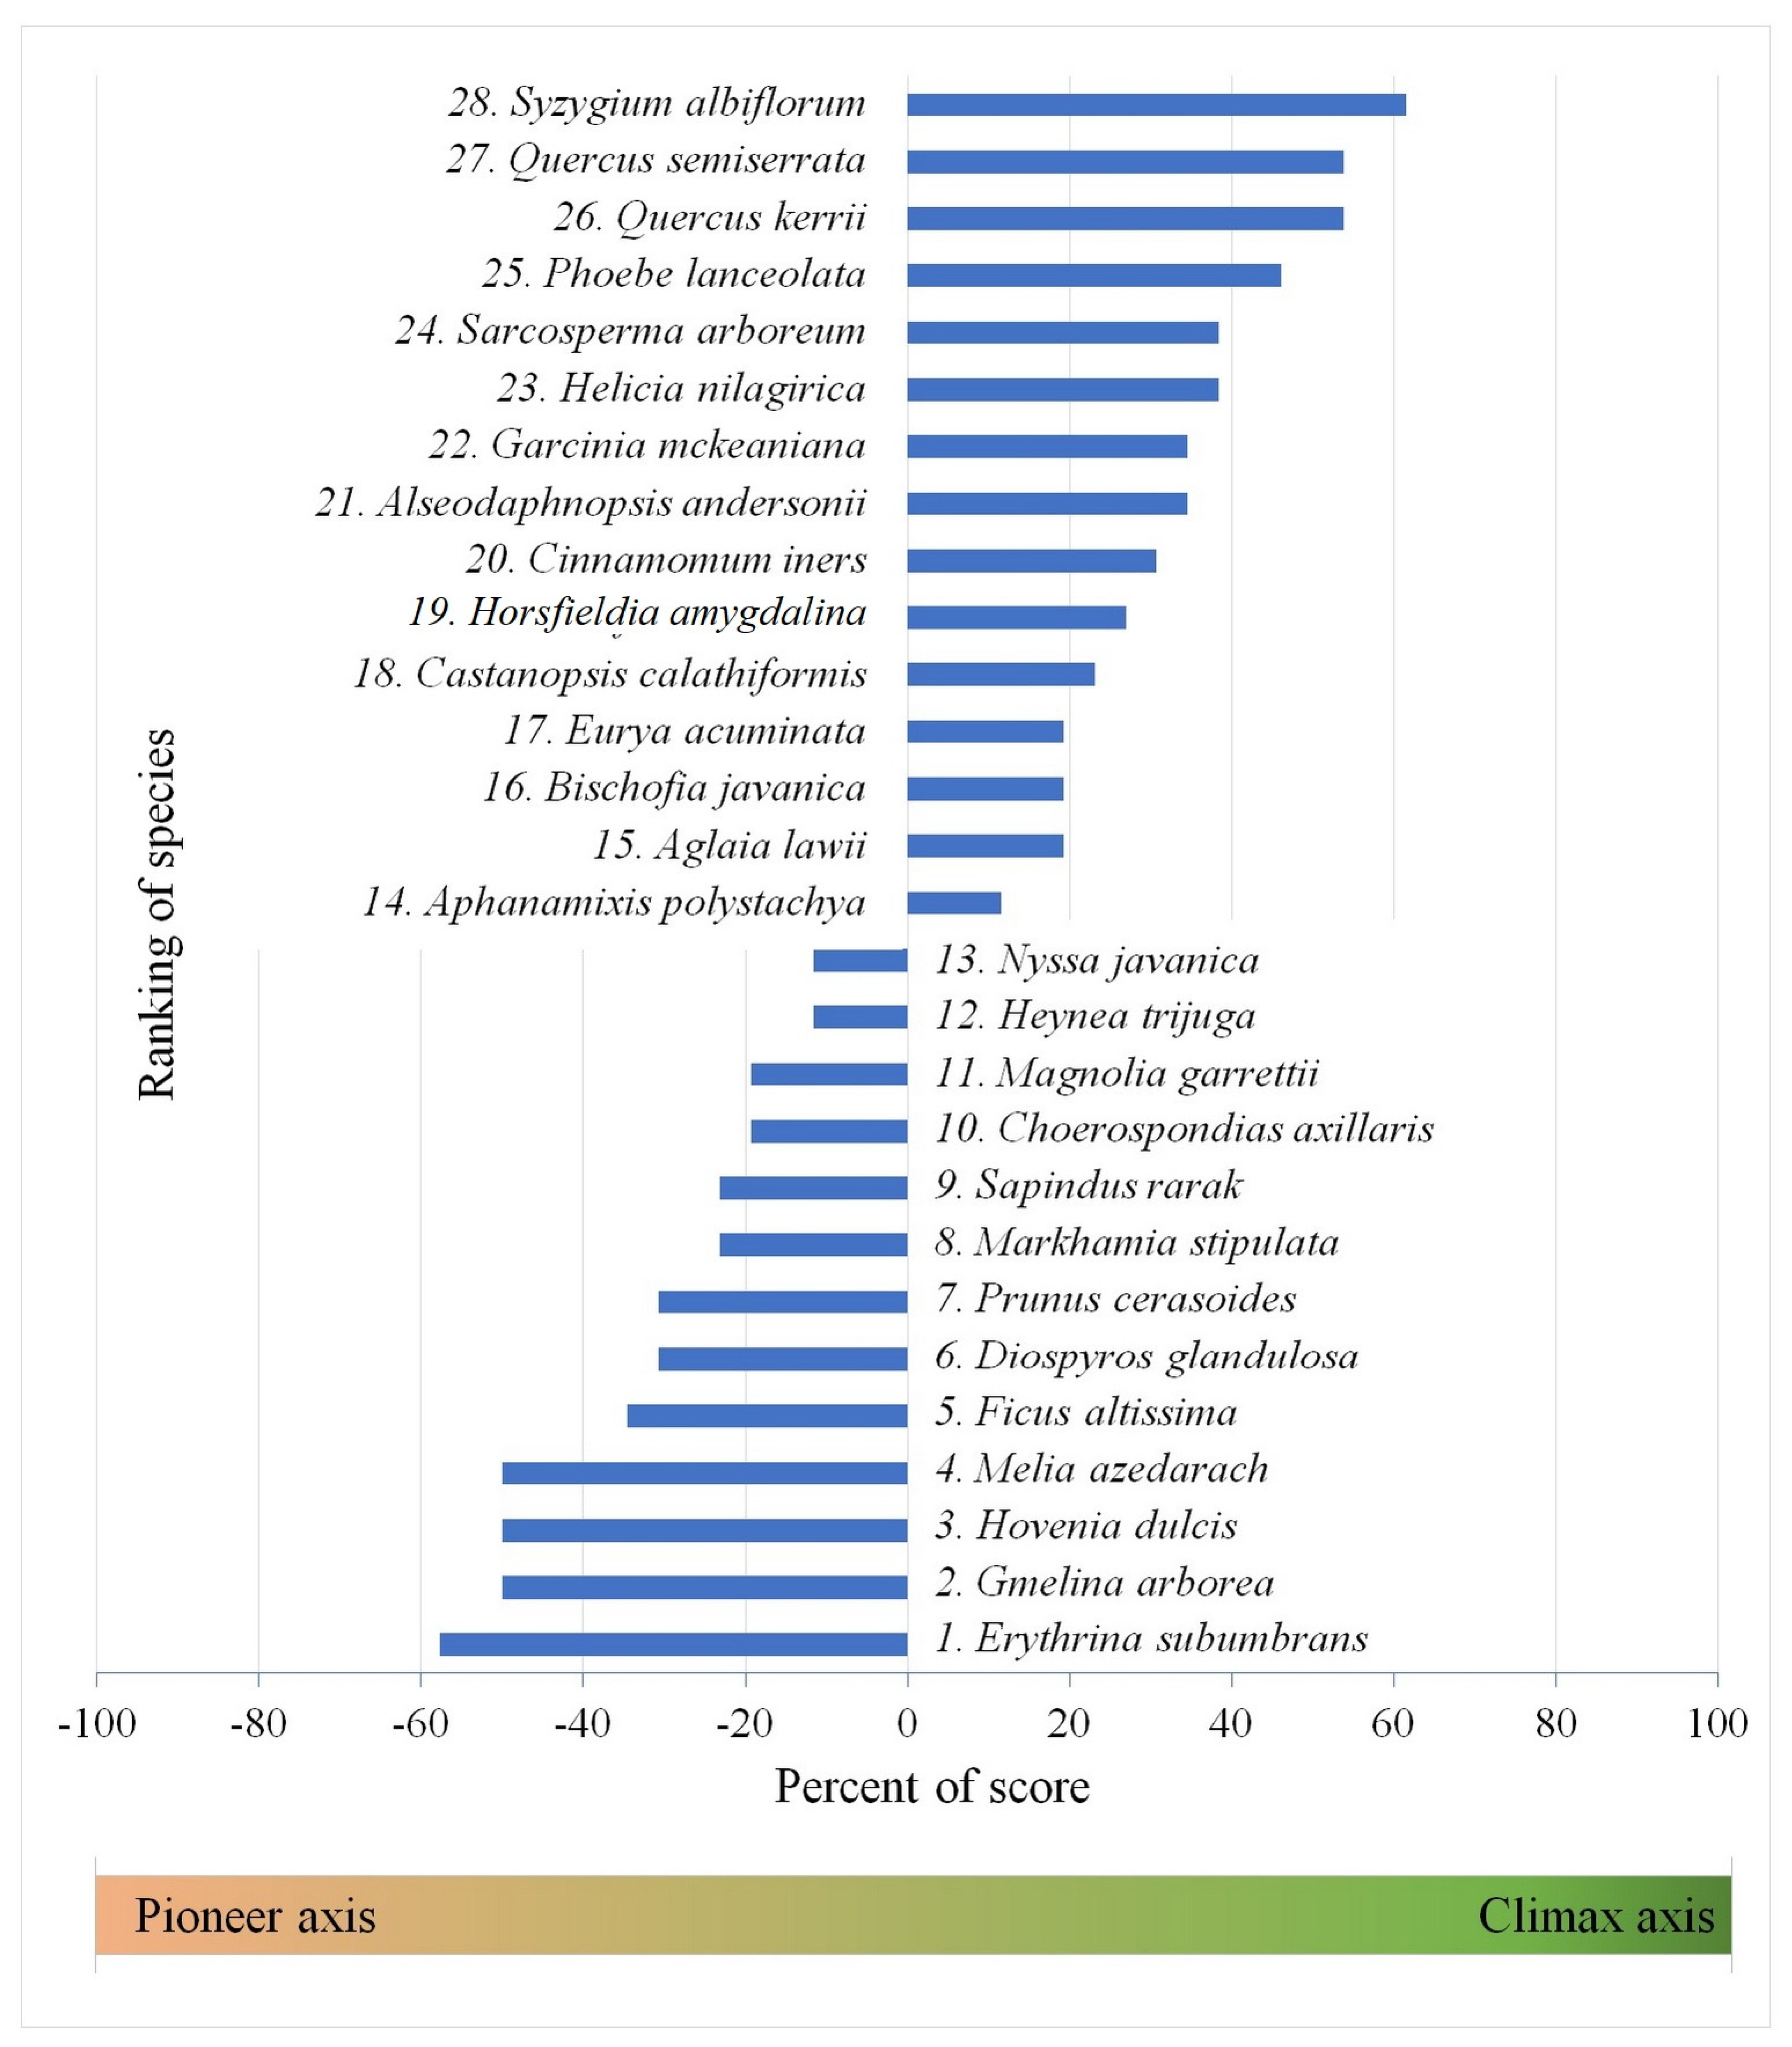
3.1. Rank Scoring
3.2. Hierarchical Clustering
4. Discussion
4.1. Comparison between the Score Ranking System and Hierarchical Cluster Analysis
4.2. Successional Guilds
4.3. Practical Applications
5. Conclusions
Supplementary Materials
Author Contributions
Funding
Data Availability Statement
Acknowledgments
Conflicts of Interest
References
- Turner, I.M. The Ecology of Trees in the Tropical Rain Forest; Cambridge University Press: Cambridge, UK, 2001. [Google Scholar] [CrossRef]
- Di Sacco, A.; Hardwick, K.A.; Blakesley, D.; Brancalion, P.H.S.; Breman, E.; Cecilio Rebola, L.; Chomba, S.; Dixon, K.; Elliott, S.; Ruyonga, G.; et al. Ten golden rules for reforestation to optimize carbon sequestration, biodiversity recovery and livelihood benefits. Glob. Chang. Biol. 2021, 27, 1328–1348. [Google Scholar] [CrossRef] [PubMed]
- Lewis, S.L.; Wheeler, C.; Mitchard, E.T.A.; Koch, A. Regenerate natural forests to store carbon. Nature 2019, 568, 25–28. [Google Scholar] [CrossRef] [PubMed]
- Gann, G.D.; McDonald, T.; Walder, B.; Aronson, J.; Nelson, C.R.; Jonson, J.; Hallett, J.G.; Eisenberg, C.; Guariguata, M.R.; Liu, J.; et al. International principles and standards for the practice of ecological restoration. Second edition. Restor. Ecol. 2019, 27, S1–S46. [Google Scholar] [CrossRef]
- Nock, C.A.; Vogt, R.J.; Beisner, B.E. Functional Traits; Wiley: Hoboken, NJ, USA, 2016. [Google Scholar]
- Elliott, S.; Tucker, N.I.J.; Shannon, D.P.; Tiansawat, P. The framework species method: Harnessing natural regeneration to restore tropical forest ecosystems. Philos. Trans. R. Soc. B Biol. Sci. 2022, 378, 20210073. [Google Scholar] [CrossRef] [PubMed]
- Elliott, S.; Blakesley, D.; Hardwick, K. Restoring Tropical Forest: A Practical Guide; Royal Botanic Gardens, Kew: Richmon, UK, 2013. [Google Scholar]
- Chazdon, R.L. Landscape Restoration, Natural Regeneration, and the Forests of the Future. Ann. Mo. Bot. Gard. 2017, 102, 251–257. [Google Scholar] [CrossRef]
- Whitmore, T. Tropical Rainforests of the Far East; Clarendon Press: Oxford, UK, 1984. [Google Scholar]
- Elliott, S.; Chairuangsri, S.; Kuaraksa, C.; Sangkum, S.; Sinhaseni, K.; Shannon, D.; Nippanon, P.; Manohan, B. Collaboration and Conflict—Developing Forest Restoration Techniques for Northern Thailand’s Upper Watersheds Whilst Meeting the Needs of Science and Communities. Forests 2019, 10, 732. [Google Scholar] [CrossRef]
- Elliott, S.; Navakitbumrung, P.; Kuarak, C.; Zangkum, S.; Anusarnsunthorn, V.; Blakesley, D. Selecting framework tree species for restoring seasonally dry tropical forests in northern Thailand based on field performance. For. Ecol. Manag. 2003, 184, 177–191. [Google Scholar] [CrossRef]
- Ashton, M.; Gunatilleke, C.V.S.; Singhakumara, B.; Gunatilleke, N. Restoration pathways for rain forest in southwest Sri Lanka: A review of concepts and models. For. Ecol. Manag. 2001, 154, 409–430. [Google Scholar] [CrossRef]
- Chazdon, R.L. Second Growth: The Promise of Tropical Forest Regeneration in an Age of Deforestation; University of Chicago Press: Chicago, IL, USA, 2014. [Google Scholar]
- Chazdon, R.L.; Finegan, B.; Capers, R.S.; Salgado-Negret, B.; Casanoves, F.; Boukili, V.; Norden, N. Composition and Dynamics of Functional Groups of Trees During Tropical Forest Succession in Northeastern Costa Rica. Biotropica 2010, 42, 31–40. [Google Scholar] [CrossRef]
- Herrera-Peraza, R.; Bever, J.; Garcinuño, J.M.; Sal, A.; Herrera, P.; García, E.; Oviedo, R.; Torres-Arias, Y.; Delgado, F.; Valdés-Lafont, O.; et al. A new hypothesis on humid and dry tropical forests succession. Acta Botánica Cuba 2016, 215, 232–280. [Google Scholar]
- Glomvinya, S.; Tantasirin, C.; Tongdeenok, P.; Tanaka, N. Changes in Rainfall Characteristics at Huai Kog-Ma Watershed, Chiang Mai Province. Thai J. For. 2016, 35, 66–77. [Google Scholar]
- Maxwell, J.F.; Elliott, S. Vegetation and Vascular Flora of Doi Sutep-Pui National Park, Northern Thailand. In Thai Studies in Biodiversity; Biodiversity Research and Training Program (BRT): Bangkok, Thailand, 2001. [Google Scholar]
- Sinhaseni, K. Natural Establishment of Tree Seedling in Forest Restoration Trials at Ban Mae Sa Mai; Chiang Mai Province Chiangmai, Chiangmai University: Chiang Mai, Thailand, 2008. [Google Scholar]
- Toktang, T. The Effects of Forest Restoration on the Species Diversity and Composition of a Bird Community in Doi Suthep-Pui National Park Thailand from 2002–2003; Graduate School, Chiang Mai University: Chiang Mai, Thailand, 2005. [Google Scholar]
- Swaine, M.D.; Whitmore, T.; Swaine, M.D.; Whitmore, T.C. On the definition of ecological species groups in tropical forests. Vegetatio. Plant Ecol. 1988, 75, 81–86. [Google Scholar] [CrossRef]
- Cornelissen, J.H.C.; Lavorel, S.; Garnier, E.; Díaz, S.; Buchmann, N.; Gurvich, D.E.; Reich, P.B.; Steege, H.T.; Morgan, H.D.; Van Der Heijden, M.G.A.; et al. A handbook of protocols for standardised and easy measurement of plant functional traits worldwide. Aust. J. Bot. 2003, 51, 335–380. [Google Scholar] [CrossRef]
- Poorter, L.; Bongers, F. Leaf traits are good predictors of plant performance across 53 rain forest species. Ecology 2006, 87, 1733–1743. [Google Scholar] [CrossRef] [PubMed]
- Rijkers, T.; Pons, T.L.; Bongers, F. The effect of tree height and light availability on photosynthetic leaf traits of four neotropical species differing in shade tolerance. Funct. Ecol. 2000, 14, 77–86. [Google Scholar] [CrossRef]
- Wright, I.J.; Reich, P.B.; Westoby, M.; Ackerly, D.D.; Baruch, Z.; Bongers, F.; Cavender-Bares, J.; Chapin, T.; Cornelissen, J.H.C.; Diemer, M.; et al. The worldwide leaf economics spectrum. Nature 2004, 428, 821–827. [Google Scholar] [CrossRef]
- Zhang, G.; Zhang, L.; Wen, D. Photosynthesis of subtropical forest species from different successional status in relation to foliar nutrients and phosphorus fractions. Sci. Rep. 2018, 8, 10455. [Google Scholar] [CrossRef]
- Baraloto, C.; Forget, P.-M. Seed size, seedling morphology, and response to deep shade and damage in neotropical rain forest trees. Am. J. Bot. 2007, 94, 901–911. [Google Scholar] [CrossRef]
- Dalling, J.W.; Hubbell, S.P.; Silvera, K. Seed dispersal, seedling establishment and gap partitioning among tropical pioneer trees. J. Ecol. 1998, 86, 674–689. [Google Scholar] [CrossRef]
- Ibarra-Manríquez, G.; Martinez-Ramos, M.; Oyama, K. Seedling Functional Types in a Lowland Rain Forest in Mexico. Am. J. Bot. 2001, 88, 1801–1812. [Google Scholar] [CrossRef]
- Pearson, T.R.H.; Burslem, D.F.R.P.; Mullins, C.E.; Dalling, J.W. Functional significance of photoblastic germination in neotropical pioneer trees: A seed’s eye view. Funct. Ecol. 2003, 17, 394–402. [Google Scholar] [CrossRef]
- Bonal, D.; Born, C.; Brechet, C.; Coste, S.; Marcon, E.; Roggy, J.-C.; Guehl, J.-M. The successional status of tropical rainforest tree species is associated with differences in leaf carbon isotope discrimination and functional traits. Ann. For. Sci. 2007, 64, 169–176. [Google Scholar] [CrossRef]
- Selaya, G.N.; Anten, N.P.R. Leaves of pioneer and later-successional trees have similar lifetime carbon gain in tropical secondary forest. Ecology 2010, 91, 1102–1113. [Google Scholar] [CrossRef]
- Prado Júnior, J.; Schiavini, I.; Vale, V.; Raymundo, D.; Lopes, S.; Poorter, L. Functional traits shape size-dependent growth and mortality rates of dry forest tree species. J. Plant Ecol. 2017, 10, 895–906. [Google Scholar] [CrossRef]
- Wright, S.J.; Kitajima, K.; Kraft, N.; Reich, P.; Wright, I.; Bunker, D.; Condit, R.; Dalling, J.; Davies, S.; Diaz, S.; et al. Functional traits and the growth-mortality trade-off in tropical trees. Ecology 2010, 91, 3664–3674. [Google Scholar] [CrossRef]
- Shannon, D.P.; Tiansawat, P. Using Functional Traits to Determine Success in Forest Restoration; Faculty of Science, Chiang Mai University: Chiang Mai, Thailand, 2019. [Google Scholar]
- FORRU. FORRU Main Databank; Biology, Faculty of Science Chiang, Mai University: Chiang Mai, Thailand, 2023. [Google Scholar]
- Zanne, A.E.; Lopez-Gonzalez, G.; Coomes, D.A.; Ilic, J.; Jansen, S.; Lewis, S.L.; Miller, R.B.; Swenson, N.G.; Wiemann, M.C.; Chave, J. Data from: Towards a Worldwide Wood Economics Spectrum. Global Wood Density Database. Dryad Identifier, 2009. Available online: https://doi.org/10.5061/dryad.234 (accessed on 10 May 2023). [CrossRef]
- Goosem, S.; Tucker, N.I.J. Repairing the Rainforest, 2nd ed.; Wet Tropics Management Authority and Biotropica Australia Pty. Ltd.: Cairns, QLD, Australia, 2013. [Google Scholar]
- Jantawong, K.; Elliott, S.; Wangpakapattanawong, P. Above-Ground Carbon Sequestration during Restoration of Upland Evergreen Forest in Northern Thailand. Open J. For. 2017, 7, 157–171. [Google Scholar] [CrossRef]
- Pothong, T. New Allometric Equations for Tree Biomass and Carbon Calculations in Secondary Hill Evergreen Forest in Northern Thailand; Chiang Mai University: Chiang Mai, Thailand, 2019. [Google Scholar]
- Chave, J.; Muller-Landau, H.C.; Baker, T.R.; Easdale, T.A.; ter Steege, H.; Webb, C.O. Regional and phylogenetic variation of wood density across 2456 Neotropical tree species. Ecol. Appl. 2006, 16, 2356–2367. [Google Scholar] [CrossRef]
- Pakkad, G. Morphological Database of Fruits and Seeds of Trees in Doi Suthep-Pui National Park. Master’s Thesis, Graduate School, Chiang Mai University, Chiang Mai, Thailand, 1997. [Google Scholar]
- Hendry, G.A.F.; Grime, J.P. Methods in Comparative Plant Ecology: A Laboratory Manual; Chapman & Hall: Boca Raton, FL, USA, 1993. [Google Scholar]
- Schneider, F.D.; Fichtmueller, D.; Gossner, M.M.; Güntsch, A.; Jochum, M.; König-Ries, B.; Le Provost, G.; Manning, P.; Ostrowski, A.; Penone, C.; et al. Towards an ecological trait-data standard. Methods Ecol. Evol. 2019, 10, 2006–2019. [Google Scholar] [CrossRef]
- Flörchinger, M.; Braun, J.; Böhning-Gaese, K.; Schaefer, H.M. Fruit size, crop mass, and plant height explain differential fruit choice of primates and birds. Oecologia 2010, 164, 151–161. [Google Scholar] [CrossRef]
- Ward, J.H. Hierarchical Grouping to Optimize an Objective Function. J. Am. Stat. Assoc. 1963, 58, 236–244. [Google Scholar] [CrossRef]
- Teichgraeber, H.; Brandt, A.R. Systematic Comparison of Aggregation Methods for Input Data Time Series Aggregation of Energy Systems Optimization Problems. In Computer Aided Chemical Engineering; Eden, M.R., Ierapetritou, M.G., Towler, G.P., Eds.; Elsevier: Amsterdam, The Netherlands, 2018; Volume 44, pp. 955–960. [Google Scholar]
- Ludwig, J.A.; Reynolds, J.F. Statistical ecology: A primer on methods & computing. J. Appl. Ecol. 1988, 26, 1099. [Google Scholar]
- R Core Team. R: A Language and Environment for Statistical Computing; R Foundation for Statistical Computing: Vienna, Austria, 2020; Available online: https://www.R-project.org/ (accessed on 10 May 2023).
- PROSEA. Plant Resources of South-East Asia: Timber Trees; Lesser-Known Timbers; Backhuys Publishers: Leiden, The Netherlands, 1998. [Google Scholar]
- Gardner, S.; Sidisunthorn, P.; Anusarnsunthorn, V. A Field Guide to Forest Trees of Northern Thailand; Kobfai Publishing Project: Bangkok, Thailand, 2007. [Google Scholar]
- Waiboonya, P.; Elliott, S.; Tiansawat, P. Seed Storage Behaviour of Native Forest Tree Species of Northern Thailand. Environ. Asia 2019, 12, 104–111. [Google Scholar] [CrossRef]
- Betts, H. The Framework Species Approach to Forest Restoration: Using Functional Traits as Predictors of Species Performance. Ph.D. Thesis, University of Liverpool, Liverpool, UK, 2013. [Google Scholar]
- Kattge, J.; Bönisch, G.; Díaz, S.; Lavorel, S.; Prentice, I.C.; Leadley, P.; Tautenhahn, S.; Werner, G.D.A.; Aakala, T.; Abedi, M.; et al. TRY plant trait database—Enhanced coverage and open access. Glob. Chang. Biol. 2020, 26, 119–188. [Google Scholar] [CrossRef] [PubMed]
- Royal Botanic Gardens, K. Royal Botanic Gardens, Kew—Herbarium Specimens. 2021. Available online: https://www.gbif.org/dataset/cd6e21c8-9e8a-493a-8a76-fbf7862069e5 (accessed on 19 August 2022).
- Banin, L.F.; Raine, E.H.; Rowland, L.M.; Chazdon, R.L.; Smith, S.W.; Rahman, N.E.B.; Butler, A.; Philipson, C.; Applegate, G.G.; Axelsson, E.P.; et al. The road to recovery: A synthesis of outcomes from ecosystem restoration in tropical and sub-tropical Asian forests. Philos. Trans. R. Soc. B Biol. Sci. 2023, 378, 20210090. [Google Scholar] [CrossRef]
- Gornish, E.S.; McCormick, M.; Begay, M.; Nsikani, M.M. Sharing knowledge to improve ecological restoration outcomes. Restor. Ecol. 2021, e13417. [Google Scholar] [CrossRef]


| Trait | High/Big | Low/Small | References |
|---|---|---|---|
| Ratio of height relative growth rate pre- to post-canopy closure | Pioneer | Climax | [1,20] |
| Ratio of mortality rates pre- to post-canopy closure | Climax | Pioneer | [1,20] |
| Half-life | Climax | Pioneer | [1,20] |
| Wood density | Climax | Pioneer | [1,20] |
| Leaf size | Pioneer | Climax | [21,22] |
| Specific leaf area | Pioneer | Climax | [21,23,24] |
| Leaf dry matter content | Climax | Pioneer | [22,24] |
| Leaf nitrogen concentration | Pioneer | Climax | [22,25] |
| Leaf phosphorus concentration | Pioneer | Climax | [22,25] |
| Dry seed mass | Climax | Pioneer | [1,20,26] |
| Median length of dormancy | Pioneer | Climax | [1,20,27] |
| Seedling type | Pioneer, epigeal; climax hypogeal | [26,28] | |
| Germination response to light and shade | Pioneer, requires full sunlight; climax, can germinate in shade | [26,29] | |
| No. | The Successional Guilds | Percent of Score |
|---|---|---|
| 1 | Super pioneer | −100% to −60% |
| 2 | Pioneer | −59% to −40% |
| 3 | Intermediate pioneer | −39% to −20% |
| 4 | Intermediate | −19% to 19% |
| 5 | Intermediate climax | 20% to 39% |
| 6 | Climax | 40% to 59% |
| 7 | Super climax | 60% to 100% |
| Rank Number | Species | RGR of Height Ratio | Mortality Ratio | Half-life | WD | LA (cm2) | SLA (mm2/mg) | LDMC (mg/g) | LNC (%) | LPC (%) | Dry Seed Mass (g) | MLD (Day) | Seedling Type | GRLS | Number of Occurrences | Sum Score | Percent of Graded Maximum Score | Successional Guilds | ||||
|---|---|---|---|---|---|---|---|---|---|---|---|---|---|---|---|---|---|---|---|---|---|---|
| P (−2) | IP (−1) | I (0) | IC (+1) | C (+2) | ||||||||||||||||||
| 1 | Erythrina subumbrans | P | P | IP | P | IC | P | P | P | P | IP | C | I | P | 8 | 2 | 1 | 1 | 1 | −15 | −57.69 | Pioneer |
| 2 | Gmelina arborea | I | P | IP | IP | I | P | P | IP | I | IP | IC | P | P | 5 | 4 | 3 | 1 | 0 | −13 | −50.00 | |
| 3 | Hovenia dulcis | I | P | IP | IP | IC | P | IP | IP | IP | P | IP | P | I | 4 | 6 | 2 | 1 | 0 | −13 | −50.00 | |
| 4 | Melia azedarach | P | P | IP | P | P | C | IC | P | I | P | IC | P | P | 8 | 1 | 1 | 2 | 1 | −13 | −50.00 | |
| 5 | Ficus altissima | IP | P | IC | P | IP | C | IP | IC | I | P | I | P | P | 5 | 3 | 2 | 2 | 1 | −9 | −34.62 | Intermediate Pioneer |
| 6 | Diospyros glandulosa | C | I | P | IP | IC | IP | I | IP | IC | P | IP | P | P | 4 | 4 | 2 | 2 | 1 | −8 | −30.77 | |
| 7 | Prunus cerasoides | I | IP | I | IP | C | P | IC | P | I | P | IC | P | P | 5 | 2 | 3 | 2 | 1 | −8 | −30.77 | |
| 8 | Markhamia stipulata | IC | IC | IP | IC | I | IP | IP | P | P | P | C | P | I | 4 | 3 | 2 | 3 | 1 | −6 | −23.08 | |
| 9 | Sapindus rarak | IP | IP | I | I | IC | IP | IP | IP | IP | IC | I | P | I | 1 | 6 | 4 | 2 | 0 | −6 | −23.08 | |
| 10 | Choerospondias axillaris | IC | P | IC | P | C | IP | IC | P | I | IC | P | P | I | 5 | 1 | 2 | 4 | 1 | −5 | −19.23 | Intermediate |
| 11 | Magnolia garrettii | C | IC | I | IP | I | I | I | I | I | P | IP | P | P | 3 | 2 | 6 | 1 | 1 | −5 | −19.23 | |
| 12 | Heynea trijuga | C | P | I | IP | IC | I | IC | IP | I | P | IP | C | P | 3 | 3 | 3 | 2 | 2 | −3 | −11.54 | |
| 13 | Nyssa javanica | IC | IP | I | IP | IC | I | IC | I | P | P | C | P | I | 3 | 2 | 4 | 3 | 1 | −3 | −11.54 | |
| 14 | Aphanamixis polystachya | C | IC | P | I | I | I | IP | I | I | I | IC | C | I | 1 | 1 | 7 | 2 | 2 | 3 | 11.54 | |
| 15 | Aglaia lawii | C | I | P | IC | IC | I | I | IP | IP | IP | C | C | C | 1 | 3 | 3 | 2 | 4 | 5 | 19.23 | |
| 16 | Bischofia javanica | IC | P | IC | I | IC | IC | I | IC | C | P | C | P | C | 3 | 0 | 2 | 5 | 3 | 5 | 19.23 | |
| 17 | Eurya acuminata | C | C | IC | I | C | I | IC | IC | C | P | I | P | P | 3 | 0 | 3 | 3 | 4 | 5 | 19.23 | |
| 18 | Castanopsis calathiformis | I | P | C | IC | I | I | IC | P | I | C | C | C | I | 2 | 0 | 5 | 2 | 4 | 6 | 23.08 | Intermediate Climax |
| 19 | Horsfieldia amygdalina | C | IC | IP | P | IC | I | P | IC | IC | IC | IC | C | C | 2 | 1 | 1 | 6 | 3 | 7 | 26.92 | |
| 20 | Cinnamomum iners | C | IP | IC | IP | IC | IC | IC | IC | IC | P | C | C | I | 1 | 2 | 1 | 6 | 3 | 8 | 30.77 | |
| 21 | Alseodaphnopsis andersonii | IC | IP | C | I | IP | IC | IC | IC | C | C | IC | I | I | 0 | 2 | 3 | 5 | 3 | 9 | 34.62 | |
| 22 | Garcinia mckeaniana | C | C | P | C | I | IC | I | C | C | I | I | C | P | 2 | 0 | 4 | 1 | 6 | 9 | 34.62 | |
| 23 | Helicia nilagirica | C | I | I | IC | IC | I | I | IC | IC | IC | IP | C | C | 0 | 1 | 4 | 5 | 3 | 10 | 38.46 | |
| 24 | Sarcosperma arboreum | C | IC | IC | P | IC | IC | IC | IC | IC | I | IP | C | C | 1 | 1 | 1 | 7 | 3 | 10 | 38.46 | |
| 25 | Phoebe lanceolata | C | C | C | IC | IC | I | IC | I | IC | C | P | C | I | 1 | 0 | 3 | 4 | 5 | 12 | 46.15 | Climax |
| 26 | Quercus kerrii | C | IC | I | IC | IC | IC | C | IC | IC | I | C | C | I | 0 | 0 | 3 | 6 | 4 | 14 | 53.85 | |
| 27 | Quercus semiserrata | C | IC | I | C | C | I | C | I | I | IC | C | C | I | 0 | 0 | 5 | 2 | 6 | 14 | 53.85 | |
| 28 | Syzygium albiflorum | C | IP | IC | C | C | IC | C | C | C | IC | C | C | P | 1 | 1 | 0 | 3 | 8 | 16 | 61.54 | Super Climax |
Disclaimer/Publisher’s Note: The statements, opinions and data contained in all publications are solely those of the individual author(s) and contributor(s) and not of MDPI and/or the editor(s). MDPI and/or the editor(s) disclaim responsibility for any injury to people or property resulting from any ideas, methods, instructions or products referred to in the content. |
© 2023 by the authors. Licensee MDPI, Basel, Switzerland. This article is an open access article distributed under the terms and conditions of the Creative Commons Attribution (CC BY) license (https://creativecommons.org/licenses/by/4.0/).
Share and Cite
Manohan, B.; Shannon, D.P.; Tiansawat, P.; Chairuangsri, S.; Jainuan, J.; Elliott, S. Use of Functional Traits to Distinguish Successional Guilds of Tree Species for Restoring Forest Ecosystems. Forests 2023, 14, 1075. https://doi.org/10.3390/f14061075
Manohan B, Shannon DP, Tiansawat P, Chairuangsri S, Jainuan J, Elliott S. Use of Functional Traits to Distinguish Successional Guilds of Tree Species for Restoring Forest Ecosystems. Forests. 2023; 14(6):1075. https://doi.org/10.3390/f14061075
Chicago/Turabian StyleManohan, Benjapan, Dia Panitnard Shannon, Pimonrat Tiansawat, Sutthathorn Chairuangsri, Jutatip Jainuan, and Stephen Elliott. 2023. "Use of Functional Traits to Distinguish Successional Guilds of Tree Species for Restoring Forest Ecosystems" Forests 14, no. 6: 1075. https://doi.org/10.3390/f14061075