Article

High-Throughput DNA Metabarcoding of Stem Sections from Trees with Cavities Describes Fungal Communities Associated with Variable Wood Decay, Position on Stem and Tree Species

by
Matteo Garbelotto
* and
Michael G. Johnson
Department of Environmental Science, Policy, and Management, University of California, Berkeley, CA 94720, USA
*
Author to whom correspondence should be addressed.
Forests 2023, 14(6), 1070; https://doi.org/10.3390/f14061070
Submission received: 14 April 2023 / Revised: 17 May 2023 / Accepted: 21 May 2023 / Published: 23 May 2023
(This article belongs to the Special Issue Diversity, Abundance, and Distribution of Wood-Decay Fungi)

Abstract

:
The presence of unculturable fungi, variability in timing and frequency of fungal fruiting, hyper-rich fungal communities, and genetic and environmental variability explains the difficulty in adopting ideal sampling schemes and fungal identification approaches in studies of fungal communities in wood at variable stages of decay. Here, we use intensive within-tree sampling of five standing trees with cavities paired with high-throughput DNA metabarcoding, to study fungal communities in decayed and healthy wood of trees from two Populus species in British Columbia, Canada. The amplification of over 3000 fungal DNA sequence variants shows the presence of a hyper-rich wood fungal community that not only varied depending on PCR primers, tree species, tree stem portion and wood decay stage. but also included a large number of taxa unassignable to any known sub-kingdom taxonomic order based on published DNA sequences. Our data show that the use of two different primer sets greatly increases the power of the metabarcoding analysis. By testing three alternative models of fungal community composition, we identify the model that best explains fungal community by considering the position on the stem and distance from the cavity. We suggest this model may be used to design optimal sampling schemes to describe fungal communities in trees experiencing discrete decay pockets or cavities.

1. Introduction

Studies of fungal communities associated with wood in trees have been undertaken for decades [1,2], and they continue to be undertaken for purposes often as disparate as understanding the role of fungi in the nutrient cycle and C sequestration [3,4,5], fungal endophytism in trees [6], and investigating the associations between wood decay and arthropods [7] or between cavity-nesting birds and fungi [8,9].
What is known about natural wood communities in forests comes from three-dimensional detailed studies of fungi in trees or logs to identify fungal species [10,11,12,13,14], from the identification of fungi from the wood of trees obtained with a coarse, less-detailed sampling [15,16,17], and from studies of logs on the forest floor [18,19,20,21]. Notwithstanding the sampling approach and its intensity, the identification of fungal species in wood has been based on a variety of approaches, including sporocarp surveys [22,23,24,25]; fungal culturing, alone or coupled with DNA sequencing of cultures [26,27,28,29,30]; direct amplification of environmental fungal DNA from wood [6]; or cloning followed by traditional Sanger sequencing [8]. The fungal identification methodologies mentioned above are all valid, but they are limited by that fact that the majority of fungi are known to produce visible fruiting bodies only rarely [31], may produce ephemeral fruiting bodies depending on climatic cues [32], or, even if theoretically culturable, they may not be always easily cultured in the lab for a variety of reasons [33]. DNA-based techniques offer a partial solution to the limitations of other methods; however, the direct amplification of fungal DNA from wood using taxon-specific primers or fungal primers followed by the cloning of amplicons cannot capture potentially hyper-diverse microbial communities such as those encountered in wood.
Recently, exponential improvements in next-generation genetic sequencing technologies have led to an explosion of studies of microbial communities, including those associated with wood [34], and have opened the door to an ecosystem within decaying wood that is not only vastly richer in species composition than previously hypothesized [19,20,21,35,36], but is also characterized by extreme functional diversity [21,25]. Using direct environmental DNA sequencing, a number of studies have found that the decay stage is one of the most important drivers of fungal species composition and richness [20,35,37,38]. Additionally, recent high-throughput DNA studies have also identified tree size and wood decay stage among two of the important predictors of fungal community composition in the wood of forest trees [39,40]. As more high-throughput studies are produced, the data generated allow for the comparison of various technical and experimental approaches [41]: this study aims at providing some comparative data on the efficiency of various sampling and analytical strategies.
Because of the often-slow rate of wood decay resulting in individual logs or trees sometimes taking hundreds of years to decay, it would not be feasible to study the decay process from beginning to end as it occurs within individual logs. Instead, most studies of wood decay rates and decay communities rely on a substitution of a space for time (SST) approach [42,43]. This approach uses different trees, logs, or snags in various states of decay to characterize fungal communities for each decay class. Though often necessary for practical reasons, this type of approach is unable to consider the effects of individual tree history, genotype, or differences in environmental conditions during the processes of growth and decay, which likely affect fungal community assemblage.
To date, no study has yet to use metabarcoding on multiple individual wood samples that are characterized by varying and known levels of decay and taken at multiple locations on the same substrate (e.g., the same tree or log). Given our understanding that wood decay often initiates in trees that are still standing [13,44,45,46], and given that wood decay in standing trees can reach the most advanced level of decay [47], we intensively sampled trees with a clear cavity lodged both in the sapwood and the heartwood, and uninhabited by wildlife. The presence of the cavity was essential to determine the location of decay on the tree and sample accordingly. In fact, starting at the center of the cavity and moving away from it (both above and below the cavity), a gradient of decay levels occurs from extremely decayed to perfectly healthy un-decayed wood. We also continued our sampling at regular intervals on healthy sections along the entire stem of sample trees.
Using high-throughput DNA metabarcoding, we studied wood fungal communities associated with varying decay stages and with varying stem locations on the same tree. Although our approach, strictly speaking, also relies on a substitution of space for time, with wood near the cavity having undergone a decay process for a longer period of time than wood away from the cavity, by sampling wood at incremental distances from a cavity on the same tree, we were able to reduce the amount of variability encountered when testing samples from genetically different hosts in distinct locations. Furthermore, the presence of cavities visible from the outside is associated with decay both in the heartwood and the sapwood, and thus the approach in part unifies the study of decay in standing trees, where heart rot fungi dominate, and in downed logs, where sap rot fungi are dominant [48].
Specifically, we hypothesized that fungal communities studied using a high-throughput DNA metabarcoding approach would include hundreds of fungal taxa and that their composition would be affected by: (a) PCR primers; (b) tree species, even when closely related and congeneric; (c) decay severity; and (d) composition and distribution of wood-inhabiting and endophytic fungi in the stem prior to decay. We additionally hypothesized that de novo models, each presuming different specific fungal community structures within a tree, can improve the explanatory power of permutational analysis of variance (PERMANOVA) when describing the composition of wood fungal communities. The results of our study can describe in detail fungal communities in wood and assist in the design of optimal sampling and analytical strategies in the study of wood decay from standing trees.

2. Methods

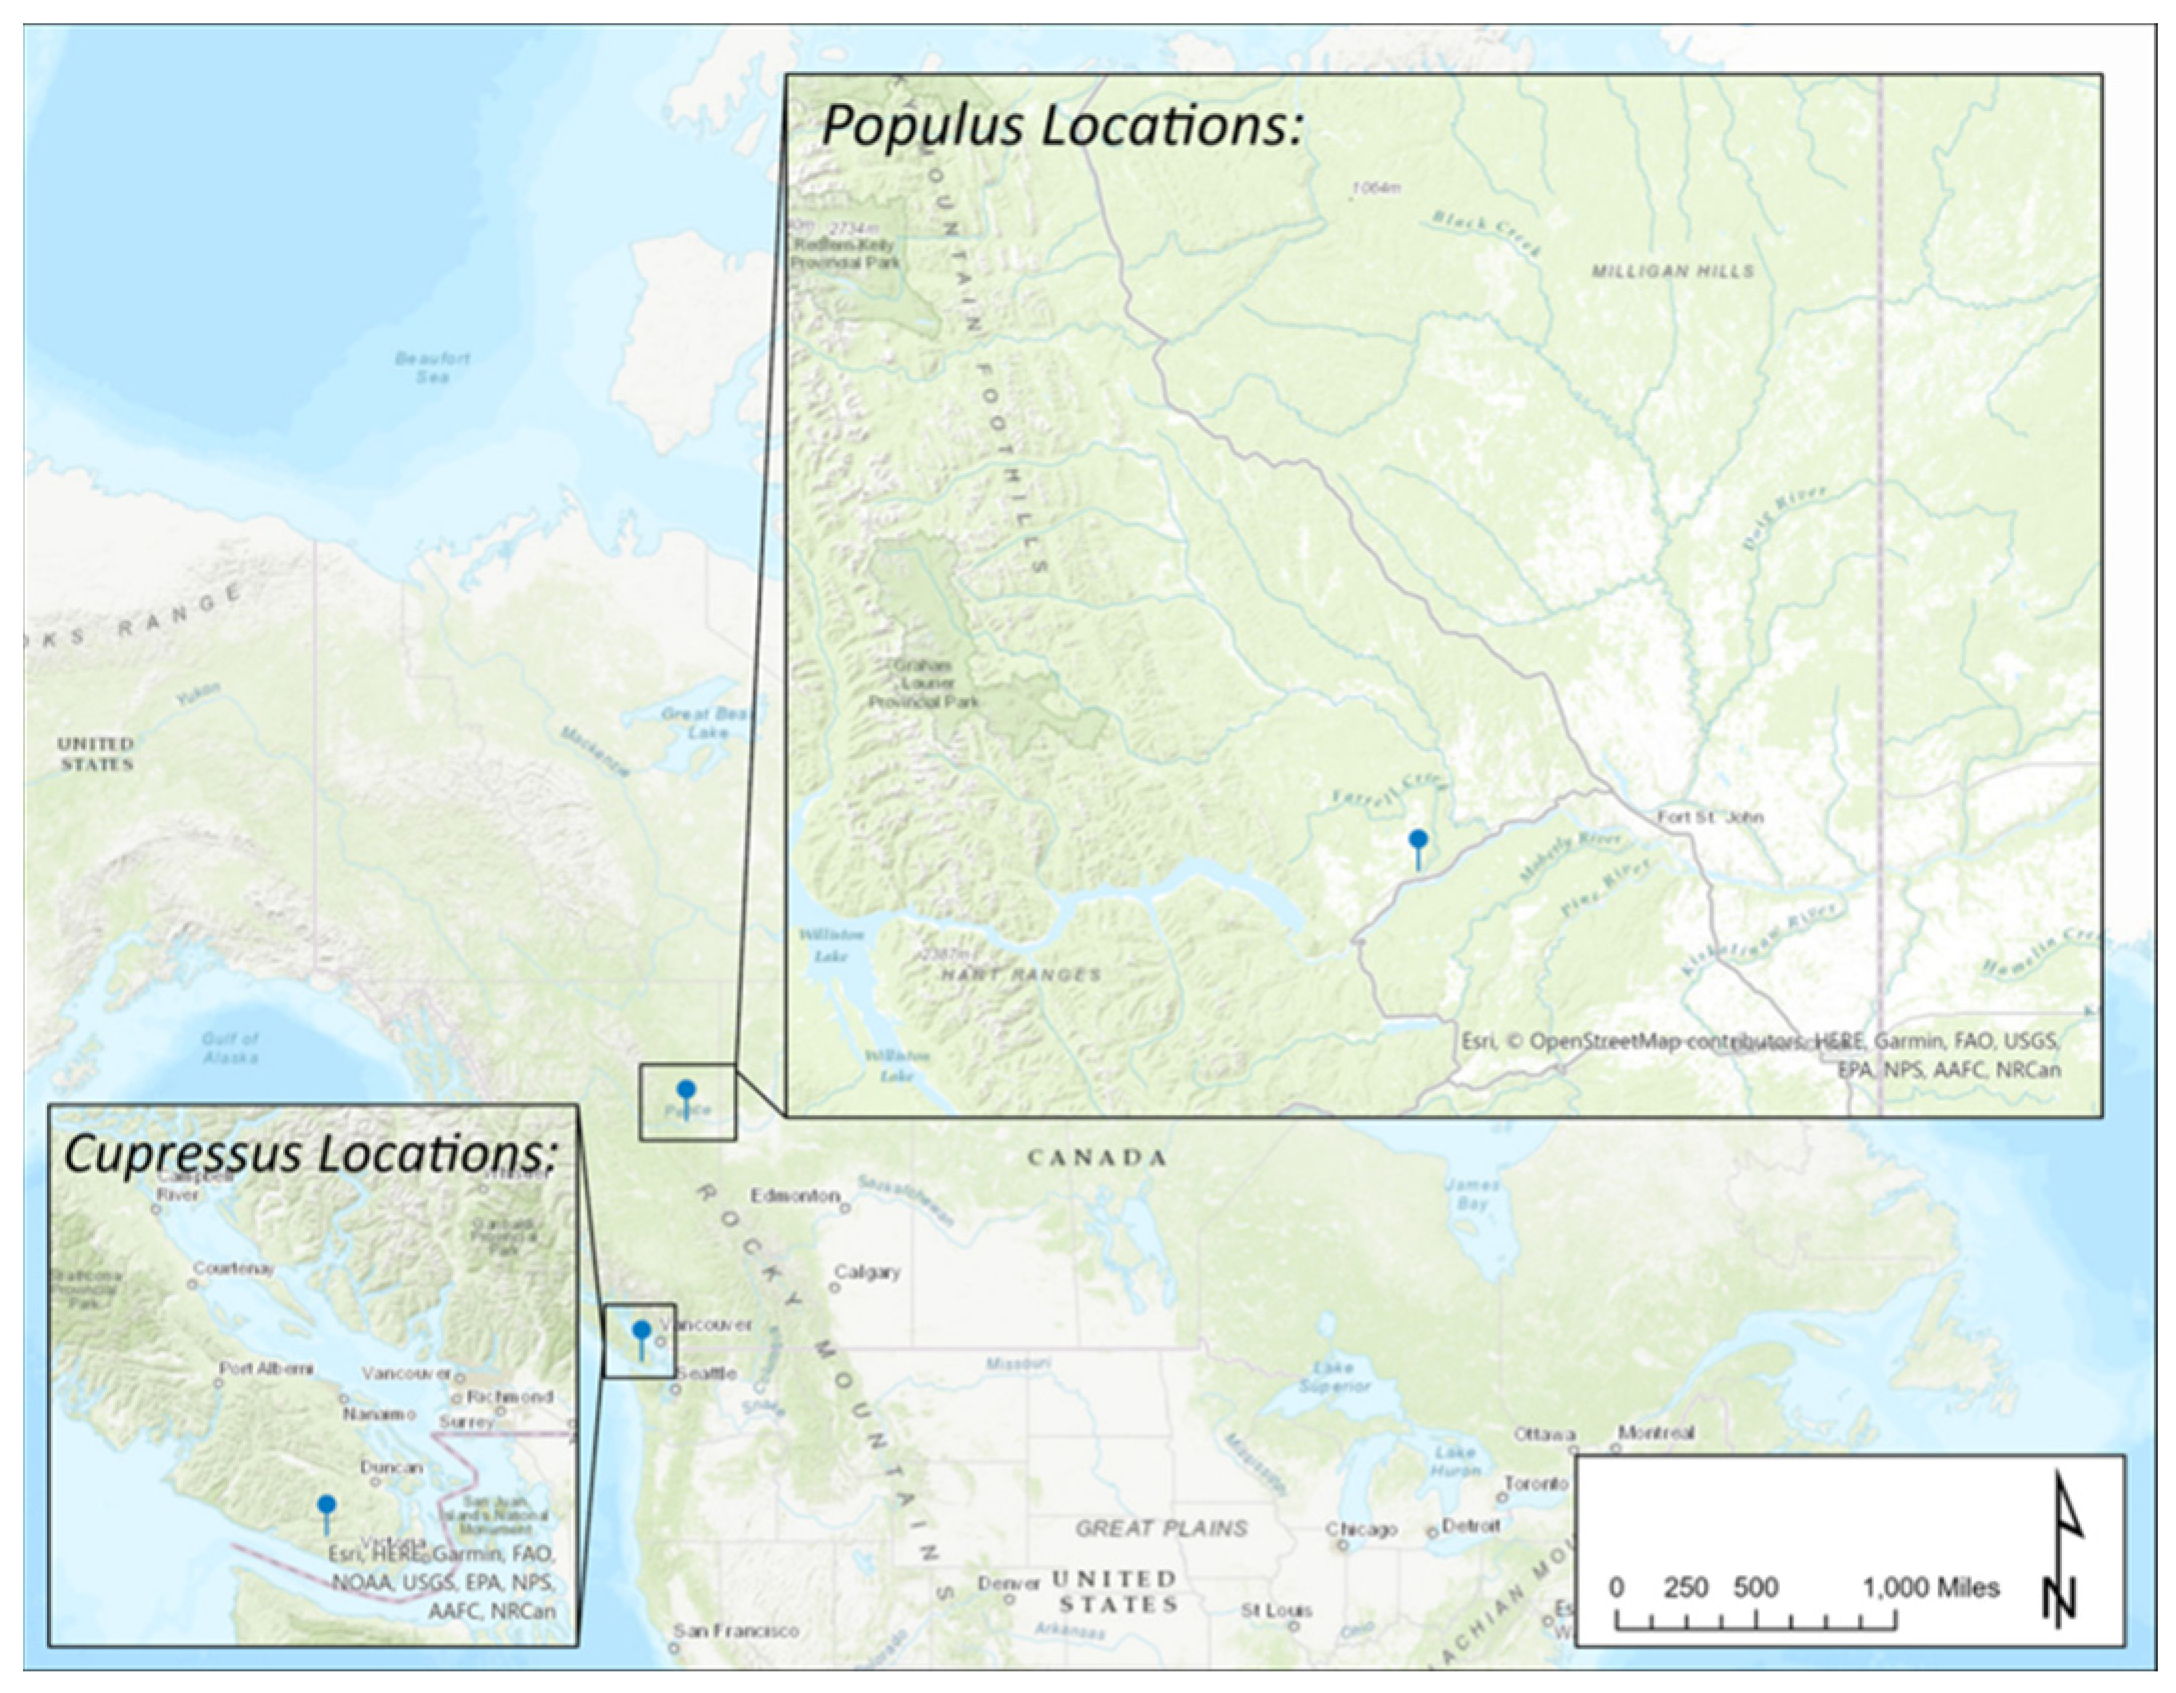
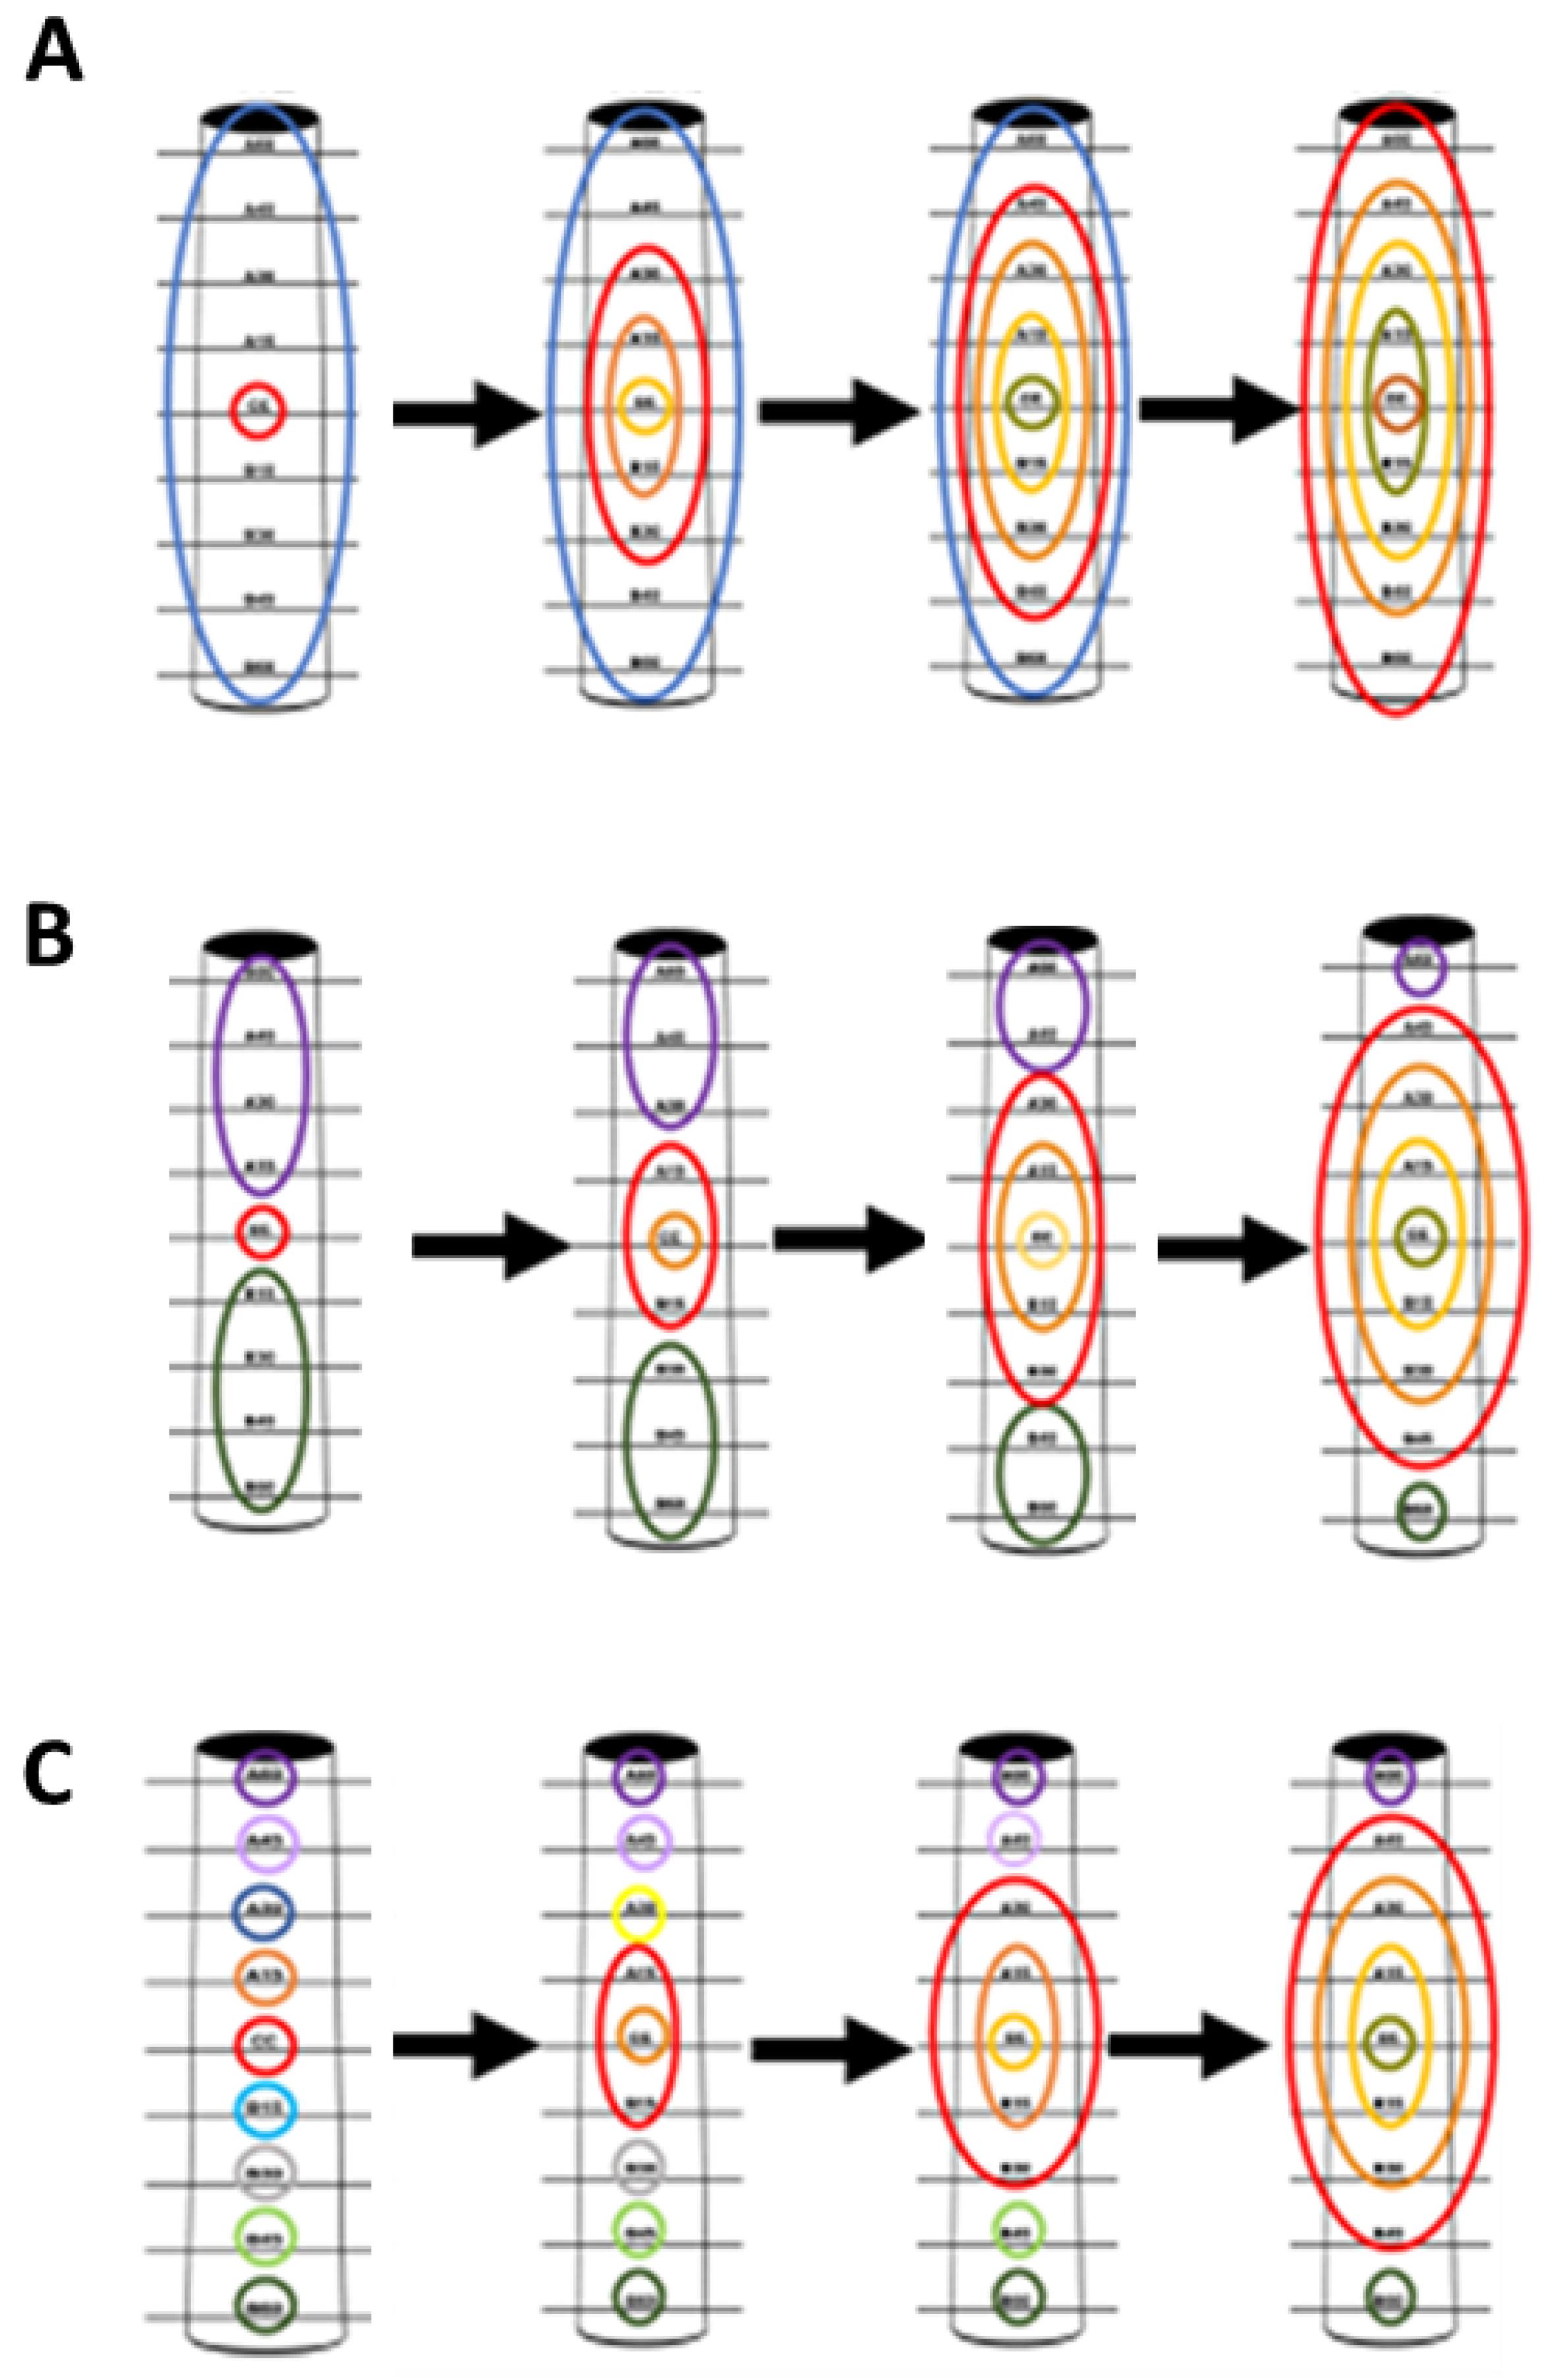
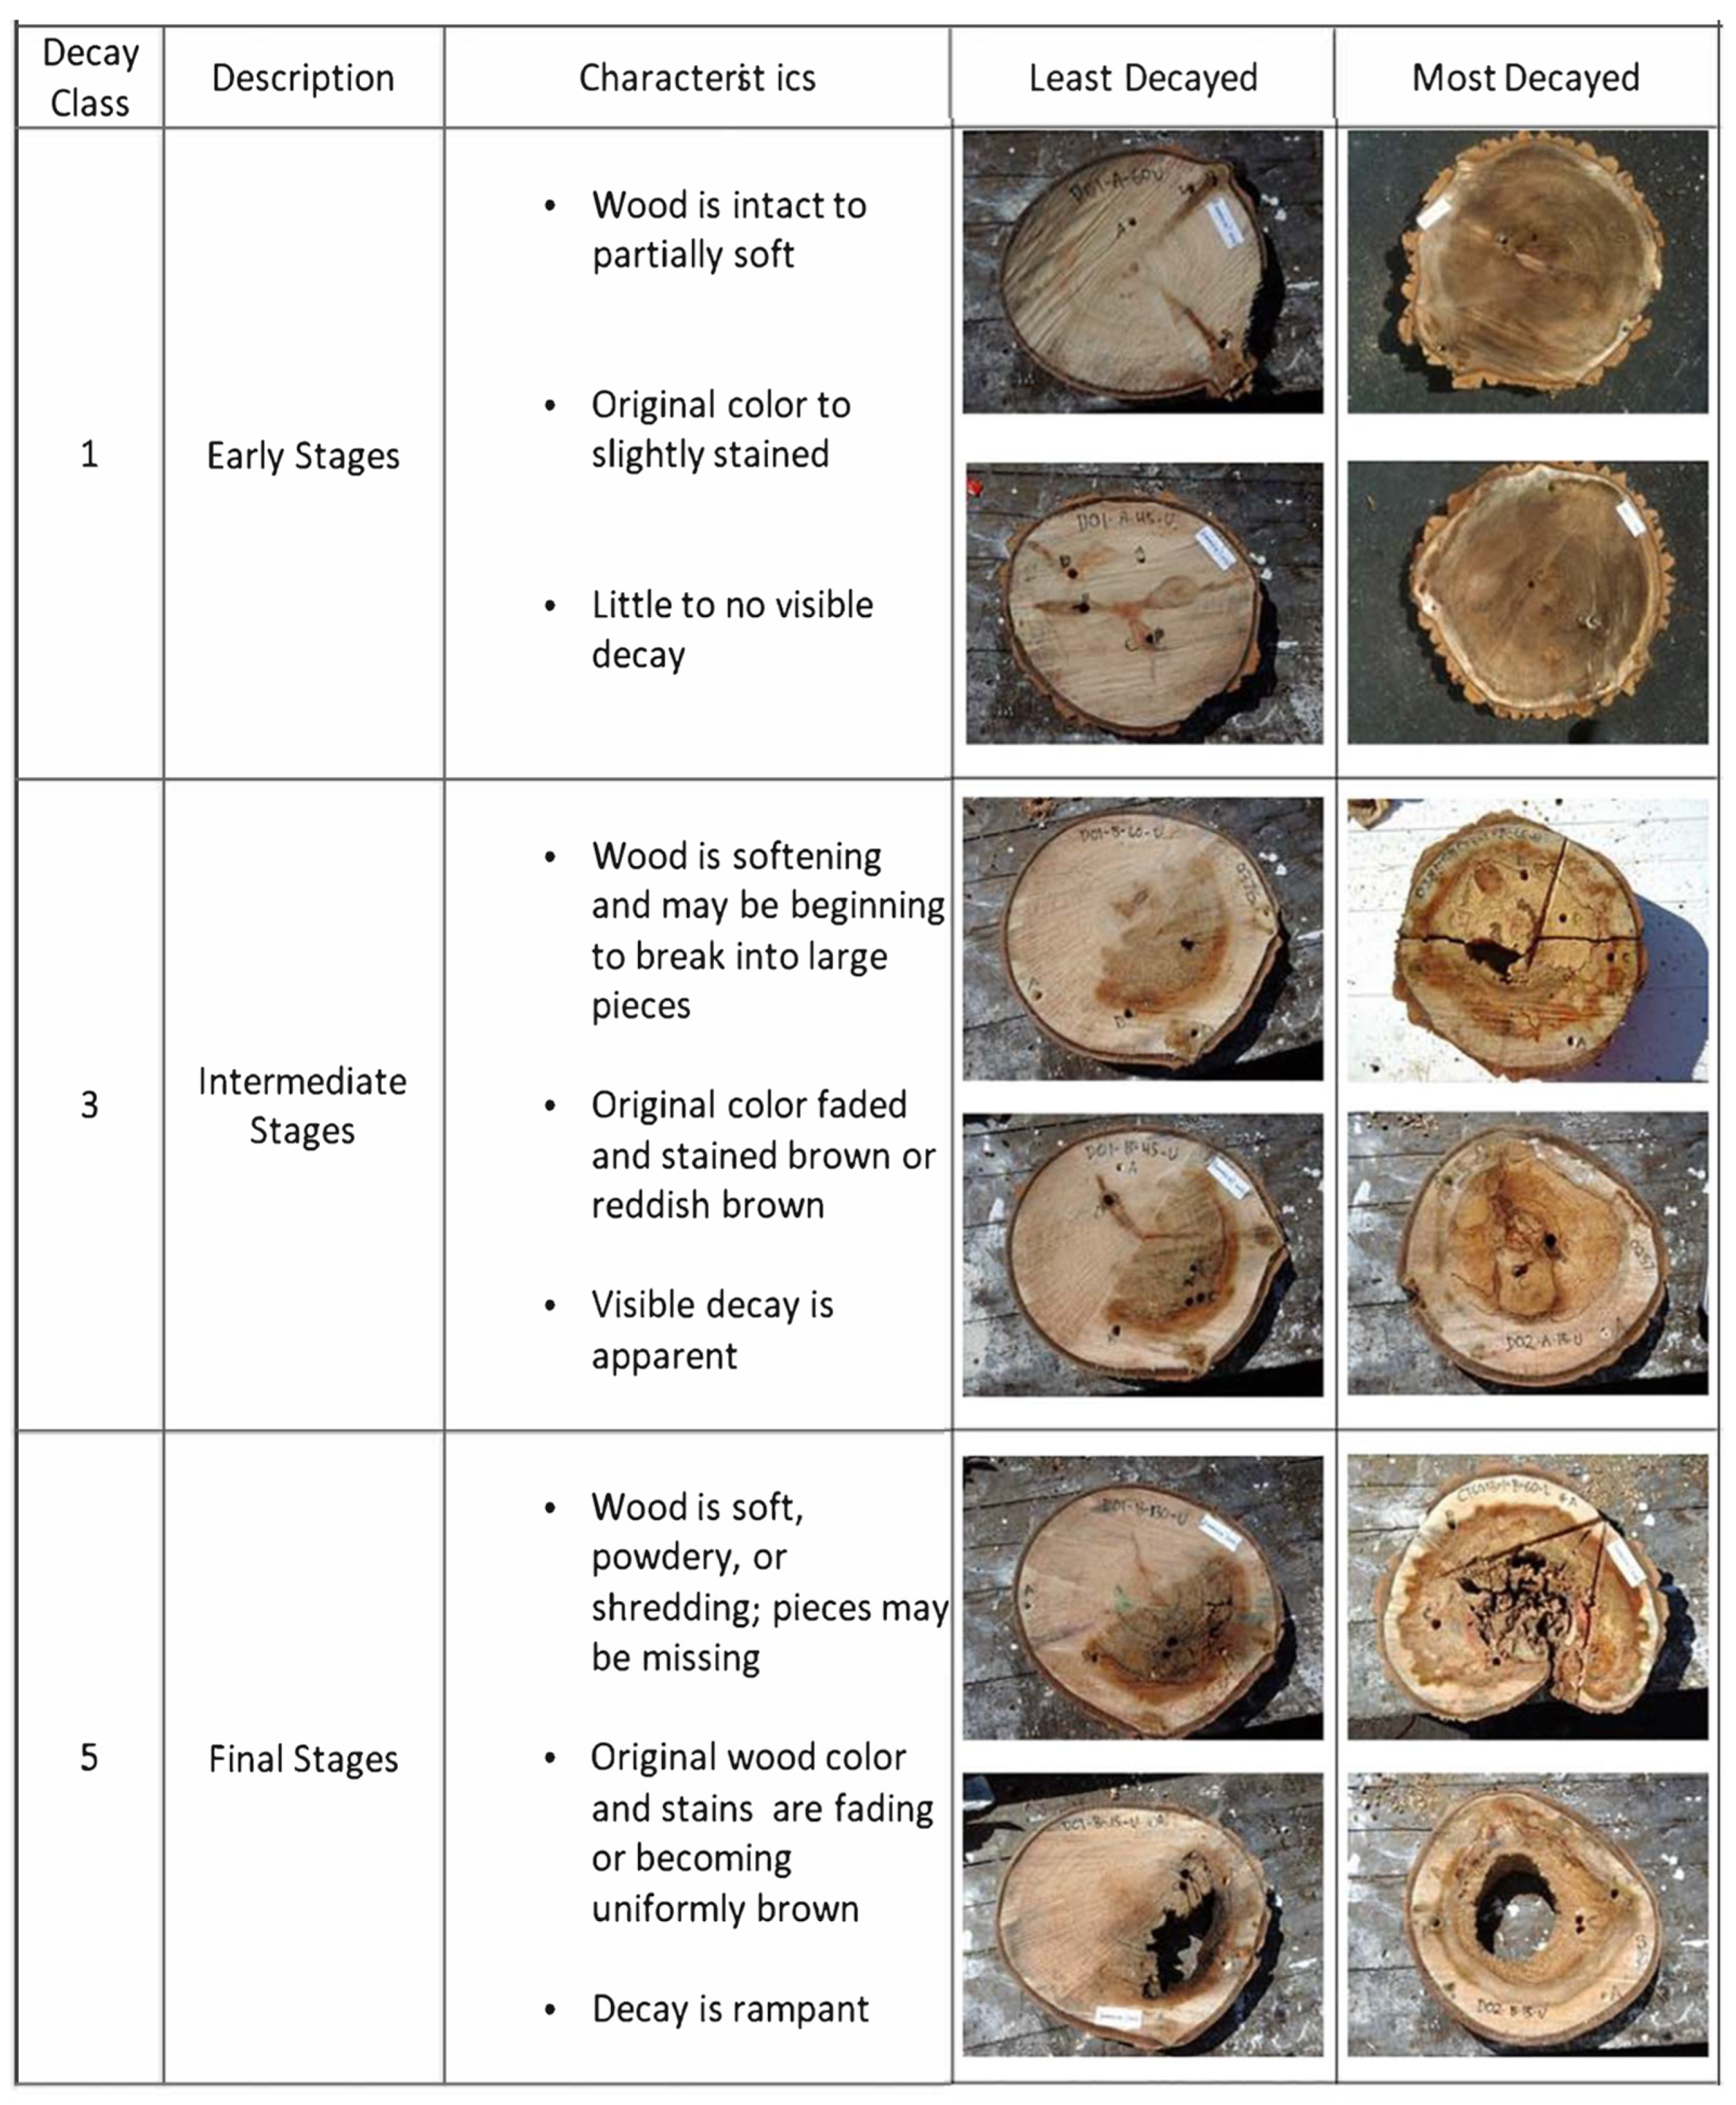
2.1. Tree Selection and Sampling Approach

Five cavity-harboring live trees uninhabited by wildlife and belonging to the genus Populus (three P. tremuloides and two P. balsamifera) in sub-boreal mainland British Columbia were selected for intensive destructive sampling (Figure 1). We overcame the difficulty of selecting trees with a truly comparable level of decay by selecting trees with cavities that were judged by field biologists as having the specific characteristics required for being “precursors” to dens for fishers (Pekania pennanti), but not yet large enough to be inhabited [49], and without any sign of stable wildlife inhabitation. This approach ensured that our selected trees were rather uniform in size with similarly sized cavities in comparable states of cavity formation.
We sampled each tree in evenly spaced planes perpendicular to the long axis of the tree bole. Four sampling planes were situated at 15 cm intervals above the cavity and four were situated below the cavity, plus an additional sampling plane included the center of the cavity itself, resulting in a total of nine sampling planes per tree. At each sampling plane, a 1-inch-thick tree section, or “cookie”, was removed from the bole of each felled tree. Before cutting each stem section, the bark areas subject to cutting were surface-sterilized by spraying a 10% solution of commercial bleach and wiping off any residual bleach with a clean paper towel. Before and in between cuts, the chainsaw was wiped clean of any wood debris using a metal brush and surface-sterilized using a sprayed Lysol application. As soon as they were cut, wood cookies were placed and sealed in a double plastic bag. Bags were kept refrigerated and shipped to U.C. Berkeley with next day service within 48 h from collection.
Within 24 h from the samples’ arrival at U.C. Berkeley, wood cookies were placed in a sterile laminar flow hood and at least four samples of drill shavings, representative of the maximum decay level present in the cookie, were collected from each sampling plane and pooled to create one composite sample per cookie. A total of 168 samples were collected and lyophilized and kept at −20 °C until further processing. All tree sections were photographed, and photos were then used to assign decay stage to individual samples. In the event of no differences between the fungal communities of P. tremuloides and P. balsamifera trees, we wanted to be able to discern whether lack of differentiation may have been a result of the limitation of our methods. In order to do this, two trees from a location clearly distinct from the Populus study site (Figure 1) and belonging to the phylogenetically distant tree species Cupressus nootkatensis (yellow cedar) were included as outgroups. These trees had large basal cavities and were non-destructively sampled by collecting and pooling three drill shavings of the cavities at breast height per tree.

2.2. Metabarcoding Analysis
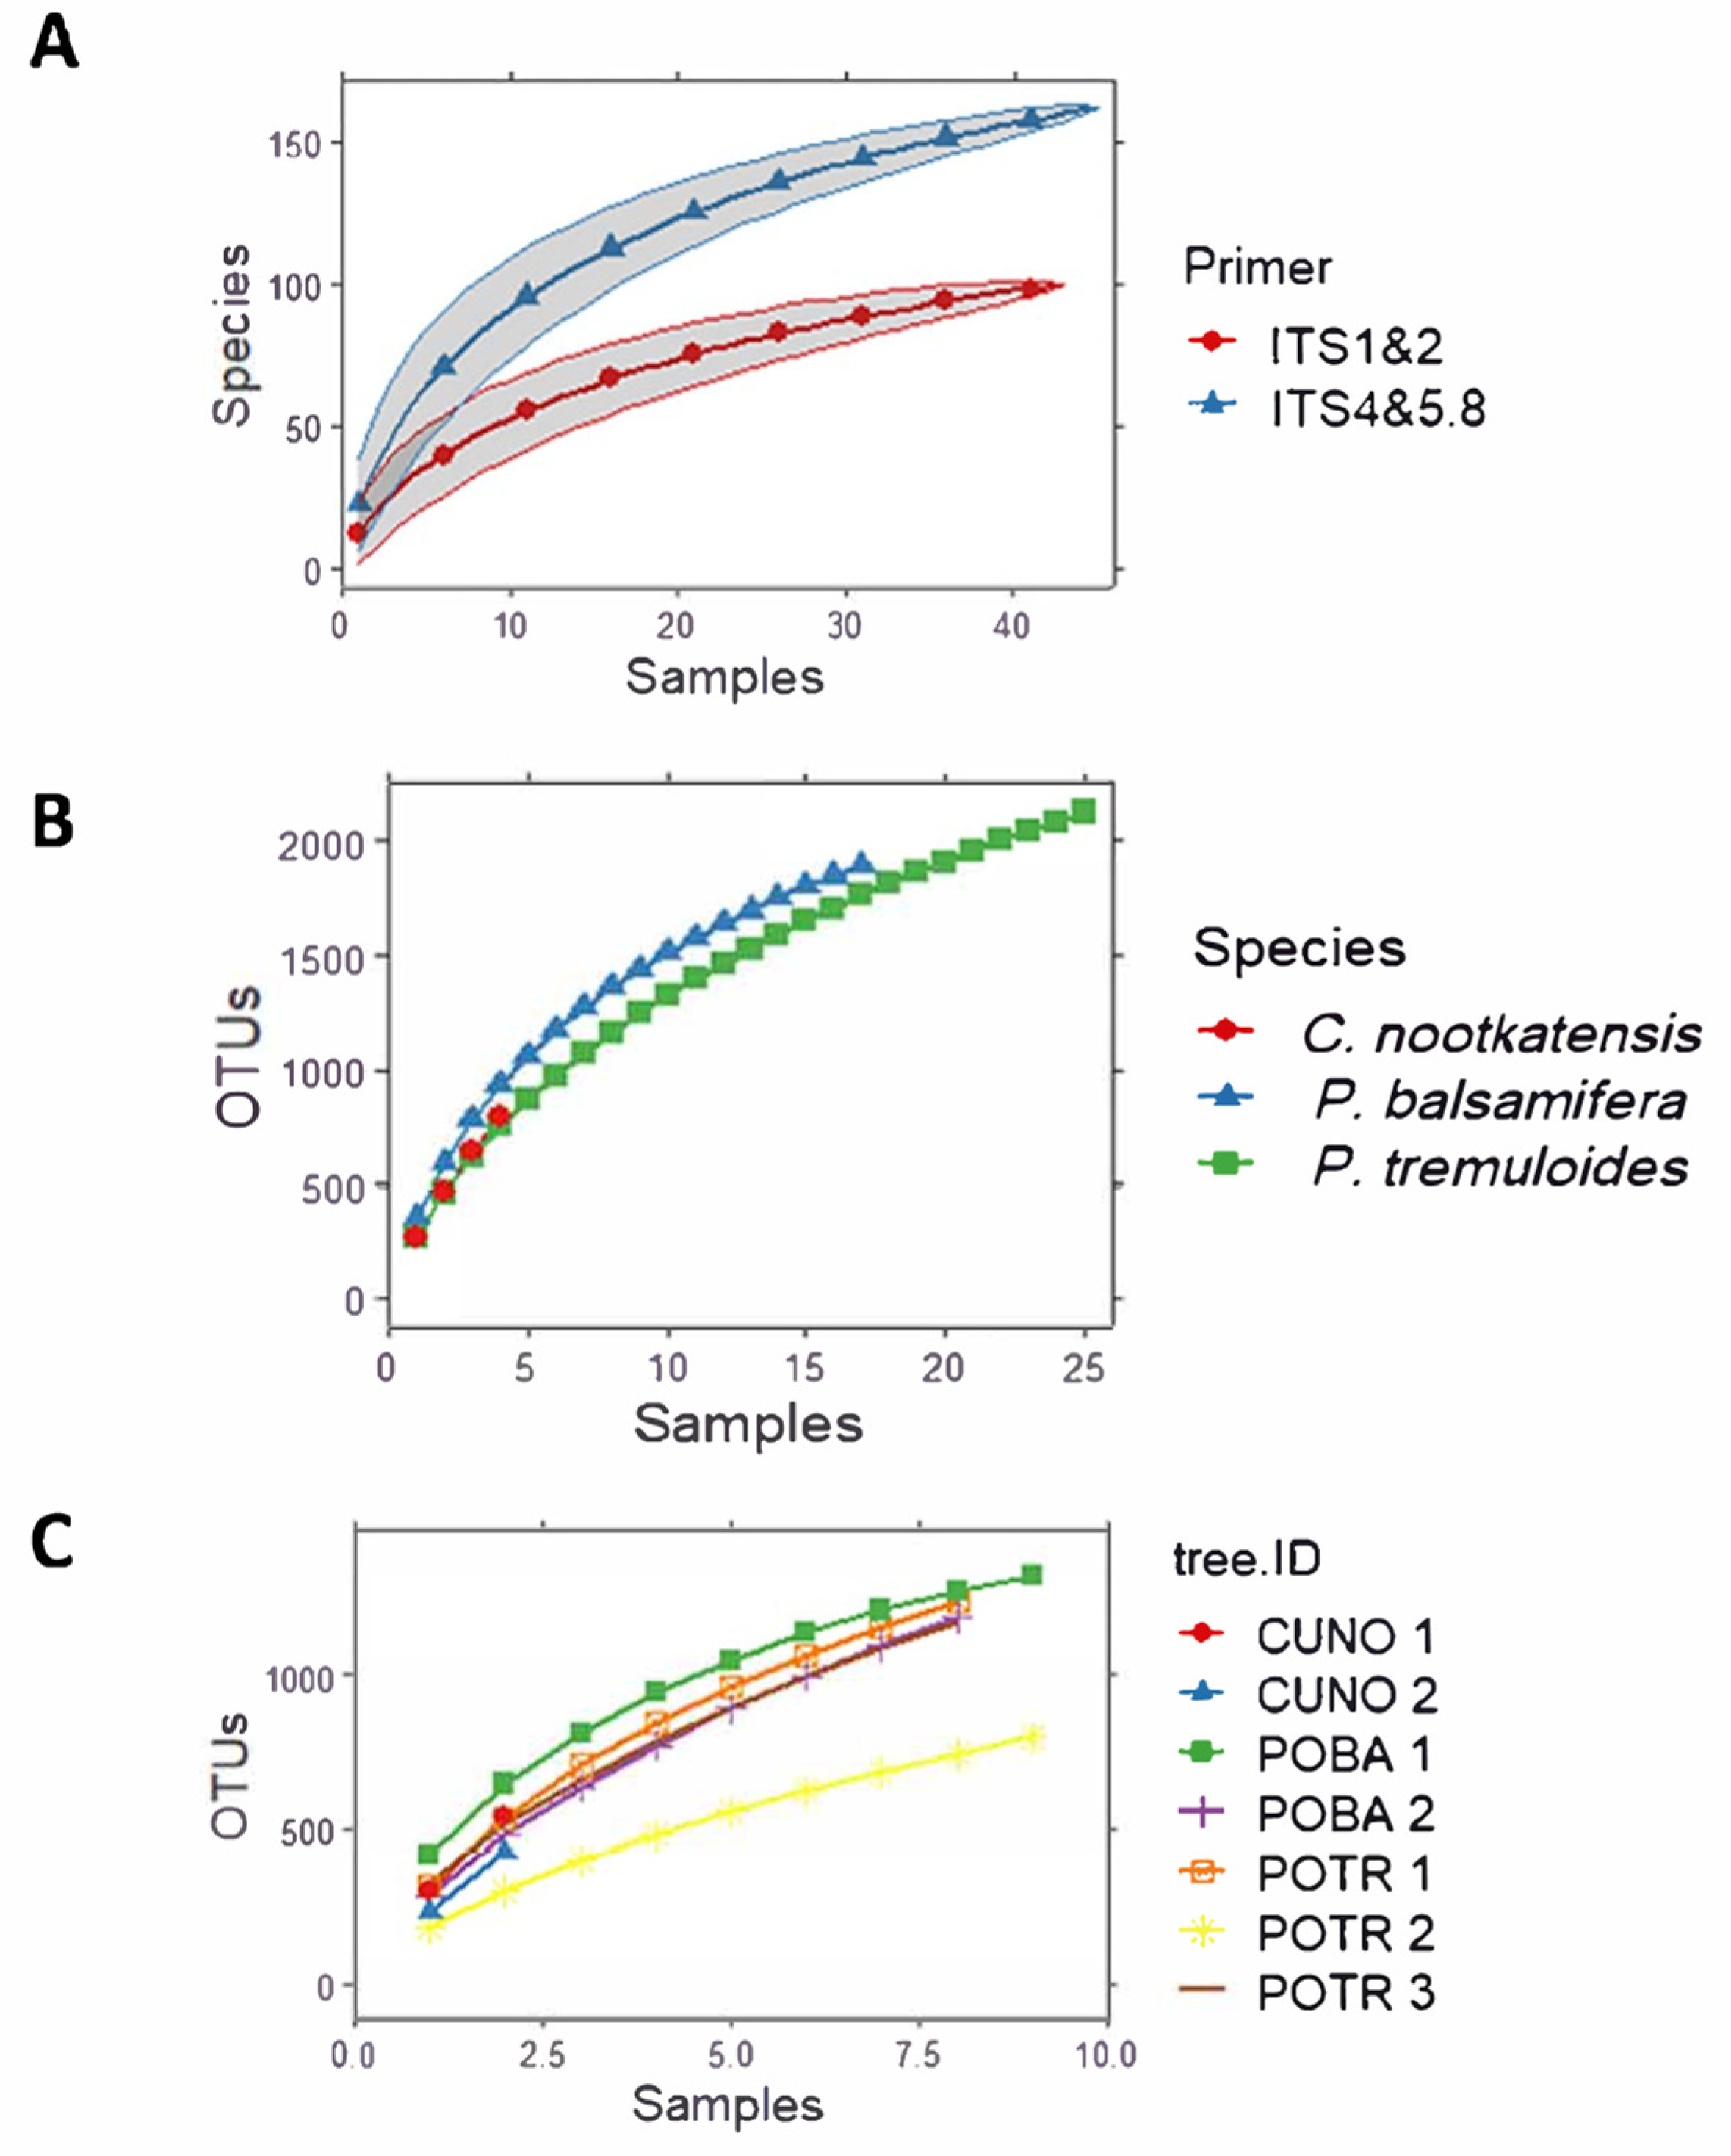
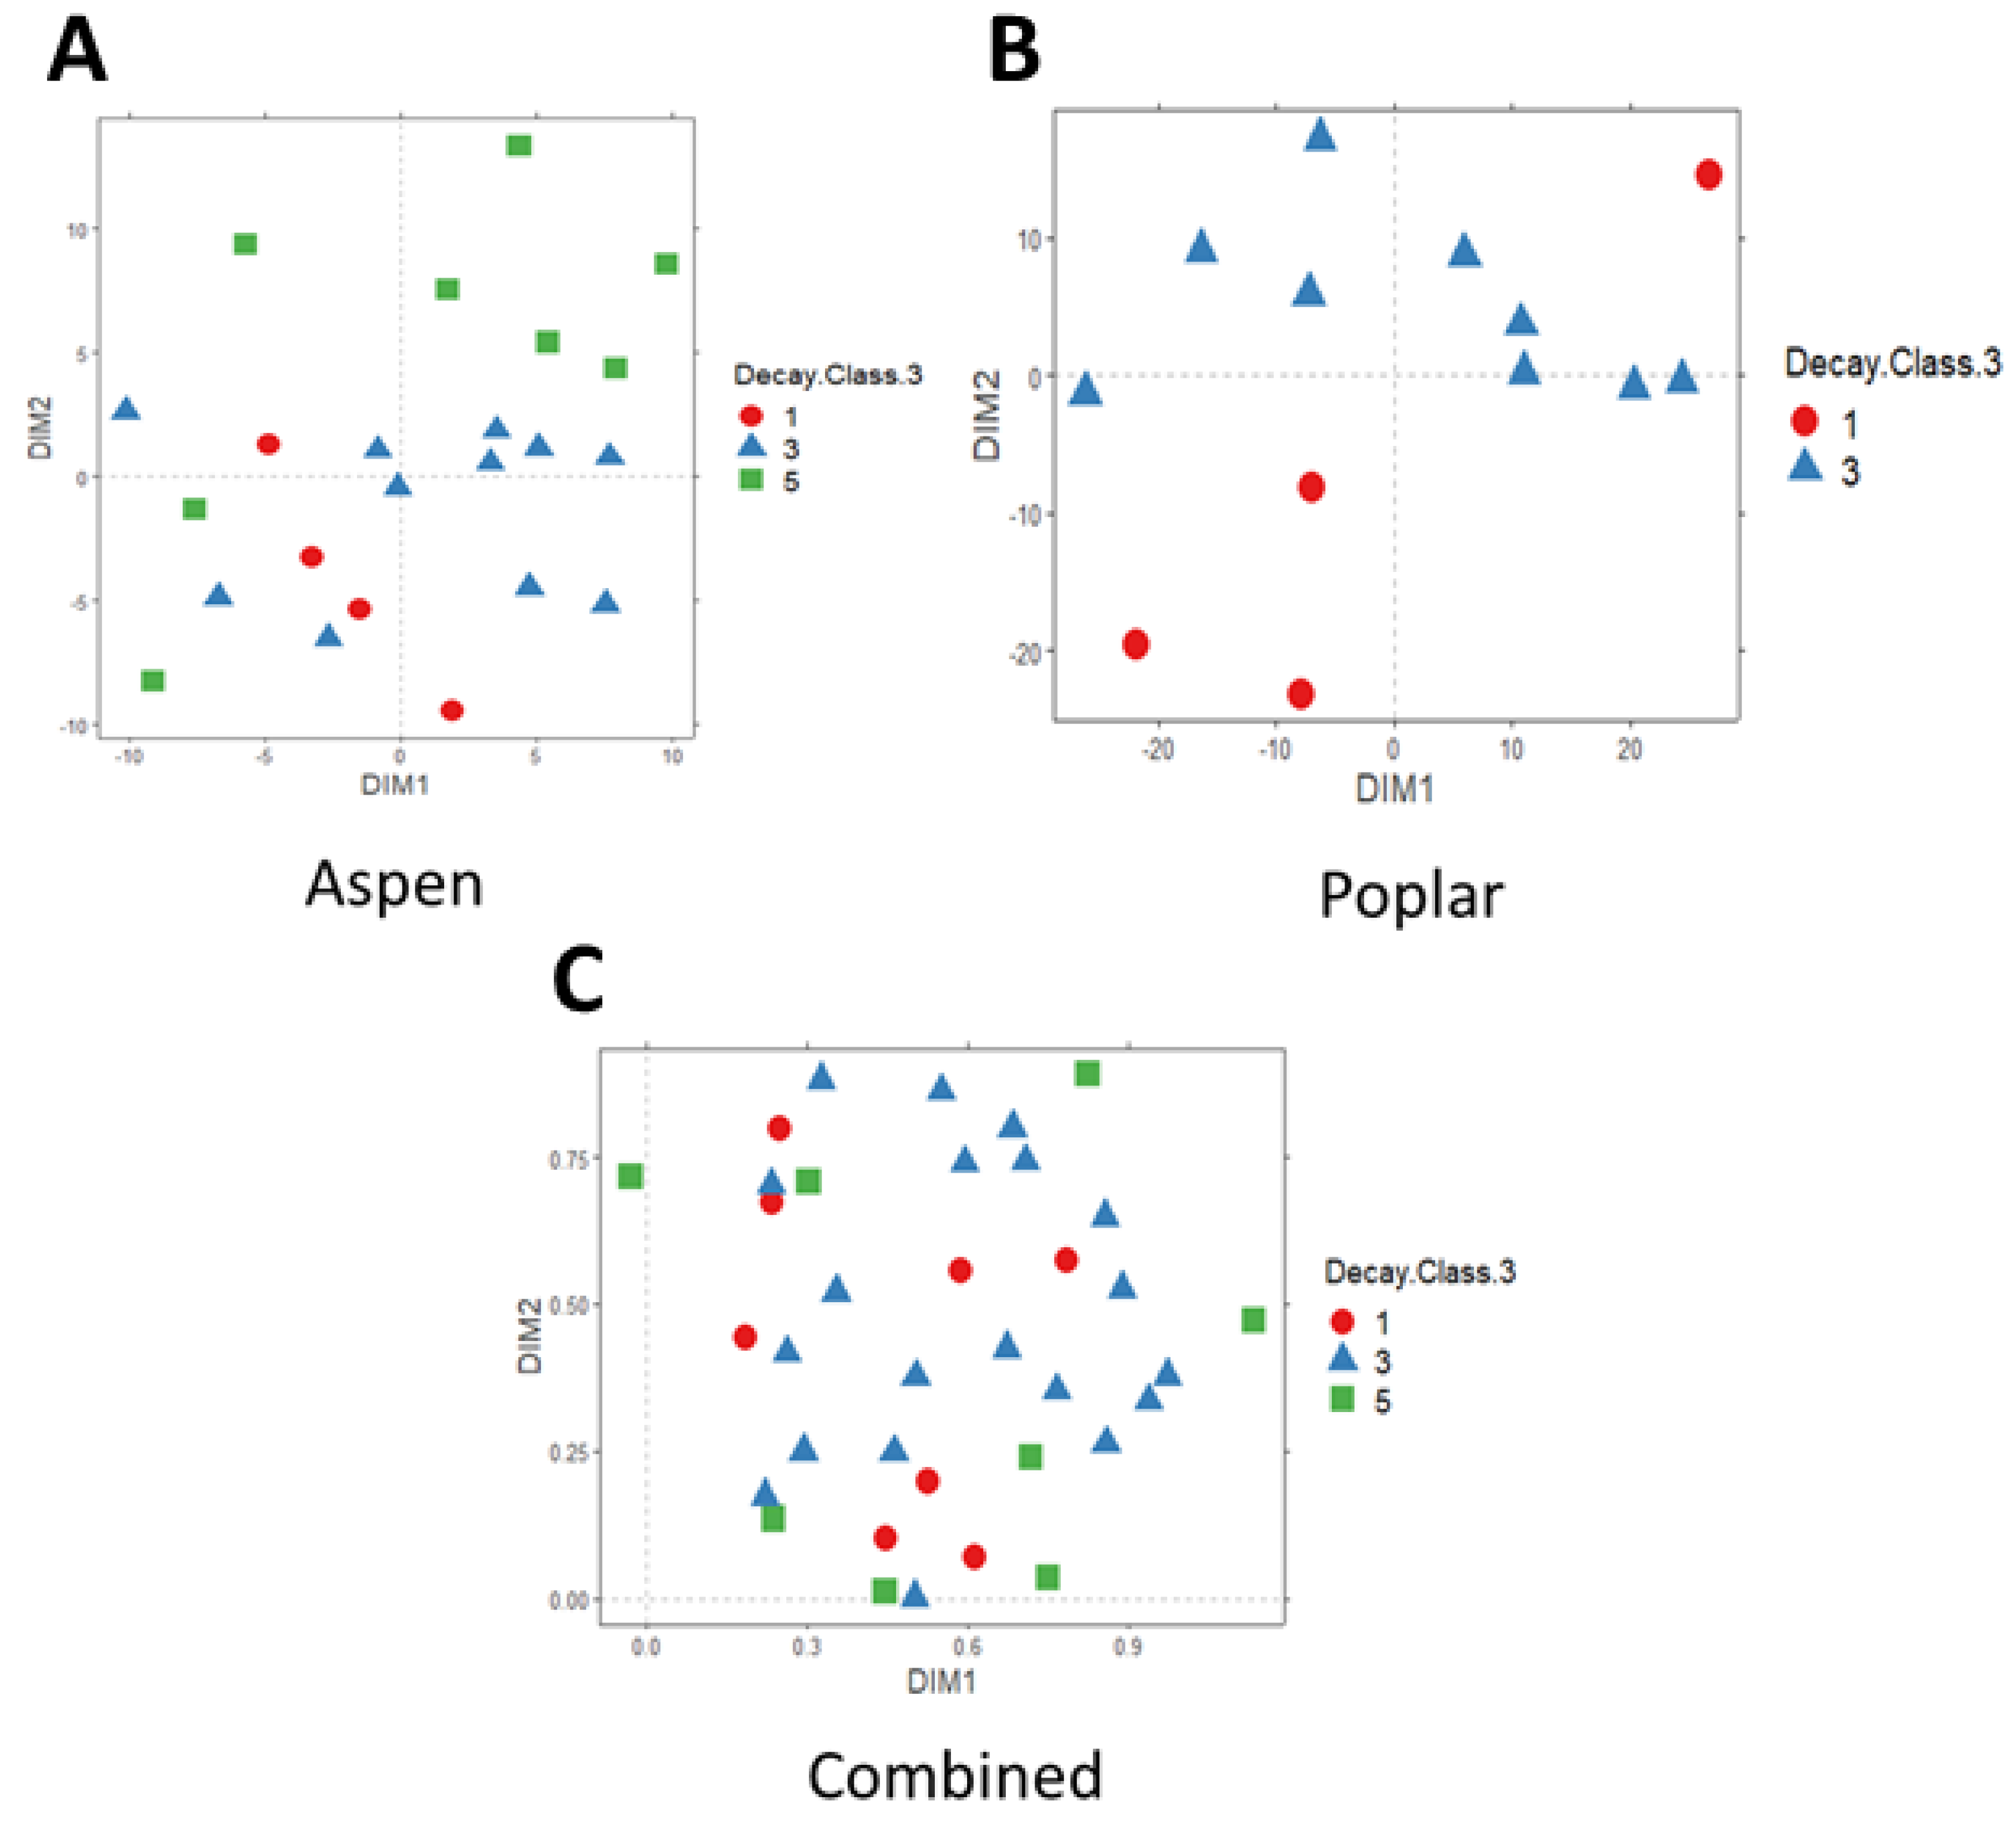
DNA was extracted with a Qiagen QiaAMP Fast DNA Stool Minikit following the manufacturer’s protocol and using 0.125 g of wood tissue, pulverized with an MP Biomedicals FastPrep 24 Instrument Homogenizer. We employed a two-step phased amplicon sequencing for our polymerase chain reaction (PCR) amplifications. The first step consisted of the amplification of two subsamples from each extraction using the ITS1-F and ITS-2 primer combination to target the ITS-1 region [50] and the 5.8S-Fun and ITS4-Fun primer combination to target the ITS-2 region [51]. These primers consisted of the published primer sequences plus one, two, three, four, or five random nucleotides to act as spacers; and stubs, which complimented our Illumina adapters. This phased approach has been shown to solve the problem of low diversity in the earliest cycles of Illumina sequencing (the variable length of the primers creates a sequencing frame shift that creates base diversity), improve base read quality, increase raw sequence output by approximately 15% (phasing eliminates the need to add PhiX to the sequencing run), and reduce sequencing errors [52]. The PCR cycling profile used was as follows: a 2 min hot-start at 95 °C followed by 35 cycles of 30 s at 95 °C for denaturing, 30 s at 50 °C (for ITS-1) or 55 °C (for ITS-2) for primer annealing, and 1 min at 72 °C for primer extension, followed by 5 min at 72 °C. The PCR products were verified using gel electrophoresis on 1% agarose gels and visualized using UV light. The second step consisted of attaching Illumina adaptors and barcodes to the PCR products from the first step. Dual-indexed adapters were provided by the Vincent J. Coates Genomics Sequencing Laboratory, California Institute for Quantitative Biosciences (QB3), University of California, Berkeley, CA, from their custom set of 960 compatible dual-index pairs (https://qb3.berkeley.edu/facility/genomics/ last accessed on 13 April 2023). The PCR protocol used included a 2 min hot-start at 95 °C followed by 15 cycles of 30 s at 95 °C for denaturing, 30 s at 58 °C for primer annealing, and 50 s at 72 °C for primer extension, followed by 10 min at 72 °C. AMPure XP beads at a ratio of 1.8 were used for clean-up after each PCR amplification. PCR products were quantified using a NanoDrop 2000 spectrophotometer and normalized through dilution in PCR water. Fragment analysis of normalized pools was completed using an Agilent Bioanalyzer, and, finally, all samples were pooled and were sequenced by QB3 using the Illumina MiSeq platform at 2 × 300 cycles.
Prior to OTU clustering, all sequences were filtered and truncated so that all reads would have a minimum length of 100 base pairs and all base pairs would have a minimum Phred Quality score or Q-score of 30 (probability of error in the call = 0.001). We used the USEARCH Ultra-fast sequence analysis pipeline [53], and denoising/ZOTU clustering (at 100% read similarity with a minimum of eight reads) was completed using the UNOISE algorithm with singleton reads of at least 97% similarity then added to ZOTUs [54,55]. SINTAX searches of Warcup Fungal ITS Training Set Vol. 2, a database of the full ITS region [56], were used to assign OTUs to taxa. A maximum of 5% error rate was applied to taxonomic assignments at each taxonomic level.
Statistical analyses were carried out using the R Statistical Computing package BiodiversityR [57]. Pairwise analysis of variance was used to explore differences in fungal community based on tree genera, tree species, tree ID, and choice of primer set used to identify community members. Samples from different stem sections within the same tree were analyzed as nested within the tree they came from. An incremental R2 approach was combined with permutational analysis of variance (PERMANOVA) to further explore independent and interactive effects of each variable, providing a base model, and to explore the effectiveness of our de novo models of community succession.
As we did not know the time of stem injury, and each tree cavity was slightly different in size (and, in all probability, start date), we used the inner upper and lower limits of the cavity as our lower and upper boundaries to take the first section above and below the cavity, thus homogenizing decay level in our samples. In other words, our first sections above and below the cavity may have been at different distances from the center of the cavity, but they all were taken at the upper and lower limits of the hollow inside the tree.
We then incorporated three competing models about fungal community structure in the tree stem before decay to determine which one of the three resulted in the greatest increase in explanatory power, i.e., produced the largest R2 increase. The three models are here described: (a) tree stem fungal community is uniform throughout the tree prior to cavity formation; (b) tree stem fungal community in the lower section of the stem differs from the one in the upper section, but it is homogeneous within each section; (c) tree stem fungal community is highly heterogeneous, with different communities, each inhabiting a different section of the tree. These three starting points or scenarios will be further referred to as models A, B and C, respectively. In any of these scenarios (Figure 2), each community from different tree samples along the stem was assigned to a different categorical variable, depending on the model. Wood from the cavity center was always assigned to its own category in all three models, but assignment of communities from stem sections above and below the cavity varied depending on the model. For instance, in model A, communities from multiple stem sections of undecayed wood in the lower and upper part of the stem would be placed in the same category, while in model B, communities from above and below the cavity would be placed in two different categories depending on whether they were above or below the cavity. In model C, the community from each stem section was placed in its own different category, irrespective of whether it was above or below the cavity. Once that was performed, we asked PERMANOVA to determine how much of the variance was explained by each categorical variable from the different models and used an incremental R2 approach to select the best model, i.e., the model with the best explanation of the variance.
Additionally, we examined the photographs of the tree cookies that provided our wood samples independently from our de novo succession models. Each cookie was assigned a decay class based on Maser et al.’s five-class system of decay in fallen logs [47]. Due to our low sample size, we modified this five-class system into a three-class system to ensure adequate representation in each class (Figure 3). Fungal communities for P. tremuloides and P. balsamifera, individually, as well as combined, were then compared using PERMANOVA analyses of models that included only the decay classes and of models that included decay class, tree species, and individual tree identification. All community differences were further explored using pairwise comparisons. Indicator Species/OTUs for all factors that had significant effects on fungal community were examined using the Dufrêne and Legendre Indicator Species tests [58], and differences were visualized using non-metric multidimensional scaling (NMDS) with a Bray–Curtis dissimilarity metric.

3. Results

Our high-throughput fungal ITS amplicon sequencing project yielded over 25.87 million reads, from which 3467 fungal OTUs were identified, combining the results of both primer sets and assigning each OTU to the lowest taxonomic rank that could be achieved while maintaining an error rate of <5% (Table 1 and Table S1). Not surprisingly, a large number of OTUs (Table 2) could not be confidently matched to sequences of known species (2660 had no match; 410 had a low-confidence match), genera (1595 had no match; 867 had a low-confidence match), or family (1213 had no match; 930 had a low-confidence match). However, the lack of matches was more surprising at the higher taxonomic levels. In fact, 751 OTUs could not be assigned to any known order (1160 had low-confidence assignments), 525 OTUs could not be assigned to any known class (780 had low-confidence assignments), and 295 OTUs could not even be assigned to a known phylum (338 had low-confidence assignments), even though they were confidently assigned to the Domain Kingdom Fungi.
The top 20 families of Ascomycota and Basidiomycota, based on the number of OTUs that could be confidently assigned to them, is shown in Table 3, while Table 4 lists the top 20 OTUs in these phyla by read abundance. It should be noted that our pipeline designated OTUs as Sequence Variants (SVs) based on a precise 100% similarity of sequence (followed by clustering of singleton reads within a 3% “cloud” of similarity), hence there were OTUs that, being highly similar but not identical, were treated separately even though they blasted to the same species (i.e., five or more distinct OTUs were confidently assigned to each of six known species within the database; four distinct OTUs were confidently assigned to each of eighteen known species; three distinct OTUs were assigned to each of seventeen species; and two distinct OTUs were assigned to each of sixty-nine known species within the database). Fungal taxa identified as indicator species (see below) of primer pair, tree genus, tree species, and decay class are provided in Table S2.
Accumulation curves were created based on these four factors of interest: primer pair, tree genus, tree species, and individual tree (Figure 4). These curves display the total number of species observed during data collection as additional samples were added to the pool of all previously analyzed samples. These curves allow for a comparison of the alpha-diversity of wood-inhabiting fungal communities associated with different groupings. When slopes of these curves flatten, as if they had reached an asymptote, this result suggests the scale of sampling was adequate to properly describe the fungal communities in the sample. The curves in Figure 4 indicated that the 5.8S-Fun&ITS4-Fun PCR primer combination consistently amplified 30%–50% more fungal OTUs than the ITS1F&2 combination did, likely due to its affinity for the more species-rich phylum, the Ascomycota. Of the 397 OTUs confidently assigned to species, 99 were only amplified by one primer set or the other. Pairwise comparisons of fungal community amplified by each primer set show significant differences (p-value = 0.027), and the NMDS analysis clearly indicates OTUs detected by each primer pair are largely not overlapping (Figure 5A).
Populus had three times as many fungi per sample than Cupressus; however, this was an expected result given the difference in sample size, and OTU accumulation curves (Figure 4) reveal that this is likely due to the small number of Cupressus samples. Notwithstanding the difference in the total number of OTUs and the analytical limitations of such difference, the NMDS analysis revealed that the fungal community of Cupressus nootkatensis was clearly distinct from that of Populus as a whole (Figure 5B). Additionally, even if specific findings regarding the community composition of wood fungi from C. nootkatensis are not discussed in detail here, because of the small sample size, an initial PERMANOVA analysis identified genus as a highly significant variable (p = 0.0009).
Populus tremuloides had approximately 20% higher species richness than P. balsamifera, and the NMDS analysis partitioned wood fungal communities from individual trees in two distinct and non-overlapping clusters based on trees species (Figure 5C). Based on the NMDS analysis (Figure 5D), individual trees had wood fungal communities that were distinct, even if partially overlapping. Finally, it is interesting to note that even in individual trees with as many as nine pooled samples per tree, rarefaction curves were close to, but had not yet reached, an asymptote (Figure 5D).
Pairwise analysis of variance of the fungal communities using all distinct OTUs within the genus Populus found significant effects on observed fungal communities at the levels of tree species and individual tree. Our PERMANOVA model (Table 5) found significant independent effects of tree species, tree, and primer pair (which also had interactive effects with each of the other two variables, resulting in primer selection alone accounting for ~21% of the total variation in fungal communities of our three tree species), giving our base model a total R2 of 0.358.
A more focused exploration on the genus Populus that included the location of the sample on each tree with respect to the cavity, using PERMANOVA and an incremental R2 approach, indicated that, although pairwise comparisons did not show significant differences between any of the sampling points along the tree trunk, the absolute distance of the sample from the center of the cavity had independent effects as well as significant interactions with tree species and tree, explaining an additional 15% of fungal community variation (Table 6).
When our de novo models of succession (i.e., models A, B, and C) were added to the above base model, the primary models A and B had significant independent additive effects and increased R2 by ~0.025 and ~0.045, respectively; additionally, both also had interactive effects that increased R2 by ~0.072 and ~0.197, respectively. The primary model C had no additive affects, and interactive effects could not be determined as the similarity between the community structure factor and the distance from the cavity resulted in 0 as the sum of squares and an infinitely negative mean squares value. The diverse, abundant community structure presumed in model C provided no improvement when compared to the basic additive model (tree species, tree ID, and distance from cavity). In the end, the B iteration of our models of succession held the most explanatory power. Table 6 shows that in comparison with a model that considered only the distance of the sample from the cavity and the sample’s placement above or below the cavity, our model explained 5.8% more variability in fungal communities, with a total R2 of 0.815.
The Indicator Species tests [58] were also conducted to explore trends in fungi that were amplified by ITS1F&2 and 5.8S-Fun&ITS4-Fun. Of the 3467 OTUs, 739 were found to be Indicator Species of a primer set, 358 of ITS1F&2, and 381 of 5.8S-Fun&ITS4-Fun (Table 7). When tree species were compared (excluding the outgroup C. nootkatenis) combining both primer sets, there were 44 P. tremuloides indicators, while P. balsamifera had 210 (Table S2).
Pairwise comparisons of fungal community based on sample decay class found significant differences between all three decay classes in our modified decay classification system for P. tremuloides, P. balsamifera and for both species combined (Table 8). The PERMANOVA analysis of a model including tree species, individual tree, and decay class confirmed the effect of decay class on the fungal community (Table 9), and this was visualized using NMDS analysis (Figure 6).
Overall, and in ranking order in terms of number of reads, the top five Ascomycota families identified in wood by this study were the Xylariaceae, Saccharomycetaceae, Herpotrichiellaceae, Helotiaceae, and Diatrypaceae. The combined number of reads of these five families (~2.6 million) is comparable to the number of reads from the top five ranking Basdiomycota families (~2.1 million), indicating both groups of fungi are well represented in Populus wood. However, the overall number of reads of ascomycetes (~5.8 million) is basically double the number of reads of Basidiomycota (~2.9 million) obtained from the same substrate. Overall, and in ranking order in terms of reads, the top five families of Basidiomycota were the Hymenochaetaceae, the Pleurotaceae, the Hydnaceae, the Sporidiobolaceae, and the Auriscalpiaceae. Although the Tremellaceae ranked first in number of OTUs, they were not included in the top five families in terms of number of reads.
When comparing fungal communities from Populus samples in the three distinct classes of decay based on the photographs (1 or healthy, 3 or intermediate, and 5 or very advanced; (Figure 3), communities were significantly different among the three classes. This was true when comparing samples within species (P. tremuloides or P. balsamifera) or when comparing the two species together (Table 8 and Table 9). P. tremuloides had the largest sample size and thus fungal communities associated with different stages of decay in this species were analyzed more in-depth by looking at the top-ranking 10 OTUs in terms of the number of reads in each wood decay stage. Table 10 lists the top ten fungal OTUs (by number of reads) for each of the decay classes analyzed above for P. tremuloides. Although the same OTUs may be present in samples with different decay levels, the three different wood decay stages showed almost no overlap in terms of the 10 OTUs with the largest number of reads, and minimal overlap in terms of fungal families represented.
In decay class 1, i.e., healthy or minimally stained wood, the largest number of reads belonged to OTUs that, although fungi, could not even be assigned to any known fungal class, order, or family. A comparable high number of OTUs in decay stage 1 belonged to the Malasezziaceae (Malasezzia spp.) and Saccharomycetaceae (unknown spp.), two families of ascomycetes both known to include a vast number of yeast species found in the most diverse substrates in the world, including wood [59,60]. Finally, the Leotiomycetes and the Agaricomycetes were also very well represented in decay class 1 samples. Although the lifestyles of species in these two fungal classes can be extremely varied, they both include many species that can be endophytic in at least one stage of their life.
In decay stage 3 samples, i.e., samples with intermediate decay, the dominant fungal community structure changes dramatically, and the pathogenic genus Phellinus (Hymemochetaceae, Agaricomycetes) was clearly dominant. Once again, yeasts were important and ranked second in terms of reads. However, in decay stage 3, dominant yeast OTUs were different from those detected from in the stage 1 decay samples. Here, Candida and Pichia spp. (Saccharomycetacae) dominated. Finally, a Neobulgaria sp. (Helotiaceae) was also abundant in this decay stage.
In decay stage 5, i.e., samples with the most advanced decay, once again, we observed a shift in the composition of the dominant fungal community, with different dominant OTUs ranking as the top ten most abundant species. Here, OTUs belonging to the Xylariaceae (Xylaria spp., Hypoxylon macrocarpum, unknown species) and the Hydnaceae (e.g., Sistotrema raduloides) were dominant. Among the most dominant OTUs, we found the yeast Capronia pilosella (Herpotrichiellaceae).
The NMDS ordination performed to visualize differences among the three decay stages communities in P. tremuloides (Figure 6) shows a clear separation of samples in decay stage 1 and 5, while samples in decay stage 3 overlapped with the other two stages. Samples from decay stage 1 were included within decay stage 3 samples, and two decay stage 5 samples appeared to be disjunct from all other decay stage 5 samples.

4. Discussion

4.1. A Hyper-Rich Fungal Community Is Found in the Wood of Two Populus Species

The number of reads in this experiment was high, and so was the number of sequence based fungal OTUs, well exceeding 3000. This high number, generated by combining OTUs obtained with both primer pairs, is obviously an inflated estimate of the total number of species for two reasons. First, OTUs with highly similar but not identical DNA sequences were regarded as different Sequence Variants (SVs) [61]. The presence of highly similar yet different SVs may indicate that classic morphology-based fungal taxonomy still has to catch up with the phylogenetic-based species concept [62], or it may indicate the presence of significant intraspecific genetic variation [63,64]. Second, multiple OTUs generated by different primer pairs and assigned to the same taxonomic level, higher than species (e.g., both sequences were matched to the same family), could, in fact, originate from the same individual, and thus should be counted as the same OTU. The determination of how many of these 3467 OTUs may actually be duplicates is virtually impossible, given the analytical tools employed in this study, with the exception of OTUs that could be assigned to species, in which case the ITS1 and the ITS2 would have been matched to the same complete ITS sequence. Although the number of OTUs may be halved to 1733 if we had complete duplication of results between the two primer sets, complete OTU duplication is highly unlikely given that 28.5% of 347 OTUs that were confidently identified to the species level were unambiguously amplified only by one primer set or by the other. Accordingly, by applying these percentages to the entire OTU dataset, we estimate that the maximum percentage of full duplication may only occur for approximately 72% of the total number of OTUs, resulting in a maximum 36% drop (76/2 = 36) in the total number of OTUs from 3347 to 2142.
Given that the purpose of this study was not to describe in-depth the number of fungal species within a single substrate, but rather to compare fungal communities from different hosts, stem locations, and decay stages, the inclusion of fungal intraspecific genetic variability actually increases the power of the analysis. In fact, any intraspecific variability associated with host, stem location, or decay stage would be lost if similar but non-identical sequences were clumped together in individual OTUs. Of course, using 100% sequence similarity has its own drawbacks, and it implies limited sequencing error. While random errors are not likely to affect the results, systematic reaction- or substrate-based errors could bias the results. In order to increase the confidence of the dataset, we used replicated biological filters and sequences with high Phred Q-scores to ensure that neither chance nor sequencing ambiguities may be responsible for the analytical outcomes. It is also encouraging that a recent study has shown high correspondence between haplotypes generated by HTS and those obtained by Sanger sequencing [64]. Finally, while using 97% similarity among sequences to generate a single OTU would have allowed for a better estimate of the number of species [64,65], that approach has its own limitations. First, the 97% threshold for species identification is not uniform across the fungi [63]; second, pooling multiple sequences in a single OTU inevitably decreases the estimation of the abundance of the species, genus, family, or order that the OTU has been assigned to. If abundance and substrate preference is of interest, then using a 100% similarity approach may be a better alternative, especially when many sequences in the database cannot be identified with confidence at the species level [56]. This approach is echoed by many ecologists and epidemiologists, and a call has been made to use sequence variants or SVs rather than a priori OTUs [66]. Our approach effectively is based on an analysis of SVs.

4.2. Wood Fungal Communities Vary Depending on PCR Primers Used in High-Throughput DNA Metabarcoding

Based on the PERMANOVA, NMDS, and Indicator Species analyses (Figure 5, Table 5), our data show that primer set selection can have strong effects on the description of fungal communities. This has been shown when primers amplify different loci [17], but also when they amplify the same locus [67]. This result indicates that using multiple primer pairs may provide a more complete and less biased description of fungal communities in wood than using a single primer pair [68]. The debate has been intense about the suitability of the ITS region as the genetic barcode for fungi; however, the ability of ITS to discriminate a large number of fungal species [69], including thousands of wood-inhabiting agarics [65], and the large number of fungal taxa for which the ITS has already been sequenced [63], all but guarantee the likelihood that it will remain a cornerstone of fungal ecology. Tedersoo et al. [68] echo this sentiment; however, until high-throughput amplicon sequencing technology improves to the point of capturing the entire ITS region--researchers are faced with having to choose ITS1 vs. ITS2, each of them with its own pros and cons [51,65,70]. We suggest that one way to minimize primer bias and maximize captured diversity, while working around high-throughput sequencing limitations on read length, is to employ multiple primer sets which target ITS1 and ITS2 independently, as we have done by using both ITS1F&2 and 5.8S-Fun&ITS4-Fun.

4.3. Wood Fungal Communities Vary Depending on Tree Species

Tree genus and species were found to have a significant effect on fungal community (Figure 5; Table 5 and Table 6) and are likely to be drivers of fungal biodiversity on the forest floor. Accordingly, they should be taken into consideration in any forest management plan that aims to conserve forest biodiversity. Each tree species had a sizeable number of Indicator Species [58], showing that some wood-inhabiting fungi are host-specific, even when comparing closely related congeneric Populus host species. While differences in wood-inhabiting fungal communities have been reported for distantly related tree species [5], and host specificity of many wood-inhabiting fungi is well known [71], this is one of the first reports on a clear distinction in the entire fungal community composition of wood-inhabiting fungi when comparing closely related congeneric tree species.

4.4. The Composition of Wood Fungal Communities Varies Depending on Wood Decay Stage

The PERMANOVA, NMDS, and Indicator Species analyses all showed that fungal communities associated with different wood decay stages were different (Figure 6; Table 8, Table 9 and Table S2). Likewise, dominant fungi differed when comparing various wood decay stages. In samples at decay class 1 (the class described as having little to no visible decay), large read numbers were found for unknown taxa in the Agaricomycetes and Leotiomycetes. The lack of precise species-level identification for many sequences in this case indicates there are taxa within known fungal groups that either have still to be identified or that have yet to be sequenced. Both fungal classes above, however, are known to include wood endophytes, which is consistent with our detection of these fungi in healthy wood. Malasezziaceae were the dominant yeasts in healthy wood. Their dominant presence in wood is interesting, given that Malasezzia spp. are increasingly being found in a variety of terrestrial, marine, animal, and plant substrates and have been identified as having an unexpectedly rich array of catabolic and metabolic genes [60], a result that could explain their ability to live in healthy wood.
Phelllinus spp. and Phellinus tremulae, in particular, were dominant in the intermediate decay class 3; these are fungi that can persist as endophytes before shifting to a pathogenic lifestyle. It makes sense that decay would be initiated by this genus and by P. tremulae, in particular, given that this is a well-known pathogen of Populus tremuloides, and its fruitbodies were observed in the study sites, although not on the trees we sampled. Phellinus spp. were dominant in decay class 3 wood, but this does not exclude that they may have been present in samples displaying lesser decay. The dominance of a Neobulgaria sp. in decay stage 3 is also interesting, because species within the genus are known to cause wood discoloration in healthy trees and to be frequently found in decayed wood [72]. Hence, based on the literature, the presence of species belonging to this genus might be expected in early to intermediate stages of decay, although their dominance is probably a novel and relatively unexplored result.
It is interesting to note that yeasts in the Saccharomycetaceae were dominant both in decay class 1 and 3. Although the OTUs belonging to this family were different in different decay classes: this finding suggests that these yeasts are capable of an endophytic lifestyle in healthy wood and may later contribute to decay wood. Many Saccharomycetaceae have also been associated with the formation of soft rot, a secondary decay process that can persist even when conditions become unfavorable to other wood decay fungi [73,74]. Given the dominance of these yeasts in wood and given the shift in yeast OTUs that were dominant in different wood decay classes, we believe the role of yeasts as endophytes in healthy trees, as well as their role in the wood decay process, needs to be studied in-depth.
The dominance of Hypoxylon macrocarpum and Sistotrema raduloides in decay class 5 wood samples from P. tremuloides is also of great interest. Both species are known to be weak pathogens and excellent saprobes, hence, their presence in the later stages of decay is to be expected, although we believe this to be one of the first studies reporting their dominance in late-stage decay of Populus spp. Both species have the ability to initiate wood decay in live trees when tree health is compromised by biotic (pathogens, insects) and/or abiotic (drought, flooding, cold spells, mechanical damage, soil compaction, etc.) factors. Hypoxylon macrocarpum is a cosmopolitan sapwood rotter, commonly found in plants belonging to the Salicaceae family, as well as in other plant families usually adapted to riparian or mesic ecosystems. It is able to degrade both lignin and cellulose, further assisting in the breakdown of wood elements previously initiated by pathogens and wood primary decay agents. Sistotrema raduloides, instead, is possibly regarded as a hypersaprobe, given that it is unclear whether it possesses the enzymatic ability to degrade wood [75]. The black Herpotrichiellaceae are the dominant yeasts in decay class 5 samples. We note that Capronia pillosula, the dominant yeast species in class 5, is unable to degrade plant-derived polymers and chitin [76]; hence, similar to S. raduloides above, it can be defined as a hypersaprobe inhabiting wood previously degraded by primary saprobic organisms.

4.5. Fungal Communities Change Progressively as Wood Transitions from Healthy to Decayed, with Some Fungi Being Present in Different Wood Decay Stages

Although we have clearly shown here that (a) entire fungal communities are significantly different when comparing different decay stages and (b) dominant taxa are different in wood characterized by different decay stages, we should also note that decay represents a continuum, with progressive transitions from one stage to the next. Consequently, a further expectation was that some overlap in fungal species may be present when comparing P. tremuloides wood in the three distinct decay stages. The NMDS ordination performed on fungal community data from P. tremuloides samples assigned to three distinct decay stages (Figure 6) shows such overlap by placing wood samples at decay stage 3 as overlapping both samples belonging to decay class 1 and decay class 5. Additionally, it appears that the community in decay class 1 (undecayed wood) may be mostly included in the cluster of samples with intermediate decay class 3, while the fungal community identified in decay class 3 comprises a significant number of taxa that are well outside the cluster of samples from decay class 1. This result suggests that a large portion of fungi present in wood with incipient to intermediate decay were already present in healthy wood, further reinforcing the concept of a continuum in which endophytic fungi experience a series of lifestyle shifts (e.g., sometimes innocuous, sometimes beneficial, sometimes pathogenic, and sometimes saprobic) throughout their relationship with their hosts in response to changes in their environment.

4.6. Decay and Location on Stem Interact to Drive Composition of Fungal Communities in the Wood of Tree Stems

Even if this study is preliminary, we have shown here that investigating the composition of fungal communities in trees displaying cavities allows to differentiate between fungal communities present in decayed and healthy portions of the trunk. Moreover, the high explanatory power of our de novo PERMANOVA model (including tree species, tree ID, a group factor from our theoretical model of succession B, and placement of sample above or below the cavity) outperformed a model that used only tree species, tree ID, distance from cavity, and placement of sample above or below the cavity. However, when the three-class decay assessment was added to our complete de novo model, it did not increase the overall explanatory power of the model, indicating that our de novo model of decay community succession was able to either fully explain all the variation caused by differences in decay class or to explain the variation in the healthy upper and lower parts of the stem that had not yet experienced decay. In other words, the fungal community in the stem area around the cavity is better described when considering distance from the cavity, independent of whether the stem section analyzed is above or below the cavity itself. This suggests decay has a strong effect on the composition of fungal communities, an effect that is dominant on the effect of stem location (upper vs. lower stem) on fungal composition. However, as distance increases from the decay-generated cavity, the effect of decay on fungal community composition wanes and, instead, location on the stem, i.e., upper vs. lower stem, becomes the best predictor of fungal community composition. In summary, the overall tree stem fungal community was best described by looking at the upper stem in an area unaffected by decay, at the lower stem in an area unaffected by decay, and at various distances in the proximity of the cavity generated by decay.

5. Conclusions

Here, we have proposed that studying wood at various stages of decay in standing live trees with cavities using high throughput metabarcoding may represent a valuable addition to the study of decay in standing trees using culturing or traditional PCR and of decay in dead and downed logs or snags using SST approaches. We acknowledge that the various approaches are complementary and not fully interchangeable, given that the biological and physical processes causing wood decay are different in standing and downed trees. Nonetheless, given that we were able to differentiate fungal communities from: (a) wood of closely related tree species, (b) wood at different decay stages, and (c) wood in different portions of the stem, we believe the approach here described, including the use of a priori models of within-tree community composition, has the potential to facilitate our general understanding of the dynamics of fungal communities inhabiting healthy and decaying wood. Our approach is capable of describing hyper-rich communities, including thousands of taxa, and provides the significant benefits of a homogeneous genetic and spatial background while reducing the potential for an abundance of airborne and soilborne contaminants. The analyses here presented suggest that the use of more than one PCR primer set and a sampling scheme that includes both samples in the higher and lower parts of the healthy portion of a tree stem and samples at variable distances from decay pockets or cavities in the stem has the potential to best describe fungal communities in the caulosphere of trees.

Supplementary Materials

The following supporting information can be downloaded at: https://www.mdpi.com/article/10.3390/f14061070/s1, Table S1: All unique OTUs listed by phylum and order of abundance with confidence score assiged to each level of taxonomic assignment; cut-offs which optimize sensitivity and ensure <5% rate are as follows: P = 0.9989, C = 0.8500, O = 0.8500, F = 0.7500, G = 0.7500, S = 0.5000; Table S2: Dufrene-Legendre indicator species analysis for all OTUs based on Primer selection, tree genus, tree species, and sample decay level.

Author Contributions

Conceptualization, M.G. and M.G.J.; methodology, M.G. and M.G.J. formal analysis, M.G.J.; data curation, M.G.J.; writing—original draft preparation, M.G.J. and M.G.; supervision, M.G.; project administration, M.G.; funding acquisition, M.G. All authors have read and agreed to the published version of the manuscript.

Funding

This study was possible thanks to the U.C. Berkeley Foundation, Fund Number 8372000.

Data Availability Statement

Data are available in the Supplementary Materials.

Acknowledgments

This study would have not been possible without the involvement of Melissa Todd, Harry Kope, Rich Weir, Shannon Berch, Todd Manning, and Helen Davis, who were instrumental for the field portion of this study.

Conflicts of Interest

The authors declare no conflict of interest.

References

  1. Boddy, L.; Rayner, A.D.M. Origins of decay in living deciduous trees: The role of moisture content and a re-appraisal of the expanded concept of tree decay. New Phytol. 1983, 94, 623–641. [Google Scholar] [CrossRef]
  2. Rayner, A.D.M.; Boddy, L. Fungal Decomposition of Wood: Its Biology and Ecology; John Wiley Sons Ltd.: Hoboken, NJ, USA, 1988. [Google Scholar] [CrossRef]
  3. Watkinson, S.; Bebber, D.P.; Darrah, P.E.; Fricker, M.A.; Tlalka, M.; Boddy, L. The role of wood decay fungi in the carbon and nitrogen dynamics of the forest floor Related papers. In Fungi Biogeochem Cycles; Gadd, G.M., Ed.; Cambridge University Press: Cambridge, UK, 2006; Volume 24, p. 151. [Google Scholar]
  4. van der Wal, A.; Ottosson, E.; De Boer, W. Neglected role of fungal community composition in explaining variation in wood decay rates. Ecology 2015, 96, 124–133. [Google Scholar] [CrossRef]
  5. Hoppe, B.; Purahong, W.; Wubet, T.; Kahl, T.; Bauhus, J.; Arnstadt, T.; Hofrichter, M.; Buscot, F.; Krüger, D. Linking molecular deadwood-inhabiting fungal diversity and community dynamics to ecosystem functions and processes in Central European forests. Fungal Divers. 2016, 77, 367–379. [Google Scholar] [CrossRef]
  6. Parfitt, D.; Hunt, J.; Dockrell, D.; Rogers, H.J.; Boddy, L. Do all trees carry the seeds of their own destruction? PCR reveals numerous wood decay fungi latently present in sapwood of a wide range of angiosperm trees. Fungal Ecol. 2010, 3, 338–346. [Google Scholar] [CrossRef]
  7. Ulyshen, M.D. Wood decomposition as influenced by invertebrates. Biol. Rev. 2016, 91, 70–85. [Google Scholar] [CrossRef]
  8. Jusino, M.A.; Lindner, D.L.; Banik, M.T.; Walters, J.R.; Davey, M.L. Heart rot hotel: Fungal communities in red-cockaded woodpecker excavations. Fungal Ecol. 2015, 14, 33–43. [Google Scholar] [CrossRef]
  9. Elliott, T.F.; Jusino, M.A.; Trappe, J.M.; Lepp, H.; Ballard, G.A.; Bruhl, J.J.; Vernes, K. A global review of the ecological significance of symbiotic associations between birds and fungi. Fungal Divers. 2019, 98, 161–194. [Google Scholar] [CrossRef]
  10. Coates, D.; Rayner, A.D.M. Fungal population and community development in cut beech logs: I. Establishment via the aerial cut surface. New Phytol. 1985, 101, 153–171. [Google Scholar] [CrossRef]
  11. Coates, D.; Rayner, A.D.M. Fungal population and community development in cut beech logs: III. Spatial dynamics, interactions and strategies. New Phytol. 1985, 101, 183–198. [Google Scholar] [CrossRef]
  12. Chapela, I.H.; Boddy, L. Fungal Colonization of Attached Beech Branches II. Spatial and temporal organization of communities arising from latent invaders in bark and functional sapwood, under different moisture regimes. New Phytol. 1988, 110, 47–57. [Google Scholar] [CrossRef]
  13. Boddy, L.; Griffith, G.S. Role of endophytes and latent invasion in the development of decay communities in sapwood of angiospermous trees. Sydowia 1989, 41, 41–73. [Google Scholar]
  14. Griffith, G.S.; Boddy, L. Fungal decomposition of attached angiosperm twigs I. Decay community development in ash, beech and oak. New Phytol. 1990, 116, 407–415. [Google Scholar] [CrossRef] [PubMed]
  15. Guglielmo, F.; Gonthier, P.; Garbelotto, M.; Nicolotti, G. Optimization of sampling procedures for DNA-based diagnosis of wood decay fungi in standing trees. Lett. Appl. Microbiol. 2010, 51, 90–97. [Google Scholar] [CrossRef]
  16. Martin, R.; Gazis, R.; Skaltsas, D.; Chaverri, P.; Hibbett, D. Unexpected diversity of basidiomycetous endophytes in sapwood and leaves of Hevea. Mycologia 2017, 107, 284–297. [Google Scholar] [CrossRef] [PubMed]
  17. Gilmartin, E.C.; Jusino, M.A.; Pyne, E.J.; Banik, M.T.; Lindner, D.L.; Boddy, L. Fungal endophytes and origins of decay in beech (Fagus sylvatica) sapwood. Fungal Ecol. 2022, 59, 101–161. [Google Scholar] [CrossRef]
  18. Boddy, L.; Watkinson, S.C. Wood decomposition, higher fungi, and their role in nutrient redistribution. Can. J. Bot. 1994, 73, 1377–1383. [Google Scholar] [CrossRef]
  19. Kebli, H.; Drouin, P.; Brais, S.; Kernaghan, G. Species composition of saproxylic fungal communities on decaying logs in the boreal forest. Microb. Ecol. 2011, 61, 898–910. [Google Scholar] [CrossRef]
  20. Fischer, A.L.; Moncalvo, J.M.; Klironomos, J.N.; Malcolm, J.R. Fruiting Body and Molecular rDNA Sampling of fungi in Woody Debris from Logged and Unlogged Boreal Forests in Northeastern Ontario. Ecoscience 2012, 19, 374–390. [Google Scholar] [CrossRef]
  21. Kubartová, A.; Ottosson, E.; Dahlberg, A.; Stenlid, J. Patterns of fungal communities among and within decaying logs, revealed by 454 sequencing. Mol. Ecol. 2012, 21, 4514–4532. [Google Scholar] [CrossRef]
  22. Fukasawa, Y.; Osono, T.; Takeda, H. Dynamics of physicochemical properties and occurrence of fungal fruit bodies during decomposition of coarse woody debris of Fagus crenata. J. For. Res. 2008, 14, 20–29. [Google Scholar] [CrossRef]
  23. Fukasawa, Y.; Osono, T.; Takeda, H. Fungal decomposition of woody debris of Castanopsis sieboldii in a subtropical old-growth forest. Ecol. Res. 2011, 27, 211–218. [Google Scholar] [CrossRef]
  24. Heilmann-Clausen, J.; Christensen, M. Does size matter? On the importance of various dead wood fractions for fungal diversity in Danish beech forests. For. Ecol. Manag. 2004, 201, 105–117. [Google Scholar] [CrossRef]
  25. Olsson, J.; Jonsson, B.G.; Hjältén, J.; Ericson, L. Addition of coarse woody debris—The early fungal succession on Picea abies logs in managed forests and reserves. Biol. Conserv. 2011, 144, 1100–1110. [Google Scholar] [CrossRef]
  26. Lim, Y.W.; Kim, J.J.; Chedgy, R.; Morris, P.I.; Breuil, C. Fungal diversity from western redcedar fences and their resistance to beta-thujaplicin. Antonie Van Leeuwenhoek 2005, 87, 109–117. [Google Scholar] [CrossRef]
  27. Kurth, V.J.; Fransioli, N.; Fulé, P.Z.; Hart, S.C.; Gehring, C.A. Stand-replacing wildfires alter the community structure of wood-inhabiting fungi in southwestern ponderosa pine forests of the USA. Fungal Ecol. 2013, 6, 192–204. [Google Scholar] [CrossRef]
  28. Hiscox, J.; Savoury, M.; Vaughan, I.P.; Müller, C.T.; Boddy, L. Antagonistic fungal interactions influence carbon dioxide evolution from decomposing wood. Fungal Ecol. 2015, 14, 24–32. [Google Scholar] [CrossRef]
  29. Ding, S.; Hu, H.; Gu, J.D. Diversity, abundance, and distribution of wood-decay fungi in major Parks of Hong Kong. Forests 2020, 1, 1030. [Google Scholar] [CrossRef]
  30. Bari, E.; Karimi, K.; Aghajani, H.; Schmidt, O.; Zahari, S.; Tajick-Ghanbary, M.A.; Juybari, H.Z. Characterizations of tree-decay fungi by molecular and morphological investigations in the Iranian Alamerdadeh forest. Maderas Cienc. Tecnol. 2021, 23, 1–24. [Google Scholar] [CrossRef]
  31. Ovaskainen, O.; Schigel, D.; Ali-Kovero, H.; Auvinen, P.; Paulin, L.; Nordén, B.; Nordén, J. Combining high-throughput sequencing with fruit body surveys reveals contrasting life-history strategies in fungi. ISME J. 2013, 7, 1696–1709. [Google Scholar] [CrossRef]
  32. Boddy, L.; Büntgen, U.; Egli, S.; Gange, A.C.; Heegaard, E.; Kirk, P.M.; Mohammad, A.; Kauserud, H. Climate variation effects on fungal fruiting. Fungal Ecol. 2014, 10, 20–33. [Google Scholar] [CrossRef]
  33. Wu, B.; Hussain, M.; Zhang, W.; Stadler, M.; Liu, X.; Xiang, M. Current insights into fungal species diversity and perspective on naming the environmental DNA sequences of fungi. Mycology 2019, 10, 127–140. [Google Scholar] [CrossRef]
  34. Peay, K.G.; Kennedy, P.G.; Talbot, J.M. Dimensions of biodiversity in the Earth mycobiome. Nat. Rev. Microbiol. 2016, 14, 434–447. [Google Scholar] [CrossRef]
  35. Rajala, T.; Peltoniemi, M.; Pennanen, T.; Mäkipää, R. Fungal community dynamics in relation to substrate quality of decaying Norway spruce (Picea abies [L.] Karst.) logs in boreal forests. FEMS Microbiol. Ecol. 2012, 81, 494–505. [Google Scholar] [CrossRef]
  36. Vaz, A.B.; Fonseca, P.L.; Leite, L.R.; Badotti, F.; Salim, A.C.; Araujo, F.M.; Cuadros-Orellana, S.; Duarte, A.A.; Rosa, C.A.; Oliveira, G.; et al. Using next-generation sequencing (NGS) to uncover diversity of wood-decaying fungi in neotropical Atlantic forests. Phytotaxa 2017, 295, 1–21. [Google Scholar] [CrossRef]
  37. Heilmann-Clausen, J. A gradient analysis of communities of macrofungi and slime moulds on decaying beech logs. Mycol. Res. 2001, 105, 575–596. [Google Scholar] [CrossRef]
  38. Fukasawa, Y.; Osono, T.; Takeda, H. Microfungus communities of Japanese beech logs at different stages of decay in a cool temperate deciduous forest. Can. J. For. Res. 2009, 39, 1606–1614. [Google Scholar] [CrossRef]
  39. Runnel, K.; Drenkhan, R.; Adamson, K.; Lõhmus, P.; Rosenvald, K.; Rosenvald, R.; Rähn, E.; Tedersoo, L. The factors and scales shaping fungal assemblages in fallen spruce trunks: A DNA metabarcoding study. For. Ecol. Manag. 2021, 495, 119381. [Google Scholar] [CrossRef]
  40. Gilmartin, E.C. Fungal Communities of Beech (Fagus sylvatica) Trees: Heart Rot and Origins of Decay. Ph.D. Thesis, Cardiff University, Wales, UK, 2020. [Google Scholar]
  41. Tedersoo, L.; Bahram, M.; Zinger, L.; Nilsson, R.H.; Kennedy, P.G.; Yang, T.; Anslan, S.; Mikryukov, V. Best practices in metabarcoding of fungi: From experimental design to results. Mol. Ecol. 2022, 31, 2769–2795. [Google Scholar] [CrossRef]
  42. Weslien, J.; Djupström, L.B.; Schroeder, M.; Widenfalk, O. Long-term priority effects among insects and fungi colonizing decaying wood. J. Anim. Ecol. 2011, 80, 1155–1162. [Google Scholar] [CrossRef]
  43. Janisch, J.E.; Harmon, M.E.; Chen, H.; Fasth, B.; Sexton, J. Decomposition of coarse woody debris originating by clearcutting of an old-growth conifer forest. Ecoscience 2005, 12, 151–160. [Google Scholar] [CrossRef]
  44. Boddy, L. Fungal community ecology and wood decomposition processes in angiosperms: From standing tree to complete decay of coarse woody debris. Ecol. Bull. 2001, 49, 43–56. [Google Scholar]
  45. Oses, R.; Valenzuela, S.; Freer, J.; Baeza, J.; Rodríguez, J. Evaluation of fungal endophytes for lignocellulolytic enzyme production and wood biodegradation. Int. Biodeterior. Biodegrad. 2006, 57, 129–135. [Google Scholar] [CrossRef]
  46. Cline, L.C.; Schilling, J.S.; Menke, J.; Groenhof, E.; Kennedy, P.G.; Schilling, S. Ecological and functional effects of fungal endophytes on wood decomposition. Funct. Ecol. 2018, 32, 181–191. [Google Scholar] [CrossRef]
  47. Maser, C.; Cline, S.P.; Cromack, K.; Trappe, J.M.; Hansen, E. Chapter 2. What we know about large trees that fall to the forest floor. In From the Forest to the Sea: A Story of Fallen Trees; USDA Forest Survey General Technical Report, PNWGTR-22; U.S. Department of Agriculture, Forest Service, Pacific Northwest Research Station: Portland, OR, USA, 1979; p. 153. [Google Scholar]
  48. Boddy, L.; Hiscox, J.; Gilmartin, E.C.; Johnston, S.R.; Heilmann-Clausen, J. Wood decay communities in angiosperm wood. In The Fungal Community: Its Organization and Role in the Ecosystem, 4th ed.; CRC Press: Boca Raton, FL, USA, 2017; pp. 169–190. [Google Scholar]
  49. Weir, R.D.; Phinney, M.; Lofroth, E.C. Big, sick, and rotting: Why tree size, damage, and decay are important to fisher reproductive habitat. For. Ecol. Manag. 2012, 265, 230–240. [Google Scholar] [CrossRef]
  50. Gardes, M.; Bruns, T.D. ITS primers with enhanced specificity for basidiomycetes—Application to the identification of mycorrhizae and rusts. Mol. Ecol. 1993, 2, 113–118. [Google Scholar] [CrossRef] [PubMed]
  51. Taylor, D.L.; Walters, W.A.; Lennon, N.J.; Bochicchio, J.; Krohn, A.; Caporaso, J.G.; Pennanen, T. Accurate estimation of fungal diversity and abundance through improved lineage-specific primers optimized for Illumina amplicon sequencing. Appl. Environ. Microb. 2016, 82, 7217–7226. [Google Scholar] [CrossRef] [PubMed]
  52. Wu, L.; Wen, C.; Qin, Y.; Yin, H.; Tu, Q.; Van Nostrand, J.D.; Yuan, T.; Yuan, M.; Deng, Y.; Zhou, J. Phasing amplicon sequencing on Illumina Miseq for robust environmental microbial community analysis. BMC Microbiol. 2015, 15, 125. [Google Scholar] [CrossRef]
  53. Edgar, R.C. Search and clustering orders of magnitude faster than BLAST. Bioinformatics 2010, 26, 2460–2461. [Google Scholar] [CrossRef]
  54. Edgar, R.C.; Flyvbjerg, H. Error filtering, pair assembly and error correction for next-generation sequencing reads. Bioinformatics 2015, 31, 3476–3482. [Google Scholar] [CrossRef]
  55. Edgar, R.C. UNOISE2: Improved error-correction for Illumina 16S and ITS amplicon sequencing. BioRxiv 2016, 081257:1–081257:21. [Google Scholar] [CrossRef]
  56. Edgar, R.C. SINTAX: A simple non-Bayesian taxonomy classifier for 16S and ITS sequences. BioRxiv 2016, 074161:1–074161:20. [Google Scholar] [CrossRef]
  57. Kindt, R.; Coe, R. Tree Diversity Analysis. A Manual and Software for Common Statistical Methods for Ecological and Biodiversity Studies; World Agroforestry Centre (ICRAF): Nairobi, Kenya, 2005; ISBN 92-9059-179-X. Available online: https://www.worldagroforestry.org/output/tree-diversity-analysis (accessed on 12 April 2023).
  58. Dufrêne, M.; Legendre, P. Species assemblages and Indicator Species:the need for a flexible asymmetrical approach. Ecol. Monogr. 1997, 67, 345–366. [Google Scholar] [CrossRef]
  59. Trochine, A.; Turchetti, B.; Vaz, A.B.M.; Brandao, L.; Rosa, L.H.; Buzzini, P.; Rosa, C.; Libkind, D. Description of Dioszegia patagonica sp. nov., a novel carotenogenic yeast isolated from cold environments. Int. J. Syst. Evol. Microbiol. 2007, 67, 4332–4339. [Google Scholar] [CrossRef] [PubMed]
  60. Amend, A. From dandruff to deep-sea vents: Malassezia-like fungi are ecologically hyper-diverse. PLoS Pathog. 2014, 10, e1004277. [Google Scholar] [CrossRef] [PubMed]
  61. Glassman, S.I.; Martiny, J.B. Broadscale ecological patterns are robust to use of exact sequence variants versus operational taxonomic units. MSphere 2018, 3, e00148-18. [Google Scholar] [CrossRef]
  62. Taylor, J.W.; Jacobson, D.J.; Kroken, S.; Kasuga, T.; Geiser, D.M.; Hibbett, D.S.; Fisher, M.C. Phylogenetic species recognition and species concepts in fungi. Fungal Genet. Biol. 2000, 31, 21–32. [Google Scholar] [CrossRef] [PubMed]
  63. Nilsson, R.H.; Kristiansson, E.; Ryberg, M.; Hallenberg, N.; Larsson, K.-H. Intraspecific ITS variability in the Kingdom Fungi as expressed in the International Sequence Databases and its implications for molecular species identification. Evol. Bioinform. 2008, 4, ebo.s653:1–ebo.s653:5. [Google Scholar] [CrossRef] [PubMed]
  64. Estensmo, E.L.F.; Maurice, S.; Morgado, L.; Martin-Sanchez, P.M.; Skrede, I.; Kauserud, H. The influence of intraspecific sequence variation during DNA metabarcoding: A case study of eleven fungal species. Mol. Ecol. Resour. 2021, 21, 1141–1148. [Google Scholar] [CrossRef]
  65. Osmundson, T.W.; Robert, V.A.; Schoch, C.L.; Baker, L.J.; Smith, A.; Robich, G.; Mizzan, L.; Garbelotto, M.M. Filling gaps in biodiversity knowledge for macrofungi: Contributions and assessment of an herbarium collection DNA barcode sequencing project. PLoS ONE 2013, 8, e62419. [Google Scholar] [CrossRef]
  66. Callahan, B.J.; McMurdie, P.J.; Holmes, S.P. Exact sequence variants should replace operational taxonomic units in marker-gene data analysis. ISME J. 2017, 11, 2639–2643. [Google Scholar] [CrossRef]
  67. Walters, W.; Hyde, E.R.; Berg-Lyons, D.; Ackermann, G.; Humphrey, G.; Parada, A.; Gilbert, J.A.; Jansson, J.K.; Caporaso, J.G.; Fuhrman, J.A.; et al. Improved bacterial 16S rRNA gene (V4 and V4-5) and fungal internal transcribed spacer marker gene primers for microbial community surveys. mSystems 2016, 1, e00009-15. [Google Scholar] [CrossRef] [PubMed]
  68. Tedersoo, L.; Anslan, S.; Bahram, M.; Põlme, S.; Riit, T.; Liiv, I.; Kõljalg, U.; Kisand, V.; Nilsson, R.H.; Hildebrand, F.; et al. Shotgun metagenomes and multiple primer pair-barcode combinations reveal biases in metabarcoding analyses of fungi. MycoKeys 2015, 10, 1–43. [Google Scholar] [CrossRef]
  69. Schoch, C.L.; Seifert, K.A.; Huhndorf, S.; Robert, V.; Spouge, J.L.; Levesque, C.A.; Chen, W.; Fungal Barcoding Consortium. Nuclear ribosomal internal transcribed spacer (ITS) region as a universal DNA barcode marker for Fungi. Proc. Natl. Acad. Sci. USA 2012, 109, 6241–6246. [Google Scholar] [CrossRef] [PubMed]
  70. Schmidt, P.A.; Bálint, M.; Greshake, B.; Bandow, C.; Römbke, J.; Schmitt, I. Illumina metabarcoding of a soil fungal community. Soil Biol. Biochem. 2013, 65, 128–132. [Google Scholar] [CrossRef]
  71. Zhou, D.; Hyde, K.D. Host-specificity, host-exclusivity, and host-recurrence in saprobic fungi. Mycol. Res. 2001, 105, 1449–1457. [Google Scholar] [CrossRef]
  72. Johnston, P.R.; Park, D.; Manning, M.A. Neobulgaria alba sp. nov. and its Phialophora-like anamorph in native forests and kiwifruit orchards in New Zealand. Mycotaxon 2010, 113, 385–396. [Google Scholar] [CrossRef]
  73. Vazquez, F.; Heluane, H.; Spencer, J.F.T.; Spencer, D.M.; De Figueroa, L.I.C. Fusion between protoplasts of Pichia stipitis and isolated filamentous fungi nuclei. Enzym. Microb. Technol. 1997, 21, 32–38. [Google Scholar] [CrossRef]
  74. Cadete, R.M.; Lopes, M.R.; Rosa, C.A. Yeasts associated with decomposing plant material and rotting wood. In Yeasts in Natural Ecosystems: Diversity; Buzzini, P., Lachance, M.A., Yurkov, A., Eds.; Springer: Cham, Switzerland, 2017; pp. 265–292. [Google Scholar] [CrossRef]
  75. Nagy, L.G.; Riley, R.; Tritt, A.; Adam, C.; Daum, C.; Floudas, D.; Sun, H.; Yadav, J.S.; Pangilinan, J.; Larsson, K.-H.; et al. Comparative genomics of early-diverging mushroom-forming fungi provides insights into the origins of lignocellulose decay capabilities. Mol. Biol. Evol. 2016, 33, 959–970. [Google Scholar] [CrossRef]
  76. Untereiner, W.A.; Malloch, D. Patterns of substrate utilization in species of Capronia and allied black yeasts: Ecological and taxonomic implications. Mycologia 1999, 91, 417–427. [Google Scholar] [CrossRef]
Figure 1. Locations of cavity-harboring Populus trees selected for sampling and Cupressus trees selected as outgroups.
Forests 14 01070 g001
Figure 2. Putative de novo models were created to consider three starting points of wood-inhabiting fungal communities within tree stems prior and during cavity formation: (A) that tree stem fungal community is uniform throughout the tree prior to cavity formation; (B) that prior to cavity formation, tree stem fungal community in the lower section of the stem differs from the one in the upper section, but is homogeneous within each section; (C) that tree stem fungal community is highly heterogeneous, with different communities, each inhabiting a different section of the tree. Different colors indicate theoretical different fungal communities and labels of individual samples are not supposed to be readable.
Forests 14 01070 g002
Figure 3. Modified three class system for describing decay in aspen and poplar wood samples, based on Maser et al. [47].
Forests 14 01070 g003
Figure 4. Species or OTU accumulation curves for primer sets (panel (A)), species (panel (B)), and individual tree (panel (C)) in Cupressus (cedar) and Populus in British Columbia, Canada. Note that in panel (A), not only do we show accumulation curves for the data subset that was identified at the species level, but we can also draw confidence intervals, given that the two curves are clearly distinct. For all other curves in panels (B,C), curves are overlapping and so are their confidence intervals.
Forests 14 01070 g004
Figure 5. NMDS ordinations of fungal communities based on primer selection (panel (A)), tree genus (panel (B)), tree species (panel (C)), and individual tree (panel (D)); (POBA = Populus balsamifera, POTR = Populus tremuloides). PERMANOVA R2 (p values) for the analyses displayed in panels (AD) were as follows: primer pair, R2 = 0.08 (p < 0.001); tree genus, R2 = 0.019 (p < 0.0010); tree species, R2 = 0.057 (p < 0.001); individual tree, R2 = 0.09 (p < 0.001). When clusters do not overlap significantly, then fungal communities identified by different primers or present in different tree genera, tree species and in individual trees are distinctively different.
Forests 14 01070 g005
Figure 6. NMDS ordinations of fungal community by decay class. The data are presented first by tree species (panels (A,B)) and then with data from both tree species combined (panel (C)).
Forests 14 01070 g006
Table 1. Distribution of distinct OTUs by phylum (unknown taxa in parenthesis) of caulosphere fungi found in the seven sampled trees from the genera Cupressus and Populus. The upper portion of the table was generated using all OTUs produced by the dataset, while the lower portion was generated using only OTUs confidently (p < 0.05) identified to the species level.
Total OTUs (n = 3467)
OTUsFamilyGenusSpecies
Ascomycota2093121 (684)297 (929)222 (1654)
Basidiomycota92974 (186)159 (308)160 (593)
Chytridiomycota462 (34)3 (36)1 (45)
Glomeromycota183 (5)3 (13)2 (15)
Neocallimastigomycota21 (0)2 (0)0 (2)
Rozellomycota50 (5)0 (5)0 (5)
Mucoromycota/Zoopagomycota795 (4)8 (22)14 (51)
UNKN295NANANA
Total3467206 (918)472 (1313)397 (2365)
Only OTUs at species level (n = 397)
OTUsFamilyGenus
Ascomycota185396998
Basidiomycota196387194
Mucoromycota/Zoopagomycota16459
Total39781145201
Table 2. Number of unknown OTUs (no taxa suggested) of unconfident taxonomic assignments (error rate >5%) and of confident taxonomic assignments (error rate <5%) for the 3467 distinct OTUs sequenced in this study.
Unknown TaxaUnconfident TaxaConfident Taxa
Phylum2953382834
Class5257802162
Order75111601556
Family12139301324
Genus15958671005
Species2660410397
Table 3. The top 20 families for number of OTUs from the Ascomycota (left portion of table) and the Basidiomycota (right portion of table).
PhylumFamily# of OTUsPhylumFamily# of OTUs
AscomycotaHerpotrichiellaceae96BasidiomycotaTremellales fam Incertae sedis44
Trichocomaceae71Malasseziaceae35
Saccharomycetales fam Incertae sedis23Meruliaceae27
Helotiales fam Incertae sedis22Polyporaceae24
Hypocreales fam Incertae sedis21Sporidiobolales fam Incertae sedis22
Microascaceae18Schizoporaceae21
Xylariaceae17Hymenochaetaceae20
Hypocreaceae16Strophariaceae20
Pleosporaceae14Psathyrellaceae19
Amphisphaeriaceae13Phanerochaetaceae15
Dothioraceae13Hydnodontaceae14
Orbiliaceae13Fomitopsidaceae13
Erysiphaceae12Marasmiaceae13
Helotiaceae12Peniophoraceae11
Pezizomycotina fam Incertae sedis12Botryobasidiaceae10
Mycosphaerellaceae11Ceratobasidiaceae10
Phaeosphaeriaceae11Cystofilobasidiaceae9
Diatrypaceae10Hydnaceae9
Parmeliaceae10Tricholomataceae9
Pleosporales fam Incertae sedis10Pluteaceae8
Total425Total353
Table 4. The twenty most frequent Ascomycete and Basidiomycete OTUs (by read count); repeated species represent distinct OTUs (at least one base pair difference).
ReadsPhylumClassOrderFamilyGenusSpecies
478,059AscomycotaSordariomycetesXylarialesXylariaceaeHypoxylonmacrocarpum
403,522AscomycotaSordariomycetesXylarialesXylariaceaeHypoxylonmacrocarpum
164,872AscomycotaSordariomycetesXylarialesXylariaceaeXylariaUNKN
156,995AscomycotaSordariomycetesXylarialesUNKNUNKNUNKN
156,069AscomycotaSaccharomycetesSaccharomycetalesSaccharomycetales fam Incertae sedisCandidaUNKN
141,112AscomycotaSaccharomycetesSaccharomycetalesSaccharomycetales fam Incertae sedisCandidaUNKN
115,889AscomycotaEurotiomycetesChaetothyrialesHerpotrichiellaceaeCaproniapilosella
96,463AscomycotaLeotiomycetesHelotialesHelotiaceaeNeobulgariaUNKN
96,356AscomycotaLeotiomycetesHelotialesHelotiaceaeNeobulgariaUNKN
94,026AscomycotaEurotiomycetesChaetothyrialesHerpotrichiellaceaeCaproniapilosella
87,025AscomycotaSordariomycetesXylarialesDiatrypaceaeUNKNUNKN
83,331AscomycotaSordariomycetesXylarialesDiatrypaceaeUNKNUNKN
76,299AscomycotaUNKNUNKNUNKNUNKNUNKN
68,459AscomycotaUNKNUNKNUNKNUNKNUNKN
67,929AscomycotaSaccharomycetesSaccharomycetalesUNKNUNKNUNKN
67,722AscomycotaSaccharomycetesSaccharomycetalesSaccharomycetales fam Incertae sedisCyberlindnerasargentensis
66,523AscomycotaSaccharomycetesSaccharomycetalesPichiaceaePichianorvegensis
61,158AscomycotaEurotiomycetesChaetothyrialesHerpotrichiellaceaeRhinocladiellaUNKN
60,451AscomycotaSaccharomycetesSaccharomycetalesSaccharomycetacea eWilliopsisUNKN
58,157AscomycotaSordariomycetesXylarialesDiatrypaceaeUNKNUNKN
306,359BasidiomycotaAgaricomycetesHymenochaetalesHymenochaetaceaePhellinusUNKN
288,893BasidiomycotaAgaricomycetesAgaricalesPleurotaceaePleurotusdryinus
270,948BasidiomycotaAgaricomycetesHymenochaetalesHymenochaetaceaePhellinusUNKN
146,897BasidiomycotaAgaricomycetesCantharellalesHydnaceaeSistotremaraduloides
124,892BasidiomycotaAgaricomycetesUNKNUNKNUNKNUNKN
105,172BasidiomycotaAgaricomycetesUNKNUNKNUNKNUNKN
91,483BasidiomycotaAgaricomycetesCantharellalesHydnaceaeSistotremaraduloides
90,592BasidiomycotaAgaricomycetesHymenochaetalesHymenochaetaceaePhellinusUNKN
87,551BasidiomycotaAgaricomycetesHymenochaetalesHymenochaetaceaePhellinusUNKN
85,156BasidiomycotaMicrobotryomycetesSporidiobolalesSporidiobolales fam
Incertae sedis
RhodotorulaUNKN
82,402BasidiomycotaMicrobotryomycetesSporidiobolalesSporidiobolales fam
Incertae sedis
RhodotorulaUNKN
71,796BasidiomycotaAgaricomycetesCantharellalesHydnaceaeSistotremaraduloides
63,190BasidiomycotaAgaricomycetesCantharellalesHydnaceaeSistotremaraduloides
53,508BasidiomycotaAgaricomycetesRussulalesAuriscalpiaceaeLentinellusUNKN
47,017BasidiomycotaAgaricomycetesCantharellalesHydnaceaeSistotremaraduloides
46,379BasidiomycotaAgaricomycetesRussulalesAuriscalpiaceaeLentinellusUNKN
37,400BasidiomycotaUstilaginomycotina cls Incertae sedisMalassezialesMalasseziaceaeMalasseziarestricta
35,845BasidiomycotaUstilaginomycotina cls Incertae sedisMalassezialesMalasseziaceaeMalasseziarestricta
34,408BasidiomycotaAgaricomycetesSebacinalesSebacinales Group BUNKNUNKN
31,389BasidiomycotaTremellomycetesTremellalesTremellales fam
Incertae sedis
Derxomycesqinlingensis
Table 5. PERMANOVA of independent and interaction effects on caulosphere fungal species community for cavity trees in British Columbia, Canada.
DFSum Of SqsMean SqsF. ModelR2p-Value
Tree Sp.12.1202.1206.34200.057320.000999
Tree ID33.4691.1563.45930.093800.000999
Primer13.0153.0159.01950.081520.000999
Tree Sp. * Primer11.6791.6795.02280.045400.000999
Tree ID * Primer32.9690.9992.96080.080280.000999
Residuals7123.7340.334 0.64169
Total8941.599 1
Table 6. Comparison of models of community response using additive and interaction effects of (a) tree species (Species); tree ID (Tree); distance of sample from cavity (Distance); and location of sample in relation to cavity (above vs. below or Ab vs. Be), or (b) tree species (Species), tree ID (Tree), best de novo model of decay spread (Model B), and location of sample in relation to cavity (above vs. below or Ab vs. Be).
(a) Y = Species * Tree * Distance * Ab vs. Be
Degrees of FreedomSum of SqrsMean SquaresF StatisticR2p-Value
Species11.95841.958458.29160.112080.000999
Tree33.23071.076894.55930.184880.000999
Distance10.39760.397641.68350.022760.018981
Ab-Be21.09260.546292.31290.062520.000999
Species: Distance10.44250.442511.87350.025320.008991
Tree: Distance31.16040.386811.63770.066410.000999
Species: Ab vs. Be20.95690.478452.02570.054760.000999
Tree: Ab vs.Be52.27860.455721.92940.13040.000999
Distance:
Ab vs. Be
10.40970.409721.73470.023450.015984
Species: Distance:Ab vs. Be10.36750.367551.55610.021030.040959
Tree: Distance:
Ab vs. Be
30.92780.309261.30940.053090.034965
Residuals184.25150.2362 0.2433
Total4117.47441
(b) Y = Species * Tree * Model B * Ab vs. Be
Degrees of FreedomSum of SqrsMean SquaresF StatisticR2p-Value
Species11.95841.958457.92510.112080.000999
Tree33.23071.076894.35780.184880.000999
Model B41.58110.395271.59950.090480.005994
Ab vs. Be10.53630.536322.17030.030690.001998
Species: Model B41.52620.381551.5440.087340.008991
Tree: Model B113.69970.336341.3610.211720.010989
Species: Ab vs. Be10.46580.465771.88480.026650.006993
Tree: Ab vs. Be31.24170.41391.67490.071060.001998
Residuals81.9770.24712 0.18509
Total4117.47441
Table 7. Total number of indicator taxa by phyla for each primer set.
ITS1&2
(358 OTUs)
ITS4&5.8
(381 OTUs)
Ascomycota237Ascomycota278
Basidiomycota81Basidiomycota81
Chytridiomycota2UNKN14
Glomeromycota1Mucoromycota/Zoopagomycota8
UNKN32
Mucoromycota/Zoopagomycota5
Table 8. Pairwise comparisons of fungal community by decay class for Aspen, Poplar, and both species combined.
Aspen
Decay Class PairF. ModelR2p-ValueAdjusted p-Value
3 vs. 52.2228360.11563520.0050.01
3 vs. 12.1009340.13912610.0090.01
5 vs. 12.0642380.1711390.0030.009
Poplar
Decay Class PairF. ModelR2p-ValueAdjusted p-Value
3 vs. 11.9305360.14930050.0320.032
Aspen and Poplar Combined
Decay Class PairF. ModelR2p-ValueAdjusted p-Value
3 vs. 52.3555850.083070.0020.004
3 vs. 11.8037150.064870.20.02
5 vs. 12.593980.156320.0010.003
Table 9. Models of community response using additive and interaction effects of tree ID (Tree), and wood decay class (Decay Class). Models are presented for each Populus species independently (top two panels) and for the two Populus species combined (bottom panel).
Aspen
Y = Tree * Decay Class
Degrees of FreedomSum of SquaresMean SquaresF StatisticR2p-Value
Tree22.01531.007653.28340.21530.001
Decay Class21.48090.740452.41280.15820.001
Tree:Decay Class20.95350.476771.55350.10190.01798
Residuals164.91020.30689 0.5246
Total229.36 1
Poplar
Y = Tree * Decay Class
Degrees of FreedomSum of SquaresMean SquaresF StatisticR2p-Value
Tree10.89830.898293.5010.22390.001
Decay Class10.54850.548482.13770.13670.01898
Residuals102.56580.25658 0.6394
Total124.0126 1
Aspen and Poplar Combined
Y = Tree * Decay Class
Degrees of FreedomSum of SquaresMean SquaresF StatisticR2p-Value
Species11.57661.576565.48290.10550.001
Tree32.91360.971193.37760.19490.001
Decay Class21.50030.750172.60890.10040.001
Species: Decay Class10.5290.529031.83990.03540.01299
Tree: Decay Class20.95350.476771.65810.06380.005
Residuals267.4760.28754 0.5001
Total3514.9491 1
Table 10. Top ten OTUs (by number of reads) in each of three decay classes in Aspen trees.
Aspen Decay Class 1 (n = 2)
ReadsDomainPhylumClassOrderFamilyGenusSpecies
14,523FungiAscomycotaUNKNUNKNUNKNUNKNUNKN
13,894FungiAscomycotaUNKNUNKNUNKNUNKNUNKN
12,090FungiBasidiomycotaUstilaginomycotina cls Incertae sedisMalassezialesMalaseziaceaeMalasseziarestricta
10,967FungiBasidiomycotaUstilaginomycotina cls Incertae sedisMalassezialesMalaseziaceaeMalasseziarestricta
6623FungiAscomycotaLeotiomycetesHelotialesUNKNUNKNUNKN
5302FungiAscomycotaLeotiomycetesHelotialesUNKNUNKNUNKN
4720FungiBasidiomycotaAgaricomycetesUNKNUNKNUNKNUNKN
3972FungiBasidiomycotaAgaricomycetesUNKNUNKNUNKNUNKN
3814FungiAscomycotaSaccharomycetesSaccharomycetalesUNKNUNKNUNKN
3531FungiAscomycotaSaccharomycetesSaccharomycetalesSaccharomycetales_fam Incertae sedisCyberlindnerasargentesis
Pleurotus_dryinus is three reads short of tied for 10th
Aspen
Class 3 (n = 14)
ReadsDomainPhylumClassOrderFamilyGenusSpecies
305,240FungiBasid io mycotaAgaricom ycetesHymenochaetalesHymenochaetaceaePhellinusUNKN
269,980FungiBasidiomycotaAgaricomycetesHymenochaetalesHymenochaetaceaePhellinusUNKN
102,147FungiAscomycotaSaccharomycetesSaccharomycetalesSaccharomycetales_fam Incertae sedisCandidaUNKN
91,852FungiAscomycotaSaccharomycetesSaccharomycetalesSaccharomycetales_fam Incertae sedisCandidaUNKN
86,392FungiBasidiomycotaAgarico-mycesHymenochaetalesHymenochaetaceaePhellinusUNKN
83,504FungiBasidiomycotaAgaricomycetesHym enochaetalesHymenochaetaceaePhellinusUNKN
62,174FungiAscomycotaSaccharomycetesSaccharomycetalesPichiaceaePichianorvegen-sis
54,224FungiAscomycotaSaccharomycetesSaccharomycetalesUNKNUNKNUNKN
40,411FungiAscomycotaLeotiomycetesHelotialesHelotiaceaeNeobulgariaUNKN
39,793FungiAscomycotaLeotiomycetesHelotialesHelotiaceaeNeobulgariaUNKN
Aspen Decay Class 5 (n = 7)
ReadsDomainPhylumClassOrderFamilyGenusSpecies
478,031FungiAscomycotaSordariomycetesXylarialesXylariaceaeHypoxylonmacrocarpum
403,497FungiAscomycotaSordariomycetesXylarialesXylariaceaeHypoxylonmacrocarpum
164,510FungiAscomycotaSord ar iomycetesXylarialesXylariaceaeXylariaUNKN
156,660FungiAscomycotaSordariomycetesXylarialesUNKNUNKNUNKN
135,434FungiBasidiomycotaAgaricomycetesCantharellalesHydnaceaeSistotremaraduloides
115,881FungiAscomycotaEurotiomycetesChaetothyrialesHerpotrichiellaceaeCaproniapilosella
94,020FungiAscomycotaEurotiomycetesChaetothyrialesHerpotrichiellaceaeCaproniapilosella
82,341FungiBasidiomycotaAgaricomycetesCantharellalesHydnaceaeSistotremaraduloides
62,060FungiBasidiomycotaAgaricomycetesCantharellalesHydnaceaeSistotremaraduloides
54,882FungiBasidiomycotaAgaricomycetesCantharellalesHydnaceaeSistotremaraduloides
Disclaimer/Publisher’s Note: The statements, opinions and data contained in all publications are solely those of the individual author(s) and contributor(s) and not of MDPI and/or the editor(s). MDPI and/or the editor(s) disclaim responsibility for any injury to people or property resulting from any ideas, methods, instructions or products referred to in the content.

