Article

Examining the Stand Level CO2 Fluxes of Spring Forest Geophytes

1
Institute of Plant Sciences and Environmental Protection, University of Szeged, H-6800 Hódmezővásárhely, Hungary
2
Department of Nature Conservation and Landscape Management, Hungarian University of Agriculture and Life Sciences, Páter Károly Street 1, H-2100 Gödöllő, Hungary
3
Department of Agrochemistry, Soil Science, Microbiology and Plant Nutrition, Faculty of AgriSciences, Mendel University in Brno, Zemědělská 1665/1, 613 00 Brno, Czech Republic
4
Doctoral School of Environmental Sciences, Hungarian University of Agriculture and Life Sciences, H-2100 Gödöllő, Hungary
5
Institute of Animal Sciences and Wildlife Management, Faculty of Agriculture, University of Szeged, Andrássy Street 15, H-6800 Hódmezővásárhely, Hungary
*
Author to whom correspondence should be addressed.
Forests 2023, 14(5), 860; https://doi.org/10.3390/f14050860
Submission received: 27 January 2023 / Revised: 11 April 2023 / Accepted: 18 April 2023 / Published: 22 April 2023

Abstract

:
Spring forest ephemerals often create homogeneous patches in the understory; however, our knowledge about their stand level characteristics is deficient. Our aims were to examine, parallel to their phenology, the stand level Net Ecosystem CO2 Exchange (NEE) and evapotranspiration (ET) fluxes as well as the dependence of NEE on leaf area (LA), air temperature (Tair) and light (PPFD) in three spring forest geophytes that are widespread in Europe. Furthermore, we compared the leaf and stand level net photosynthesis. The methods used included open chamber measurements with an infrared gas analyser in permanent plots on a weekly basis. The results showed that the stand levels of all three species proved to be carbon sinks from the beginning of the vegetation period until the end of it or until the last phase of fruit formation. The largest amount of carbon sink was observed at the peak of blooming. A positive linear correlation was measured between NEE and PPFD as well as between NEE and LA, while a negative linear regression was measured between NEE and Tair. The remarkable carbon uptake capacity indicates the non-negligible role of geophyte vegetation in the carbon flux of temperate forests. In addition, the research provided new proof about the role of stand level operation, stability and regulation.

1. Introduction

Despite the fact that spring forest geophytes live together in bulk numbers and often create homogeneous stands, previous research has been implemented on individual or infraindividual levels in laboratories (e.g., [1]), in situ (e.g., [2]) or, in some cases, using both approaches (e.g., [3,4,5]).
Spring ephemerals of temperate deciduous forests appear shortly after the snow has melted and senesce shortly after the overstory canopy has closed [6]. During this period, geophytes complete their aboveground growth, which includes fruit production, within 2 months [7]. Their leaves senesce when the light intensity decreases. Their photosynthetic response is mostly determined by adaptations to seasonal changes in light availability related to the dynamics of the overstory canopy [8].
Spring ephemerals have high photosynthetic rates that allow them to rapidly accumulate carbohydrates and complete their aboveground growth in a few weeks [7]. To sustain high photosynthetic activities in early spring, the plants must be able to absorb water efficiently at low soil temperatures and to allocate large amounts of nutrients to the shoot to compensate for lower enzymatic activity at low temperatures [7].
During rapid shoot growth and fruiting, the bulbs and aboveground organs appeared to be competing sinks for the photosynthetically fixed carbon [1]. A comparative study [9] examined the photosynthetic induction dynamics of four deciduous forest understory herbs to sunflecks. It was discovered that early spring herbs responded as full-sun plants with a higher light compensation point and greater net photosynthesis at light saturation. The Photosynthetic Photon Flux Density (PPFD) required to maintain an induced photosynthetic state was significantly greater in spring-green herbs than in summer-green herbs. In field populations of geophytes, as the overstory leaf area index increased, declines occurred in all gas exchange characteristics except in apparent quantum efficiency [4]. Spring forest geophytes showed high resorption efficiency during leaf senescence [7].
The ecophysiological traits of seven spring forest geophytes, including the early flowering spring ephemerals Ranunculus ficaria L. and Corydalis cava (L.) Koerte were compared by Popović et al. [2]. It was observed that all species showed similar seasonal dynamics of the assessed parameters, but the average seasonal values of photosynthesis and the light compensation point differed significantly. Another comparative study [3] showed that spring forest geophytes had the lowest N uptake capacity in both laboratory and field experiments. However, they maintained substantial root uptake capacity throughout the summer when they showed no photosynthetic activity, and the mean residence time of N was also significant in these plants.
A 13CO2-trace experiment focused on the translocation of current photosynthetic products to individual organs [10]. It showed that fruit-forming plants retained leaves longer than vegetative plants and foliar photosynthetic products were largely transported to bulbs. Additionally, the bract-clipping significantly reduced seed production; therefore, the current photosynthesis of leafy bracts might be a major carbon source for fruit development.
Some parts of the research have been manipulated in order to examine, e.g., the responses of leafing phenology and photosynthesis to soil warming in seven understory species with various leaf habits [11]. The soil temperature in the warming plots was electrically maintained 5 °C higher than in the control plots. Based on this experience, it can be said that physiological responses to soil warming were highly species-specific, but the soil warming impacts on understory plants were most prominent in spring, especially for phenological characteristics. Another manipulated examination focused on the effects of air and soil temperature during the growth of spring ephemerals [6]. The results showed that the final dry mass was higher at the lower temperature regime, while leaves lasted longer than at the higher temperature regime. In addition, both air and soil temperatures had an impact on the growth of forest geophytes.
The phenological and physiological responses of plants to climate change are key issues for understanding the global warming impact on ecosystems [11]. Thus, a better understanding of the factors controlling the growth rate of spring ephemerals is needed before we can predict these plants’ response to climate changes [7].
The objectives of this study were (i) to measure the Net Ecosystem CO2 Exchange (NEE) and evapotranspiration (ET) fluxes of forest geophytes during their vegetation period; (ii) to compare leaf and stand level net photosynthesis; (iii) to examine the dependence of NEE on light, air temperature (Tair) and leaf area (LA) as well as the connection between NEE and ET.

2. Materials and Methods

2.1. Study Site

The examinations were carried out in a 1.5 ha oak forest patch of Szent István University Gödöllő Botanical Garden (Gödöllő 19°14′ E, 47°25′ N, 250 m elevation) [12]. The surface of the study site is flat, so the topographical conditions did not influence the results. Three different ground plant communities or stands were selected within a 100-square-metre area. The investigated stands were at the same distance from the edge of the forest and a few metres from each other, thereby ensuring the greatest possible similarity of abiotic factors. The examined communities were dominated by three spring forest geophytes widely common in Europe [5,13] boasting three different subterranean storage organs: Anemone ranunculoides L. had rhizome, Corydalis solida (L.) Clairv. was tuberous and Ranunculus ficaria L. had swollen, club-like root-tubers. The geophytes dominated in the patches (d = 60 cm, A = 0.2826 m2) of the stands selected for examination. The abundance of the selected geophyte species in the studied patches was representative of the entire stand. Their abundance was also indicated by the fact that their proportion in the ground canopy and the aboveground phytomass was at least 90 percent within the examined patches during the entire study period. All selected geophyte stands bordered other geophyte stands in the forest.
Mean annual temperature of the Botanical Garden is 10.5 °C; the garden’s average amount of precipitation is 587 mm [14]. The vegetation period lasts from March to mid-November. The coolest month is January with an average temperature of 1 °C, while the warmest month is July with an average temperature of 22 °C. The driest month is January with an average monthly rainfall of less than 20 mm.
Taxon nomenclature followed the Euro + Med PlantBase [15].

2.2. Measurements and Data Collection

NEE of patches of geophyte vegetation was carried out episodically on a weekly basis during the whole vegetation period using chamber technique operating in open system and Ciras 2 infrared gas analyser (PP Systems, Hitchin, UK). The transparent, non-destructive, portable plexiglass chamber was circle-shaped with a diameter of 60 cm. Previously, we had successfully examined different grassland types by using the same technique (e.g., [16,17]). NEE measurements of each stand were implemented between 11 am and 2 pm within the three selected permanent patches. The exact location was identified by a circular metal plate (d = 60 cm) sunk into the soil. Measurements were conducted between 30 Mar and 18 May, between 30 March and 4 May and between 23 March and 12 May in the cases of Anemone ranunculoides, Corydalis solida and Ranunculus ficaria, respectively. The infrared gas analyser (IRGA) measured the difference in CO2 flux (CO2 concentrations of both the reference and analysed air at the inbound and outbound pipes of the chamber) and the ET of the stand covered by the chamber (ET was determined by measuring the differences in water vapour concentrations of reference /in/ and analysed /out/ air), while PPFD and Tair were measured by the IRGA during the gas exchange measurements. The gas analyser examined six samples per minute for an average of 60 min for each patch of geophyte vegetation.
Average temperatures of the given stand were used for NEE calculations. The following differential equation was applied when calculating CO2 flux:
F = Δc* Q/A
where ‘F’ is the stand level flux of (NEE)/CO2 uptake of the plant stand, vegetation and soil respiration in the case of CO2 flux or the resultant of the ET from the soil surface covered by vegetation in the case of ET/ (mol m−2 s−1); ‘Δc’ represents the difference in incoming and outgoing concentrations of /CO2 or H2O/ (mol m−3); ‘Q’ is the flow rate (m3 s−1); and ‘A’ is the soil surface covered by the chamber (m2).
In the subsequent quality control, raw data was manually filtered where negative ET values and outliers that were recorded at the initial and final phases of the measurement (due to human respiration) had not been taken into account.
Leaf photosynthesis (on 6 replicates from 6 different plants) of the dominant species was measured twice during intensive root–shoot allocation (13 April) and reallocation (4 May) periods. The standard cuvette of the same infrared gas analyser (PP Systems, Hitchin, UK) and permanent plots were used for leaf photosynthesis measurements in order to compare the infraindividual (or leaf level) and stand level net photosynthetic rate.
As for estimating the LA of the stands, all leaves of the plants were counted in each permanent patch and each measuring occasion. Samples were collected (at least three samples/species) from outside the examined area in order to avoid the disturbance of the patches. These samples were selected with the consideration that they should match the current phenological phase and the average leaf size of the measured stand. The exact leaf area was determined by using graph paper and the average value was multiplied by the number of leaves counted within the examined patches.
Micrometeorological measurements and LA estimations were used to determine the dependence of the measured NEE values on some abiotic (PPFD and Tair) and biotic (LA) factors. HOBO (MicroStation, Onset, MA, USA) micrometeorological station was installed among the selected geophyte stands. The sensors of this station sampled the temperature and moisture of soil (both at 5 cm depth) as well as PPFD in 5 min intervals during the entire vegetation period of the ephemerals and submitted these data to the automatic data recording unit.
Current phenological phases of geophytes including the number of blooming specimens were constantly recorded together with the results of physiological measurements.

2.3. Statistical Analyses

The Kolmogorov–Smirnov test was performed to test for normal distribution of the data. For testing the homoscedasticity, Bartlett’s test was used. For normally distributed data, Student’s t-test and one-way analysis of variance (ANOVA) was applied to identify significant differences between datasets, while, for non-normally distributed data, the nonparametric Mann–Whitney test was performed instead at significance level of 0.05. Linear regression and non-linear regression were calculated using SigmaPlot2012 (SPSS Inc., Chicago, IL, USA) in order to evaluate the influence of PPFD, Tair, LA and ET on NEE. To estimate the unknown parameters, curve fitting was established by minimizing the sum of the squared residuals (method of ordinary last squares—OLS). Coefficient of determination (r2) was used to explain how well the variation from the continuous explanatory variable could be predicted. Only significant regressions were represented in the figures indicating the strength of the regression. The most significant regression was fitted to the data in all cases. Statistical analyses were calculated using SigmaPlot2012. Figures were created using the same software.

3. Results

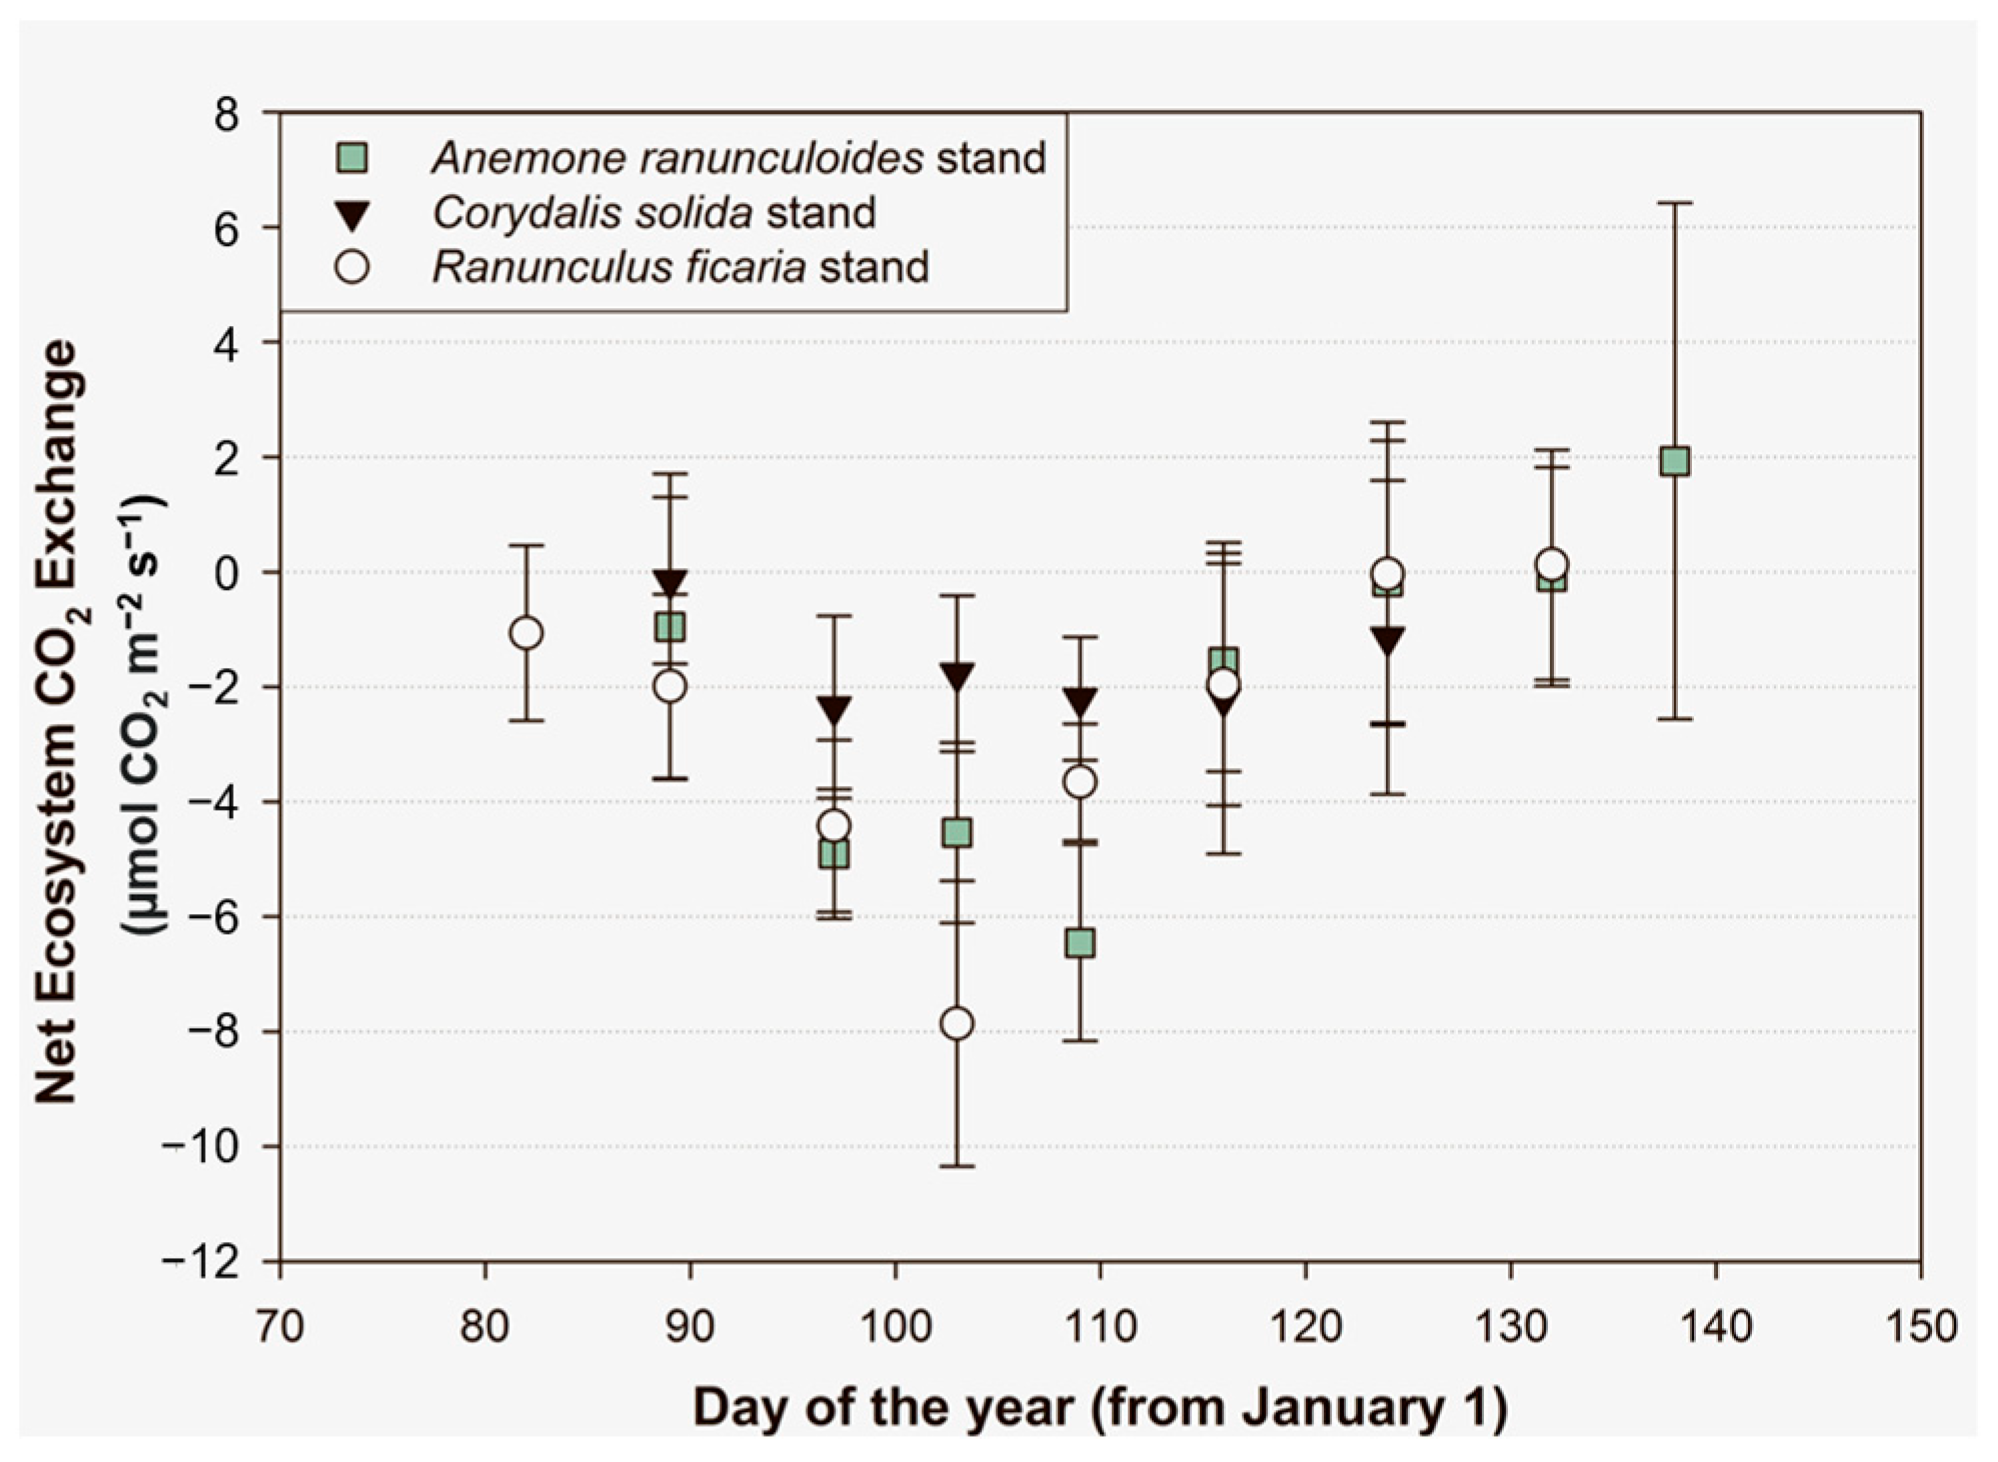
At stand level, all three species were carbon sinks from the beginning of the vegetation period until the end of it (Corydalis solida) or until the last phase of fruit formation (Anemone ranunculoides and Ranunculus ficaria) (Figure 1). The largest amount of carbon sink was measured in the R. ficaria stand four weeks after the appearance of the aboveground shoots. CO2 emission was detected in the cases of R. ficaria and A. ranunculoides but only in the last week of their aboveground lifecycle. The extent of carbon sink activity increased rapidly and constantly during the first four weeks in the R. ficaria patch. A similar trend could be observed within the A. ranunculoides stand while the carbon fixation of the patch dominated by C. solida was smaller but more balanced. Apart from the first and the last weeks of the experiment, the C. solida stand showed a nearly constant NEE value. Based on the cumulated averages, the carbon sink was the largest in the R. ficaria stand: it was 25% higher than in A. ranunculoides and more than double than that of C. solida. It can be noted in all three groups that the standard deviation of NEE was higher at the beginning and at the end of the geophytes’ aboveground lifecycle but lower during the in-between period, including during the blooming phenophase. All three geophytes completed their aboveground lifecycle—including fruit production—within 8 weeks. This correlates to the lifecycle length of North American spring forest geophytes [7]. C. solida had the shortest lifecycle of only 6 weeks. From the end of March until the beginning of May, it finished fruit production and its aboveground phytomass had disappeared. On the contrary, the other two plants had a lifecycle of 8 weeks. R. ficaria appeared in the second half of March and its aboveground parts were last observable and measurable in mid-May. The lifecycle of A. ranunculoides followed that of R. ficaria with a one-week shift (Figure 1).
Leaf photosynthesis exceeded NEE fluxes at all sites and during the measuring period (Figure 2), with the exception of the Corydalis solida stand during leaf senescence (Figure 2b). During intensive leaf development (Figure 2a), the differences were significant for Anemone (p < 0.001), Corydalis (p < 0.001) and Ranunculus (p < 0.01).
Regarding stand level carbon uptake and PPFD, a positive correlation was observed for all three species. The strongest linear relationship (r2 = 0.84) was found in the case of A. ranunculoides (Figure 3), which proved to be significant (F = 32.15, p < 0.01). The highest NEE value was measured at the first half of the vegetation cycle when PPFD was also the largest because shrub layer and canopy had not come into leaf yet.
To the contrary of radiation, a weak negative correlation was found between NEE and Tair in all three stands. As spring advanced and Tair increased, the storage organs of ephemerals were filled, and, thus, their carbon sequestration [4] and storage capacity decreased considerably. As for the A. ranunculoides stand (Figure 4), the measurement made in mid-April reduced the negative correlation. In this case, at the peak of blooming, a high Tair corresponded to the largest amount of carbon sequestration. Nevertheless, the relationship was still the strongest at this type.
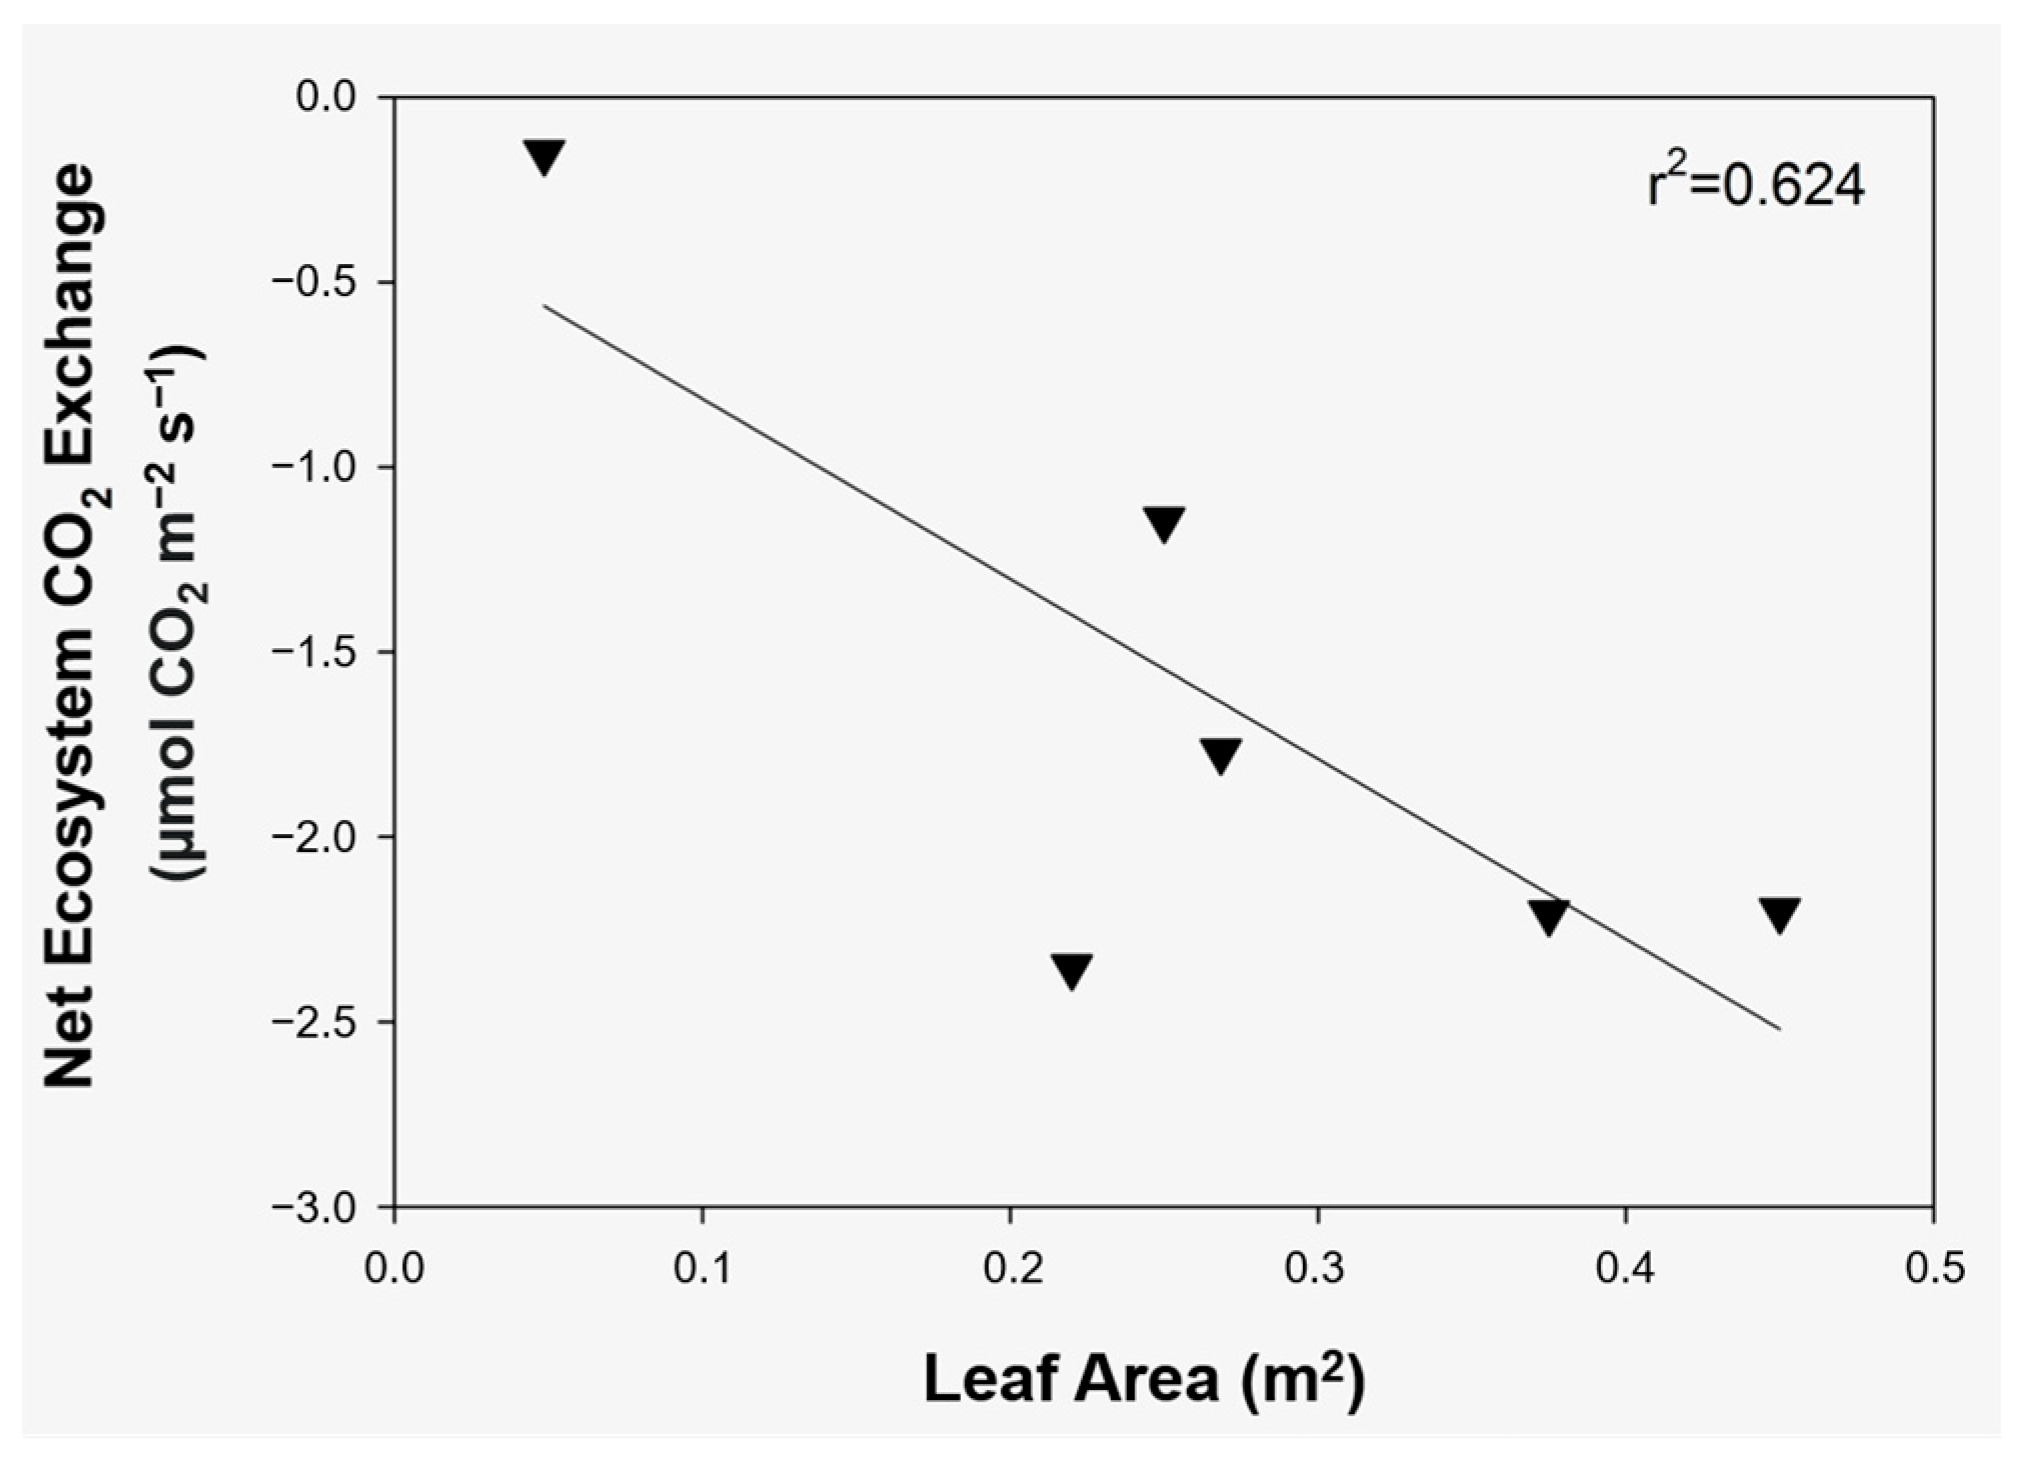
In all stands, a positive correlation was observed between the stand level CO2 fixation and LA, and, thus, the intensive carbon sink was measured only when the leaf area considerably increased. A significant (F = 25.54, p < 0.01) linear correlation and a strong, but not significant, linear correlation provided the strongest connections in A. ranunculoides (Figure 5) and C. solida (Figure 6), respectively.
The average NEE positive correlation was measured in all three types between stand level carbon uptake and ET. It was the strongest in the R. ficaria stand in which a significant (F = 24.51, p < 0.01) linear relationship (r2 = 0.84) was observed (Figure 7) between NEE and ET. The linear relationship for the patch of A. ranunculoides was also strong, but no significant correlation was revealed regarding the averages of CO2 sink and ET. However, if the data of the sampling days was assessed separately, then the correlation was revealed to be significant, but a positive correlation cannot exclusively be observed in the seasonal dynamics of NEE and ET (Figure 8). During the first three weeks a weak, and insignificant, but a positive correlation was found between the stand level CO2 uptake and ET (Figure 8a–c). In the fourth week, at the time of full foliage development and the peak of blooming, this positive and linear relationship (r2 = 0.35) reached its highest level and became significant (F = 146.21, p < 0.001) (Figure 8d). A week later, a similarly significant (F = 57.28, p < 0.001) and a linear but weak negative regression (r2 = 0.11) was observed (Figure 8e). During the last three weeks, an exponential rise to the max type negative curve gave the strongest significant (p < 0.001) regression between NEE and ET (Figure 8f /F = 45.56/, Figure 8g /F = 22.80/, Figure 8h /F = 22.04/). From the fourth week until the end of the vegetation period, strong and significant (p < 0.001) regressions were found between these two variables (Figure 8d–h).

4. Discussion

4.1. Net Ecosystem CO2 Exchange

The stand level NEEs of the examined species had similar seasonal dynamics, as was concluded following the leaf level photosynthesis measurements of Popović et al. [2] implemented on different spring forest geophytes. The stand level carbon sink of the examined spring forest geophytes is considerable, especially compared to their relatively small LA and the low level of undergrowth diversity. During the vegetation period, their stand level carbon fixation is similar to that of the much more diverse Pannonian loess [17] and sandy [16] grasslands as well as mixed-grass grazed [18] and non-grazed [19] prairies and sheep-grazed Mongolian steppes [20].
It is surprising that these plants maintain their remarkable carbon uptake potential during almost their entire aboveground phenophase with the exception of the rapid senescence occurring parallel to the closing of the uppermost canopy level. This justifies the results of the leaf level measurements conducted by Constable et al. [4]. It is explained by the intense photosynthesis of these plants determined by several researchers (e.g., [2,7]). Different levels of carbon sink of the examined species, such as the lower NEE of C. solida, (Figure 1) can be explained by the various leaf areas (Figure 5 vs. Figure 6) as well as by, according to Bernatches and Lapointe [21], species differences that might be caused by their specific carbon metabolism at the underground level. Furthermore, asynchronous overstory leaf flushing in spring might have resulted in spatial heterogeneity in understory light conditions, as concluded in the examinations by Kato and Komiyama [22].
Following the rapid leafing of the geophytes, the standard deviation (SD) of NEE decreased considerably in all three stands (Figure 1), which implies stand level regulation. SD increased again only at the time of leaf senescence. The reason for NEE reduction during the last week (C. solida) or weeks (A. ranunculoides and R. ficaria) is that, as carbohydrate reserves are replenished, sink limitation builds up and induces leaf senescence [7].
The highest level of carbon uptake can be observed at the peak of blooming, presumably because, in this period, the leaves are not yet senescent and bracts assimilate. This can cover the carbon demand of blooming and fruit development [10].
During intensive root–shoot allocation, the leaf level net photosynthetic rate (Figure 2a) is similar to that of other temperate spring forest geophytes from the same [23] or other genus (e.g., [24]). The higher standard deviation of the net photosynthetic rate (Figure 2) indicates that stand level carbon gain is presumably more closely related to plant growth and survival than leaf level carbon gain, since it also includes the effects of plant level characteristics, such as root respiration, patterns of biomass allocation and canopy architecture [25]. In addition, stand level features, such as soil respiration [26], also contribute to lower NEE values.

4.2. Light and Temperature Dependence of NEE

The A. ranunculoides stand also justified that a larger carbon sink requires higher PPFD (Figure 3), because the photosynthetic apparatus is strongly affected by the prevailing PPFD, especially at the time of leaf development [27]. This confirms the result of Hull [9] who states that the PPFD required to maintain an induced photosynthetic state is significant in spring forest ephemerals.
Among the examined parameters Tair influenced NEE the least (Figure 4). Bernatchez and Lapointe [21] also found that the highest net photosynthetic rates are not measured at the highest temperature. The examinations of Muller et al. [27] conducted in understory shrubs showed that, across sites, PPFD had stronger effects than Tair on photosynthetic acclimation. A low regression between NEE and Tair can partly be explained by the results of the manipulated examinations of Badri et al. [6] claiming that the impact of soil temperatures was greater than Tair on the growth of geophytes and the former also influenced leaf life duration.

4.3. Leaf Area and Evapotranspiration Dependence of NEE

The strong (Figure 6), often significant (Figure 5), correlation between the carbon sink and LA has already been revealed by several researchers (e.g., [28,29,30] in different herbaceous vegetation types. Based on the research of Sunmonu et al. [10], the assimilation of the foliage is also important for the reallocation of storage organs. The regression between NEE and LA was the weakest in the case of R. ficaria. This can be explained by the fact that in the last two weeks of the vegetation period, the large but partly senescent leaf area resulted in lower carbon sequestration.
The change in the significantly positive regression of NEE and ET (Figure 8d) into a negative regression (Figure 8e) may be a result of the large amount of rainfall before the measurement [26], since both the ET value and soil respiration (microbial and root) increased (see the scale of the X-axis and the transpiration values of Figure 8e compared to the other periods (Figure 8)). Gas and water vapour outflow was not continuous but occurred “in puffs”, which can be much more intensive in the case of higher soil moisture; thus, wetting events may cause a large pulse of soil respiration [31]. The pulse-like flux was most likely caused by the decomposition of active carbon compounds in the litter layer [32].
Compared to the other two examined species, C. solida had a smaller LA and a lower carbon intake. This fact brings attention to the importance of extensive forest management and the vulnerability of semi-natural forest stands. It is known from the literature data [33] that, due to the plantation of coniferous tree species and the clearcutting of forests, the proportion of geophytes in forest undergrowth can be considerably reduced or can completely vanish. As a result, the important carbon sink capacity of forest stands also disappears. One of the reasons for this decrease is that under a regime of diurnal temperature alternation germination fails almost completely, which could explain the absence of A. ranunculoides in open habitats [5].

5. Conclusions

Due to the chamber measurement technique used, we could, for the first time, obtain some information on the carbon uptake magnitude of spring forest geophytes. CO2 exchange measurements proved that the phenological stage of the geophytes do affect their carbon fluxes. During intensive leaf development, a significant difference was observed between leaf and stand level net photosynthesis. Spring forest geophytes maintain their remarkable carbon uptake potential during almost their entire aboveground phenophase. Despite their short overground lifecycle, the remarkable carbon uptake capacity indicates the non-negligible role of geophyte vegetation in the carbon flux of temperate forests. Out of the environmental variables, PPFD and LA strongly influenced the NEE, while the role of Tair was negligible. More stands expressed the dependence of NEE on ET (Figure 7 and Figure 8), PPFD (Figure 3) and Tair (Figure 4), which provided new proof about the role of stand level operation, stability and regulation during periods when plants have larger leaf areas. This regulation proves that there is no correlation in the initial phase of stand development; rather, it builds up gradually. Moreover, in the case of grounds covered with vegetation, the extent of transpiration is determined, in addition to the main abiotic factors (PPFD, Tair), by the biotic factor: the vegetation and, mainly, the foliage and root system. In conclusion, ET is less dependent on abiotic factors in the case of a larger LA because ET is considerably regulated by the vegetation. Furthermore, the light and temperature conditions at ground level fluctuate in a smaller range compared to bare [26] or partly covered soils. The results of our examinations can be used for modelling plant stands with similarly rapid dynamics (e.g., weed communities).

Author Contributions

Conceptualization, S.C. and O.S.; methodology, S.C.; software, D.S. and T.B.; formal analysis, D.S.; investigation, S.C. and O.S.; data curation, S.C. and P.T.; writing—original draft preparation, S.C., T.B., P.T. and O.S.; writing—review and editing, S.C. and D.S.; visualization, S.C., T.B. and D.S.; supervision, S.C and O.S. All authors have read and agreed to the published version of the manuscript.

Funding

This research received no external funding.

Data Availability Statement

The data that support the findings of this study are available on request from the corresponding author.

Acknowledgments

We are grateful to Zoltán Németh, Emese Dalma Nagygyörgy and Enikő Varga for their help in the field data collection. Special thanks to Michael McMahon for the English language and style corrections.

Conflicts of Interest

The authors declare no conflict of interest.

References

  1. Orthen, B.; Wehrmeyer, A. Seasonal dynamics of non-structural carbohydrates in bulbs and shoots of the geophyte Galanthus nivalis. Physiol. Plant. 2004, 120, 529–536. [Google Scholar] [CrossRef]
  2. Popović, Z.; Bojović, S.; Matić, R.; Stevanović, B.; Karadžić, B. Comparative ecophysiology of seven spring geophytes from an oak-hornbeam forest. Braz. J. Bot. 2016, 39, 29–40. [Google Scholar] [CrossRef]
  3. Rothstein, D.E.; Zak, D.R. Relationships between plant nitrogen economy and life history in three deciduous-forest herbs. J. Ecol. 2001, 89, 385–394. [Google Scholar] [CrossRef]
  4. Constable, J.V.H.; Peffer, B.J.; DeNicola, D.M. Temporal and light-based changes in carbon uptake and storage in the spring ephemeral Podophyllum peltatum (Berberidaceae). Environ. Exp. Bot. 2007, 60, 112–120. [Google Scholar] [CrossRef]
  5. Mondoni, A.; Probert, R.; Rossi, G.; Hay, F. Habitat-related germination behaviour and emergence phenology in the woodland geophyte Anemone ranunculoides L. (Ranunculaceae) from northern Italy. Seed Sci. Res. 2009, 19, 137–144. [Google Scholar] [CrossRef]
  6. Badri, M.A.; Minchin, P.E.H.; Lapointe, L. Effects of temperature on the growth of spring ephemerals: Crocus vernus. Physiol. Plant. 2007, 130, 67–76. [Google Scholar] [CrossRef]
  7. Lapointe, L. How phenology influences physiology in deciduous forest spring ephemerals. Physiol. Plant. 2001, 113, 151–157. [Google Scholar] [CrossRef]
  8. Popović, Z.; Mijović, A.; Karadžić, B. Dry matter distribution patterns and photosynthetic traits of two vernal ephemeroids in a deciduous forest. Period. Biol. 2005, 107, 287–292. [Google Scholar]
  9. Hull, J.C. Photosynthetic induction dynamics to sunflecks of four deciduous forest understory herbs with different phenologies. Int. J. Plant. Sci. 2002, 163, 913–924. [Google Scholar] [CrossRef]
  10. Sunmonu, N.; Ida, T.Y.; Kudo, G. Photosynthetic compensation by the reproductive structures in the spring ephemeral Gagea lutea. Plant Ecol. 2013, 214, 175–188. [Google Scholar] [CrossRef]
  11. Ishioka, R.; Muller, O.; Hiura, T.; Kudo, G. Responses of leafing phenology and photosynthesis to soil warming in forest-floor plants. Acta Oecol. 2013, 51, 34–41. [Google Scholar] [CrossRef]
  12. Szirmai, O.; Horel, J.; Neményi, A.; Pándi, I.; Gyuricza, C.; Czóbel, S. Overview of the collections of the first agrobotanical garden of Hungary. Hung. Agr. Res. 2014, 23, 19–25. [Google Scholar]
  13. Press, B.; Gibbons, B. Wild Flowers of Britain and Europe; New Holland: London, UK, 2002. [Google Scholar]
  14. Czóbel, S.; Horváth, L.; Szirmai, O.; Balogh, J.; Pintér, K.; Németh, Z.; Ürmös, Z.; Grosz, B.; Tuba, Z. Comparison of N2O and CH4 fluxes from Pannonian natural ecosystems. Eur. J. Soil. Sci. 2010, 61, 671–682. [Google Scholar] [CrossRef]
  15. Euro+Med (11-May-2018) Euro+Med PlantBase—The Information Resource for Euro-Mediterranean Plant Diversity. Available online: http://ww2.bgbm.org/EuroPlusMed/query.asp (accessed on 11 May 2018).
  16. Czóbel, S.; Szirmai, O.; Németh, Z.; Gyuricza, C.; Házi, J.; Tóth, A.; Schellemberger, J.; Vasa, L.; Penksza, K. Short-term effects of grazing exclusion on net ecosystem CO2 exchange and net primary production in a Pannonian sandy grassland. Not. Bot. Horti Agrobot. Cluj Napoca 2012, 40, 67–72. [Google Scholar] [CrossRef]
  17. Czóbel, S.; Németh, Z.; Szirmai, O.; Gyuricza, C.; Tóth, A.; Házi, J.; Vikár, D.; Penksza, K. Short-term effects of extensive fertilization on community composition and carbon uptake in a Pannonian loess grassland. Photosynthetica 2013, 51, 490–496. [Google Scholar] [CrossRef]
  18. Frank, A.B. Carbon dioxide fluxes over a grazed and seeded pasture in the Northern Great Plains. Environ. Pollut. 2002, 116, 397–403. [Google Scholar] [CrossRef]
  19. Frank, A.B.; Dugas, W.A. Carbon dioxide fluxes over a northern, semiarid, mixed-grass prairie. Agric. For. Meteorol. 2001, 108, 317–326. [Google Scholar] [CrossRef]
  20. Li, S.G.; Asanuma, J.; Eugster, W.; Kotani, A.; Liu, J.J.; Urano, T.; Oikawa, T.; Davaa, G.; Oyunbaatar, D.; Sugita, M. Net ecosystem carbon dioxide exchange over grazed steppe in central Mongolia. Glob. Chang. Biol. 2005, 11, 1941–1955. [Google Scholar] [CrossRef]
  21. Bernatchez, A.; Lapointe, L. Cooler temperatures favour growth of wild leek (Allium tricoccum), a deciduous forest spring ephemeral. Botany 2012, 90, 1125–1132. [Google Scholar] [CrossRef]
  22. Kato, S.; Komiyama, A. Spatial and seasonal heterogeneity in understory light conditions caused by differential leaf flushing of decidious overstory trees. Ecol. Res. 2002, 17, 687–693. [Google Scholar] [CrossRef]
  23. Yoshie, F. Intercellular CO2 concentration and water-use efficiency of temperate plants with different life-forms and from different microhabitats. Oecol 1986, 68, 370–374. [Google Scholar] [CrossRef] [PubMed]
  24. Popović, Z.; Mijović, A.; Karadžic, B.; Mijatovic, M. Response of growth dynamics of two spring geophytes to light regime in a lime-beech forest. J. Integ. Plant Biol. 2006, 48, 527–535. [Google Scholar] [CrossRef]
  25. Beaudet, M.; Messier, C.; Hilbert, C.D.; Lo, E.; Wang, Z.M.; Lechowicz, M.J. Leaf- and plant-level carbon gain in yellow birch, sugar maple, and beech seedlings from contrasting forest light environments. Can. J. Res. 2000, 30, 390–404. [Google Scholar] [CrossRef]
  26. Németh, Z.; Nagygyörgy, E.D.; Czóbel, S.; Péli, E.; Szirmai, O. Changing soil respiration in a geophyte-rich Pannonian forest from snowmelt until peak leafing. Cereal Res. Commun. 2008, 36, 1967–1970. [Google Scholar]
  27. Muller, O.; Hikosaka, K.; Hirose, T. Seasonal changes in light and temperature affect the balance between light harvesting and light utilisation components of photosynthesis is an evergreen understory shrub. Oecol 2005, 143, 501–508. [Google Scholar] [CrossRef] [PubMed]
  28. Flanagan, L.B.; Wever, L.A.; Carlson, P.J. Seasonal and interannual variation in carbon dioxide exchange and carbon balance in a northern temperate grassland. Glob. Chang. Biol. 2002, 7, 599–615. [Google Scholar] [CrossRef]
  29. Gilmanov, T.G.; Tieszen, L.L.; Wylie, B.K.; Flanagan, L.B.; Frank, A.B.; Haferkamp, M.R.; Meyers, T.P.; Morgan, J.A. Integration of CO2 flux and remotely sensed data for primary production and ecosystem respiration analyses in the Northern Great Plains: Potential for quantitative spatial extrapolation. Glob. Ecol. Biogeogr. 2005, 14, 271–292. [Google Scholar] [CrossRef]
  30. Czóbel, S.; Horváth, L.; Pósa, P.; Schellenberger, J.; Skutai, J.; Szirmai, O. Dependence of CO2 flux on the key abiotic and biotic parameters in semi-natural grasslands either traditionally grazed or excluded from grazing. Appl. Ecol. Environ. Res. 2017, 15, 15–23. [Google Scholar] [CrossRef]
  31. Oikawa, P.Y.; Grantz, D.A.; Chatterjee, A.; Eberwein, J.E.; Allsman, L.A.; Jenerette, G.D. Unifying soil respiration pulses, inhibition, and temperature hysteresis through dynamics of labile soil carbon and O2. J. Geophys. Res. 2014, 119, 521–536. [Google Scholar] [CrossRef]
  32. Lee, X.; Wu, H.J.; Sigler, J.; Oishi, C.; Siccama, T. Rapid and transient response of soil respiration to rain. Glob. Chang. Biol. 2004, 10, 1017–1026. [Google Scholar] [CrossRef]
  33. Sawada, S.; Chida, S.; Sawaguchi, Y.; Nagasawa, N. Dry matter production, population structure and environmental conditions of the spring ephemeral Erythronium japonicum growing in various habitats differing in sunlight exposure in cool temperate Japan. Ecol. Res. 1997, 12, 89–99. [Google Scholar] [CrossRef]
Figure 1. Seasonal dynamics of Net Ecosystem CO2 Exchange (NEE) in the stand dominated by the 3 spring forest geophytes. The error bars show SD. Negative values at y-axis indicate that carbon is absorbed by the ecosystem, while positive values indicate that carbon is released by the ecosystem into the atmosphere.
Forests 14 00860 g001
Figure 2. Comparison of leaf and stand level net photosynthesis during intensive root–shoot allocation (a) and reallocation (b) periods. Leaf and stand level measurements were carried out near saturating irradiances. Double (p < 0.01) and triple (p < 0.001) asterisks indicate a statistical difference between infraindividual (leaf level) and stand level measurements.
Forests 14 00860 g002
Figure 3. Photosynthetic Photon Flux Density (PPFD) dependence of NEE in the Anemone ranunculoides stand. Negative values indicate CO2 uptake. Negative values at y-axis indicate that carbon is absorbed by the ecosystem, while positive values indicate that carbon is released by the ecosystem into the atmosphere.
Forests 14 00860 g003
Figure 4. Air temperature (Tair) dependence of NEE in the Anemone ranunculoides stand. Negative values at y-axis indicate that carbon is absorbed by the ecosystem, while positive values indicate that carbon is released by the ecosystem into the atmosphere.
Forests 14 00860 g004
Figure 5. Linear regression relationship between NEE and Leaf Area (LA) in the Anemone ranunculoides stand. Negative values at y-axis indicate that carbon is absorbed by the ecosystem, while positive values indicate that carbon is released by the ecosystem into the atmosphere.
Forests 14 00860 g005
Figure 6. Linear regression between NEE and LA in the Corydalis solida stand. Negative values at y-axis indicate that carbon is absorbed by the ecosystem.
Forests 14 00860 g006
Figure 7. Evapotranspiration (ET) dependence of NEE in the Ranunculus ficaria stand. Negative values at y-axis indicate that carbon is absorbed by the ecosystem, while positive values indicate that carbon is released by the ecosystem into the atmosphere.
Forests 14 00860 g007
Figure 8. ET dependence of NEE in the Anemone ranunculoides stand in eight different periods, measured on a weekly basis (ah) between 30 March (a) and 18 May (h) indicating all data of the measured period. Curve fittings show significant (p < 0.001) regression. Negative values at y-axes indicate that carbon is absorbed by the ecosystem, while positive values indicate that carbon is released by the ecosystem into the atmosphere.
Forests 14 00860 g008
Disclaimer/Publisher’s Note: The statements, opinions and data contained in all publications are solely those of the individual author(s) and contributor(s) and not of MDPI and/or the editor(s). MDPI and/or the editor(s) disclaim responsibility for any injury to people or property resulting from any ideas, methods, instructions or products referred to in the content.

