Article

The Impact of Tree Species on Microbial Community Structure and Soil Function on Forest Plantations in the Central Hardwoods Region (CHR)

by
Terrence G. Gardner
1,*,†,‡,
Juan P. Frene
2,†,‡,
Shaneka S. Lawson
3,
Niall D. Lue Sue
3,
Jeffery Handy
1 and
Ralph H. Crawford
4
1
Department of Biology, Morehouse College, Atlanta, GA 30314, USA
2
Future Food Beacon of Excellence, School of Biosciences, University of Nottingham, Sutton Bonington, Nottingham LE12 5RD, UK
3
USDA Forest Service, Northern Research Station, Hardwood Tree Improvement and Regeneration Center (HTIRC), PFEN226C, Department of Forestry and Natural Resources, Purdue University, 715 West State Street, West Lafayette, IN 47907, USA
4
USDA Forest Service, Northern Research Station, Director’s Office, Wyndmoor, PA 19038, USA
*
Author to whom correspondence should be addressed.
These authors contributed equally to this work.
Formally at Department of Crop and Soil Sciences, North Carolina State University, Raleigh, NC 27695, USA.
Forests 2023, 14(5), 859; https://doi.org/10.3390/f14050859
Submission received: 22 March 2023 / Revised: 12 April 2023 / Accepted: 17 April 2023 / Published: 22 April 2023
(This article belongs to the Section Forest Ecology and Management)

Abstract

:
Interactions between above- and below-ground monoculture forest plantation components are critical to tree growth and development. Within the Central Hardwoods Region (CHR), synergistic relationships between tree species and soil microbial community structure and function have received limited research attention. Soil microbes are integral to forest ecosystems as their activities intrinsically promote soil organic matter decomposition, nutrient cycling, and ecosystem functioning. Here, we examined soils from two perfectly aligned stands of black walnut (BW, Juglans nigra L.) and Northern red oak (RO, Quercus rubra L.) trees. Measurements of selected soil chemical properties, microbial community structure using ester-linked fatty acid methyl ester (EL-FAME), and soil enzyme activities (EAs) were used. Analysis of modifications within microbial communities showed a significant positive response to BW based upon soil EAs and microbial indicators, compared to RO. Seasonal comparisons predictably revealed higher microbial activities during summer. Fungi dominated the soil microbial community structure with a fungal/bacterial ratio of 2:1. Gram-positive rather than Gram-negative bacteria or actinomycetes dominated the bacterial community. The activity of the soil enzymes ß-glucosidase and arylsulfatase increased, but ß-glucosaminidase and acid phosphatase decreased. Additionally, acid phosphatase and arbuscular mycorrhizal fungi revealed strong correlations. The differences observed in biological properties, specifically microbial communities and EAs, highlight the varied responses to BW and RO soil biology and subsequent soil ecosystem functions. These results indicate that variations in microbial abundance and soil functions occur throughout the course of an entire year.

1. Introduction

Black walnut (BW, Juglans nigra L.) and Northern red oak (RO, Quercus rubra L.) are native to and prevalent in the Central Hardwoods Region (CHR), which is a mosaic of forests, woodlands, savannas, and other ecosystems that cover 42 Mh across southern Missouri, Illinois, Indiana, Wisconsin, and Michigan. Mature BW trees produce edible nuts that can be harvested for human consumption but, in the United States, are most often left as wildlife fodder [1]. Mature RO trees produce acorns vital to the fall and winter diets of numerous wildlife species. Due to their excellent wood form and grain qualities, both species are used primarily for wood products, such as veneer, furniture, flooring, paneling, firewood, and specialty crafts [2]. BW and RO can be slow to mature, often taking between 50 and 80 years [3,4]. Thus, site selection for timber plantation establishment is a significant concern for long-term temporal and economic investors. Hardwood trees influence forest ecosystems by decreasing the light availability [5], releasing exudates, and depositing large amounts of slowly decomposing leaf litter [6,7,8]. It is critical to match the appropriate tree species to the ecological characteristics of the plantation site [9] for optimal tree growth and development.
Soil microbial communities, including mycorrhizal fungi and symbiotic nitrogen-fixing bacteria, play essential roles in plant performance by improving mineral nutrition [10]. The microbial-mediated nutrient transformations, such as biogeochemical cycling and soil organic matter (SOM) decomposition, drive key ecosystem functions [11,12]. Soil microbes are also sensitive to changes in forest ecosystem dynamics, making them helpful in predicting responses to tree types and seasonal changes [13]. Soil microbial communities support the productivity of forested soils by facilitating the exchange of compounds between forest vegetation and forest soils. Plants, in turn, exhibit diverse interactions with soil-dwelling organisms, which span the full range of ecological possibilities (competitive, neutral, commensal, and mutualistic) [10]. The interactions between soil microorganisms and plants reflect the effects of plant diversity on ecosystem function [14]. Several edaphic factors shape soil microbial communities, including changes in available soil carbon, pH, temperature, and soil water content. Variability in these factors can affect microbial community composition and function, plant root growth and structure, mycorrhizal activity, litter quantity, and other organic matter decomposition [15,16]. These same variables change seasonally; thus, inconsistencies in microbial community composition responses to tree species may be modulated or overshadowed by annual climatic patterns [17].
Soil microbial compositions change seasonally as soil temperature, moisture, and soil organic matter (SOM) content fluctuate [18,19]. Thus, season-specific environmental variables, root exudates, and leaf litter quantities can modify the soil microbial community composition [20,21]. In afforested BW and RO plantings, the effects of seasonal and anthropogenic changes on the structure and function of the soil microbial community have not been thoroughly studied. Several authors have shown that Manchurian Walnut and Red Oak have a significant negative effect on microbial abundance due the phenolic component in exudates, for example, soil juglone [22,23]. However, elucidating the seasonal dynamics within soil microbial populations can help us to better understand community shifts and identify roles in nutrient cycling (C cycling). This study took place in southwestern Lower Michigan on a privately-owned property, where young stands of BW and RO, originating from agricultural abandonment, have been planted. There were three objectives for this study: (1) Record and evaluate the soil chemical properties for these two hardwood tree plantings, (2) determine whether soil microbial community composition and those functions involved in nutrient cycling and SOM transformations differ by tree species when compared to non-forested areas within the plantings, and (3) analyze the temporal patterns of soil microbial dynamics across the four seasons.

2. Materials and Methods

2.1. Site Description and Soil Sampling

This study of a BW and RO forest plantation ecosystem was conducted near Grand Rapids, southwestern Lower Michigan (42°57′55.6632″ N, 85°40′12.6264″ W). Both BW and RO were planted in Blount loam (silty clay loam or clay loam till) soil in 2008. The stands consisted of two adjacent blocks containing three 20 × 20 m plots at least 50 m apart. A site without plants (DB) adjacent to these blocks was used as a reference to measure the change (Supplemental Figure S1). Slope gradients at the site are commonly 1 to 3 percent, but they range from 0 to 6 percent. The average annual temperature was 9.5 °C, and the annual precipitation was 932 mm, with maximum precipitation and temperature occurring from May to September (Supplemental Figure S2). Temperature and precipitation information was obtained from U.S. Climate data (https://www.usclimatedata.com/climate/grand-rapids/michigan/united-states/usmi0344, accessed on 12 April 2021).
Soil samples were collected in 2019 (November) and 2020 (March, June, and September). Soil samples within each collection zone were aggregated separately from the leaf litter. Here, 25 soil cores of 3 cm in diameter, separated by depth (0–10 cm and 10–20 cm), were taken from each zone within the plot to generate a representative composite sample. The collected soils were placed in pre-labeled polyethylene bags, stored on ice, and transported to our laboratory. All soil samples were sieved through a 2 mm mesh and divided into 2 halves. Each composite sample was divided into two halves: one was stored in a refrigerator at −20 °C before being analyzed by EL-FAME, while the remaining half was air-dried to measure chemical and biochemical indicators.

2.2. Physical and Chemical Analysis

Lab analyses were used to ascertain the basic properties (gravimetric soil moisture, soil organic C, total N content, and pH) for each sample. Soil moisture was determined after drying 10 g subsamples in a 105 °C oven for 24 h and subsequently collecting soil dry weights. Total C and total N were determined by automated dry combustion using a LECO Tru-Spec CN analyzer, while TOC with a Shimadzu carbon analyzer (Shimadzu Corp.) by IELS (NCSU, NC, USA). Soil pH was measured using a compound electrode (Accumet, MA, USA) with a soil:water ratio of 1:2.5.

2.3. Enzyme Activity (EA)

Soil potential biogeochemical cycling was assessed based on the activity of extracellular hydrolytic enzymes. Enzymes of interest included β-1, 4-glucosidase (BG), acid phosphatase (PME), arylsulfatase (AS), and N-acetyl-β-1, 4-glucosaminidase (NAG). Activity rates were determined by incubating air-dried soil samples (0.5 g < 2 mm) at 37 °C with their appropriate substrate (p-nitrophenyl derivate) at the optimal pH, as described in [24,25]. Enzyme activity (EA) rates were determined based on the colorimetric determination of p-nitrophenol, released as a reaction product at 400 nm. All EAs were assayed in duplicate with one control, to which the substrate was added after incubation and subtracted from the sample value.

2.4. EL-FAME Microbial Structure

The microbial community structure was determined using the ester-linked fatty acid methyl ester (EL-FAME) analysis method by Schutter and Dick [26]. The (EL)-FAME method follows a four-step process: (1) Saponification and methylation of ester-linked fatty acids by incubating 3 g of soil in 15 mL of 0.2 M KOH in methanol at 37 °C for 1 h. During incubation, the samples were vortexed every 10 min, and 3 mL of 1.0 M acetic acid was added to neutralize the pH of the mixture at the end of incubation. (2) FAMEs were partitioned into an organic phase by adding 10 mL of hexane, followed by centrifugation at 480× g for 10 min. (3) The hexane layer was transferred to a clean glass test tube, whereby the hexane evaporated under a stream of N2. (4) The resulting FAMEs were dissolved in 300 µL of 1:1 hexane:methyl tertbutyl ether containing a 19:0 internal standard (methyl nonadecanoate acid) and transferred to a GC vial for analysis. Following this protocol, the extracted FAMEs were analyzed in an Agilent 7890B GC Series (Wilmington, DE, USA) equipped with a flame ionization detector and a fused silica capillary column (25 m × 0.2 mm) using H2 (ultra-high purity) as the carrier gas. The temperature program was ramped from 170 °C to 250 °C, at 5 °C min−1, as previously reported by Gardner et al. [27]. Fatty acids were identified and quantified by comparing retention times and peak areas to those of MIDI standards (Microbial ID, Inc., Newark, DE, USA). FAME concentrations (nmol g−1 soil) were calculated by comparing peak areas to an analytical standard (19:0, Sigma Chemical Co., St. Louis, MO, USA) calibration curve, which was used to calculate the molar percent (mol %). The FAMEs are described by the number of C atoms, followed by a colon, the number of double bonds, and then by the position of the first double bond from the molecule’s methyl (ω) end. Cis isomers are indicated by c and branched fatty acids by two prefixes, i and a, for iso and anteiso, respectively. Other notations are Me for methyl, OH for hydroxyl, and cy for cyclopropane. Twenty-six fatty acids (FAME) that were consistently present in the samples were used for the data analysis, with fourteen of the twenty-six FAMEs representing different bacterial and fungal biomarkers [28,29,30]. FAMEs with carbon chain lengths of 14 or higher were used to calculate total FAME (nmol g−1 soil) and to estimate the microbial biomass and community structure in plantation soils. Different FAME profile indicators were used to represent saprotrophic fungi (i18:0, 18:1ω5c, 18:1ω6c, 18:1ω7c, 18:1ω9c, 18:2ω6c, 18:3ω6c), arbuscular mycorrhizal fungi (AMF) (16:1ω5c), Gram-positive bacteria (GP) (i14:0, a14:0, i15:0, a15:0, i16:0, a16:0, i17:0, a17:0, i19:0, a19:0), Gram-negative bacteria (GN) (cy17:0, cy19:0), and actinobacteria (10Me16:0, 10Me17:0, 10Me17:1, 10Me18:0, 10Me18:1, 10Me19:1). The total bacteria was calculated based on the abundance of Gram-positive, Gram-negative, and actinomycete biomarkers. The fungal sum was calculated based on the total sum of saprotrophic fungi and AMF biomarkers.

2.5. Statistical Analysis

The R software package was used to perform all statistical analyses (R Core Team, 2019, version 3.6.1). Two-way ANOVA with Fisher’s Least Significant Difference (LSD) Fisher’s LSD pairwise comparisons at p < 0.05 was used to analyze differences between soil composition, tree species, and time of year. Principal component analysis (PCA) was also performed to visualize the most relevant patterns. Pearson correlation analysis was used to determine the relationships between microbial groups (FAME indicators) and environmental factors (soil properties) using the vegan (v2.6−4) community ecology package within R [31]. Structural equation modeling (SEM) aided in analyses of direct and indirect effects of tree species, fungal and bacterial abundance, and soil properties (pH, TOC) on soil ecosystem functions. These analyses were represented by the PC1 axis on the PCA based on the four EAs, using the lavaan software package [32]. The structural equation models’ goodness of fit was evaluated using Chi-square (0 ≤ χ2 ≤ 2 df and 0.05 < p ≤ 1.00) and root mean square error of approximation (0 ≤ RMSEA ≤ 0.05 and 0.10 < p ≤ 1.00) [33].

3. Results

3.1. Soil Physicochemical Properties

Total organic carbon (TOC) and total carbon (TC) displayed significant differences between tree species during the summer for both depths evaluated (p < 0.05), with BW being greater than RO (Table 1). Seasonal variation in TOC and TC significantly differed at 0–10 cm (TOC: p = 0.033; TC: p = 0.047) and was higher during the summer. Significant seasonal differences in total nitrogen (TN) were detected in soils collected at 10–20 cm (p = 0.037), with BW values being higher than RO during summer and autumn for both depths (Table 1). The C:N ratios showed no significant differences seasonally or for tree species. Significant seasonal variations in soil moisture were observed at both depths (0–10: p = 0.0079; 10–20: p = 9 × 10⁻⁵) and were higher during winter (Table 1). Despite a lack of significant differences between tree species, BW displayed higher values than RO and DB at 0–10 cm. For 10–20 cm, RO and BW were only significantly different (p = 0.0235) during spring. Measurements of pH highlighted significant differences at both depths between BW and RO but uncovered significant interactions between tree species and seasonal effects. During spring and autumn, the soil pH under RO became more acidic at both depths.

3.2. Soil Microbial Community Structure Based on FAME Analysis

When measured using microbial biomass, total FAME biomass, total fungi, and total bacteria exposed significant differences between treatments (p < 0.05) for both soil depths (Table 2). The only exception was total fungi, which did not significantly differ at 0–10 cm (p > 0.05). Generally, the amount of biomass increased in soils under BW compared to DB, whereas decreased biomass was detected in soils under RO over time. Gram-positive (GP) bacteria and actinomycete quantity and composition significantly differed for BW and RO at both depths, while Gram-negative bacteria (GN) were not significantly different.
Saprotrophic fungi did not appear to be influenced by tree species, though there were significant differences in AMF between treatments (p = 0.001) (Table 2).
FAMEs measured under BW and DB were lowest during the winter (p < 0.05), while no seasonal changes occurred under RO (p > 0.05) (Table 2). In contrast, total bacteria at 0–10 cm and total fungi at both depths varied seasonally (p < 0.05). The lowest concentrations of bacterial indicators were detected during winter, and for fungi, during spring. The highest concentration of FAMEs was measured in the 0–10 cm soils collected during summer. In 0–10 cm soils, GP, GN, and actinomycetes were significantly different between seasons (p < 0.05). Only GP varied seasonally (p = 0.0173) at the 10–20 cm depth. Saprotrophic fungi did not significantly differ by season or depth. However, AMF varied seasonally at both depths and was lowest in spring (0–10: p = 0.0107; 10–20: p = 0.007). The only seasonal variation for total FAMEs was in soil collected at 10–20 cm (p = 0.027) (Table 2).

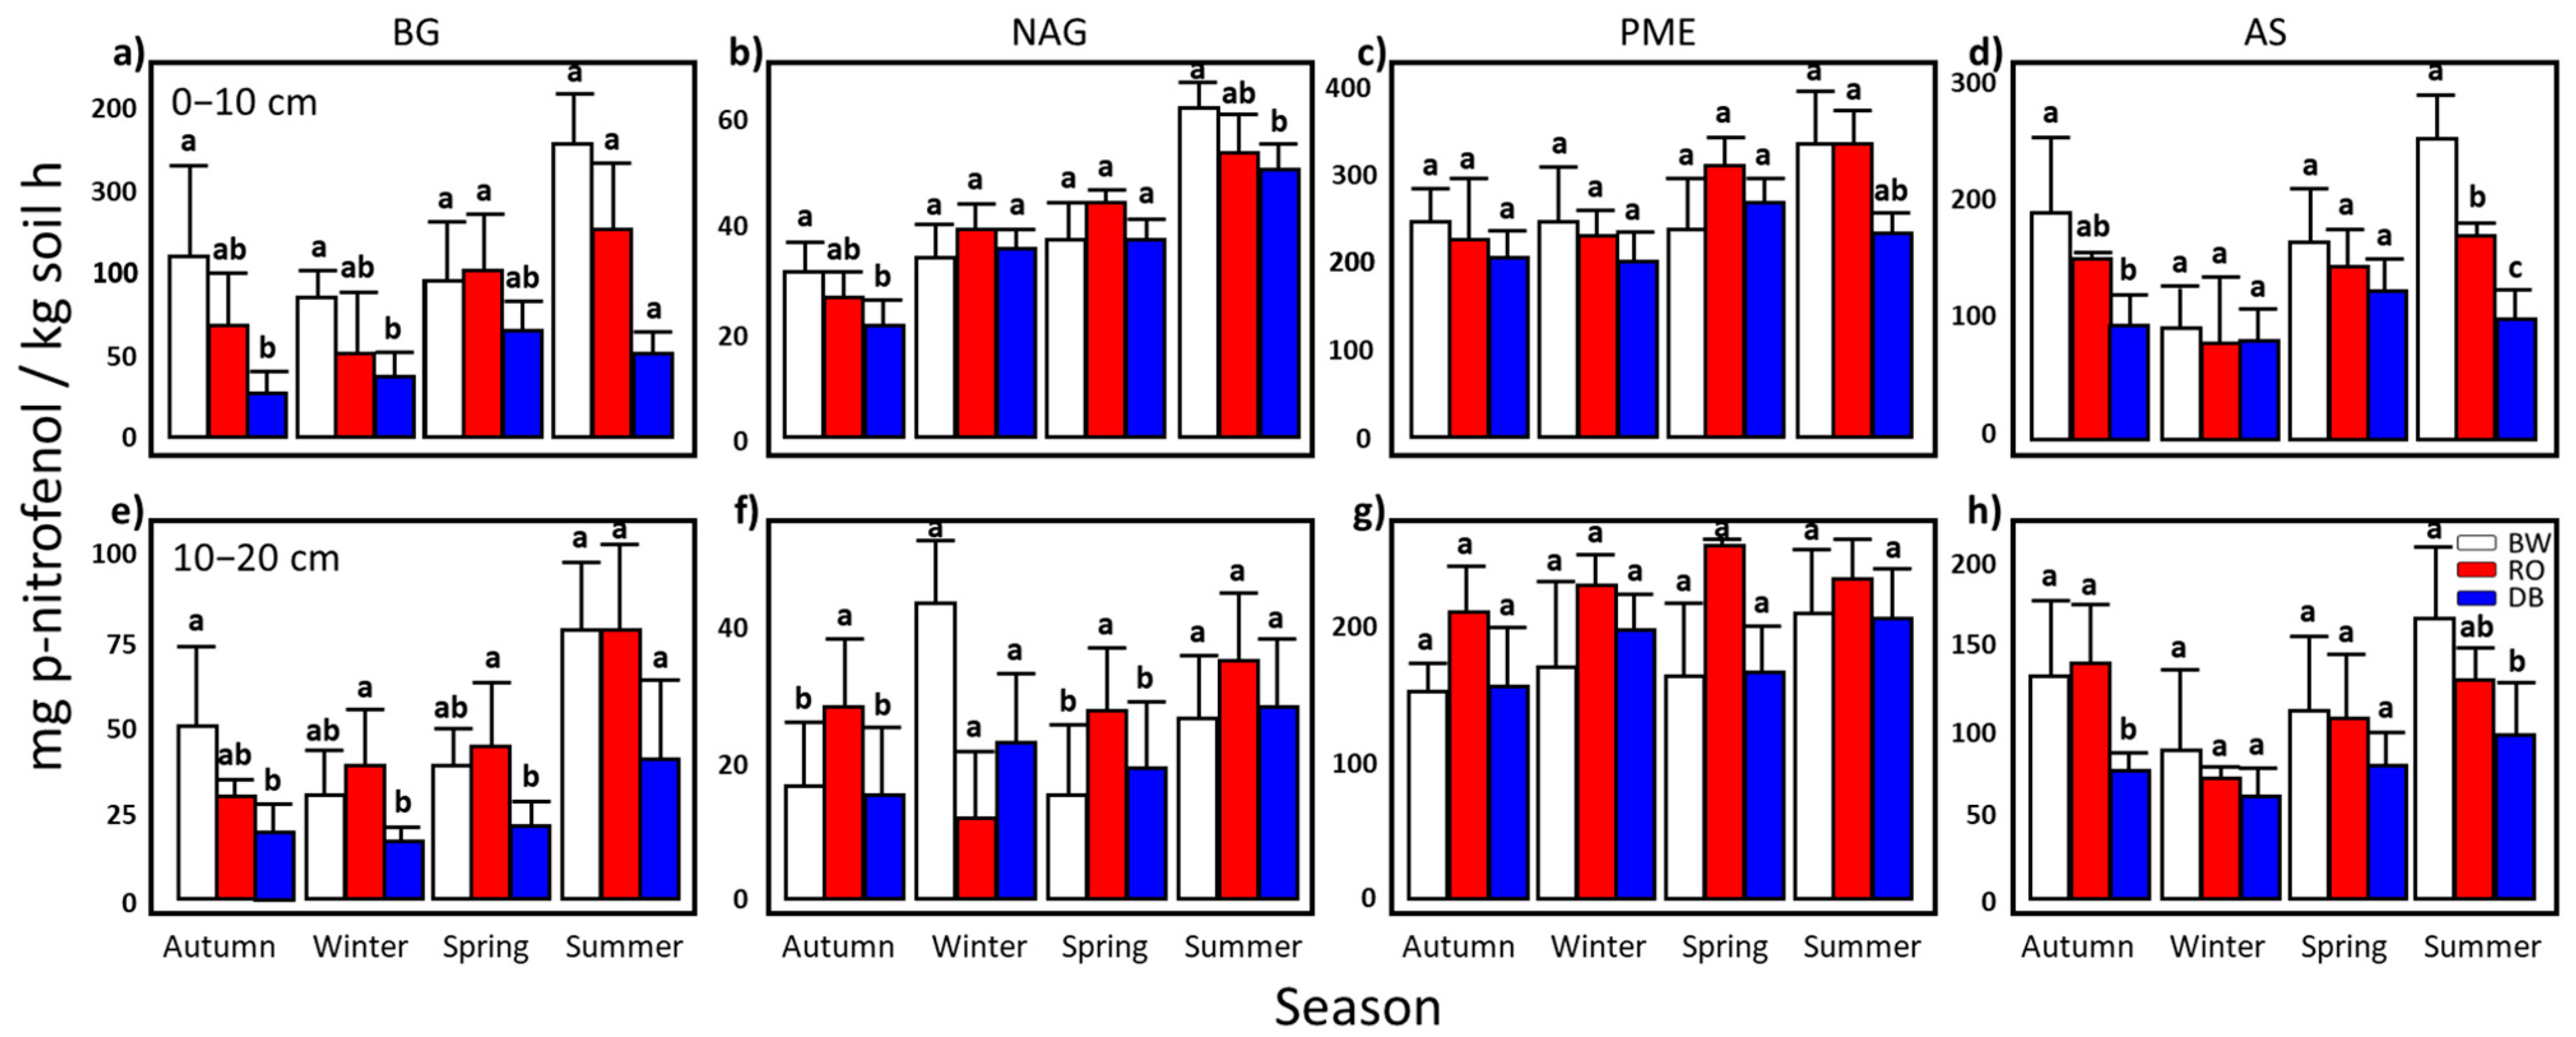
3.3. Soil Biochemical Cycles Measured by Soil Enzyme Activities

Generally, the soil EAs were high in summer and low in winter (Figure 1). The activity of β-glucosidase significantly differed between treatments at both soil depths (p = 0.00025 and p = 0.00621). Compared to the DB samples, β-glucosidase activities increased in soils under BW, and decreased in RO. However, for spring-collected soils, β-glucosidase activity increased for RO and DB, but it did not change for BW in the 0–10 cm samples (Figure 1a). However, a severe decline in β-glucosidase activity was discovered in winter for 10–20 cm BW soils (Figure 1e). The β-glucosaminidase activity varied seasonally in upper soil depths, with increased activity reported for winter and spring (p = 0.00034). Despite having greater β-glucosaminidase activity values than BW and RO, DB soils were not statistically different at 0–10 cm (Figure 1b). DB soils did significantly differ from soils under BW in autumn and spring at 10–20 cm (Figure 1f). Acid phosphatase activities revealed significant differences between treatments, but only at the 10–20 cm soil depths (p = 0.0256). Soils under both tree species appeared to have decreased acid phosphatase activities in the 10−20 cm soil samples (Figure 1g). The DB showed increased acid phosphatase activities during the winter and the spring, whereas BW did not vary at either depth. Acid phosphatase activity under RO increased during the spring in the 0–10 cm soils (Figure 1c). Arylsulfatase displayed significant differences between treatments at both depths (p = 0.0397; p = 0.025) and seasonally for soils collected at 0–10 cm (p = 0.0078), though activities decreased during winter. RO soils had lower arylsulfatase activity than BW and DB for all seasons (Figure 1d,h). The arylsulfatase activities in RO soils were 86% of BW activity in the 10–20 cm samples, while at 0–10 cm, RO activity was 68% of BW activity for the four enzymes in combination.

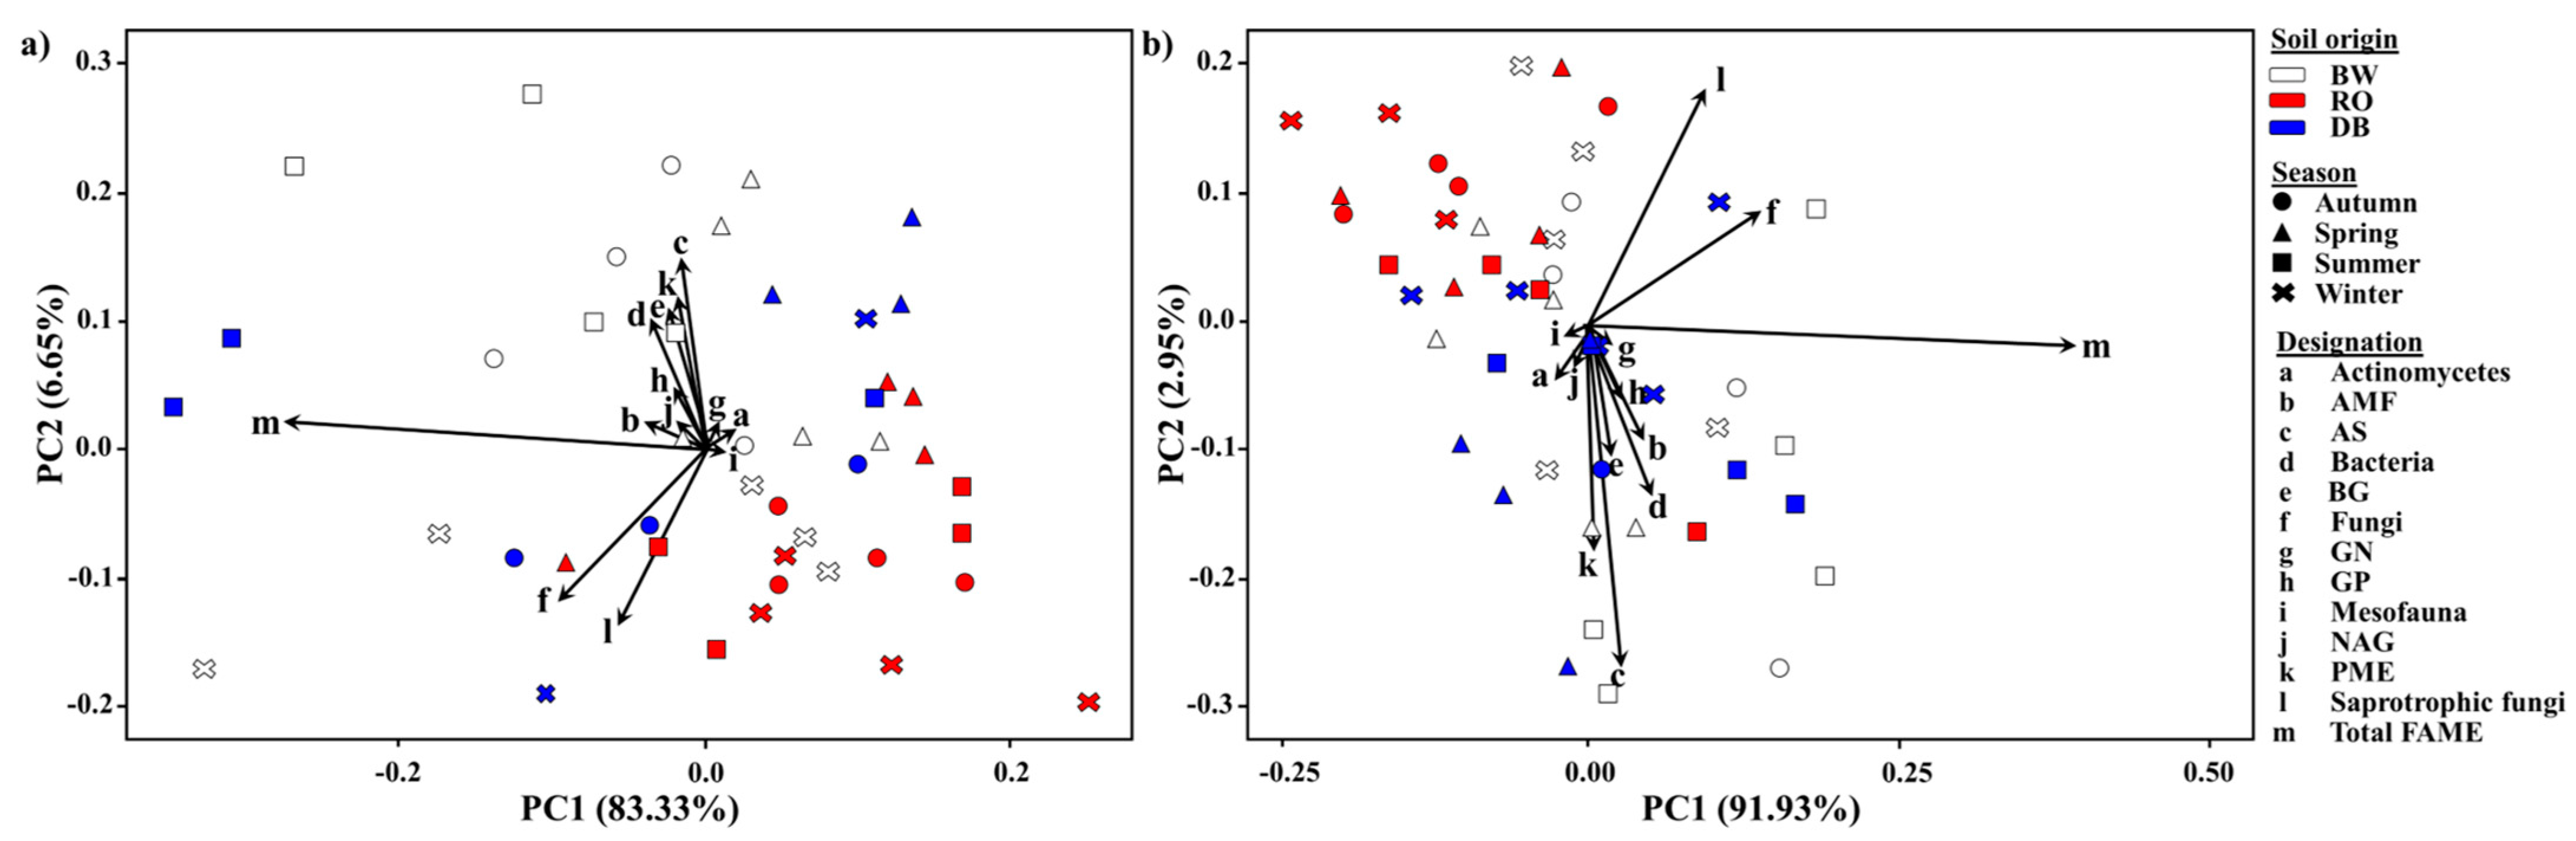
3.4. Principal Component Analysis between Soil Microbial Communities and Soil Enzyme Activities

Principal component analysis (PCA) based on soil microbial community and enzymatic activities illustrated differences between forested and DB soils (Figure 2). PCA revealed that the first two principal components accounted for 94.98% (PC1 88.33%; PC2 6.65%) and 94.77% (PC1 91.93%; PC2 2.85%) for 0–10 and 10–20 cm, respectively, of total variation in microbial community composition and soil function. Samples also clustered by group (BW, RO, DB) (Figure 2a,b). BW was positively correlated with PC1 and clustered in the autumn-, spring-, and winter-dominated upper quadrant of the plot for 0–10 cm soil. RO samples were negatively correlated with PC1 scores with autumn, spring, and winter communities clustered densely on the lower left-hand side of the plot, clearly distinct from BW. The lack of similarity between BW and RO samples suggests both soils have unique microbial community compositions. However, DB showed positive and negative correlations with the PC1 scores. PCA distributed the DB samples between tree types, varied by season, and plotted near-center. These close associations suggest a diverse community composition that shares similarities with BW and RO. The most robust variable, total FAMEs, was positively correlated with PC1 scores, so there is one long arrow on the right-hand side of the plot. Most EAs, FAMEs (bacteria), and physiochemical parameters positively correlated with the PC1 scores, so several arrows extend upward from the center of the plot. Arrows representing saprotrophic and AMF extend opposite bacteria to the right-hand side of the plot (Figure 2). Multivariate plot results indicated that tree species and season significantly modified the microbial communities.

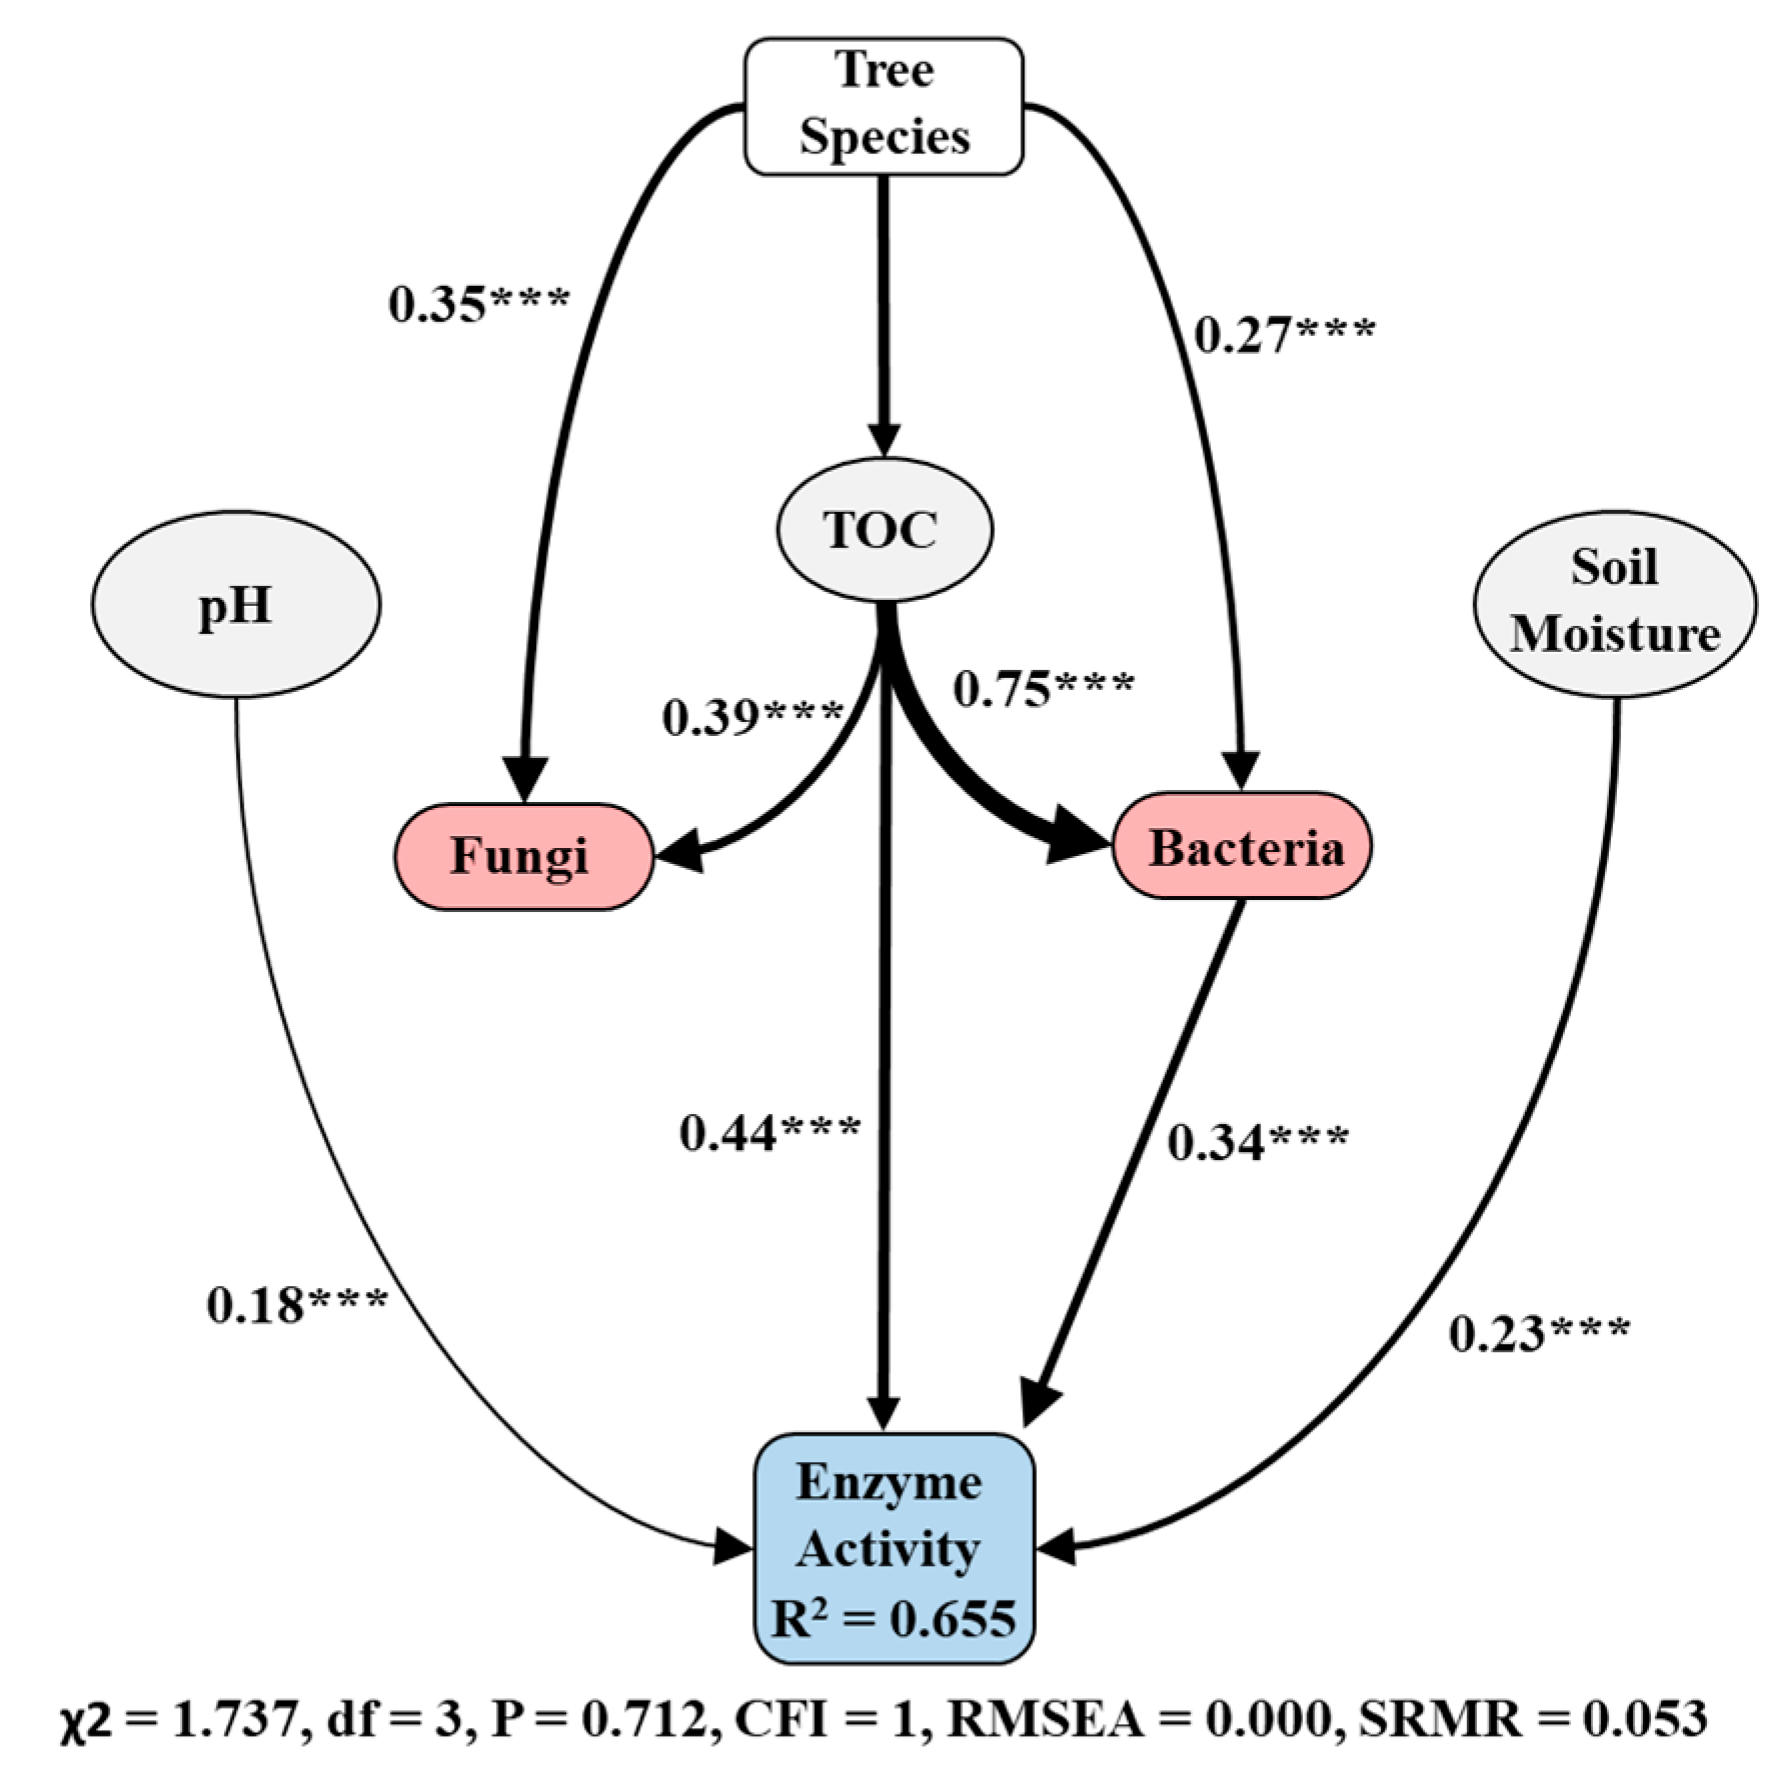
3.5. Association between Soil Microbial Community and Soil Chemical and Ecosystem Functions

Pearson correlation analyses and structural equation modeling were implemented to investigate the relationship between the soil microbial community structure and chemical and biochemical data. The Pearson correlation revealed a significant relationship between bacterial indicators (total bacteria, GP, GN, and actinomycetes) and TOC, TC, and TN. β-glucosidase and arylsulfatase correlated with total bacteria, GP, actinomycetes, and AMF (only β-glucosidase), while pH correlated only with AMF and GP. Model soil systems allow for isolation of specific components from other confounding variables (Table 3). We used structural equation modeling (SEM) to determine the degree to which the biotic components (total bacteria, AMF abundance, EAs) mediated the influence of abiotic factors (soil moisture, pH) on C stock (TOC) for BW and RO. The model explained 0.655% of the variability of soil function based on EAs as tree species significantly affected TOC and total bacteria, but not total fungi. Total bacteria was positively directly related to EAs and TOC, and positively influenced total bacteria, fungi, and EAs (Figure 3). Soil moisture and pH also positively influenced EAs, while SEM suggested that the total bacterial community exhibited a greater impact on EAs than the fungal community.

4. Discussion

It is understood that soil organic matter dynamics in forest ecosystems are primarily initiated by microbial-mediated decomposition of plant litter and root exudates [34]. Soil chemical parameters (pH) and seasonal variations, such as soil moisture and temperature [35], contribute to the breakdown. Studies have shown that the soil microbial communities and their functional activities can significantly vary by tree species [36,37] and that variation can also occur seasonally, significantly affecting bacterial abundance [38]. Therefore, a better understanding of the environmental factors affecting microbial communities and soil EA and the influence of tree type is essential. Our work examined the impact of two distinct hardwood tree species on the soil microbial structure and soil function seasonally and for two soil depths.

4.1. Soil C and N Responses to Tree Species

First, we found a significant effect of tree species on C and N stocks. The major changes in soil characteristics mainly induced by plant species may be related to the quantity and quality of their litter supplied to the soil [39,40]. Litter properties, such as N, lignin, and tannin content, are significant determinants of decomposition rates and nutrient cycling in forest soils [6,8]. The content of lignin is an influential component in determining the decomposition rate because it physically protects cellulose and inhibits the activities of cellulolytic enzymes [41]. RO leaves contain high lignin and low N concentrations and are decomposed slower by soil microorganisms than litter produced by BW [42]. Several studies show that the C input by leaf fall in BW was 50% higher than in RO, and the rate of decomposition was 45%–200% faster in BW compared to RO [42,43]. Another factor favoring plant litter decomposition was the soil pH, which was lower in RO soils. The pH range of 5.5–6.5 is optimal for plant growth as the availability of nutrients is typically optimal. In this range, plants grow well and produce more root exudates as a carbon source for microbial proliferation [44]. Several authors have shown that soil pH regulates fungal and bacterial abundance in soil [45,46].

4.2. Tree Species Influenced the Soil Microbial Communities and Biogeochemical Cycles

Overall, our results showed that tree species influenced the soil microbial community structure and soil EAs [36]. BW increased the microbial biomass and the functional activities, while RO soils revealed decreases compared to the soil samples without plants. Differences in leaf litter chemistry between species are usually significant enough to discern the effects of tree species on microbial activity [40,47,48]. The biochemical composition of litter drives the initial stages of degradation. The chemical composition of litter is determined by N-containing compounds and lignin [39], whereas a number of tannins and polyphenols are known to be microbial modulators [49]. Sun et al. [22] reported a significant increase in microbial biomass in rhizospheric soils compared to bulk soil under Manchurian walnut plantations. Other authors observed that RO decreased soil respiration and nutrient availability more than other tree species [23]. Hobbie et al. [50] documented that litter from RO has a higher amount of phenolic compounds and high C/N and C/P ratios. This is consistent with the reports that RO tannins may favor the formation of recalcitrant complexes with proteins, forming a less active humus form, affecting both C and N cycling [51]. RO significantly reduces the herb cover compared to other plant species [52]. Different cover plants support a more diverse and active microbial community because herb plants produce more degradable litter than hardwood trees [53].
Recalcitrant plant litter may be related to a decrease in the rate of element cycling, modifying nutrient availability in soil, and having a predominant effect on the soil surface layer [6,54]. Plant production of organic substrates most often limits soil microbial growth. For example, slow-decomposing white oak (Quercus alba L.) leaf litter contains relatively high quantities of lignin compared with the sugar maple leaf litter, which rapidly decomposes [55]. In contrast, labile C exudates predominantly affect the soil subsurface layer. The exudates provide an easily degradable C energy source to rhizosphere microbes. The microbes then release extracellular enzymes to liberate nutrients from SOM [56]. Ectomycorrhizal fungi (ECM) are known to synthesize many different hydrolytic and oxidative enzymes to degrade SOM [57], whereas arbuscular mycorrhizal fungi (AM) only produce a narrow range of hydrolytic and oxidative enzymes [58]. The soil microbial communities promoted by AM- and ECM-associated trees are different [57,59] and have different functional traits [60]. Yin et al. [61] showed that fine roots of ECM tree species, such as RO, release nearly three-fold more exudates into the soil than the roots of AM trees (BW here). These two contrasting mechanisms on the soil surface and in the subsurface corroborate due to the differences in EA between BW and RO, with the more minor differences between the plants at 10–20 cm soil depths. The distribution of fungi in the soil also varied with soil depth. Free-living saprotrophic fungi dominated the upper leaf litter-rich soil layer, and the arbuscular mycorrhizal fungi dominated the underlying soil horizons [62]. It is impossible to distinguish whether and how C or secretion affected these mycorrhizas in the present study, making this an essential avenue for future research.

4.3. Heterogeneous Seasonal Variation in Soil Microbial Communities and Biogeochemical Cycles

Several works have documented the relationship between seasonal changes and microbial community structure based on fatty acid profiling [37,63,64]. In our results, fungal and bacterial community compositions differed seasonally. Pietikäinen et al. [65] showed that temperature differently affected fungal and bacterial communities. Seasonal differences in plant litter abundance and exudation rates among forests drive specific properties, such as nutrient availability [66]. Forest soil has a high abundance of fungal biomass and a high C:N ratio during the cold seasons, which is frequently associated with more significant amounts of leaf litter [67]. Soil fungal communities can gradually shift the proportion of AM and saprotrophic fungi indirectly with the seasons. In an earlier study, Söderström [68] reported a seasonal decrease in AMF assemblages due to lower secretion of rhizodeposition during the winter. However, reports also indicate that no reduction of saprotrophic fungi assemblages occurred due to their ability to degrade the hardwood leaf litter more readily [64]. AMF and saprotrophic fungi play different yet independent roles in SOM dynamics [69]. Additionally, the saprotrophic fungi’s ability to degrade the leaf litter, which is greater during the winter, differentiates fungi from bacterial communities. On the other hand, total bacterial groups (GP, GN, and actinomycetes) are sensitive to temperature fluxes and adapt more quickly to seasonal changes [43].
Soil extracellular EAs and soil microbial biomass tend to decrease during the winter when the temperature is low and higher during warmer periods. All the enzymes have a significant seasonal variation (p < 0.05). Previous studies showed that the pools of enzymes, such as phosphomonoesterase- and nitrogen-related enzymes, in hardwood forest soil varied seasonally, with maximum activities occurring between March and August [70,71]. The EA for soils under BW were highest during the summer, while RO soils were most active in spring. The EA decrease in RO during the summer can be due to a decrease in the soil moisture content. In RO soils, moderate droughts have contributed to significant decreases in urease, protease, β-glucosidase, and acid phosphatase pools [72]. Our results showed a significant correlation between soil moisture and soil EA, which corroborates other reports that identified soil moisture as a key influencing factor in the activities of enzyme pools [72,73,74].

4.4. Linking among Ecosystem Components

The link between microbial community composition and soil characteristics, such as biogeochemical C and N cycles, has been previously investigated [37,48]. Abiotic factors are important determinants of soil microbial communities. Bacteria strongly correlate with nutrient cycling (β-glucosidase and arylsulfatase) and C and N availability (TOC, TC, and TN). Reports suggest that the proportions of GP, GN, and actinobacteria are positively correlated with C and N content [36] and are typically more abundant in rich soil with high C [75]. SEM was utilized to gain an ecosystem-level understanding of the most critical environmental abiotic and biotic factors that control soil functions based on EAs (Figure 3).
Moreover, factors affecting soil microbial abundance may also directly or indirectly impact microbial function. Soil EAs positively correlate with TOC and total bacterial abundance, but not with total fungi. Tree species indirectly impact soil function based on EAs. EAs, in turn, influence the amount of TOC and soil bacteria abundance. As tree species do not directly affect EAs, there is no linkage to root exudates [66]. C stocks are driven by plant litter volume, chemical composition, and rhizodeposition exudates [39,47]. Environmental factors (soil moisture and pH) were directly related to soil enzyme activity. The direct effect of soil moisture on enzyme activity has been documented [76], but the mechanisms linking this property to EAs are unknown. A higher soil moisture can increase extracellular enzymes and substrate diffusion, facilitating the reaction [77]. EAs are firmly controlled by pH because it influences enzyme and substrate conformation and its adsorption on a solid surface [78].
Our study revealed the complex controls of soil C dynamics by various above- and below-ground processes and their interactive effects. Tree species and TOC in soils strongly influence soil microbial community composition. Soil bacterial communities rapidly respond when decomposable C compounds such as sugars, organics, and amino acids are available and linked with the extracellular enzymes involved in the carbon cycling measured in this study. It is essential to acknowledge that β-glucosidase enzymes complete the final hydrolysis step by converting cellobiose to glucose during SOM decomposition [79]. Fungi are vital in decomposing recalcitrant organic matter (wood components cellulose and lignin) [80]. Complex interactions among tree species, environmental factors, and soil physicochemical properties affect C dynamics via microbial regulations in hardwood forests.

5. Conclusions

These results indicate that soil nutrient cycling status and microbial community composition can fluctuate in response to season and tree species. The TOC, TC, and TN content increased with BW, but did not change with RO. Differences in tree species led to an altered microbial community composition, with C and N patterns showing a similar trend. The revealed shifts in biological properties, specifically microbial communities and EAs, highlight the variability by which BW and RO trees alter soil biology and, consequently, soil ecosystem functions. Here, we evaluated how microbial abundance and soil functions vary across different seasons during a whole year. This is the first step to understanding how walnut production can be improved, considering the properties and functions of the soil. Adopting higher-resolution molecular-based techniques, such as metagenomic DNA or RNA analyses, to study the impact of tree species on microbial communities is needed. Characterizing microbial assemblages at the species level of taxonomy will further help to understand the microbial community structure, diversity, and functionality in hardwood forests.

Supplementary Materials

The following supporting information can be downloaded at: https://www.mdpi.com/article/10.3390/f14050859/s1, Figure S1: Black walnut and red oak forest plantation research site in Lower Michigan. Figure S2: Annual temperatures and precipitation in Lower Michigan.

Author Contributions

Conceptualization, T.G.G. and S.S.L.; data curation, S.S.L.; formal analysis, J.P.F. and S.S.L.; funding acquisition, T.G.G., S.S.L., and R.H.C.; investigation, J.P.F., N.D.L.S., and J.H.; methodology, T.G.G. and J.P.F.; project administration, T.G.G.; resources, T.G.G., S.S.L., and R.H.C.; software, J.P.F. and S.S.L.; supervision, T.G.G., S.S.L., and R.H.C.; visualization, T.G.G., J.P.F., and S.S.L.; writing—original draft, J.P.F. and T.G.G.; writing—review and editing, T.G.G., J.P.F., S.S.L., and J.H. All authors have read and agreed to the published version of the manuscript.

Funding

This research is supported by the Soil and Environmental Microbial Ecology Group (SEMEG), Department of Crop & Soil Sciences, NC State University, Department of Biology, Morehouse College, the Hardwood Tree Improvement and Regeneration Center (HTIRC), Department of Forestry and Natural Resources, Purdue University, and a Joint Research Venture Agreement with the USDA Forest Service Northern Research Station. Award No. 1036600.

Acknowledgments

We appreciate the support from the USDA Forest Service Northern Research Station for Fieldworks. We acknowledge all the staff of the laboratory for the useful advice and the technical assistance. We would also like to thank Zachary Senwo at Alabama A&M University and Veronica Acosta-Martinez of the USDA Agricultural Research Service for their helpful advice on the experimental design.

Conflicts of Interest

The authors declare no conflict of interest. The founding sponsors had no role in the design of the study; in the collection, analyses, or interpretation of data; in the writing of the manuscript, or in the decision to publish the results.

References

  1. Ehring, A.; Keller, O. The black walnut tree (Juglans nigra), valuable but with high demands. Wald Holz 2010, 91, 25–28. (In German) [Google Scholar]
  2. Nicolescu, V.N.; Hernea, C.; Bakti, B.; Keserű, Z.; Antal, B.; Rédei, K. Black locust (Robinia pseudoacacia L.) as a multi-purpose tree species in Hungary and Romania, a review. J. For. Res. 2018, 29, 1449–1463. [Google Scholar] [CrossRef]
  3. Dyderski, M.K.; Chmura, D.; Dylewski, Ł.; Horodecki, P.; Jagodziński, A.M.; Pietras, M.; Woziwoda, B. Biological flora of the British Isles, Quercus rubra. J. Ecol. 2020, 108, 1199–1225. [Google Scholar] [CrossRef]
  4. Nicolescu, V.N.; Rédei, K.; Vor, T.; Bastien, J.C.; Brus, R.; Benčať, T.; Štefančik, I. A review of black walnut (Juglans nigra L.) ecology and management in Europe. Trees 2020, 34, 1087–1112. [Google Scholar] [CrossRef]
  5. Knight, K.S.; Oleksyn, J.; Jagodziński, A.M.; Reich, P.B.; Kasprowicz, M. Overstorey tree species regulate colonization by native and exotic plants, a source of positive relationships between understorey diversity and invisibility. Divers. Distrib. 2008, 14, 666–675. [Google Scholar] [CrossRef]
  6. Dobrylovská, D. Litter decomposition of red oak, larch and lime tree and its effect on selected soil characteristics. J. For. Sci. 2001, 47, 477–485. [Google Scholar]
  7. Horodecki, P.; Jagodziński, A.M. Tree species effects on litter decomposition in pure stands on afforested post-mining sites. For. Ecol. Manag. 2017, 406, 1–11. [Google Scholar] [CrossRef]
  8. Reich, P.B.; Oleksyn, J.; Modrzynski, J.; Mrozinski, P.; Hobbie, S.E.; Eissenstat, D.M.; Chorover, J.; Chadwick, O.A.; Hale, C.M.; Tjoelker, M.G. Linking litter calcium, earthworms and soil properties, a common garden test with 14 tree species. Ecol. Lett. 2005, 8, 811–818. [Google Scholar] [CrossRef]
  9. Jacobs, D.F.; Davis, A.S. Genetic considerations in the operational production of hardwood nursery stock in the eastern USA. Nativ. Plants J. 2005, 6, 4–13. [Google Scholar] [CrossRef]
  10. Jacoby, R.; Peukert, M.; Succurro, A.; Koprivova, A.; Kopriva, S. The role of soil microorganisms in plant mineral nutrition—Current knowledge and future directions. Front. Plant Sci. 2017, 8, 1617. [Google Scholar] [CrossRef]
  11. Schimel, J.; Balser, T.C.; Wallenstein, M. Microbial stress-response physiology and its implications for ecosystem function. Ecology 2007, 88, 1386–1394. [Google Scholar] [CrossRef]
  12. Uroz, S.; Buee, M.; Deveau, A.; Mieszkin, S.; Martin, F. Ecology of the forest microbiome, highlights of temperate and boreal ecosystems. Soil Biol. Biochem. 2016, 103, 471–488. [Google Scholar] [CrossRef]
  13. Nemergut, D.R.; Shade, A.; Violle, C. When, where and how does microbial community composition matter? Front. Microbiol. 2014, 5, 497. [Google Scholar] [CrossRef]
  14. Zak, D.R.; Holmes, W.E.; White, D.C.; Peacock, A.D.; Tilman, D. Plant diversity, soil microbial communities, and ecosystem function, are there any links? Ecology 2003, 84, 2042–2050. [Google Scholar] [CrossRef]
  15. Lladó, S.; López-Mondéjar, R.; Baldrian, P. Drivers of microbial community structure in forest soils. Appl. Microbiol. Biotechnol. 2018, 102, 4331–4338. [Google Scholar] [CrossRef] [PubMed]
  16. Thoms, C.; Gattinger, A.; Jacob, M.; Thomas, F.M.; Gleixner, G. Direct and indirect effects of tree diversity drive soil microbial diversity in temperate deciduous forest. Soil Biol. Biochem. 2010, 42, 1558–1565. [Google Scholar] [CrossRef]
  17. Smith, J.M.; Paritsis, J.; Veblen, T.T.; Chapman, T.B. Permanent forest plots show accelerating tree mortality in subalpine forests of the Colorado Front Range from 1982 to 2013. For. Ecol. Manag. 2015, 341, 8–17. [Google Scholar] [CrossRef]
  18. Landesman, W.J.; Freedman, Z.B.; Nelson, D.M. Seasonal, sub-seasonal and diurnal variation of soil bacterial community composition in a temperate deciduous forest. FEMS Microbiol. Ecol. 2019, 95, fiz002. [Google Scholar] [CrossRef]
  19. López-Mondéjar, R.; Voříšková, J.; Větrovský, T.; Baldrian, P. The bacterial community inhabiting temperate deciduous forests is vertically stratified and undergoes seasonal dynamics. Soil Biol. Biochem. 2015, 87, 43–50. [Google Scholar] [CrossRef]
  20. Koranda, M.; Kaiser, C.; Fuchslueger, L.; Kitzler, B.; Sessitsch, A.; Zechmeister-Boltenstern, S.; Richter, A. Seasonal variation in functional properties of microbial communities in beech forest soil. Soil Biol. Biochem. 2013, 60, 95–104. [Google Scholar] [CrossRef]
  21. Ma, W.; Yang, Z.; Liang, L.; Ma, Q.; Wang, G.; Zhao, T. Seasonal Changes in Soil Microbial Community and Co-Occurrence Network of Species of the Genus Corylus. Microorganisms 2021, 9, 2228. [Google Scholar] [CrossRef] [PubMed]
  22. Sun, Y.; Yang, L.; Wang, Z.; Fan, J. Temporal variations in soil juglone and soil microbial community structure under Manchurian walnut (Juglans mandshurica Maxim.) plantations. Allelopath. J. 2013, 31, 169–180. [Google Scholar]
  23. Talbot, J.M.; Finzi, A.C. Differential effects of sugar maple, red oak, and hemlock tannins on carbon and nitrogen cycling in temperate forest soils. Oecologia 2008, 155, 583–592. [Google Scholar] [CrossRef]
  24. Tabatabai, M.A. Soil enzymes. In Methods of Soil Analysis, Part 2. Microbiological and Biochemical Properties; SSSA Book Series; Bottomley, P.S., Angle, J.S., Weaver, R.W., Eds.; Soil Science Society of America: Madison, WI, USA, 1994; pp. 775–833. [Google Scholar]
  25. Parham, J.A.; Deng, S.P. Detection, quantification and characterization of β-glucosaminidase activity in soil. Soil Biol. Biochem. 2000, 32, 1183–1190. [Google Scholar] [CrossRef]
  26. Schutter, M.E.; Dick, R.P. Comparison of fatty acid methyl ester (FAME) methods for characterizing microbial communities. Soil Sci. Soc. Am. J. 2000, 64, 1659–1668. [Google Scholar] [CrossRef]
  27. Gardner, T.; Acosta-Martinez, V.; Senwo, Z.; Dowd, S.E. Soil Rhizosphere Microbial Communities and Enzyme Activities under Organic Farming in Alabama. Diversity 2011, 3, 308–328. [Google Scholar] [CrossRef]
  28. Zelles, L. Fatty Acid Patterns of Microbial Phospholipids and Lipopolysaccharides. In Methods in Soil Biology; Schinner, F., Öhlinger, R., Kandeler, E., Margesin, R., Eds.; Springer: Berlin/Heidelberg, Germany, 1996; pp. 80–93. [Google Scholar]
  29. Zelles, L. Phospholipid fatty acid profiles in selected members of soil microbial communities. Chemosphere 1997, 35, 275–294. [Google Scholar] [CrossRef]
  30. Zelles, L. Fatty acid patterns of microbial phospholipids and lipopolysaccharides in the characterization of microbial communities in soil: A review. Biol. Fertil. Soils 1999, 29, 111–129. [Google Scholar] [CrossRef]
  31. Oksanen, F.G.B.; Kindt, R.; Legendre, P.; Minchin, P.R.; O’Hara, R.B.; Simpson, G.L.; Solymos, P.; Henry, M.; Stevens, H.; Wagner, H. Vegan: Community Ecology Package. R Package Version 2.3-0; 2015; Available online: https://www.researchgate.net/publication/311493644_Vegan_commity_ecology_package_R_package_version_23-0 (accessed on 24 July 2021).
  32. Rosseel, Y. Lavaan: An R Package for Structural Equation Modeling. J. Stat. Softw. 2012, 48, 1–36. Available online: http://www.jstatsoft.org/v48/i02/ (accessed on 24 July 2021). [CrossRef]
  33. Delgado-Baquerizo, M.; Maestre, F.T.; Reich, P.B.; Jeffries, T.C.; Gaitan, J.J.; Encinar, D.; Berdugo, M.; Campbell, C.D.; Singh, B. Microbial diversity drives multifunctionality in terrestrial ecosystems. Nat. Commun. 2016, 7, 10541. [Google Scholar] [CrossRef]
  34. You, Y.; Wang, J.; Huang, X.; Tang, Z.; Liu, S.; Sun, O. Relating microbial community structure to functioning in forest soil organic carbon transformation and turnover. Ecol. Evol. 2014, 4, 633–647. [Google Scholar] [CrossRef] [PubMed]
  35. Mitchell, R.J.; Hester, A.J.; Campbell, C.D.; Chapman, S.J.; Cameron, C.M.; Hewison, R.L. Is vegetation composition or soil chemistry the best predictor of the soil microbial community? Plant Soil 2010, 333, 417–430. [Google Scholar] [CrossRef]
  36. Garau, G.; Morillas, L.; Robles, J.; Castaldi, P.; Mangia, N.P.; Spano, D.; Mereu, S. Effect of monospecific and mixed Mediterranean tree plantations on soil microbial community and biochemical functioning. Appl. Soil Ecol. 2019, 140, 78–88. [Google Scholar] [CrossRef]
  37. Wu, Y.T.; Gutknecht, J.; Nadrowski, K.; Geißler, C.; Kühn, P.; Scholten, T.; Both, S.; Erfmeier, A.; Böhnke, M.; Bruelheide, H.; et al. Relationships between soil microorganisms, plant communities and soil characteristics in Chinese subtropical forests. Ecosystems 2012, 15, 624–636. [Google Scholar] [CrossRef]
  38. Chemidlin Prevost-Boure, N.; Maron, P.A.; Ranjard, L.; Nowak, V.; Dufrene, E.; Damesin, C.; Soudani, K.; Lata, J.-C. Seasonal dynamics of the bacterial community in forest soils under different quantities of leaf litter. Appl. Soil Ecol. 2011, 47, 14–23. [Google Scholar] [CrossRef]
  39. Kögel-Knabner, I. The macromolecular organic composition of plant and microbial residues as inputs to soil organic matter. Soil Biol. Biochem. 2002, 34, 139–162. [Google Scholar] [CrossRef]
  40. Schimel, J.P.; VanCleve, K.; Cates, R.G.; Clausen, T.P.; Reichardt, P.B. Effects of balsam poplar (Populus balsamifera) tannins and low molecular weight phenolics on microbial activity in taiga floodplain soil: Implications for changes in N cycling during succession. Can. J. Bot. 1996, 74, 84–90. [Google Scholar] [CrossRef]
  41. Schroth, G. Decomposition and nutrient supply from biomass. In Trees, Crops and Soil Fertility: Concepts and Research Methods; Schroth, G., Sinclair, F.L., Eds.; CAB International: Wallingford, UK, 2003; pp. 131–150. [Google Scholar]
  42. Fox, J.C.; Yosi, C.K.; Nimiago, P.; Oavika, F.; Pokana, J.N.; Lavong, K.; Keenan, R.J. Assessment of Aboveground Carbon in Primary and Selectively Harvested Tropical Forest in Papua New Guinea. Biotropica 2010, 42, 410–419. [Google Scholar] [CrossRef]
  43. Witherspoon, A.; Thevathasan, N.V.; Gordon, A.M.; Voroney, R.P. Carbon sequestration potential of five tree species in a 25-year-old temperate tree-based intercropping system in southern Ontario, Canada. Agrofor. Syst. 2014, 88, 631–643. [Google Scholar] [CrossRef]
  44. Mungai, N.W.; Motavalli, P.P. Litter quality effects on soil carbon and nitrogen dynamics in temperate alley cropping systems. Appl. Soil Ecol. 2006, 31, 32–42. [Google Scholar] [CrossRef]
  45. Rousk, J.; Frey, S.D.; Bååth, E. Temperature adaptation of bacterial communities in experimentally warmed forest soils. Glob. Chang. Biol. 2012, 18, 3252–3258. [Google Scholar] [CrossRef]
  46. Rousk, J.; Bååth, E. Groth of saprotrophic fungi and bacteria in soil. FEMS Microbiol. Ecol. 2011, 78, 17–30. [Google Scholar] [CrossRef]
  47. Bauhus, J.; Pare, D.; Cote, L. Effects of tree species, stand age and soil type on soil microbial biomass and its activity in a southern boreal forest. Soil Biol. Biochem. 1998, 30, 1077–1089. [Google Scholar] [CrossRef]
  48. Finzi, A.C.; Van Breemen, N.; Canham, C.D. Canopy tree–soil interactions within temperate forests: Species effects on soil carbon and nitrogen. Ecol. Appl. 1998, 8, 440–446. [Google Scholar]
  49. Kraus, T.E.C.; Dahlgren, R.A.; Zasoski, R.J. Tannins in nutrient dynamics of forest ecosystems—A review. Plant Soil 2003, 256, 41–66. [Google Scholar] [CrossRef]
  50. Hobbie, S.E.; Reich, P.B.; Oleksyn, J.; Ogdahl, M.; Zytkowiak, R.; Hale, C.; Karolewski, P. Tree species effects on decomposition and forest floor dynamics in a common garden. Ecology 2006, 87, 2288–2297. [Google Scholar] [CrossRef] [PubMed]
  51. Gentili, R.; Ferre, C.; Carderelli, E.; Montagnani, C.; Bogliani, G.; Citterio, S.; Comolli, R. Comparing negative impacts of Prunus serotina, Quercus rubra and Robinia pseudoacacia on native forest ecosystems. Forest 2019, 10, 842. [Google Scholar] [CrossRef]
  52. Stanek, M.; Stefanowicz, A.M. Invasive Quercus rubra negatively affected soil microbial communities relative to native Quercus robur in a semi-natural forest. Sci. Total Environ. 2019, 696, 133977. [Google Scholar] [CrossRef]
  53. Lucas-Borja, M.E.; Bastida, F.; Nicolás, C.; Moreno, J.L.; del Cerro, A.; Andrés, M. Influence of forest cover and herbaceous vegetation on the microbiological and biochemical properties of soil under Mediterranean humid climate. Eur. J. Soil Biol. 2010, 46, 273–279. [Google Scholar] [CrossRef]
  54. Mincheva, T.; Barni, E.; Varese, G.C.; Brusa, G.; Cerabolini, B.; Siniscalco, C. Litter quality, decomposition rates and saprotrophic mycoflora in Fallopia japonica (Houtt.) Ronse Decraene and in adjacent native grassland vegetation. Acta Oecolog. 2014, 54, 29–35. [Google Scholar] [CrossRef]
  55. Berg, B.; Johansson, M.B.; Anta, R.C.D.; Escudero, A.; Gärdenäs, A.; Laskowski, R.; Santo, A.V.D. The chemical composition of newly shed needle litter of Scots pine and some other pine species in a climatic transect. X Long-term decomposition in a Scots pine forest. Can. J. Bot. 1995, 73, 1423–1435. [Google Scholar] [CrossRef]
  56. Kuzyakov, Y. Priming effects: Interactions between living and dead organic matter. Soil Biol. Biochem. 2010, 42, 1363–1371. [Google Scholar] [CrossRef]
  57. Cheeke, T.E.; Phillips, R.P.; Brzostek, E.R.; Rosling, A.; Bever, J.D.; Fransson, P. Dominant mycorrhizal association of trees alters carbon and nutrient cycling by selecting for microbial groups with distinct enzyme function. New Phytol. 2017, 214, 432–442. [Google Scholar] [CrossRef] [PubMed]
  58. Veresoglou, S.D.; Chen, B.D.; Rillig, M.C. Arbuscular mycorrhiza and soil nitrogen cycling. Soil Biol. Biochem. 2012, 46, 53–62. [Google Scholar] [CrossRef]
  59. Carteron, A.; Beiges, M.; Joly, S.; Turner, B.L.; Laliberte, E. Temperate forests dominated by Arbuscular or Ectomycorrhizal fungi are characterized by strong shifts from saprotrophic to Mycorrhizal fungi with increasing soil depth. Microb. Ecol. 2020, 82, 377–390. [Google Scholar] [CrossRef] [PubMed]
  60. Averill, C.; Cates, L.L.; Dietze, M.C.; Bhatnagar, J.M. Spatial vs. temporal controls over soil fungal community similarity at continental and global scales. ISME J. 2019, 13, 2082–2093. [Google Scholar] [CrossRef] [PubMed]
  61. Yin, H.; Wheeler, E.; Phillips, R. Root-induced changes in nutrient in forest depend on exudation rates. Soil Biol. Biochem. 2014, 78, 213–321. [Google Scholar] [CrossRef]
  62. McGuire, K.L.; Allison, S.D.; Fierer, N.; Treseder, K.K. Ectomycorrhizal-Dominated Boreal and Tropical Forests Have Distinct Fungal Communities, but Analogous Spatial Patterns across Soil Horizons. PLoS ONE 2013, 8, e68278. [Google Scholar] [CrossRef]
  63. Yokobe, T.; Hyodo, F.; Tokuchi, N. Seasonal effects on microbial community structure and nitrogen dynamics in temperate forest soil. Forest 2018, 9, 153. [Google Scholar] [CrossRef]
  64. Voříšková, J.; Brabcova, V.; Cajthaml, T.; Baldrian, P. Seasonal dynamics of fungal communities in a temperate oak forest soil. New Phytol. 2014, 201, 269–278. [Google Scholar] [CrossRef]
  65. Pietikäinen, J.; Pettersson, M.; Bååth, E. Comparison of temperature effects on soil respiration and bacterial and fungal growth rates. FEMS Microbiol. Ecol. 2005, 52, 49–58. [Google Scholar]
  66. Kaiser, C.; Koranda, M.; Kitzler, B.; Fuchslueger, L.; Schnecker, J.; Schweiger, P.; Rasche, F.; Zechmeister-Boltenstern, S.; Sessitsch, A.; Richter, A. Belowground carbon allocation by trees drives seasonal patterns of extracellular enzyme activities by altering microbial community composition in a beech forest soil. New Phytol. 2010, 187, 843–858. [Google Scholar] [CrossRef]
  67. Baldrian, P. Microbial activity and the dynamics of ecosystem processes in forest soils. Curr. Opin. Microbiol. 2017, 37, 128–134. [Google Scholar] [CrossRef] [PubMed]
  68. Söderström, B.E. Seasonal fluctuations of active fungal biomass in horizons of a podzolized pine-forest soil in Central Sweden. Soil Biol. Biochem. 1979, 11, 149–154. [Google Scholar] [CrossRef]
  69. Talbot, J.M.; Bruns, T.D.; Smit, D.P.; Branco, S.; Glassman, S.I.; Erlandson, S.; Vilgalys, R.; Peay, K.G. Independent roles of ectomycorrhizal and saprotrophic communities in soil organic matter decomposition. Soil Biol. Biochem. 2013, 57, 282–2091. [Google Scholar] [CrossRef]
  70. Bohlen, P.J.; Groffman, P.M.; Driscoll, C.T.; Fahey, T.J.; Siccama, T.G. Plant-soil microbial interactions in a northern hardwood forest. Ecology 2001, 82, 965–978. [Google Scholar]
  71. Rastin, N.; Rosenplänter, K.; Hüttermann, A. Seasonal variation of enzyme activity and their dependence on certain soil factors in a beech forest soil. Soil Biol. Biochem. 1988, 20, 637–642. [Google Scholar] [CrossRef]
  72. Sardans, J.; Peñuelas, J. Drought decreases soil enzyme activity in a Mediterranean Quercus ilex L. forest. Soil Biol. Biochem. 2005, 37, 455–461. [Google Scholar] [CrossRef]
  73. Baldrian, P.; Šnajdr, J.; Merhautová, V.; Dobiášová, P.; Cajthaml, T.; Valášková, V. Responses of the extracellular enzyme activities in hardwood forest to soil temperature and seasonality and the potential effects of climate change. Soil Biol. Biochem. 2013, 54, 60–68. [Google Scholar] [CrossRef]
  74. Brockett, B.F.; Prescott, C.E.; Grayston, S.J. Soil moisture is the major factor influencing microbial community structure and enzyme activities across seven biogeoclimatic zones in western Canada. Soil Biol. Biochem. 2012, 44, 9–20. [Google Scholar] [CrossRef]
  75. Grayston, S.J.; Prescott, C.E. Microbial communities in forest floors under four tree species in coastal British Columbia. Soil Biol. Biochem. 2005, 37, 1157–1167. [Google Scholar] [CrossRef]
  76. Weintraub, S.R.; Wieder, W.R.; Cleveland, C.C.; Townsend, A.R. Organic matter inputs shift soil enzyme activity and allocation patterns in a wet tropical forest. Biogeochemistry 2013, 114, 313–326. [Google Scholar] [CrossRef]
  77. Manzoni, S.; Katul, G. Invariant soil water potential at zero microbial respiration explained by hydrological discontinuity in dry soils. Geophys. Res. Lett. 2014, 41, 7151–7158. [Google Scholar] [CrossRef]
  78. Turner, B.L. Variation in pH optima of hydrolytic enzyme activities in tropical rain in forest soil. Appl. Environ. Microbiol. 2010, 76, 6485–6493. [Google Scholar] [CrossRef] [PubMed]
  79. Nannipieri, P.; Trasar-Cepeda, C.; Dick, R.P. Soil enzyme activity: A brief history and biochemistry as a basis for appropriate interpretations and meta-analysis. Biol. Fertil. Soils 2018, 54, 11–19. [Google Scholar] [CrossRef]
  80. Mackensen, J.; Bauhus, J.; Webber, E. Decomposition rates of coarse woody debris—A review with particular emphasis on Australian tree species. Aust. J. Bot. 2003, 51, 27–37. [Google Scholar] [CrossRef]
Figure 1. Seasonal values of extracellular enzyme activities in a black walnut and red oak forest plantation and non-forest soil. Graphs (ad) represent the 0–10 cm soil layer of plots and (eh) represent the 10–20 cm soil layer of plots. The data represent averages and standard errors (n = 3). For each variable, values with different letters are significantly different among seasons (p < 0.05; ANOVA, followed by Fisher’s LSD post-hoc test by season and depth). BG: β-glucosidase; NAG: β-glucosaminidase; PME: acid phosphatase; AS: Arylsulfatase.
Forests 14 00859 g001
Figure 2. Biplot of principal component analysis (PCA) of fatty acid methyl ester (FAME) microbial indicators’ data at two depths: (a) represents the 0–10 cm soil layer of plots and (b) represents the 10–20 cm soil layer of plots (n = 3). BG: β-glucosidase; NAG: β-glucosaminidase; PME: acid phosphatase; AS: arylsulfatase; AMF: arbuscular mycorrhizal fungi; GP: Gram-positive bacteria; GN: Gram-negative bacteria; BW: black walnut; RO: red oak; DB: non-forest soil.
Forests 14 00859 g002
Figure 3. Structural equation models describing the effects of multiple drivers, tree species (black walnut, red oak, non-forest soil), and soil conditions (pH, soil moisture) on four soil functional measures (TOC, total fungi, total bacteria, and soil function, based on soil enzyme activities). Numbers adjacent to arrows are path coefficients, which are analogous to partial correlation coefficients and indicative of the effect size of the relationship. Only the significant effect appears in the figure. R2 represents the total variance in soil function explained by the model. χ2 = 0.1737, df = 3, p = 0.712, RMSEA = 0, Bootstrapped p = 1.0. Fungi: Total fungi; Bacteria: Total bacteria; TOC: Total organic Carbon; TC: Total Carbon; TN: Total Nitrogen; C:N: Carbon:Nitrogen ratio. Asterisks indicate significant differences (***, 0.001).
Forests 14 00859 g003
Table 1. Seasonal values of soil moisture, pH, and C and N content in black walnut and red oak forest plantations. These data represent the average and standard error (n = 3). For each variable, values with different letters are significantly different among seasons (p < 0.05; ANOVA, followed by Fisher’s LSD post-hoc test). BW: Black Walnut; RO: Red Oak; DB: non-forest soil; TOC: Total organic Carbon; TC: Total Carbon; TN: Total Nitrogen; C:N: Carbon:Nitrogen ratio.
SeasonPlantTOC (%)TC (%)TN (%)C:NpHSoil Moisture (%)
010 cm
AutumnBW1.59 (0.34)1.84 (0.29) a0.15 (0.02) a11.87 (1.44)6.65 (0.07) a19.75 (3.17)
RO1.13 (0.23)1.19 (0.23) b0.11 (0.01) b10.74 (0.99)5.80 (0.26) b17.57 (1.82)
DB1.40 (0.12)1.57 (0.07) ab0.13 (0.00) ab11.36 (0.18)6.42 (0.42) a20.48 (2.14)
WinterBW1.42 (0.26)1.72 (0.33)0.13 (0.03)12.97 (1.74)6.56 (0.19)21.98 (1.62)
RO1.10 (0.27)1.30 (0.17)0.11 (0.02)11.20 (0.47)6.09 (0.38)20.42 (2.43)
DB1.38 (0.18)1.59 (0.26)0.14 (0.02)11.09 (0.48)6.26 (0.50)22.16 (2.34)
SpringBW1.70 (0.29)1.91 (0.24)0.15 (0.02)12.88 (1.30)6.15 (0.06) ab18.71 (1.70)
RO1.45 (0.29)1.55 (0.31)0.12 (0.03)12.41 (0.77)5.85 (0.25) b16.82 (1.76)
DB1.58 (0.16)1.73 (0.10)0.15 (0.01)11.09 (0.50)7.09 (0.70) a18.31 (2.28)
SummerBW1.99 (0.34) a2.30 (0.30) a0.18 (0.03) a12.92 (1.33)6.42 (0.05) a7.00 (2.98)
RO1.18 (0.10) b1.30 (0.05) b0.10 (0.01) b12.48 (0.85)5.81 (0.20) b4.91 (0.88)
DB1.57 (0.03) ab1.78 (0.05) b0.14 (0.00) ab12.15 (0.60)6.32 (0.32) a7.86 (1.39)
1020 cm
AutumnBW1.13 (0.22) a1.38 (0.27) a0.12 (0.02)11.14 (1.37)6.51 (0.10) a17.64 (3.92)
RO0.80 (0.21) b0.93 (0.16) b0.09 (0.01)10.36 (0.52)5.97 (0.30) b18.81 (0.94)
DB0.74 (0.17) b0.93 (0.14) b0.09 (0.01)10.38 (0.09)6.30 (0.25) ab17.76 (2.53
WinterBW1.25 (0.34)1.38 (0.40)0.10 (0.03)13.20 (2.94)6.45 (0.18)19.91 (1.94)
RO0.85 (0.20)0.94 (0.17)0.08 (0.02)11.76 (1.29)6.32 (0.35)18.05 (1.91)
DB0.88 (0.15)1.02 (0.18)0.09 (0.01)10.96 (0.70)6.17 (0.16)16.71 (2.69)
SpringBW1.40 (0.31)1.53 (0.35)0.12 (0.02)12.16 (2.21)6.23 (0.07) ab16.52 (2.58) a
RO0.87 (0.18)0.98 (0.12)0.09 (0.01)10.78 (0.88)5.95 (0.27) b11.44 (1.14) b
DB1.03 (0.22)1.32 (0.34)0.13 (0.03)10.10 (0.34)6.78 (0.48) a14.82 (1.39) ab
SummerBW1.60 (0.29) a1.82 (0.38) a0.15 (0.02) a12.13 (2.10)6.34 (0.16) ab9.00 (2.52)
RO0.85 (0.24) b0.96 (0.19) b0.08 (0.02) b11.31 (0.38)5.90 (0.33) b8.12 (3.39)
DB1.00 (0.14) b1.24 (0.21) ab0.11 (0.01) ab10.92 (0.84)7.16 (0.49) a7.89 (0.93)
Table 2. Abundance of FAME microbial indicator groups in black walnut and red oak plantations and non-forest soil. (ANOVA, followed by Fisher’s LSD post-hoc test). The data represent averages and standard errors (n = 3). BW: Black Walnut; RO: Red Oak; DB: non-forest soil; AMF: arbuscular mycorrhizal fungi; ATB: actinobacteria; SF: saprotrophic fungi; TOC: total organic carbon; TC: total carbon; TN: total nitrogen; C:N: carbon:nitrogen ratio; TS: tree species; S: season.
SeasonAreaFAME (ttl)Bacteria (ttl)Fungi (ttl)Gram (+)Gram (–)ATBAMFSF
0–10 cm
AutumnBW1592.75 (297.72)227.32 (58.43)439.94 (191.34)113.89 (28.11)44.99 (13.58)68.44 (16.88)148.01 (35.49)291.92 (164.47)
RO1108.13 (141.23)167.53 (25.50)262.99 (69.48)78.91 (10.48)37.13 (7.95)51.47 (7.45)55.92 (32.81)207.07 (16.84)
DB1529.03 (233.53)245.27 (36.99)419.43 (69.48)117.65 (17.88)49.59 (8.10)78.01 (11.52)101.10 (35.40)318.32 (83.06)
WinterBW1509.69 (395.57)193.67 (52.60)401.74 (136.79)103.68 (26.40)33.86 (9.28)56.12 (17.39)124.94 (36.66)276.79 (105.69)
RO1041.50 (221.51)153.049 (44.14)282.94 (40.30)76.90 (21.77)32.25 (11.72)43.88 (11.34)35.02 (5.49) 247.92 (45.56)
DB1025.96 (110.88)209.71 (15.02)401.65 (88.27)104.0 (11.06)40.57 (2.26)64.33 (4.37)99.43 (58.27)302.22 (73.37)
SpringBW1776.09 (242.53)210.71 (38.12)257.02 (29.66)108.86 (18.19)41.75 (8.72)60.09 (11.71)81.39 (9.84)175.62 (28.76)
RO1025.04 (84.14)194.52 (10.94)270.11 (81.35)82.88 (18.88)46.64 (3.09)64.99 (11.45)54.21 (42.33)215.89 (96.03)
DB1025.96 (84.14)201.70 (24.40)173.94 (68.83)97.77 (13.26)41.51 (5.78)62.40 (7.37)51.42 (23.34)122.51 (45.49)
SummerBW1629.21 (201.35)290.49 (72.05)408.80 (70.20)145.20 (18.19)59.67 (16.68)85.61 (21.65)165.52 (47.61)243.37 (31.87)
RO1126.96 (218.54)184.48 (22.56)303.60 (91.04)88.56 (11.62)51.21 (4.21)54.70 (6.92)59.91 (34.25)243.69 (57.16)
DB1776.09 (115.69)289.40 (66.99)499.87 (175.51)144.76 (38.57)57.07 (9.75)88.57 (18.67)186.86 (96.74)313.01 (78.79)
ANOVATS0.00560.0141n.s.0.0019n.s.0.02725.56 × 10−5n.s.
Seasonn.s.0.01730.03060.031140.0070.02150.0107n.s.
TS × Sn.s.n.s.n.s.n.s.n.s.n.s.n.s.n.s.
10–20 cm
AutumnBW1123.43 (378.36)165.71 (55.88)301.62 (153.66)80.08 (26.48)35.36 (13.28)50.25 (16.32)110.74 (37.24)190.88 (134.41)
RO585.53 (173.74)102.18 (31.99)135.51 (53.87)47.42 (16.19)22.91 (6.28)31.84 (10.25)29.22 (18.99)106.28 (44.10)
DB1372.21 (510.28)208.01 (71.17)408.54 (174.40)97.80 (32.45)42.74 (15.42)67.45 (23.33)95.69 (11.45)312.84 (176.97)
WinterBW820.62 (124.26)117.71 (23.94)186.87 (63.32)58.79 (10.22)24.16 (4.85)34.75 (9.15)78.04 (26.31)108.83 (38.48)
RO432.96 (113.79)82.80 (34.02)186.62 (63.32)37.70 (14.04)18.57 (8.91)26.53 (11.26)21.85 (12.23)84.77 (17.29)
DB863.15 (156.39)150.65 (23.34)106.63 (12.67)73.56 (12.80)29.52 (3.90)47.57 (7.13)68.24 (20.78)166.96 (55.75)
SpringBW746.97 (132.8)143.51 (52.06)235.20 (38.27)68.86 (23.25)30.45 (11.62)44.18 (17.43)58.57 (19.82)74.14 (21.23)
RO602.13 (161.46)117.08 (30.11)135.13 (42.32)52.73 (12.71)27.61 (7.20)36.73 (10.35)21.69 (9.44)113.45 (42.52)
DB620.19 (80.52)145.58 (27.40)130.98 (13.84)66.52 (12.99)31.063 (5.92)48.00 (9.17)48.07 (12.81)82.89 (13.98)
SummerBW1063.77 (181.78)178.27 (15.68)276.15 (85.57)85.57 (7.35)37.45 (4.27)55.21 (6.96)122.16 (50.85)153.99 (45.91)
RO704.48 (207.05)143.45 (53.16)166.73 (49.01)66.02 (25.38)32.21 (11.59)45.21 (16.26)54.64 (41.90)112.09 (28.29)
DB967.64 (229.77)162.77 (21.59)278.17 (91.30)76.62 (13.58)33.40 (2.23)52.51 (5.91)118.70 (57.07)159.46 (35.62)
ANOVATS0.00180.0230.02090.0073n.s.0.02180.0002n.s.
Season0.027n.s.0.0145n.s.n.s.n.s.0.0079n.s.
TS × Sn.s.n.s.n.s.n.s.n.s.n.s.n.s.n.s.
Table 3. Pearson’s correlations between FAME microbial indicators and environmental variables and enzyme activities (n = 92). Significant correlations (p < 0.05) are in bold. *, **, and *** indicate significant effects at p < 0.05, p < 0.01, and p < 0.001, respectively. BG: β-glucosidase; NAG: β-glucosaminidase; PME: acid phosphatase; AS: arylsulfatase; AMF: arbuscular mycorrhizal fungi; GP: Gram-positive bacteria; GN: Gram-negative bacteria; TOC: Total organic Carbon; TC: Total Carbon; TN: Total Nitrogen; C:N: Carbon:Nitrogen ratio.
VariableFAME (ttl)Bacteria (ttl)Fungi (ttl)Gram (+)Gram (–)AMYAMFSF
Temp0.030.23*−0.070.18 0.30**0.24*0.02 −0.10
Soil Moisture−0.27−0.25 −0.08−0.30*−0.18 −0.16 0.07 −0.14
pH0.230.26 0.180.35*0.01 0.23 0.5***−0.04
TOC0.150.46***−0.050.5***0.36*0.36*0.1 −0.13
TC0.280.37**0.130.46***0.21 0.25 0.26 0.02
TN0.220.56***0.040.59***0.43**0.46***0.2 −0.05
C:N0.17−0.25 0.18−0.13 −0.35**−0.33*0.15 0.15
BG0.050.33*−0.020.38**0.15 0.29*0.43***−0.26
NAG−0.130.01 −0.020.02 −0.07 0.02 0.14 −0.11
PME−0.020.26 −0.070.21 0.27 0.26 0.09 −0.15
AS−0.020.33*−0.110.34*0.26 0.29*0.18 −0.23
Disclaimer/Publisher’s Note: The statements, opinions and data contained in all publications are solely those of the individual author(s) and contributor(s) and not of MDPI and/or the editor(s). MDPI and/or the editor(s) disclaim responsibility for any injury to people or property resulting from any ideas, methods, instructions or products referred to in the content.

