
Exploring the Potential of Portable Spectroscopic Techniques for the Biochemical Characterization of Roots in Shallow Landslides

 ,
,  , , ,
, , ,
Abstract
:1. Introduction
2. Results
2.1. FTIR
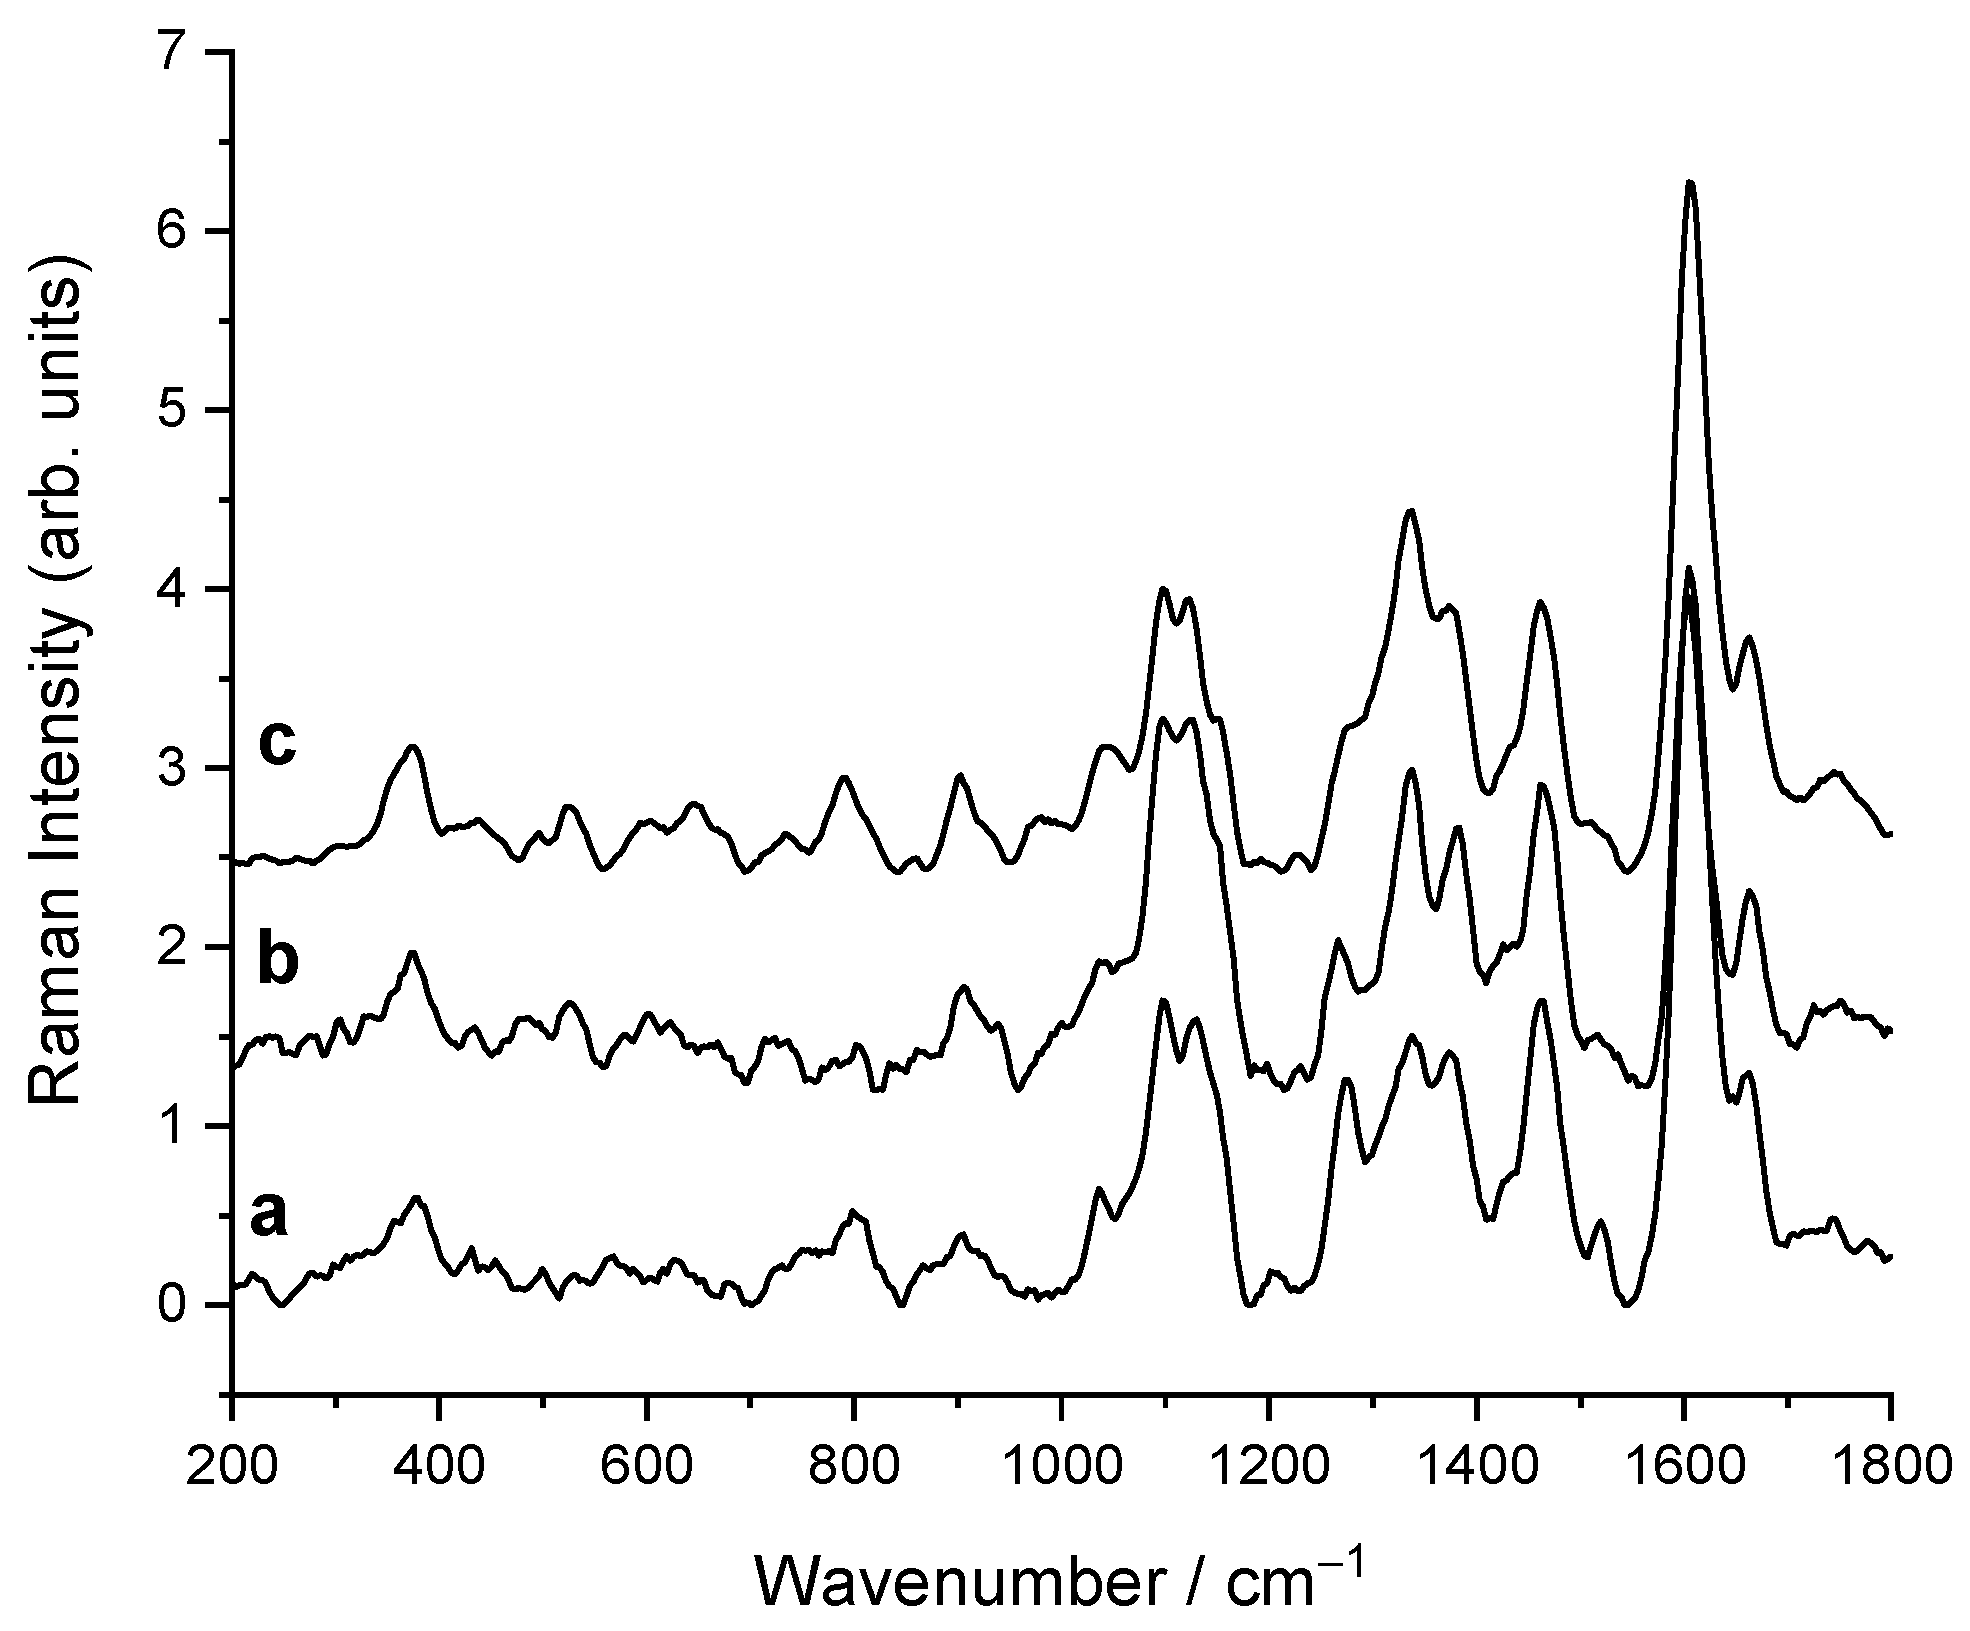
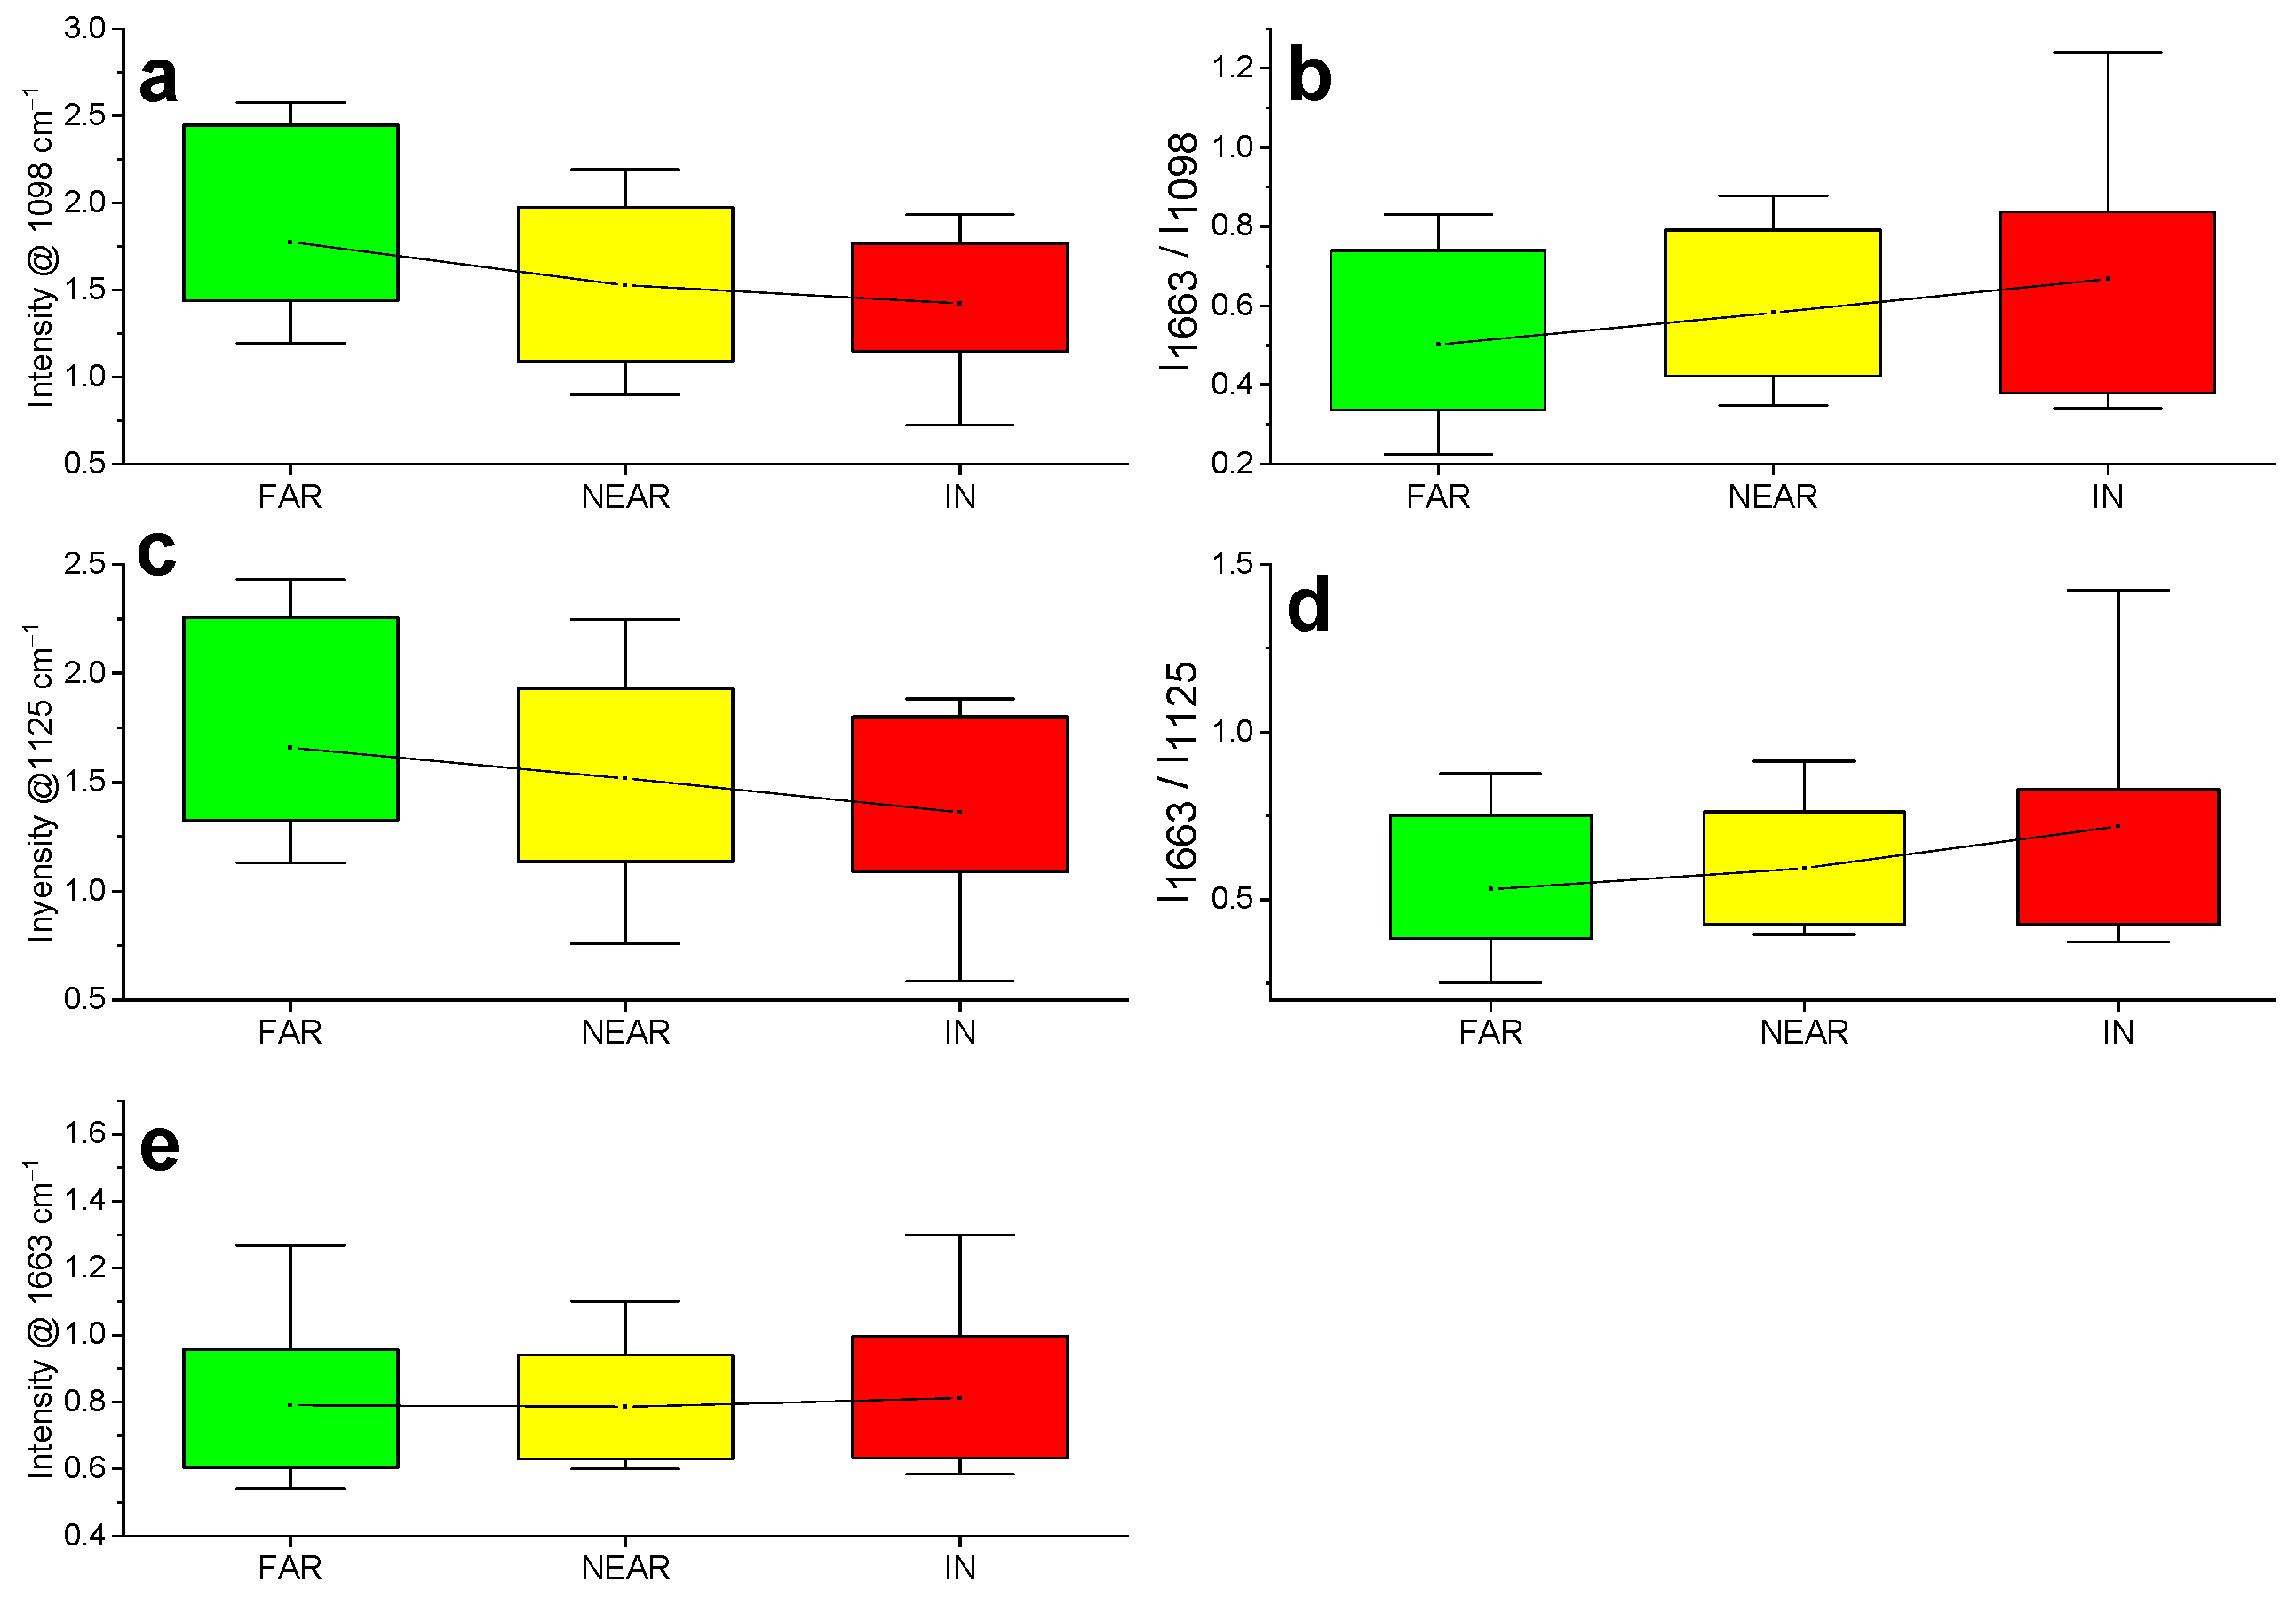
2.2. Raman
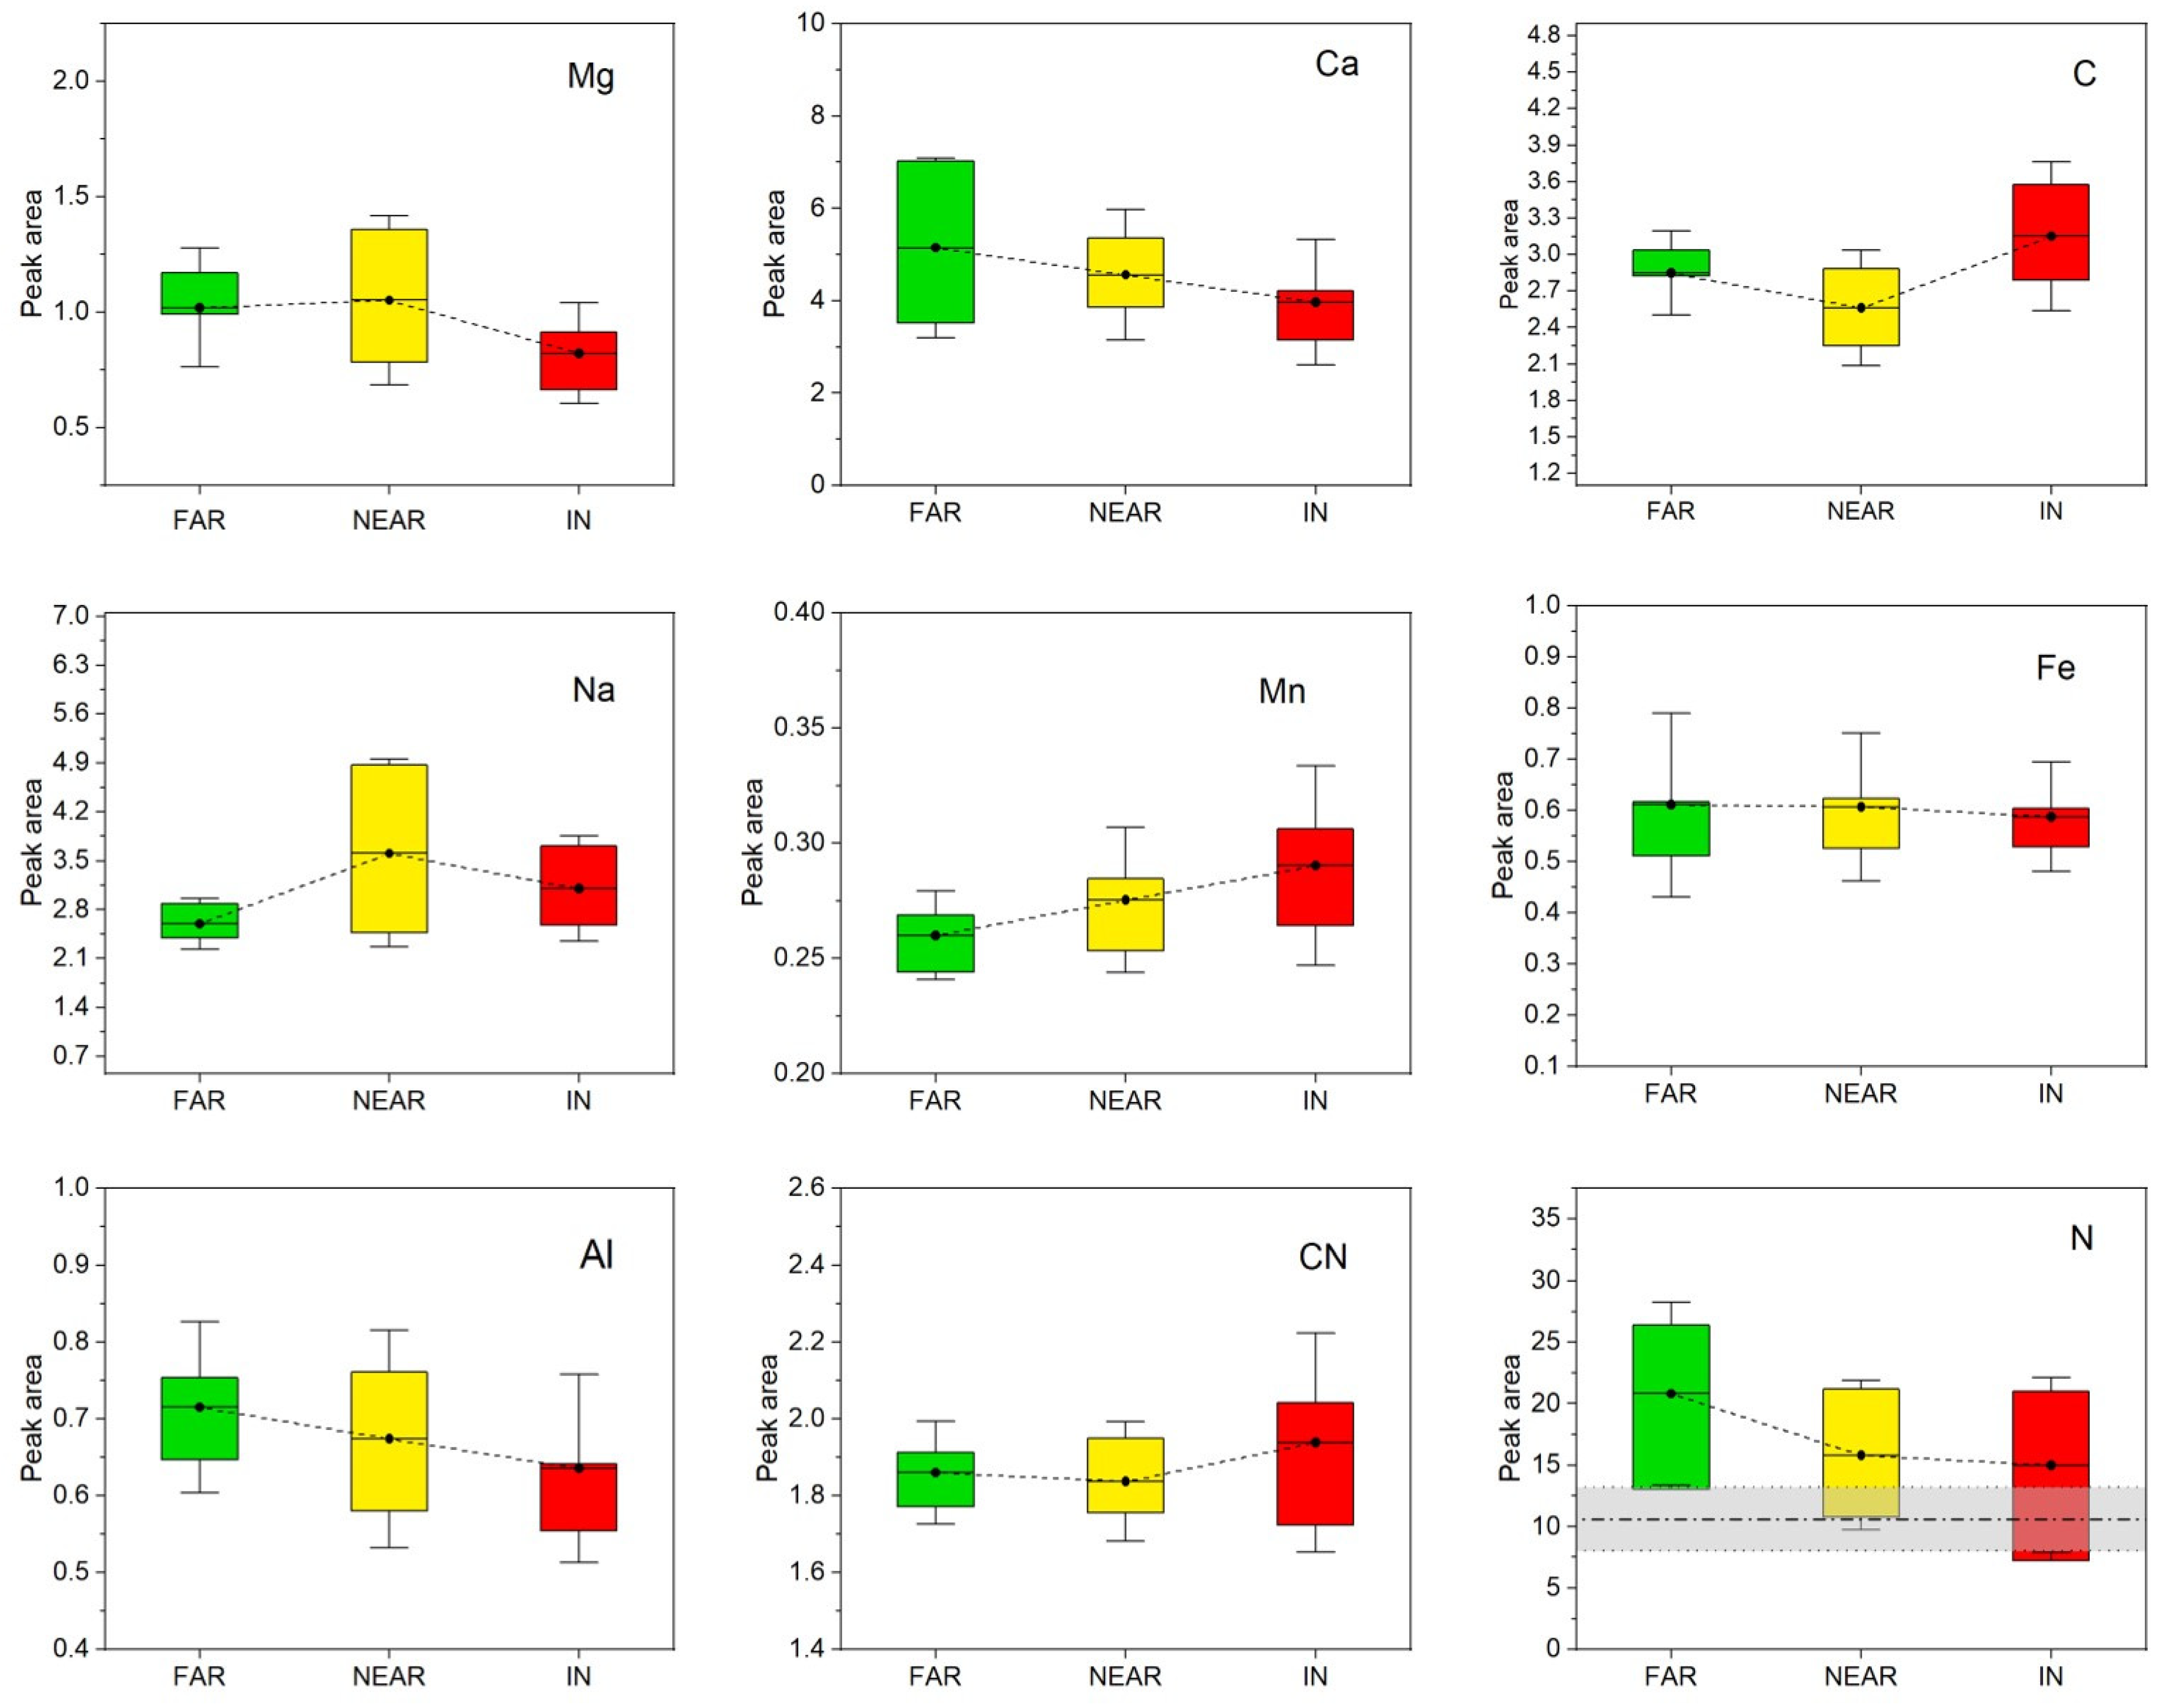
2.3. LIBS
3. Discussion
4. Materials and Methods
4.1. Root Sampling
4.2. Spectroscopic Analysis
4.3. Data Processing and Statistical Analysis
5. Conclusions
Author Contributions
Funding
Data Availability Statement
Acknowledgments
Conflicts of Interest
References
- Hungr, O.; Leroueil, S.; Picarelli, L. The Varnes classification of landslide types, an update. Landslides 2014, 11, 167–194. [Google Scholar] [CrossRef]
- Milledge, D.G.; Bellugi, G.; McKean, J.A.; Densmore, A.L.; Dietrich, W.E. A multidimensional stability model for predicting shallow landslide size and shape across landscapes. J. Geop. Res. Earth Surf. 2014, 119, 2481–2504. [Google Scholar] [CrossRef]
- Giannecchini, R.; Galanti, Y.; D’Amato Avanzi, G. Critical rainfall thresholds for triggering shallow landslides in the Serchio River Valley (Tuscany, Italy). Nat. Hazards Earth Syst. Sci. 2012, 12, 829–842. [Google Scholar] [CrossRef]
- Meisina, C.; Scarabelli, S. A comparative analysis of terrain stability models for predicting shallow landslides in colluvial soils. Geomorphology 2007, 87, 207–223. [Google Scholar] [CrossRef]
- Persichillo, M.G.; Bordoni, M.; Meisina, C.; Bartelletti, C.; Barsanti, M.; Giannecchini, R.; D’Amato Avanzi, G.; Galanti, Y.; Cevasco, A.; Brandolini, P.; et al. Shallow landslides susceptibility assessment in different environments. Geomat. Nat. Hazards Risk 2017, 8, 748–771. [Google Scholar] [CrossRef]
- Bischetti, G.B.; Chiaradia, E.A.; Simonato, T.; Spaziali, B.; Vitali, B.; Vullo, P.; Zocco, A. Root strength and root area ratio of forest species in Lombardy (Northern Italy). Plant Soil 2005, 278, 11–22. [Google Scholar] [CrossRef]
- Dazio, E.P.R.; Conedera, M.; Schwarz, M. Impact of different chestnut coppice managements on root reinforcement and shallow landslide susceptibility. For. Ecol. Manag. 2018, 417, 63–76. [Google Scholar] [CrossRef]
- Giadrossich, F.; Schwarz, M.; Cohen, D.; Cislaghi, A.; Vergani, C.; Hubble, T.; Phillips, C.; Stokes, A. Methods to measure the mechanical behavior of tree roots: A review. Ecol. Eng. 2017, 109, 256–271. [Google Scholar] [CrossRef]
- Greenwood, J.R.; Norris, J.E.; Wint, J. Assessing the contribution of vegetation to slope stability. Proc. Inst. Civ. Eng.—Geotech. Eng. 2004, 157, 199–207. [Google Scholar] [CrossRef]
- Kokutse, N.K.; Temgoua, A.G.T.; Kavazović, Z. Slope stability and vegetation: Conceptual and numerical investigation of mechanical effects. Ecol. Eng. 2016, 86, 146–153. [Google Scholar] [CrossRef]
- Roering, J.J.; Schmidt, K.M.; Stock, J.D.; Dietrich, W.E.; Montgomery, D.R. Shallow landsliding, root reinforcement, and the spatial distribution of trees in the Oregon Coast Range. Can. Geotech. J. 2003, 40, 237–253. [Google Scholar] [CrossRef]
- Bischetti, G.B.; Chiaradia, E.A.; Epis, T.; Morlotti, E. Root cohesion of forest species in the Italian Alps. Plant Soil 2009, 324, 71–89. [Google Scholar] [CrossRef]
- Li, Y.; Wang, Y.; Ma, C.; Zhang, H.; Wang, Y.; Song, S.; Zhu, J. Influence of the spatial layout of plant roots on slope stability. Ecol. Eng. 2016, 91, 477–486. [Google Scholar] [CrossRef]
- Vergani, C.; Giadrossich, F.; Buckley, P.; Conedera, M.; Pividori, M.; Salbitano, F.; Rauch, H.S.; Lovreglio, R.; Schwarz, M. Root reinforcement dynamics of European coppice woodlands and their effect on shallow landslides: A review. Earth-Sci. Rev. 2017, 167, 88–102. [Google Scholar] [CrossRef]
- Schwarz, M.; Preti, F.; Giadrossich, F.; Lehmann, P.; Or, D. Quantifying the role of vegetation in slope stability: A case study in Tuscany (Italy). Ecol. Eng. 2010, 36, 285–291. [Google Scholar] [CrossRef]
- Genet, M.; Stokes, A.; Salin, F.; Mickovski, S.B.; Fourcaud, T.; Dumail, J.-F.; van Beek, R. The influence of cellulose content on tensile strength in tree roots. Plant Soil 2005, 278, 1–9. [Google Scholar] [CrossRef]
- Danjon, F.; Barker, D.H.; Drexhage, M.; Stokes, A. Using three-dimensional Plant Root Architecture in Models of Shallow-slope Stability. Ann. Bot. 2008, 101, 1281–1293. [Google Scholar] [CrossRef]
- Moresi, F.V.; Maesano, M.; Matteucci, G.; Romagnoli, M.; Sidle, R.C.; Mugnozza, G.S. Root Biomechanical Traits in a Montane Mediterranean Forest Watershed: Variations with Species Diversity and Soil Depth. Forests 2019, 10, 341. [Google Scholar] [CrossRef]
- Gierlinger, N.; Schwanninger, M. The potential of Raman microscopy and Raman imaging in plant research. J. Spectrosc. 2007, 21, 498206. [Google Scholar] [CrossRef]
- Somssich, M.; Khan, G.A.; Persson, S. Cell wall heterogeneity in root development of Arabidopsis. Front. Plant Sci. 2016, 7, 1242. [Google Scholar] [CrossRef]
- Rivera, J.R.; Terrazas, T. Lignin Analysis by HPLC and FTIR. In Xylem: Methods and Protocols, Methods; de Lucas, M., Etchells, J.P., Eds.; Springer Science+Business Media LCC.: Berlin/Heidelberg, Germany, 2017; Volume 1544, pp. 193–211. [Google Scholar]
- Stark, N.M.; Yelle, D.J.; Agarwal, U.P. Techniques for characterizing lignin. In Lignin in Polymer Composites; Faruk, O., Mohini, S., Eds.; Elsevier: Amsterdam, The Netherlands, 2016; pp. 49–66. [Google Scholar]
- O’Neill, M.A.; York, W.S. The composition and structure of plant primary cell wall. In The Plant Cell Wall; Rose, J.K.C., Ed.; Balckwell Publishing: Oxford, UK, 2003. [Google Scholar]
- Zhang, X.; Chen, S.; Xu, F. Combining Raman Imaging and Multivariate Analysis to Visualize Lignin, Cellulose, and Hemicellulose in the Plant Cell Wall. J. Vis. Exp. 2017, 124, 1–7. [Google Scholar] [CrossRef]
- Reubens, B.; Poesen, J.; Danjon, F.; Geudens, G.; Muis, B. The role of fine and coarse roots in shallow slope stability and soil erosion control with a focus on root system architecture: A review. Trees 2007, 21, 385–402. [Google Scholar] [CrossRef]
- Masi, E.B.; Segoni, S.; Tofani, V. Root Reinforcement in Slope Stability Models: A Review. Geosciences 2021, 11, 212. [Google Scholar] [CrossRef]
- Coppin, N.J.; Richards, I.G. Use of Vegetation in Civil Engineering; Butterworth-Heinemann: Oxford, UK, 1990. [Google Scholar]
- Gonzalez-Oullari, A.; Mickovski, S.B. Hydrological effect of vegetation against rainfall-induced landslides. J. Hydrol. 2017, 549, 374–387. [Google Scholar] [CrossRef]
- Zimmermann, A.; Zimmermann, B. Requirements for throughfall monitoring: The roles of temporal scale and canopy complexity. Agric. For. Meteorol. 2014, 189–190, 125–139. [Google Scholar] [CrossRef]
- Indelicato, C.; Osticioli, I.; Agresti, J.; Ciofini, D.; Mencaglia, A.; Perotti, M.; Viti, C.; Moreschi, R.; Siano, S. Exploring grain sizing of sedimentary calcareous rocks using Raman spectroscopy. Eur. Phys. J. Plus 2022, 137, 359. [Google Scholar] [CrossRef]
- Agarwal, U.P. FT–Raman Investigation of Milled-Wood Lignins: Softwood, Hardwood, and Chemically Modified Black Spruce Lignins. J. Wood Chem. Technol. 2011, 31, 324–344. [Google Scholar] [CrossRef]
- Murgia, I.; Giadrossich, F.; Mao, Z.; Cohen, D.; Capra, G.F.; Schwarz, M. Modeling shallow landslides and root reinforcement: A review. Ecol. Eng. 2022, 181, 106671. [Google Scholar] [CrossRef]
- Zhang, C.; Li-Hua, C.; Jing, J. Why fine tree roots are stronger than thicker roots: The role of cellulose and lignin in relation to slope stability. Geomorphology 2014, 206, 196–202. [Google Scholar] [CrossRef]
- Zhu, J.; Wang, Y.; Mao, Z.; Langendoen, E.J. How does root biodegradation after plant felling change root reinforcement to soil? Plant Soil 2020, 446, 211–227. [Google Scholar] [CrossRef]
- Moura, J.C.; Bonine, C.A.; de Oliveira Fernandes Viana, J.; Dornelas, M.C.; Mazzafera, P. Abiotic and biotic stresses and changes in the lignin content and composition in plants. J. Integr. Plant Biol 2010, 52, 360–376. [Google Scholar] [CrossRef] [PubMed]
- Ogden, M.; Hoefgen, R.; Roessner, U.; Persson, S.; Khan, G.A. Feeding the Walls: How Does Nutrient Availability Regulate Cell Wall Composition? Int. J. Mol. Sci. 2018, 19, 2691. [Google Scholar] [CrossRef] [PubMed]
- Lautner, S.; Ehlting, B.; Windeisen, E.; Rennenberg, H.; Matyssek, R.; Fromm, J. Calcium nutrition has a significant influence on wood formation in poplar. New Phytol. 2007, 173, 743–752. [Google Scholar] [CrossRef] [PubMed]
- Nicolodelli, G.; Cabral, J.; Menegatti, C.R.; Marangoni, B.; Senesi, G.S. Recent advances and future trends in LIBS applications to agricultural materials and their food derivatives: An overview of developments in the last decade (2010–2019). Part I. Soils and fertilizers. TrAC Trends Anal. Chem. 2019, 115, 70–82. [Google Scholar] [CrossRef]
- Senesi, G.S.; Cabral, J.; Menegatti, C.R.; Marangoni, B.; Nicolodelli, G. Recent advances and future trends in LIBS applications to agricultural materials and their food derivatives: An overview of developments in the last decade (2010–2019). Part II. Crop plants and their food derivatives. TrAC Trends Anal. Chem. 2019, 118, 453–469. [Google Scholar] [CrossRef]
- Solo-Gabriele, H.M.; Townsend, T.G.; Hahnc, D.W.; Moskal, T.M.; Hosein, N.; Jambeck, J.; Jacobi, G. Evaluation of XRF and LIBS technologies for on-line sorting of CCA-treated wood waste. Waste Manag. 2004, 24, 413–424. [Google Scholar] [CrossRef]
- Cui, X.; Wang, Q.; Zhao, Y.; Qiao, X.; Teng, G. Laser-induced breakdown spectroscopy (LIBS) for classification of wood species integrated with artificial neural network (ANN). Appl. Phys. B 2019, 125, 56. [Google Scholar] [CrossRef]
- Arantes De Carvalho, G.G.; Bueno Guerra, M.B.; Adame, A.; Nomura, C.S.; Oliveira, P.V.; Pereira De Carvalho, H.W.; Santos, D.; Nunes, L.C.; Krug, F.J. Recent Advances in LIBS and XRF for the Analysis of Plants. J. Anal. At. Spectrom. 2018, 33, 919–944. [Google Scholar] [CrossRef]
- Wang, J.; Shi, M.; Zheng, P.; Xue, S.; Peng, R. Quantitative Analysis of Ca, Mg, and K in the Roots of Angelica Pubescens f. Biserrata by Laser-Induced Breakdown Spectroscopy Combined with Artificial Neural Networks. J. Appl. Spectrosc. 2018, 85, 190–196. [Google Scholar] [CrossRef]
- Liu, F.; Shen, T.; Kong, W.; Peng, J.; Zhang, C.; Song, K.; Wang, W.; Zhang, C.; He, Y. Quantitative Analysis of Cadmium in Tobacco Roots Using Laser-Induced Breakdown Spectroscopy with Variable Index and Chemometrics. Front. Plant Sci. 2018, 9, 1–12. [Google Scholar] [CrossRef]
- Shukla, N.; Bharti, A.S.; Srivastava, S.; Uttam, K.N. Determination of Elements in Carrot Root by Laser Induced Breakdown Spectroscopy. Natl. Acad. Sci. Lett. 2017, 40, 47–51. [Google Scholar] [CrossRef]
- Wang, W.; Kong, W.; Shen, T.; Man, Z.; Zhu, W.; He, Y.; Liu, F. Quantitative Analysis of Cadmium in Rice Roots Based on LIBS and Chemometrics Methods. Environ. Sci. Eur. 2021, 33, 1–14. [Google Scholar] [CrossRef]
- Pandey, K.K. A Study of chemical structure of soft and hardwood and wood polymers by FTIR spectroscopy. J. Appl. Polym. Sci. 1999, 71, 1969.e75. [Google Scholar] [CrossRef]
- Pandey, K.K. Study of the effect of photo-irradiation on the surface chemistry of wood. Polym. Degrad. Stab. 2005, 90, 9–20. [Google Scholar] [CrossRef]
- Moore, A.K.; Owen, N.L. Infrared Spectroscopic Studies of Solid Wood. Appl. Spectrosc. Rev. 2001, 36, 65–86. [Google Scholar] [CrossRef]
- Chang, T.C.; Chang, H.T.; Wu, C.L.; Chang, S.T. Influences of Extractives on the Degradation of Wood. Polym. Degrad. Stab. 2010, 95, 516–521. [Google Scholar] [CrossRef]
- Ciofini, D.; Agresti, J.; Mencaglia, A.A.; Siano, S.; Osticioli, I. Temperature sensing during Raman Spectroscopic of lead white films in different purity grades and boundary conditions. Sens. Actuators B 2020, 325, 128958. [Google Scholar] [CrossRef]
- Le Gall, H.; Philippe, F.; Domon, J.-M.; Gillet, F.; Pelloux, J.; Catherine Rayon. Cell Wall Metabolism in Response to Abiotic Stress. Plants 2015, 4, 112–166. [Google Scholar] [CrossRef]
- Commandeur, P.R.; Pyles, M.R. Modulus of elasticity and tensile strength of Douglas fir roots. Can. J. For. Res. 1991, 21, 48–52. [Google Scholar] [CrossRef]
- Hairiah, K.; Widianto, W.; Suprayogo, D.; Van Noordwijk, M. Tree Roots Anchoring and Binding Soil: Reducing Landslide Risk in Indonesian Agroforestry. Land 2020, 9, 256. [Google Scholar] [CrossRef]
- Hales, T.C.; Ford, C.R.; Hwang, T.; Vose, J.M.; Band, L.E. Topographic and ecologic controls on root reinforcement. J. Geophys. Res. Earth Surf. 2009, 114. [Google Scholar] [CrossRef]
- Dietrich, W.E.; Wilson, C.J.; Reneau, S.L. Hollows, colluvium, and landslides in soil-mantled landscapes. Hillslope Process. 1986, 27, 362–368. [Google Scholar] [CrossRef]
- Moos, C.; Bebi, P.; Graf, F.; Mattli, J.; Rickli, C.; Schwarz, M. How does forest structure affect root reinforcement and susceptibility to shallow landslides? Earth Surf. Process. Landf. 2016, 41, 951–960. [Google Scholar] [CrossRef]
- Elle, O.; Richter, R.; Vohland, M.; Weigelt, A. Fine root lignin content is well predictable with near-infrared spectroscopy. Sci. Rep. 2019, 9, 6396. [Google Scholar] [CrossRef]
- Lupoi, J.S.; Healey, A.; Singh, S.; Sykes, R.; Davis, M.; Lee, D.J.; Shepherd, M.; Simmons, B.A.; Henry, R.J. High-Throughput Prediction of Acacia and Eucalypt Lignin Syringyl/Guaiacyl Content Using FT-Raman Spectroscopy and Partial Least Squares Modeling. BioEnergy Res. 2015, 8, 953–963. [Google Scholar] [CrossRef]
- Johanson, L.; Joham, H.E. The influence of sodium on the calcium nutrition of excised cotton roots. Plant Soil 1971, 35, 323–336. Available online: https://www.jstor.org/stable/42932952 (accessed on 15 April 2023). [CrossRef]
- Vidović, N.; Pasković, I.; Lukić, I.; Žurga, P.; Majetić Germek, V.; Grozić, K.; Cukrov, M.; Marcelić, Š.; Ban, D.; Talhaoui, N.; et al. Biophenolic Profile Modulations in Olive Tissues as Affected by Manganese Nutrition. Plants 2021, 10, 1724. [Google Scholar] [CrossRef]
- Panter, P.E.; Muranaka, T.; Cuitun-Coronado, D.; Graham, C.A.; Yochikawa, A.; Kudoh, H.; Dodd, A.N. Circadian regulation of the plant transcriptome under natural conditions. Front. Genet. 2019, 10, 1239. [Google Scholar] [CrossRef]
- Bojórquez-Quintal, E.; Escalante-Magaña, C.; Echevarría-Machado, I.; Martínez-Estévez, M. Aluminum, a friend or foe of higher plants in acid soils. Front. Plant Sci. 2017, 8, 1767. [Google Scholar] [CrossRef]
- Sun, C.-H.; Yu, J.-H.; Hu, D.-J. Nitrate: A crucial signal during lateral roots development. Front. Plant Sci. 2017, 8, 485. [Google Scholar] [CrossRef]
- Boschetti, T.; Toscani, L.; Barbieri, M.; Mucchino, C.; Marino, T. Low entalphy Na-chlorine waters from the Lunigiana and Garfagnana grabens: Northern Apenninnes, Italy: Tracing fluid connections and basement interaction via chemical and isotopic composition. J. Volcanol. Geotherm. Res. 2017, 348, 12–25. [Google Scholar] [CrossRef]
- Di Naccio, D.; Boncio, P.; Brozzetti, F.; Pazzaglia, F.J.; Lavecchia, G. Morphotectonic analysis of the Lunigiana and Garfagnana grabens (northern Apennines, Italy): Implication for active normal faulting. Geomorphology 2013, 201, 293–311. [Google Scholar] [CrossRef]
- Eva, E.; Solarino, S.; Boncio, P. HypoDD relocated seismicity in northern Apennines (Italy) preceding the 2013 seismic unrest: Seismotectonic implications for the Lunigiana-Garfagnana area. Boll. Di Geofis. Teor. Ed Appl. 2014, 55, 739–754. [Google Scholar] [CrossRef]
- Carmignani, L.; Decandia, F.A.; Disperati, L.; Fantozzi, P.L.; Kliegfield, R.; Lazzarotto, A.; Liotta, D.; Meccheri, M. Inner Northern Apennines. In Anatomy of an Orogen: The Apennines and the Adjacent Mediterranean Basins; Springer: Berlin/Heidelberg, Germany, 2001; pp. 197–214. [Google Scholar] [CrossRef]
- Puccinelli, A.; D’Amato Avanzi, G.; Perilli, N. Note Illustrative della Carta Geologica d’Italia alla Scala 1:50,000: Foglio 250 Castelnuovo di Garfagnana. 2014; ISPRA, Progetto CARG. Available online: https://www.isprambiente.gov.it/Media/carg/toscana.html (accessed on 15 April 2023).
- D’Addario, E. A New Approach to Assess the Susceptibility to Shallow Landslides at Regional Scale as Influenced by Bedrock Geo-Mechanical Properties. Ph.D. Thesis, University of Siena, Siena, Italy, 2021. [Google Scholar]
- Nardi, R. Il rischio idrogeologico in Italia: Cause e conseguenze. Il ruolo e le attività dell’Autorità di bacino pilota del fiume Serchio. In Acqua! luoghi, paesaggi, territori, 8, a cura di Ercolini, M.; ARACNE Editrice: Rome, Italy, 2012; pp. 203–218. [Google Scholar] [CrossRef]
- Böhm, W. Methods of Studying Root System; Springer: Berlin/Heidelberg, Germany, 1979. [Google Scholar] [CrossRef]
- Osticioli, I.; Mencaglia, A.A.; Siano, S. Temperature-controlled portable Raman spectroscopy of photothermally sensitive pigments. Sens. Actuators B Chem. 2017, 238, 772–778. [Google Scholar] [CrossRef]
- Osticioli, I.; Agresti, J.; Fornacelli, C.; Turbanti Memmi, I.; Siano, S. Potential role of LIPS elemental depth profiling in authentication studies of unglazed earthenware artifacts. J. Anal. At. Spectrosc. 2012, 27, 827–833. [Google Scholar] [CrossRef]
- Agresti, J.; Indelicato, C.; Perotti, M.; Moreschi, R.; Osticioli, I.; Cacciari, I.; Mencaglia, A.A.; Siano, S. Quantitative Compositional Analyses of Calcareous Rocks for Lime Industry Using LIBS. Molecules 2022, 27, 1813. [Google Scholar] [CrossRef]
- Osticioli, I.; Ciofini, D.; Banchelli, M.; Capozzoli, L.; Gallo, L.; Lavacchi, A.; Salvadori, B.; Matteini, P.; Siano, S. “Argento Deaurato” or “Argento Biancheggiato”? A Rare and Interesting Case of Silver Background in Italian Painting of the XIII Century. Appl. Sci. 2020, 10, 2404. [Google Scholar] [CrossRef]
- Olori, A.; Di Pietro, P.; Campoiano, A. Preparation of ultrapure Kbr method for FTIR quantitative analysis. Int. J. Sci. Acad. Res. 2021, 2, 1015–1020. [Google Scholar]
- Pandey, K.K.; Pitman, A.J. FTIR studies of the changes in wood chemistry following decay by brown-rot and white-rot fungi. Int. Biodeterior. Biodegrad. 2003, 52, 151–160. [Google Scholar] [CrossRef]
- Ryan, C.G.; Clayton, E.; Griffin, W.L.; Sie, S.H.; Cousens, D.R. SNIP, a statistics-sensitive background treatment for the quantitative analysis of PIXE spectra in geoscience applications. Nucl. Instrum. Methods Phys. Res. Sect. B 1988, 34, 396–402. [Google Scholar] [CrossRef]


| Raman Frequencies | Assignment | Datasets Mean Values | ANOVA Test (p Value) | ||
|---|---|---|---|---|---|
| FAR | NEAR | IN | |||
| 1663 | lignin | 0.79 | 0.79 | 0.81 | / |
| 1098 | cellulose | 1.78 | 1.53 | 1.42 | 0.037 |
| 1125 | cellulose | 1.66 | 1.52 | 1.36 | 0.070 |
| 1663/1098 | lignin/cellulose | 0.50 | 0.58 | 0.67 | 0.106 |
| 1663/1125 | lignin/cellulose | 0.53 | 0.59 | 0.72 | 0.098 |
| Figures of Merit | FAR | IN | Total |
|---|---|---|---|
| Sensitivity (%) | 93 | 98 | 97 |
| Specificity (%) | 98 | 93 | 97 |
| Efficiency (%) | 96 | 96 | 97 |
| Location Types | Description | Number of Samples |
|---|---|---|
| IN | inside the shallow landslide | 10 |
| NEAR | in the neighbour of a shallow landslide (within 10 m) | 10 |
| FAR | far from shallow landslides (i.e., stable locations) | 10 |
Disclaimer/Publisher’s Note: The statements, opinions and data contained in all publications are solely those of the individual author(s) and contributor(s) and not of MDPI and/or the editor(s). MDPI and/or the editor(s) disclaim responsibility for any injury to people or property resulting from any ideas, methods, instructions or products referred to in the content. |
© 2023 by the authors. Licensee MDPI, Basel, Switzerland. This article is an open access article distributed under the terms and conditions of the Creative Commons Attribution (CC BY) license (https://creativecommons.org/licenses/by/4.0/).
Share and Cite
Marzini, L.; Ciofini, D.; Agresti, J.; Ciaccheri, L.; D’Addario, E.; Disperati, L.; Siano, S.; Osticioli, I. Exploring the Potential of Portable Spectroscopic Techniques for the Biochemical Characterization of Roots in Shallow Landslides. Forests 2023, 14, 825. https://doi.org/10.3390/f14040825
Marzini L, Ciofini D, Agresti J, Ciaccheri L, D’Addario E, Disperati L, Siano S, Osticioli I. Exploring the Potential of Portable Spectroscopic Techniques for the Biochemical Characterization of Roots in Shallow Landslides. Forests. 2023; 14(4):825. https://doi.org/10.3390/f14040825
Chicago/Turabian StyleMarzini, Lorenzo, Daniele Ciofini, Juri Agresti, Leonardo Ciaccheri, Enrico D’Addario, Leonardo Disperati, Salvatore Siano, and Iacopo Osticioli. 2023. "Exploring the Potential of Portable Spectroscopic Techniques for the Biochemical Characterization of Roots in Shallow Landslides" Forests 14, no. 4: 825. https://doi.org/10.3390/f14040825