Article

Assessing the Carbon Storage Potential of a Young Mangrove Plantation in Myanmar

1
School of Forestry, Beijing Forestry University, Tsinghua East Road, Haidian District, Beijing 100083, China
2
School of Ecology and Nature Conservation, Beijing Forestry University, Tsinghua East Road, Haidian District, Beijing 100083, China
3
Key Laboratory of Water Cycle and Related Land Surface Processes, Institute of Geographic Sciences and Natural Resources Research, Chinese Academy of Sciences, Beijing 100101, China
*
Author to whom correspondence should be addressed.
Forests 2023, 14(4), 824; https://doi.org/10.3390/f14040824
Submission received: 2 February 2023 / Revised: 26 February 2023 / Accepted: 3 March 2023 / Published: 18 April 2023
(This article belongs to the Section Forest Ecology and Management)

Abstract

:
Mangrove forests provide many ecosystem services to coastal communities and are essential in addressing climate change and coastal erosion. Unfortunately, physical pressures, including timber extraction, firewood, and land conversion to agriculture and aquaculture have threatened this ecosystem. Recognizing the reduction in mangrove coverage, mangrove plantations are widely being utilized in many countries to restore ecosystem services, including capturing and storing atmospheric carbon. However, it is still being determined whether mangrove plantations can sequester carbon as much as natural mangroves. This study investigated the carbon storage potential of the planted mangrove in the Ayeyarwady Region, Myanmar. Field data: the diameter at breast height (DBH) ≥ 5 cm and the total tree height (H) ≥ 1 m of all standing trees within each plot were measured and recorded according to species and were used to calculate biomass and carbon storage. The findings of the present study described that the overall average above- and belowground carbon storage of the mangrove plantation was 100.34 ± 50.70 Mg C ha−1 and 34.76 ± 16.59 Mg C ha−1, respectively. Biomass and carbon storage were closely related to the stand basal area. Among species, the Avicennia officinalis species contributed the highest total biomass carbon accumulation. The average amount of carbon sequestration by the planted mangroves was 495.85 MgCO2-eq ha−1. According to the findings, mangrove plantations could achieve benefits in terms of carbon storage and sequestration in biomass with suitable species selection and management. This finding can be applied to mangrove plantation management at the regional and global levels.

1. Introduction

Mangroves are salt-tolerant, woody plants that grow in tropical and subtropical coastal areas across the globe. They are considered to be the most productive ecosystem that provides many tangible and intangible benefits to coastal communities, such as timber and fuelwood, spiritual and aesthetic cultural values, nursery and breeding for many fishes, and habitats for honey bees [1], as well as coastal protection. Moreover, they are one of the most carbon-rich ecosystems and act as a sink for atmospheric carbon, sequestering more carbon dioxide than tropical forests [2,3,4,5]. However, mangroves have been destroyed over the last two decades [6]. About 60% of mangrove forest losses recorded between 2000 and 2016 were due to human pressures, particularly conversion to agriculture and aquaculture [7,8]. Anthropogenic pressures on mangrove ecosystems, such as the growing demand for timber and wood and the expansion of agriculture and aquaculture, have further exacerbated the problem of global climate change [9]. Climate change has a wide-ranging impact on our society, including changing weather patterns, rising sea levels, and extreme weather events. Therefore, mangrove reforestation and restoration are considered to be nature-based solutions for increasing the resilience of vulnerable coastal areas to the adverse effect of climate change [10,11,12]. Thus, many countries, including Myanmar, have begun mangrove reforestation by planting easy-to-propagate mangrove species to restore their degraded mangrove sites or mangrove afforestation on newly accreted land.
Myanmar has 8.8 percent of Southeast Asia’s mangroves [13,14]. Of these, 45 percent are in the Bogalay, Pyapon, and Latputta townships of the Ayeyarwady Delta, and the remaining areas are found in the Tanintharyi region (30%) and the Rakhine region (25%). The total mangrove area of Myanmar in 1980 was about 659,019 ha. However, it declined to 462,954 ha by 2015 [15]. Therefore, Myanmar is a known “mangrove deforestation hotspot” in Southeast Asia. The significant drivers of mangrove deforestation in Myanmar are converting mangrove areas into agriculture, aquaculture (shrimp farming), and timber extraction. It is estimated that greenhouse gas emission due to the conversion of mangrove land into shrimp farming is approximately 120 Mg CO2-eq year−1 [16]. This is because of the high demand and market value of the shrimp, which led to applying unsustainable shrimp farming practices, leading to environmental impact [17].
The reforestation and restoration program of mangroves was initiated in Myanmar in 1980. Forest restoration has resulted in 14,000 hectares (ha) of re-planted mangrove forest, mostly on old rice paddies and abandoned agricultural sites between 1980 and 2004 [18]. Mangrove restoration by planting a single or a few species may restore organic carbon compared to the natural mangrove forests with high diversity [19], and mangrove plantations play an essential role in climate change mitigation by reducing carbon dioxide emissions [20].
Study on estimating mangrove forest biomass is becoming essential in managing degraded mangrove ecosystems and assessing the impact of deforestation and global carbon balance [21]. Several studies have been developed to estimate the biomass and productivity of planted mangrove forests globally [22,23,24]. However, a study about the carbon storage and sequestration potential of planted mangroves in Myanmar still needs to be explored to determine whether the carbon storage of the planted mangroves can compare to that of natural mangroves. The objectives of the present study were (1) to assess the biomass and vegetation carbon storage potential of a mangrove plantation in Pyindaye Mangrove Forest Reserve, Ayeyarwady Region, Myanmar, and (2) to investigate the relationship between the aboveground biomass and stand structural parameters in terms of basal area, crown area, height, and stem density.

2. Materials and Methods
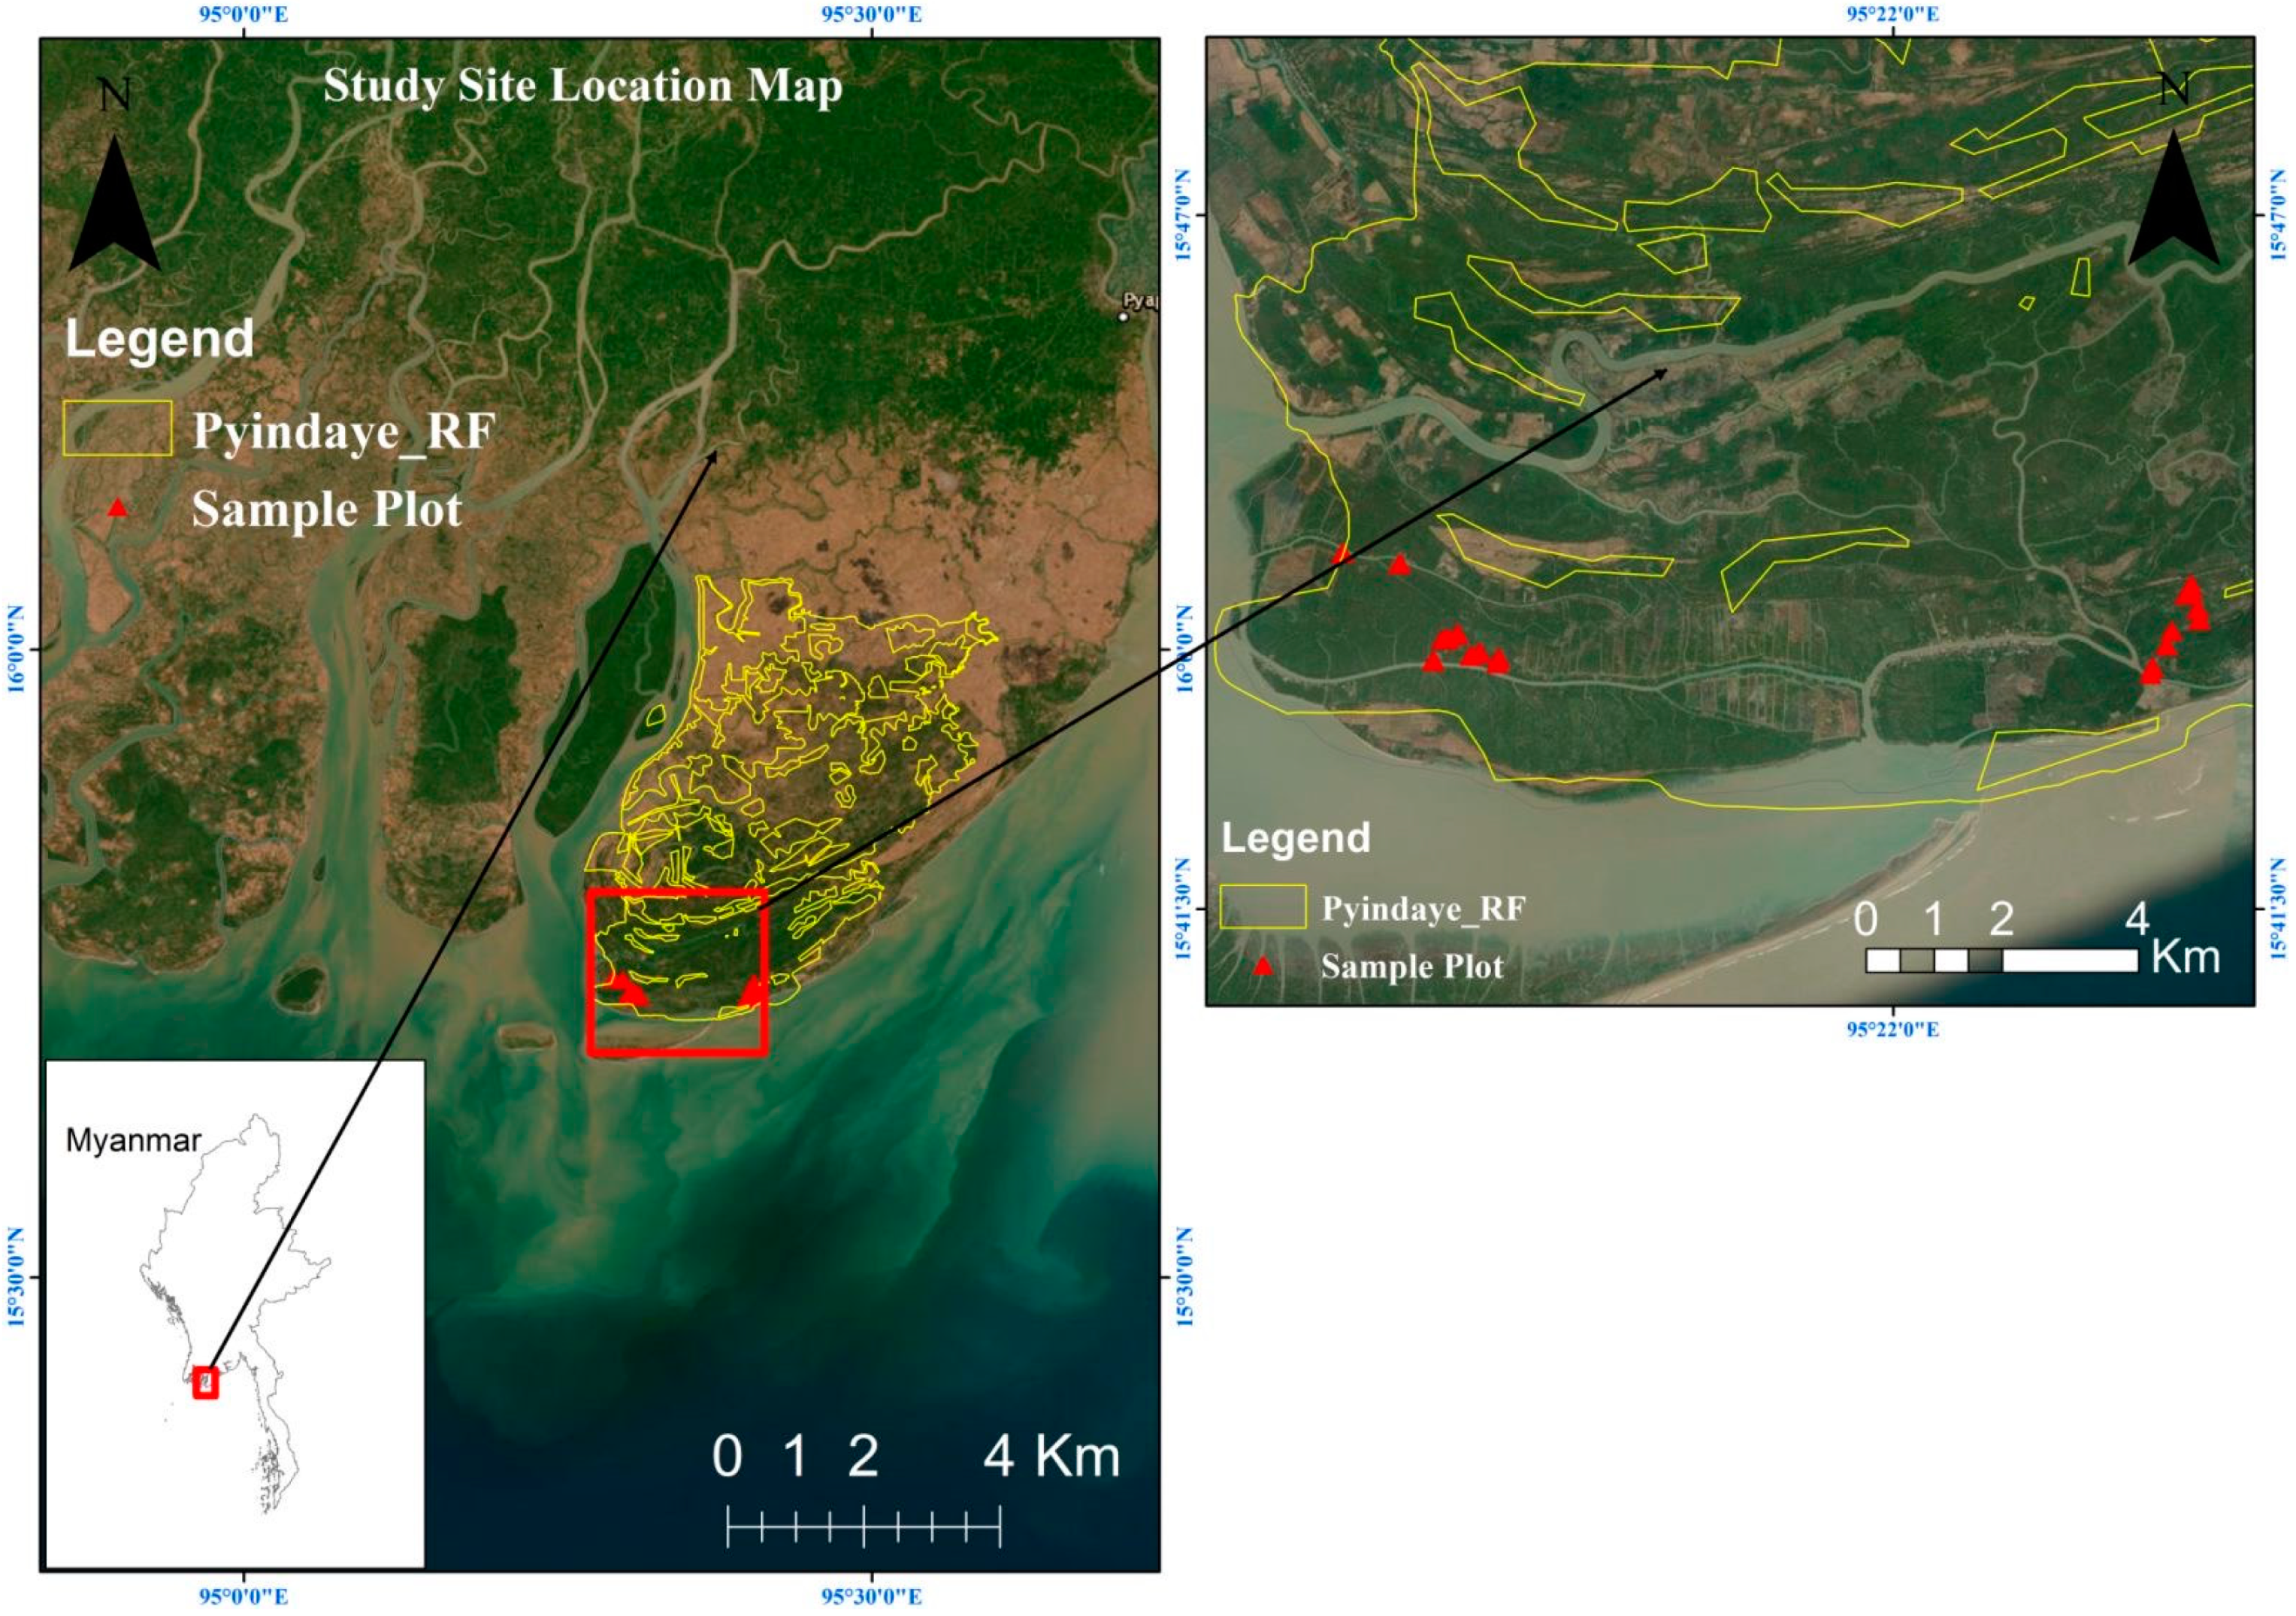
2.1. Study Site

The research was conducted in the Pyindaye Mangrove Forest Reserve (15°47′9.28″ N and 95°23′17.66″ E) that is in the Pyapon township, Ayeyarwady Delta (Figure 1). The Forest Department of Myanmar managed and organized the forest land. The reserve area with 19,075 acres (7719 ha) was divided into 66 management compartments. The study was conducted from June to July 2021 in Compartments 61 and 64 of the mangrove plantation. This area has a tropical, seasonal, monsoon climate [25,26]. The rainy southwest monsoon lasts from mid-May to mid-October, and tropical cyclones frequently occur in Myanmar during the monsoon months, causing heavy rainfall that leads to flooding [27]. Late October to mid-February is considered to be the winter season, and mid-February to mid-May is the dry season. The average annual rainfall in the Delta ranges from 2500 mm to 3000 mm [28]. Higher temperatures (26–36 °C) occur in March and mid-May, and lower temperatures (16–29 °C) occur in December and February. The Ayeyarwady Delta has tides rising and falling twice daily; each rise and fall duration is around six hours [29]. The Ayeyarwady Delta is a vast alluvial floodplain because this area receives a large volume of freshwater that flows from the Ayeyarwady river and saline tidewater from the sea. So, this river is one of the highest rivers, which carries the highest sediment load. The soil type is generally clay or clay loam [25].

2.2. Field Survey and Data Analysis

Field data were collected from twenty-four plots of dimensions 20 m × 20 m to estimate the tree density of individuals within plots. The total sampling area covered 9600 m2 (0.96 ha). The number of plots was randomly selected because of different land uses. A global positioning system (GPS) was used to provide the exact position of each sample plot, and the location of each sample point was recorded. All trees in the sample plots with height (H) ≥ 1m and diameter at breast height (DBH) ≥ 5 cm were numbered and measured. The crown diameter (CD) was determined by measuring the first crown width at the horizontal widest point of the crown through the center and the second crown width perpendicular to the first, and then averaging the two values (Equation (1)); this formed the basis for the canopy area (CA) calculation. The canopy area was then calculated through Equation (2).
CD = (w1 + w2)/2
CA = π 4 CD 2
where CD = crown diameter, w1 = the first crown width at the horizontal widest point of the crown, w2 = the second crown width perpendicular to the first, and CA = canopy area.
Based on the field measurement data, trees were classified into seven DBH classes: (1) 5–10 cm; (2) 11–15 cm; (3) 16–20 cm; (4) 21–25 cm; (5) 26–30 cm; (6) 31–35 cm, and (7) 36–40 cm, and tree density, basal area, biomass, and carbon storage distribution under each DBH class were calculated. Above- and belowground biomass were computed using the following allometric equations: Equations (3) and (4) developed by Komiyama et al. (2008) for Southeast Asia from the DBH measured in the field [30].
AGB = 0.251ꝭD2.46
BGB = 0.199ꝭ0.899D2.22
where AGB = aboveground biomass in kg per tree, D = DBH in cm, BGB = belowground biomass in kilograms per tree, and ꝭ = the wood density of the species.
The wood density of different mangrove species was taken from the Global Wood Density Database [31] using the BIOMASS package with the getWoodDensity function in R (Version 4.2.2, Vienna, Austria). The calculated biomass densities were multiplied by conversion factors of 0.48 and 0.39 to obtain above- and below-ground carbon [32]. A simple multiplication factor, 3.67, was used to convert the estimated total vegetation carbon storage of the present study to carbon dioxide (CO2) equivalents (CO2-eq). This factor is the molecular weight ratio between carbon and carbon dioxide [33].

2.3. Statistical Analysis

Statistical data analysis was performed using R-programming (Version 4.2.2, Vienna, Austria). All data were tested for normality using the Shapiro–Wilk test and were ln-transformed if necessary. The strength of the relationship between the two variables was assessed using Pearson’s correlation coefficient (γ). Here, the correlation coefficient was applied to estimate the correlation of stand structural parameters (mean DBH, mean H, stand basal area, and crown area) and aboveground biomass (AGB). The correlation plot was performed using the ggplot2 package. Then, a simple linear regression was performed using the lm function in the stats package to examine the relationship between AGB and stand basal area. The analysis used the least significant difference (p < 0.05). We reported all of the data in the present study as mean ± standard deviation.

3. Results

3.1. Forest Structure

In Pyindaye Mangrove Forest Reserve, twenty-four plots were sampled (i.e., 0.96 ha) where one thousand nine hundred and forty-one (1941) trees were measured. Ten mangrove species belonging to five families were recorded in the study sites: Avicennia officinalis, Avicennia marina, Bruguiera gymnorhiza, Bruguiera sexangula, Rhizophora apiculata, Heritiera fomes, Excoecaria agallocha, Ceriops decandra, Xylocarpus moluccensis, and Rhizophora mucronata (Table 1). The average tree density and basal area of the mangrove stand in the study sites were 2022 ± 492 trees ha−1 and 28.05 ± 12.20 m2 ha−1, respectively, and the tree density and basal area range were from 1275 to 2975 trees ha−1 and from 4.21 to 55.18 m2 ha−1, respectively (Table A1). According to the vegetation analysis, the most significant quantity of trees was found at Plot 15 (119 trees per plot/ 2975 trees ha−1). The smallest was found at Plots 8 and 18 (51 trees per plot/1275 trees ha−1) (Table A1). The sample plots were dominated by A. officinalis and A. marina, which are widespread species used in mangrove afforestation projects in Myanmar. The densities of A. officinalis and A. marina were 17,925 stems/ha and 11,450 stems/ha, representing 36.94% and 23.60% of the total stand density (Table 1). The dominance of the other species in the present study sites included B. gymnorhiza, B. sexangula, and R. apiculata. The density of the remaining species, such as H. fomes, E. agallocha, C. decandra, X. moluccensis, and R. mucronata, was very low.
The DBH class size distribution of mangrove trees in the study area showed a reverse J-shaped curve (Figure 2). The number of individuals decreases with increasing the DBH class size. The tree density in DBH class-1 was 48.12%, followed by DBH class-2 (30.55%), DBH class-3 (13.14%), DBH class-4 (5.10%), DBH class-5 (1.34%), DBH class-6 (1.08%), and DBH class-7 (0.67%) (Figure 2). Stand age also affects the stand structure (Table 2). The average tree density decreased with the stand age. The 5-year stand had a lower density than 4- and 3-year-old stands. However, the average diameter and height of the tree tend to increase with the stand age. The diameter of trees increased from 11.77 to 11.79 to 12.43 cm, and the height of the tree increased from 3.65, 3.70, and 4.11 m for 3-, 4-, and 5-year-old stands, respectively. The average basal area (±SD) for the 5-year-old stand was 25.52 ± 10.01 m2 ha−1, and their range varied from 16.34 to 47.96 m2 ha−1. The average basal area for the 3- and 4-year stands were 30.46 ± 12.88 m2 ha−1 and 28.16 ± 14.46 m2 ha−1, respectively. However, the annual increment of diameter and height showed the opposite pattern. The diameter and height increment decreased with the increasing of the stand age. The result described that the diameter and height increment decreased by 3.92 cm, 2.95 cm, and 2.45 cm per year and 1.22 m, 0.93 m, and 0.82 m per year, respectively, from the 3-year to 4-year to 5-year stand.

3.2. Vegetation Biomass and Carbon Storage

The average total biomass and carbon storage of mangrove stands in the present study were 302.64 ± 150.30 Mg ha−1 and 135.11 ± 67.24 Mg C ha−1, respectively (Table A1). The aboveground biomass (AGB) ranged between 23.13 Mg ha−1 and 406.82 Mg ha−1 with an average (±SD) value of 213.50 ± 107.87 Mg ha−1, while at the same time, belowground biomass (BGB) ranged between 11.97 Mg ha−1 and 168.45 Mg ha−1 with an average value of 89.14 ± 42.54 Mg ha−1. The average AGB value for the 5-year-old stand was 187.03 ± 94.63 Mg ha−1, which was lower than the values of the 4- and 3-year-old stands, at 224.03 ± 130.44 and 229.45 ± 105.11 Mg ha−1 (Table 2). The average BGB value for the 5-year-old stand was 79.06 ± 34.18 Mg ha−1, which was lower than the values of the 4- and 3-year-old stands, at 92.52 ± 51.97 and 95.83 ± 43.56 Mg ha−1. The above- and belowground biomass distribution in different diameter classes described that most of the AGB and BGB values were due to trees with a DBH between 11 cm and 20 cm, 49.55% of the total AGB and 51.17% of total BGB (Table A2). Biomass accumulation was 37.41 and 15.81 Mg ha−1 year−1 for the 5-year-old stand, which was lower than the 3- and 4-year-old stands. The present study’s aboveground biomass to belowground biomass ratio (T/R) varied from 1.93 to 2.60 with an average value of 2.35 ± 0.15.
We examined the relationship between aboveground biomass (AGB) and the stand structural parameters of mean height, mean DBH, stem density, and basal area. According to the results, four stand structural parameters of mean DBH, mean height, basal area, and crown area were significantly positively correlated with AGB (Table 3). Among them, the strongest correlation was found between basal area and biomass (r = 0.98, p < 0.001) (Figure 3), and a weak correlation was found between AGB and stem density (r = 0.340).
Above- and belowground carbon storage ranged between 10.87 and 191.21 Mg C ha−1 and 4.67 and 65.69 Mg C ha−1 for the present study, respectively (Table A1). The average AGC and BGC storage concentration at twenty-four plots was 100.34 ± 50.70 Mg C ha−1 and 34.76 ± 16.59 Mg C ha−1. The vegetation carbon storage values for 3, 4, and 5-year-old stands were 1161.71, 1130.99, and 949.89 Mg C ha−1, respectively (Table A1). Then, above- and belowground carbon storage contributed to the total biomass by 74.27% and 25.73%, respectively, for all ages of the planted mangroves.
Among ten mangrove species, A. officinalis contributed the most to the total above- and belowground biomass (2731.39 and 1107.99 Mg ha−1), followed by A. marina (1189.24 and 499.14 Mg ha−1) and R. apiculata (594.82 and 251.74 Mg ha−1) with corresponding carbon storage (Table 1). Although R. apiculata had low stem density, it had higher above- and belowground carbon storage than B. sexangula and B. gymnorhiza (Figure 4). R. apiculata had a high basal area and most of the stem density was in the DBH class-2 and class-3. The carbon storage values of the remaining species C. decandra, X. moluccensis, and R. mucronata were very low.

3.3. The Relationship between Aboveground Biomass and Stand Basal Area

The linear regression analysis was used to estimate the relationship between the aboveground biomass per plot (Mg/ha) as the dependent variable and the stand basal area per plot (m2/ha) as the independent variable (Table 4). A significant and positive relationship was found between aboveground biomass (Mg/ha) and stand basal area (m2/ha) at the 0.001 significance level. This result can be statistically interpreted as aboveground biomass increasing by 1.19 units, increasing the stand basal area by one unit, and keeping other factors constant. In this regard, the aboveground biomass increased by 1.19 Mg/ha per 1 m2/ha increase in basal area, and the coefficient of determination (R2) was 0.98.

4. Discussion

Mangrove plantations are the most common way to restore mangrove forests [34]. The present study recorded a total of ten species belonging to five families. Acanthaceae was the dominant family in the present study, including A. officinalis and A. marina. The Myanmar Forest Department has commonly planted the Avicennia species (mainly A. officinalis) and Bruguiera species (mainly B. sexangula) for the rehabilitation and restoration of mangrove forests since 1980, according to the plantation records and other documents [35]. A. officinalis and A. marina were also favored due to their better performance over other species based on local experience. The good performance of the Avicennia species for restoration activities is associated with their ability to grow on newly formed mudflats and their tolerance to hypersaline conditions [36]. Aye and Takeda (2020) described that the survival rate of the Avicennia species is high (70–90%) [35]. Miah et al. (2014) also found that mangrove (especially Avicennia species) plantations were established on the newly formed lands of the shoreline of Bangladesh to protect the coastal areas [37]. The average stand density of the present study (2022 stems ha−1) was higher than in the Ranong mangrove forests of Indonesia (812 stems ha−1) [38].
The average values of the diameter and height of the trees in the present study were (12.00 ± 3.09 cm) and (3.82 ± 0.78 m). Moreover, the mean diameter increments of the present study per year ranged from 2.45 to 3.92 cm for the 5- and 3-year stands. The mean annual increments in diameter varied with the stand age from 0.3 to 1.3 cm for the 21- and 3-year-old afforested stands of the mangrove forests in Mindanao Island of the Philippines [39]. Local abiotic factors such as salinity, rainfall, temperature, etc., and biotic factors such as inter- and intra-specific plant competition affect annual increments in diameter [40]. Moreover, we found that the number of trees in the lowest diameter classes was dominant, and a reverse J-shaped DBH class size distribution occurred in the present study. Additionally, it was observed that mangrove stand age affects the stand structures, increasing diameter and height and decreasing tree density. Similar results of declining tree density with stand age occurred in the restored mangrove forests of Lingayen Gulf, northwestern Philippines [41]. Fromard et al. also described in their study that tree density in the pioneer and young mangrove stands was high with a small diameter, and tree density decreased with an increasing tree size [23].
The overall average biomass and carbon storage values of the present study were 302.64 ± 150.30 Mg ha−1 and 135.11 ± 67.24 Mg C ha−1 (equivalent to 495.85 Mg CO2-eq ha−1). The average aboveground biomass (AGB) value (213.50 ± 107.87 Mg ha−1) of the present study was higher than the values of other studies, including on the Sundarbans mangrove forests in Bangladesh (153.7 Mgha−1) [42], the Sofala Bay mangrove forest in Mozambique (134.6 Mg ha−1) [43], and the fringe mangrove forests (R. mangle) in Florida, USA (26.1 Mg ha−1) [44]. At the same time, this value was lower than the findings of Ahmed and Kamruzzaman in the Sundarbans, Bangladesh [45]. They reported that the average aboveground biomass value of their study was 243.44 Mg ha−1. While comparing the biomass value of the present study with others, it was found that biotic factors of species composition, tree density, growth forms, and mangrove stands’ age [46,47] and abiotic factors of precipitation, temperature, and tropical cyclone frequency [48] influence the production of biomass.
The aboveground (AG) to belowground (BG) biomass ratio of the present study was 1:2.35. Globally, the range of average biomass ratio for mangroves was between 2.0 and 3.0 [49]. Comparing the biomass ratio of the present study with others, the average biomass ratio of the Sundarbans mangrove forest was 1:1.54, which is lower than that of the present study [45]. The biomass ratio could be varied by several factors—using different allometric equations and species composition, and including pioneer species dominancy, stand structure, and stand age. The average AG to BG biomass ratio varies depending on forest land types. The biomass ratio for mangroves tends to be lower than that for terrestrial vegetation (5.1–10.7) [50,51]. Mangrove forests store a more significant proportion of biomass in their belowground parts than terrestrial forests because mangrove trees have specialized root structures in order to adapt to extreme environments [52,53].
Based on the relative dominance of the study site, pioneers and fast-growing species such as A. officinalis and A. marina contributed 52.86% and 23.25% to the total biomass and vegetation carbon storage potential of mangrove stands in the present study. In a study conducted by Trissanti et al. in the mangrove forest ecosystem of Karawang Regency of West Java, A. marina was the species with the highest estimated carbon value in their observation site, with the values of biomass (5720.66 ton ha−1), carbon storage (2720.66 ton C ha−1), and carbon sequestration (9984.83 ton CO2-eq ha−1) [54] being taken into account. They explained that fast-growing woody vegetation could absorb more carbon than slow-growing vegetation. Moreover, the present study observed that most biomass and carbon storage values came from the trees with DBH classes of 11–15 and 16–20 cm (Table A2). Grime also observed that the aboveground biomass variation was significantly correlated with the size of the trees [55].
The effect of the stand structures on aboveground biomass was investigated in the present study. The finding of the present study described the stand’s structural variables, including basal area, mean DBH, and mean height, the influence of biomass, and the carbon storage potential of mangrove stands rather than stand density (Table 3). Similarly, Mizanur Rahman et al. described that stand density did not have any significant effect on the biomass and carbon storage of the Sundarbans mangrove forest [47]. However, Gross et al. observed that the stand density was positively correlated with the AGB of the mangrove (Pelliciera rhizophorae) forest on the Pacific Coast of Panama [56]. Azad et al. also found a slight increase in AGB with increasing stand density [46]. The findings of the present study described that the stand basal area had a positive direct effect on aboveground biomass with a Pearson correlation coefficient of 0.98 and coefficient of determination (R2) of 0.98 (Figure 3/Table 4). A similar observation was made by Kamruzzaman et al., and they reported that the stand basal area had a strong positive correlation with aboveground biomass (R2 = 0.98) for the mangrove communities of the Sundarbans, Bangladesh [57]. The coefficient of determination (R2 = 0.99) was obtained for the relationship between stand basal area and carbon storage of the mangrove forests in the Andaman Islands [58]. Furthermore, the relationship between the biomass of Pelliciera rhizophorae (Spearman’s rho = 0.985) and Rhizophora racemosa (Spearman’s rho = 0.967) was observed in the mangrove forest of the Pacific Coast, Panama [56]. All of the studies above used the stand basal area as the proxy for estimating tree biomass and carbon storage because it integrated tree size and number in its measurement [59]. The significant positive correlation between biomass and the basal area explains that the stand structural variable significantly affects biomass and carbon storage.

5. Conclusions

The present study demonstrated the biomass and carbon storage potential of young mangrove plantations in the Ayeyarwady Region. The estimated average carbon storage in mangrove forests was 135.11 ± 67.24 Mg C ha−1, about 74.27% of which was stored in the aboveground biomass, and the remaining 25.73% was in the belowground biomass. The biomass and carbon storage potential of mangrove species varied with different species and size classes. In particular, pioneer and fast-growing mangrove species such as A. officinalis and A. marina have higher biomass accumulation and carbon sequestration potential than other climax species. Trees with a DBH class size of 11–20 cm have a trend of carbon storage potential that is more than other size classes. In addition, it was found that the stand basal area had a strong effect on biomass and carbon storage. The results achieved in this study proved that mangrove plantation plays a significant role in mitigating global climate change. However, plantation forest management is required for successful mangrove restoration.

Author Contributions

Conceptualization, W.N.A.; data curation, W.N.A. and A.W.T.; formal analysis, W.N.A., X.T., J.L. and A.W.T.; investigation, W.N.A. and X.T.; methodology, W.N.A., X.T. and A.W.T.; resources, W.N.A.; software, W.N.A., X.T. and A.W.T.; supervision, X.T.; validation, W.N.A., X.T., J.L. and A.W.T.; writing—original draft, W.N.A.; writing—review and editing, W.N.A., X.T., J.L. and A.W.T. All authors have read and agreed to the published version of the manuscript.

Funding

This research received no external funding.

Data Availability Statement

The data presented in this study are available on request from the corresponding author.

Acknowledgments

The authors gratefully acknowledged the APFNet Scholarship and China Scholarship Council funding for the first author’s studies at Beijing Forestry University. The authors would like to thank everyone who contributed to the fieldwork.

Conflicts of Interest

The authors declare no conflict of interest.

Appendix A

Table A1. Structural characteristics and biomass in each plot in the study site.
PlotStand Age
(Year)
Stem Density (ha−1)Mean DBH (cm)Mean H (m)BA (m2 ha−1)Biomass (Mg ha−1) Carbon Stock (Mg C ha−1)
AGB BGB AGCBGC
142850 (114)10.343.6229.18194.2885.2791.3133.25
241325 (53)6.212.084.2123.1311.9710.874.67
341525 (61)17.494.7043.55359.04141.0168.7554.99
442250 (90)13.674.0042.94348.56138.86163.8254.16
542500 (100)8.133.0415.83102.6047.2248.2218.41
642650 (106)14.124.4942.55385.95163.62181.4063.81
741675 (67)13.333.9427.48208.7786.5598.1233.75
841275 (51)11.063.7219.51169.9065.6579.8525.60
931750 (70)9.713.1116.50117.0349.9355.0019.47
1032175 (87)8.432.9518.55123.7552.7658.1620.58
1151600 (64)11.204.1216.34103.2947.2948.5418.44
1251750 (70)11.463.8519.10119.6154.3256.2121.19
1351650 (66)12.173.9723.01176.9274.1583.1528.92
1451875 (75)12.534.1325.40180.4478.1584.8130.48
1552975 (119)10.93.7230.17200.590.3994.2435.25
1632050 (82)13.004.0930.86213.0091.20100.1135.57
1732675 (107)15.584.6055.18403.47168.45189.6365.69
1851275 (51)20.676.1047.96406.82156.60191.2161.07
1932375 (95)10.563.1729.77226.9593.01106.6736.27
2032450 (98)14.264.3042.55368.91153.62173.3959.91
2132100 (84)9.873.0722.90174.0271.7381.7927.98
2252000 (80)10.093.5419.54141.2461.3866.3823.94
2352050 (82)10.353.4122.65167.3970.2078.6727.38
2431725 (69)12.753.9127.41208.4485.9397.9733.51
Mean ± SD2022 ± 49212.00 ± 3.093.82 ± 0.7828.045 ± 12.20213.50 ± 107.8789.14 ± 42.54100.34 ± 50.7034.76 ± 16.59
Table A2. Distribution of stand structures, biomass, and carbon storage according to diameter class.
DBH Class (cm)Tree Density Avg. DBH (cm)Basal Area
(m2 ha−1)
Biomass (Mg ha−1)Carbon Stock (Mg C ha−1)
AGBBGBAGCBGC
5–1023,350 (48.12%)7.43106.96614.62306.04288.87119.36
11–1514,825 (30.55%)12.78192.441358.05603.30638.28235.29
16–206375 (13.14%)17.39152.371180.71491.39554.93191.64
21–252475 (5.10%)22.77101.19832.34326.92391.20127.50
26–30650 (1.34%)27.6939.23350.85131.74164.90951.38
31–35525 (1.08%)32.4843.54411.41148.92193.3658.08
36–40325 (0.67%)38.2337.36376.01130.95176.7351.07

References

  1. Karimi, Z.; Abdi, E.; Deljouei, A.; Cislaghi, A.; Shirvany, A.; Schwarz, M.; Hales, T.C. Vegetation-Induced Soil Stabilization in Coastal Area: An Example from a Natural Mangrove Forest. Catena (Amst.) 2022, 216, 106410. [Google Scholar] [CrossRef]
  2. Donato, D.C.; Kauffman, J.B.; Murdiyarso, D.; Kurnianto, S.; Stidham, M.; Kanninen, M. Mangroves among the Most Carbon-Rich Forests in the Tropics. Nat. Geosci. 2011, 4, 293–297. [Google Scholar] [CrossRef]
  3. Kauffman, J.B.; Heider, C.; Cole, T.G.; Dwire, K.A.; Donato, D.C. Ecosystem Carbon Stocks of Micronesian Mangrove Forests. Wetlands 2011, 31, 343–352. [Google Scholar] [CrossRef]
  4. Murdiyarso, D.; Purbopuspito, J.; Kauffman, J.B.; Warren, M.W.; Sasmito, S.D.; Donato, D.C.; Manuri, S.; Krisnawati, H.; Taberima, S.; Kurnianto, S. The Potential of Indonesian Mangrove Forests for Global Climate Change Mitigation. Nat. Clim. Chang. 2015, 5, 1089–1092. [Google Scholar] [CrossRef]
  5. NGUYEN, H.-H.; Le, T.A.; Le, T.A.; Tran, T.N.L.; Tran, T.N.L.; Nguyen, H.N.; Nguyen, H.N.; Duong, V.K.L.; Duong, V.K.L.; Bohm, S.; et al. Biomass and carbon stock estimation of coastal mangroves at hai phong coast using remote sensing and field investigation- based data. Vietnam. J. Sci. Technol. 2021, 59, 560–579. [Google Scholar] [CrossRef]
  6. IUCN Real Potential to Restore Mangroves: New Tool Sheds Light | IUCN. Available online: https://www.iucn.org/news/forests/201810/real-potential-restore-mangroves-new-tool-sheds-light (accessed on 27 November 2022).
  7. Goldberg, L.; Lagomasino, D.; Thomas, N.; Fatoyinbo, T. Global Declines in Human-Driven Mangrove Loss. Glob. Chang. Biol. 2020, 26, 5844–5855. [Google Scholar] [CrossRef]
  8. Spalding, M.D.; Maricé, L. (Eds.) The State of the World’s Mangroves 2021; Global Mangrove Alliance, 2021. Available online: https://www.mangrovealliance.org/wp-content/uploads/2021/07/The-State-of-the-Worlds-Mangroves-2021-FINAL.pdf (accessed on 5 June 2022).
  9. FAO. The World’s Mangroves 1980–2005. Available online: http://www.fao.org/3/a-a1427e.pdf (accessed on 5 June 2022).
  10. Dahdouh-Guebas, F.; Jayatissa, L.P.; di Nitto, D.; Bosire, J.O.; Lo Seen, D.; Koedam, N. How Effective Were Mangroves as a Defence against the Recent Tsunami? Curr. Biol. 2005, 15, R443–R447. [Google Scholar] [CrossRef] [PubMed]
  11. Friess, D.A.; Yando, E.S.; Abuchahla, G.M.O.; Adams, J.B.; Cannicci, S.; Canty, S.W.J.; Cavanaugh, K.C.; Connolly, R.M.; Cormier, N.; Dahdouh-Guebas, F.; et al. Mangroves Give Cause for Conservation Optimism, for Now. Curr. Biol. 2020, 30, R153–R154. [Google Scholar] [CrossRef] [PubMed]
  12. Gedan, K.B.; Kirwan, M.L.; Wolanski, E.; Barbier, E.B.; Silliman, B.R. The Present and Future Role of Coastal Wetland Vegetation in Protecting Shorelines: Answering Recent Challenges to the Paradigm. Clim. Chang. 2011, 106, 7–29. [Google Scholar] [CrossRef]
  13. Kyi Myint, K.; Myat Nwe, M.; Lay Mar, T. Study on Morphological Characters of Some Mangrove Plants in South-Eastern Ayeyarwady Delta of Myanmar. J. Aquac. Mar. Biol. 2019, 8, 118–128. [Google Scholar] [CrossRef]
  14. Win, S. Tin-Zar-Ni-Win Vegetative Structure and Zonal Distribution of True Mangroves in Shwe-Thaung-Yan Coastal Areas, Myanmar. J. Aquac. Mar. Biol. 2021, 10, 33–39. [Google Scholar] [CrossRef]
  15. Forest Department. Mangrove Data Book; Forest Department Myanmar: Naypyitaw, Myanmar, 2017. [Google Scholar]
  16. Eid, E.M.; Arshad, M.; Shaltout, K.H.; El-Sheikh, M.A.; Alfarhan, A.H.; Picó, Y.; Barcelo, D. Effect of the Conversion of Mangroves into Shrimp Farms on Carbon Stock in the Sediment along the Southern Red Sea Coast, Saudi Arabia. Environ. Res. 2019, 176, 108536. [Google Scholar] [CrossRef]
  17. Ashton, E.C. Threats to Mangroves and Conservation Strategies. In Mangroves: Biodiversity, Livelihoods and Conservation; Springer: Singapore, 2022; pp. 217–230. [Google Scholar] [CrossRef]
  18. Zöckler, C.; Aung, C. The Mangroves of Myanmar. In Sabkha Ecosystems: Volume VI: Asia/Pacific; Gul, B., Böer, B., Khan, M.A., Clüsener-Godt, M., Hameed, A., Eds.; Springer International Publishing: Cham, Swizerland, 2019; pp. 253–268. [Google Scholar] [CrossRef]
  19. Ellison, A.M. Mangrove Restoration: Do We Know Enough? Restor. Ecol. 2000, 8, 219–229. [Google Scholar] [CrossRef]
  20. Hai, N.T.; Dell, B.; Phuong, V.T.; Harper, R.J. Towards a More Robust Approach for the Restoration of Mangroves in Vietnam. Ann. For. Sci. 2020, 77, 18. [Google Scholar] [CrossRef]
  21. Thant, Y.M.; Kanzaki, M.; Ohta, S.; Than, M.M. Carbon Sequestration by Mangrove Plantations and a Natural Regeneration Stand in the Ayeyarwady Delta, Myanmar. Tropics 2012, 21, 1–10. [Google Scholar] [CrossRef]
  22. Ahmed, S.; Kamruzzaman, M.; Rahman, M.S.; Sakib, N.; Azad, M.S.; Dey, T. Stand Structure and Carbon Storage of a Young Mangrove Plantation Forest in Coastal Area of Bangladesh: The Promise of a Natural Solution. Nat.-Based Solut. 2022, 2, 100025. [Google Scholar] [CrossRef]
  23. Fromard, F.; Puig, H.; Mougin, E.; Marty, G.; Betoulle, J.L.; Cadamuro, L. Structure, above-Ground Biomass and Dynamics of Mangrove Ecosystems: New Data from French Guiana. Oecologia 1998, 115, 39–53. [Google Scholar] [CrossRef] [PubMed]
  24. Cuc, N.T.K.; Hien, H.T. Stand Structure and above ground biomass of Kandelia Obovata Sheue, H.Y. Liu & J. Yong Mangrove Plantations in Northern, Viet Nam. For. Ecol. Manag. 2021, 483, 118720. [Google Scholar] [CrossRef]
  25. JICA. The Study on Integrated Mangrove Management through Community Participation in the Ayeyawady Delta in the Union of Myanmar: Final Report; Burma. Ministry of Forestry, Kokusai Kyōryoku Jigyōdan, Ed.; Nippon Koei Co., Ltd.: Tokyo, Japan, 2005. [Google Scholar]
  26. Ono, K. Locally Appropriate Management of Mangrove Ecosystem—A Case Study in the Ayeyarwady Delta, Myanmar; Yokohama National University: Yokohama, Japan, 2007. [Google Scholar]
  27. Brakenridge, G.R.; Syvitski, J.P.M.; Niebuhr, E.; Overeem, I.; Higgins, S.A.; Kettner, A.J.; Prades, L. Design with Nature: Causation and Avoidance of Catastrophic Flooding, Myanmar. Undefined 2017, 165, 81–109. [Google Scholar] [CrossRef]
  28. Webb, E.L.; Than, M.M. Optimizing Investment Strategies for Mangrove Plantations by Considering Biological and Economic Parameters. J. Coast. Conserv. 2000, 6, 181–190. [Google Scholar] [CrossRef]
  29. Kogo, M. Final Report on Mangrove Reforestation Feasibility Study in the Ayeyarwady Delta; MYA/90/003 Field Document No.6; UNDP/FAO: Yangon, Myanmar, 1993. [Google Scholar]
  30. Komiyama, A.; Poungparn, S.; Kato, S. Common Allometric Equations for Estimating the Tree Weight of Mangroves. J. Trop. Ecol. 2005, 21, 471–477. [Google Scholar] [CrossRef]
  31. Chave, J.; Coomes, D.; Jansen, S.; Lewis, S.L.; Swenson, N.G.; Zanne, A.E. Towards a Worldwide Wood Economics Spectrum. Ecol. Lett. 2009, 12, 351–366. [Google Scholar] [CrossRef]
  32. IPCC 2006 IPCC Guidelines for National Greenhouse Gas Inventories—IPCC. Available online: https://www.ipcc.ch/report/2006-ipcc-guidelines-for-national-greenhouse-gas-inventories/ (accessed on 17 September 2021).
  33. Kauffman, J.B.; Donato, D.C. Protocols for the Measurement, Monitoring and Reporting of Structure, Biomass and Carbon Stocks in Mangrove Forests; CFIOR: Bogor, Indonesia, 2012. [Google Scholar] [CrossRef]
  34. Waters, H. Mangrove Restoration: Letting Mother Nature Do the Work. Available online: https://ocean.si.edu/ocean-life/plants-algae/mangrove-restoration-letting-mother-nature-do-work (accessed on 14 December 2022).
  35. Aye, W.M.; Takeda, S. Conversion of Abandoned Paddy Fields to Productive Land through Mangrove Restoration in Myanmar’s Ayeyarwady Delta. Paddy Water Environ. 2020, 18, 417–429. [Google Scholar] [CrossRef]
  36. Triest, L.; del Socorro, A.; Gado, V.J.; Mazo, A.M.; Sierens, T. Avicennia Genetic Diversity and Fine-Scaled Structure Influenced by Coastal Proximity of Mangrove Fragments. Front. Mar. Sci. 2021, 8, 638. [Google Scholar] [CrossRef]
  37. Miah, M.A.Q.; Islam, S.A.; Habib, M.A.; Moula, M.G. Growth Performance of Avicennia Officinalis L. and the Effect of Spacing on Growth and Yield of Trees Planted in the Western Coastal Belt of Bangladesh. J. For. Res. 2014, 25, 835–838. [Google Scholar] [CrossRef]
  38. IUCN Ecology and Management of Mangroves—Resource | IUCN. Available online: https://www.iucn.org/resources/publication/ecology-and-management-mangroves (accessed on 27 November 2022).
  39. Sharma, S.; Nadaoka, K.; Nakaoka, M.; Uy, W.H.; MacKenzie, R.A.; Friess, D.A.; Fortes, M.D. Growth Performance and Structure of a Mangrove Afforestation Project on a Former Seagrass Bed, Mindanao Island, Philippines. Hydrobiologia 2017, 803, 359–371. [Google Scholar] [CrossRef]
  40. Menezes, M.; Berger, U.; Worbes, M. Annual Growth Rings and Long-Term Growth Patterns of Mangrove Trees from the Bragança Peninsula, North Brazil. Wetl. Ecol. Manag. 2003, 11, 233–242. [Google Scholar] [CrossRef]
  41. Salmo, S.G.; Lovelock, C.; Duke, N.C. Vegetation and Soil Characteristics as Indicators of Restoration Trajectories in Restored Mangroves. Hydrobiologia 2013, 720, 1–18. [Google Scholar] [CrossRef]
  42. Kamruzzaman, M.; Ahmed, S.; Paul, S.; Rahman, M.M.; Osawa, A. Stand Structure and Carbon Storage in the Oligohaline Zone of the Sundarbans Mangrove Forest, Bangladesh. For. Sci. Technol. 2018, 14, 23–28. [Google Scholar] [CrossRef]
  43. Sitoe, A.A.; Júnior, L.; Mandlate, C.; Guedes, B.S. Biomass and Carbon Stocks of Sofala Bay Mangrove Forests. Forests 2014, 5, 1967–1981. [Google Scholar] [CrossRef]
  44. Ross, M.S.; Ruiz, P.L.; Telesnicki, G.J.; Meeder, J.F. Estimating Above-Ground Biomass and Production in Mangrove Communities of Biscayne National Park, Florida (U.S.A.). Wetl. Ecol. Manag. 2001, 9, 27–37. [Google Scholar] [CrossRef]
  45. Ahmed, S.; Kamruzzaman, M. Species-Specific Biomass and Carbon Flux in Sundarbans Mangrove Forest, Bangladesh: Response to Stand and Weather Variables. Biomass Bioenergy 2021, 153, 106215. [Google Scholar] [CrossRef]
  46. Azad, M.S.; Kamruzzaman, M.; Osawa, A. Quantification and Understanding of Above and Belowground Biomass in Medium Saline Zone of the Sundarbans, Bangladesh: The Relationships with Forest Attributes. J. Sustain. For. 2019, 39, 331–345. [Google Scholar] [CrossRef]
  47. Mizanur Rahman, M.; Nabiul Islam Khan, M.; Fazlul Hoque, A.K.; Ahmed, I. Carbon Stock in the Sundarbans Mangrove Forest: Spatial Variations in Vegetation Types and Salinity Zones. Wetl. Ecol. Manag. 2015, 23, 269–283. [Google Scholar] [CrossRef]
  48. Simard, M.; Fatoyinbo, L.; Smetanka, C.; Rivera-Monroy, V.H.; Castañeda-Moya, E.; Thomas, N.; van der Stocken, T. Mangrove Canopy Height Globally Related to Precipitation, Temperature and Cyclone Frequency. Nat. Geosci. 2018, 12, 40–45. [Google Scholar] [CrossRef]
  49. Komiyama, A.; Ong, J.E.; Poungparn, S. Allometry, Biomass, and Productivity of Mangrove Forests: A Review. Aquat. Bot. 2008, 89, 128–137. [Google Scholar] [CrossRef]
  50. Hozumi, K.; Yoda, K.; Kokawa, S.; Kira, T. Production Ecology of Tropical Rain Forests in Southwestern Cambodia: I. Plant Biomass. Nat. Life Southeast Asia 1969, 6, 1–51. [Google Scholar]
  51. Ogawa, H.; Yoda, K.; Ogino, K.; Kira, T. Comparative Ecological Studies on Three Main Types of Forest Vegetation in Thailand II. Plant Biomass. Nat. Life Southeast Asia 1965, 4, 49–80. [Google Scholar]
  52. Ball, M.C. Salinity Tolerance in the Mangroves Aegiceras Corniculatum and Avicennia Marina. I: Water Use in Relation to Growth, Carbon Partitioning, and Salt Balance. Aust. J. Plant. Physiol. 1988, 15, 447–464. [Google Scholar] [CrossRef]
  53. Kajimoto, T.; Osawa, A.; Usoltsev, V.A.; Abaimov, A.P. Biomass and Productivity of Siberian Larch Forest Ecosystems. Permafr. Ecosyst. 2010, 209, 99–122. [Google Scholar] [CrossRef]
  54. Trissanti, V.N.; Amalo, L.F.; Handayani, L.D.W.; Nugroho, D.; Yuliani, A.R.; Mulyana, D. The Estimation of Biomass and Carbon Stocks in Mangrove Forest Ecosystem of Karawang Regency, West Java. IOP Conf. Ser. Earth Environ. Sci. 2022, 1109, 012099. [Google Scholar] [CrossRef]
  55. Grime, J.P. Benefits of Plant Diversity to Ecosystems: Immediate, Filter and Founder Effects. J. Ecol. 1998, 86, 902–910. [Google Scholar] [CrossRef]
  56. Gross, J.; Flores, E.E.; Schwendenmann, L. Stand Structure and Aboveground Biomass of a Pelliciera Rhizophorae Mangrove Forest, Gulf of Monitjo Ramsar Site, Pacific Coast, Panama. Wetlands 2014, 34, 55–65. [Google Scholar] [CrossRef]
  57. Kamruzzaman, M.; Ahmed, S.; Osawa, A. Biomass and Net Primary Productivity of Mangrove Communities along the Oligohaline Zone of Sundarbans, Bangladesh. For. Ecosyst. 2017, 4, 1–9. [Google Scholar] [CrossRef]
  58. Ragavan, P.; Kumar, S.; Kathiresan, K.; Mohan, P.M.; Jayaraj, R.S.C.; Ravichandaran, K.; Rana, T.S. Biomass and Vegetation Carbon Stock in Mangrove Forests of the Andaman Islands, India. Hydrobiologia 2021, 848, 4673–4693. [Google Scholar] [CrossRef]
  59. Torres, A.B.; Lovett, J.C. Using Basal Area to Estimate Aboveground Carbon Stocks in Forests: La Primavera Biosphere’s Reserve, Mexico. Forestry 2013, 86, 267–281. [Google Scholar] [CrossRef]
Figure 1. Map of the study sites. The basemap used was “World Imagery”, 12 March 2021 (sources: Esri, Maxar, GeoEye, Earthstar Geographics, CNES/Airbus DS, USDA, USGS, AeroGRID, IGN, and the GIS User Community, v10.8).
Forests 14 00824 g001
Figure 2. Diameter class distribution of tree density and basal area in the mangrove stand of the study site.
Forests 14 00824 g002
Figure 3. The relationship between the aboveground biomass (AGB) and basal area per plot.
Forests 14 00824 g003
Figure 4. (a) Aboveground carbon storage. (b) Belowground carbon storage based on the diameter class distribution of different mangrove species in the study area. Ao = Avicennia officinalis, Am = Avicennia marina, Ra = Rhizophora apiculata, Bs = Bruguiera sexangula, Hf = Heritiera fomes, Bg = Bruguiera gymnorhiza, Ea = Excoecaria agallocha, Cd = Ceriops decandra, Xm = Xylocarpus moluccensis, Rm = Rhizophora mucronata.
Forests 14 00824 g004
Table 1. Structural composition of the recorded species in the study site.
No.SpeciesFamilyStems ha−1Basal Area (m2 ha−1)Biomass
(Mg ha−1)
Carbon Stock
(Mg C ha−1)
AGBBGBAGCBGC
1.Avicennia officinalis L.Acanthaceae 17,925357.712731.391107.991283.75432.12
2.Avicennia marina (Forssk.) Vierh.Acanthaceae11,450157.721189.24499.14558.94194.66
3.Bruguiera gymnorhiza (L.) Lam.Rhizophoraceae672521.52126.2565.0359.3425.36
4.Bruguiera sexangula (Lour.) Poir.Rhizophoraceae 575032.69217.30103.36102.1340.31
5.Rhizophora apiculata Blume.Rhizophoraceae400064.20594.82251.74279.5798.18
6.Heritiera fomes Banks.Malvaceae160015.83134.0158.4762.9822.80
7.Excoecaria agallocha L.Euphorbiaceae77522.16123.6749.8758.1319.45
8.Ceriops decandra (Griff.) W.Theob.Rhizophoraceae1250.634.122.011.940.78
9.Xylocarpus moluccensis (Lam.) M.Roem.Meliaceae1250.512.511.301.180.51
10.Rhizophora mucronata Poir.Rhizophoraceae500.120.690.370.320.14
Table 2. Distribution of stand structures, biomass, and carbon storage according to stand age.
Stand Age
(Year)
Avg. Stem Density (ha−1)Mean DBH (cm)Mean H
(m)
BA
(m2 ha−1)
Biomass (Mg ha−1)Carbon Stock (Mg C ha−1)
AGBBGBAGCBGC
32163 ± 33111.77 ± 2.503.65 ± 0.6530.46 ± 12.88229.45 ± 105.1195.83 ± 43.56107.84 ± 49.4037.37 ± 16.99
42006 ± 62911.79 ± 3.613.70 ± 0.8328.16 ± 14.46224.03 ± 130.4492.52 ± 51.97105.29 ± 61.3136.08 ± 20.27
51897 ± 50112.43 ± 3.434.11 ± 0.8525.52 ± 10.01187.03 ± 94.6379.06 ± 34.1887.90 ± 44.4730.83 ± 13.33
Table 3. The correlation between the stand structure variables and aboveground biomass of the mangrove stand.
ParametersDBH (cm)Height (m)Stem Density (ha−1)Basal Area
(m2 ha−1)
Crown Area
(m2)
Height (m)0.928 ***-
Stem density (n ha−1)−0.147−0.131--
Basal area (m2 ha−1)0.830 ***0.694 ***0.372-
Crown area (m2)0.907 ***0.845 ***−0.336 *0.632 ***-
AGB (Mg ha−1)0.824 ***0.671 ***0.3400.987 ***0.580 ***
Significance levels: * 0.05, and *** 0.001.
Table 4. Regression analysis result of stand basal area and aboveground biomass (AGB).
VariableCoefficientStandard Errort-Statisticsp-Value
Intercept1.370.1499.2190.0000 ***
Stand basal area (m2/ha)1.190.44926.5240.0000 ***
*** Indicates being statistically significant at α = 0.001 significance level.
Disclaimer/Publisher’s Note: The statements, opinions and data contained in all publications are solely those of the individual author(s) and contributor(s) and not of MDPI and/or the editor(s). MDPI and/or the editor(s) disclaim responsibility for any injury to people or property resulting from any ideas, methods, instructions or products referred to in the content.

