Article

Study on the Spatial Evolution of China’s Pulp and Paper Product Import Trade and Its Influencing Factors

School of Economics and Management, Beijing Forestry University, Beijing 100083, China
*
Authors to whom correspondence should be addressed.
Forests 2023, 14(4), 674; https://doi.org/10.3390/f14040674
Submission received: 24 February 2023 / Revised: 14 March 2023 / Accepted: 20 March 2023 / Published: 24 March 2023
(This article belongs to the Section Forest Economics, Policy, and Social Science)

Abstract

:
The purpose of this research is to study the changes in the market structure of China’s pulp and paper product imports. In particular, the import trade environment and market layout of Chinese pulp and paper products have changed under the international context of the coronavirus pandemic and the Sino-US trade dispute and the domestic policy context of zero imports of Chinese waste paper. This study attempts to fill the gap regarding the influencing factors of market structure, while contributing new ideas on China’s trade in pulp and paper products. Based on pulp and paper product import and export trade data from 2005 to 2021, a trade gravity model was used to explore the changes in the share of China’s trade partners for pulp and paper product imports and their influencing factors. The results indicated that the outbreak of COVID-19 led to a significant increase in China’s imports of packaging paper products, bringing about an increase in Indonesia’s status as a partner in China’s pulp and paper product trade. The US-China trade dispute had an impact on pulp and paper product trade between the two countries, with China’s tax countermeasures causing the US to lose its status as a trading partner in China for pulp and paper product imports. The center of gravity for paper product imports has moved from the US and Japan to Indonesia and Russia. The restrictions on waste paper imports have shifted the focus of China’s paper raw material imports, with the US no longer being the main importer of China’s paper raw materials. Specifically, the main importers of wood pulp are Brazil and Chile, while the main importers of waste paper pulp are Thailand and Malaysia. In the future, China needs to continuously strengthen dialogue with the United States to resolve trade disputes and create a favorable environment for trade in pulp and paper products. At the same time, China’s paper enterprises should strengthen the expansion of the Southeast Asian market and reduce dependence on the US market, and China should continue to improve the waste paper recycling system and improve the utilization rate of domestic waste paper.

1. Introduction

As an important participant in the global trade of pulp and paper products, China’s trade market structure is affected by both the international environment and domestic policies. With the COVID-19 pandemic, which began in 2019, the global economic downturn led to a shock to the paper industry chain in various countries [1] and a disruption in the supply chain of pulp and paper products [2]. At the same time, the popularity of domestic online shopping during the pandemic led to a significant increase in domestic demand for packaging paper products. The US has always been an important pulp and paper product trade partner of China, but in September 2018, the US government announced a 10% tariff on USD 22.2 billion worth of Chinese imports of pulp and paper products. As a negative external impact, the tariff policy is not conducive to the normal conduct of trade in pulp and paper products between China and the United States, and thus has affected China’s pulp and paper product import trade market structure. For a long time, waste paper has been imported in large quantities as an important raw material for paper making in China. Moreover, the importation of waste paper shows a high degree of market concentration and high market share in the United States. Because of this, the ever-tightening solid waste import restriction policy and trade friction between China and the United States have become important factors affecting China’s import market structure of pulp and paper products. Coupled with the global supply chain crisis under the pandemic, which exacerbated trade protectionism, the international trade environment for raw materials and products of China’s paper industry has changed. Therefore, within the new trade environment, studying the impact of different factors on China’s pulp and paper product import market structure is not only important for China’s paper industry to adapt to the new international trade environment, promoting industrial development, but also beneficial to promote the sustainable development of the world’s forestry and provide reference for forestry industry decision-making.
A great deal of research has been carried out on the spatial evolution of the market structure of forest products in international trade. Some research shows that there is huge scope for future growth in forest product exports to China, with a significant increase in pulp and paper product imports from developing countries such as Chile, Indonesia, and Malaysia, with an increase in the importance of forest-rich countries in the Asia-Pacific region in supplying China’s expanding demand for pulp and paper products [3,4]. The tariff and non-tariff barriers will trigger a shift in the trade pattern of Chinese pulp and paper products, resulting in a decrease in the share of imports from countries with trade barriers and an increase in domestic production to achieve self-sufficiency [5,6,7,8]. The Natural Forest Conservation Program in China will increase the share of Russia in China’s timber product imports [9]. The accession of China to the World Trade Organization has increased forest product imports, of which the share of the Association of Southeast Asian Nations has grown significantly. China’s accession to the WTO and the Uruguay Round strengthened the competitiveness of North America and the EU in the Chinese forest product market [10]. With the US being the largest importer of paper products and the fourth largest importer of pulp in China, the US-China trade conflict will make the US share decline, causing a negative impact on China’s trade in pulp and paper products. Meanwhile, rising tariff costs have prompted Chinese companies to accelerate the development of emerging markets, bringing development opportunities for Russia, Europe, and countries along the Belt and Road [11,12]. Indonesia is not only rich in forest resources with the Sumatran rainforest [13] but also has a relatively stable political situation [14], which makes it a large importer of pulp and paper products for China [11]. As one of the emerging markets, the trade friction between China and the United States will provide an opportunity for Indonesia to increase its share [12,15].
Studies on the factors influencing the import trade of pulp and paper products have focused on exploring the time variation of trade volumes, including supply and demand, price, environmental regulations, and trade barriers. Among the supply and demand factors, the level of economic development of the trade bilateral [16,17,18,19,20,21,22], bilateral distance [16,17,23], population [16], price [18,20,24], exchange rate [17,25], paper industry development [26], raw material supply [21,22], and product demand and supply [27,28] affect the import of pulp and paper products. Among the environmental regulatory factors [29], forest resource restriction policies [25], waste paper import restriction policies [30,31,32,33,34], environmental information disclosure policies [35], carbon emission reduction [36], and environmental regulations [37,38,39] affect the import of pulp and paper products in a country to varying degrees. Notably, China has been increasing its waste paper import control since 2017, which is having an impact on the trade pattern of the paper raw material market in China and globally [18], and the global waste paper import center will experience a shift from Europe to East Asia and then to Southeast Asia [32]. In addition, trade barriers such as tariffs [19], Sino-US trade frictions [40,41,42,43,44], forest certification [45,46,47], and anti-dumping [48,49] are also influencing factors for the import of pulp and paper products [50]. Meanwhile, COVID-19 has ravaged the world since 2019, hitting almost all industries including the pulp and paper industry [51], with a decline in global demand for paper, supply chain disruptions, and price fluctuations of pulp and paper products [52], bringing negative impacts on the trade of pulp and paper products [53]. Most of the studies on factors influencing trade evolution have used qualitative analysis [33], multiple regression [22,24], trade gravity models [19,54], seemingly uncorrelated regression models [29], and neural network analysis [55,56].
In general, the research related to the factors influencing the trade of pulp and paper products includes three aspects: supply, demand, and price; environmental regulation; and trade barriers. However, there are few studies that include all three factors as variables in the model at the same time. In addition, most studies have explored the factors influencing the temporal variation of pulp and paper product trade volumes, and few studies have focused on explaining the spatial evolution of pulp and paper product trade. Therefore, against the background of the continuous deepening of the globalization pattern of pulp and paper product trade, this study takes the comprehensive background of COVID-19, Sino-US trade frictions, and waste paper import restrictions as an entry point to study the factors influencing the spatial evolution of China’s pulp and paper product imports, which is important for promoting the healthy development of China’s paper industry.

2. Research Methods and Data Sources

2.1. Methods

The gravitational model originated from Newton’s law of gravitation, which states that the gravitational force between two objects is positively related to the mass of the two objects and negatively related to the distance. Tinbergen and Poyhonen were the first to introduce the gravity model to the field of international trade [3], and subsequent studies have continued to expand the applicability of the model by adding new variables [57,58,59]. Due to the availability and high credibility of the data required by the gravity model, the trade gravity model has become more and more widely used and has become a major empirical research tool for international trade flows [57,60]. On this basis, this study uses an extended trade gravity model to investigate panel data on China’s pulp and paper product imports. Panel data can be regarded as a mixture of time series and cross-sectional data, and therefore they are two-dimensional data. By introducing panel data, it is possible to study the pattern of China’s pulp and paper product import market over time as well as to obtain the pattern of trade changes of different trading partners. In addition, many previous studies on trade influencing factors have used ordinary least squares (OLS) to construct models [22,23,24]; however, this approach ignores the problem of the heterogeneity of different trade subjects, which can lead to biased results [57]. The extended trade gravity model can be flexibly applied to study the trade influencing factors of different agricultural and forestry products, taking into account heterogeneity and time evolution [57,58,59,60,61,62,63,64]. Also in this study, the F-test, LM test, and Hausman test are conducted on the panel data to determine whether the model chooses mixed effects regression, fixed effects regression, or random effects regression to ensure the optimality of model selection.

2.1.1. Selection of Econometric Models

The fixed effects model is a panel data analysis method, which is characterized by the same slope coefficient but different intercept terms for different cross-sections or different time series. In this study, the individual fixed effects refer to the model in which only the intercept term differs for different time series (individuals). The marginal effects are the same for the explanatory variables of the panel data regression model, both in time and individually. Except for the explanatory variables of the model, the effects of all other certain variables that affect the explanatory variables vary only with individuals and not over time. The basic equation is as follows:
y i t = α i + k = 1 K β k X k i t + μ i t ,   where   k   =   1 8 .
where i denotes different trading partners of pulp and paper products, t denotes time, yit is the trade share of China’s main import trading partners for pulp and paper products, αi is the intercept term, and μit is the error term.

2.1.2. Trade Gravity Model

The trade gravity model is usually used to analyze bilateral trade flows and considers that the bilateral trade volume is directly proportional to the size of the economy and inversely proportional to the distance between economies [19,51]. The original model is as follows:
T i j = C   G i α G j β D i j γ
where C, α, β, and γ are constants, Tij denotes bilateral trade flows, Gi and Gj denote the level of economic development of the two countries, respectively, and Dij indicates the geographical distance between the two countries.
The aim of this paper is to study the factors that influence the spatial evolution of China’s pulp and paper product imports. The economic scale and geographic distance variables in the original model are not sufficient to explain the effects of COVID-19, import restrictions on waste paper, and trade disputes between China and the United States on pulp and paper imports. Therefore, in this paper, we set economic scale, economic distance, exchange rate index, import price, COVID-19, import restrictions on waste paper, and trade disputes between China and the United States as explanatory variables on both sides of the trade, which belong to the application of the expanded trade gravity model. Therefore, by substituting the variables selected in this paper into Equation (2) and taking the logarithm, the gravitational equation of China’s pulp and paper product import trade is obtained as follows:
Ln T i j t = C + β 1 LnPGDPC t + β 2 LnPGDP i t + β 3 LnDIS i t + β 4 LnROE i t + β 5 LnPERM 3 i t + β 6 LnPRICE i t + β 7 WAR + β 8 COVID 19 t + β 9 BAN t + β 10 ANTI t + α i + ε i t
where i denotes different trading partners of pulp and paper products, and t denotes time. PGDPC denotes GDP per capita in China, PGDP denotes GDP per capita of trading partners, DIS denotes economic distance between trade supply and demand, ROE denotes exchange rate index, PERM3 denotes pulpwood production per capita of trading partners, PRICE denotes trade price of pulp and paper products, WAR denotes trade disputes between China and the United States, COVID-19 denotes the COVID-19 pandemic, BAN denotes China’s restrictions on waste paper imports, and ANTI denotes China’s anti-dumping duty on US, Europe, and Japan.

2.2. Index Selection and Data Sources

2.2.1. Major Trading Partners Selection

In this article, pulp and paper products include paper raw materials and paper products, wherein paper raw materials are identified as wood pulp, waste pulp, and waste paper under customs HS code Chapter 47. Paper products include all products under Chapter 48, which are divided into four categories: newsprint and printing paper, packaging paper products, industrial paper products, and other paper products according to the main uses. Other paper products including household, cultural and office, and construction paper products, which account for a smaller share of trade volume, are not analyzed in this paper. Considering the temporal background of waste paper import restrictions, trade disputes between China and the United States, and COVID-19, the pulp and paper product trade data of China from 2006 to 2021 are selected for analysis. In this study, the trading partners with a cumulative share of 70% of total imports from 2006 to 2021 are listed in descending order for analysis. The selection of trading partners is shown in Table 1.

2.2.2. Theoretical Analysis

According to international trade theory, the factors affecting the structure of a country’s import trade usually include demand side, supply side, price and cost, and internal and external environment. Considering the import trade characteristics of pulp and paper products, the following variables are selected in this paper.
(1)
Demand side factors
Pulp and paper are important basic raw materials that can be used to produce a variety of cellulose products in addition to paper, which is widely used in the food, textile, construction, pesticide, pharmaceutical, cigarette, daily chemical, petroleum, chemical, military, and other industries. In addition, some construction materials are also directly mixed with the pulp to improve the performance of building materials. Therefore, the demand for pulp and paper is highly correlated with the regional development level; specifically, the higher the level of economic development of a country or region, the higher its demand for pulp and paper products [18,19]. At present, China’s wood resources are far from meeting the needs of the growing pulp and paper industry, and this makes its import demand more robust because of limited local pulp and paper. Therefore, GDP per capita on both sides of the trade is chosen as the influencing factor to characterize the demand side of paper. In this article, the GDP per capita on both sides of the trade is used as a factor affecting the spatial and temporal evolution of China’s import trade in pulp and paper products. The GDP and population data are obtained from the World Bank World Development Indicators Database of 2005–2020.
(2)
Supply side factors
Pulp is processed from certain plants as a raw material. According to the different types of plants usually used for pulp, raw materials can be classified into four categories: stem fibers, bast fibers, seed hair fibers, and wood fibers. In particular, the wood fiber class is the most important. To make up for the shortage of raw materials, China has to import a considerable amount of pulp from external sources every year, mainly wood fiber-based pulp products. From the perspective of supply, the forest resource endowment on the supply side is crucial; that is, China’s imports of pulp and paper products will be influenced by the forest resource endowment of the trading partner [20]. In general, the richer the forest endowment on the supply side, the higher the quality of pulpwood, the greater the supply of pulp and paper products, and the greater the quantity of pulp and paper products China may import from those countries. In this article, the per capita pulpwood production of trading partners is chosen to measure the forest resource endowment, which is used as a factor affecting the spatial and temporal evolution of China’s import trade in pulp and paper products for analysis. Data on paper wood production in different countries were obtained from the Food and Agriculture Organization of the United Nations (FAO) Database and the International Tropical Timber Organization (ITTO) Database of 2005–2020.
(3)
Price and cost factors
In microeconomics, price is one of the important variables in the process of resource reallocation between demand and supply. Prices have the role of adjusting economic relations and regulating economic activity. In general, the higher the price of a good in the market, the lower the consumer demand for the good at a given level of consumption. Therefore, the change in the price plays the role of changing the quantity, direction, and structure of consumer demand. In the pulp product market, price as an indicator of pulp and paper product supply and demand will directly affect the import volume of pulp and paper products [18]. Therefore, this paper adds the import prices of various pulp and paper products to the model to qualitatively study the impact of price factors on import volumes. Price data are obtained from the United Nations Trade and Development Organization Database of 2005–2020.
The cost of import trade is one of the three main factors affecting trade growth. For pulp and paper import trade, the growth of China’s pulp and paper trade will be influenced by the import trade cost [16,25], which will then affect the dynamic evolution of China’s overall pulp and paper trade imports. In this article, the import trade costs are used as a factor affecting the spatial and temporal evolution of China’s import trade in pulp and paper products for analysis. Specifically, the economic distance between the two sides of trade is chosen to characterize China’s import trade costs in this paper. The absolute difference in GDP per capita between the two sides of trade is used as a weight and multiplied by the capital distance to finally obtain the economic distance between the two sides of trade. Data on trade bilateral capital distances are obtained from the CEPII Geographic Distance Database of 2005–2020.
As a measure of the relative value of a country’s currency, changes in the exchange rate index can also show the changes in international trade costs. For pulp and paper imports, an increase in the exchange rate index means that the devaluation of the country’s currency is smaller than the devaluation of the currencies of major trading partners, which is favorable to imports and unfavorable to exports; it also means that the trade balance is prone to surpluses, and vice versa. Therefore, the change in exchange rate index will directly affect the import and export situation of pulp products [17,25]. In this paper, the exchange rate index of the US dollar against the currency of each trading country is selected as the influencing factor of import trade of pulp and paper products. Data on exchange rates are obtained from the World Bank World Development Indicators Database of 2005–2020.
(4)
International environmental factors
In September 2018, the United States announced a 10% tariff on USD 22.3 billion in exports of various pulp and paper products to China, and they increased the rate to 25% in June 2019. As an important import trade partner of China for pulp and paper, the regulation seriously affects the friendly trade partnership between China and the United States [43], which in turn triggers a change in the trade structure of China’s pulp and paper product imports. The trade friction between China and the US will have a huge negative impact on the import volume of wood forest products in China, and the market structure of wood forest product imports will also change [44,65]. Therefore, this paper selects the trade friction between China and the US as a dummy variable to join the model. This dummy variable WAR takes the value of 0 in 2005–2017 and 1 in 2018–2020.
The global outbreak of the COVID-19 pandemic in 2019 had a significant impact on various industries, and the impact on wood forest products is mainly reflected in the global supply chain disruption it caused, which has profoundly affected the international trade pattern [66]. On the one hand, the slow development or even suspension of national economies under the impact of the pandemic and the inability of the paper industry to operate normally make the global supply capacity of pulp and paper products decrease, resulting in inadequate supply. On the other hand, the surge in demand regarding pulp and paper is mainly caused by the prevalence of online shopping under the pandemic stimulating the growth in paper demand [67]. The resulting imbalance between global supply and demand of paper products will have certain impact on the import trade pattern of pulp and paper products in China. Therefore, this article selects the COVID-19 pandemic as a dummy variable to join the model. This dummy variable COVID-19 takes the value of 0 in 2005–2018 and 1 in 2019–2020 because the main trading partners of China’s pulp and paper products are in the pandemic-affected areas.
(5)
Domestic policy factors
The General Office of the State Council of the People’s Republic of China first issued a “ban on the entry of foreign garbage to promote the implementation of the reform of solid waste import management system” in 2017. Afterwards, China’s import restriction policy on waste paper has been upgraded and increased [68], opening a new era of zero imports of waste paper. It will directly affect the import structure of paper raw materials and the import volume of paper products in China [30,31,32]. Therefore, in this study, the import restriction on waste paper is selected as a dummy variable. This dummy variable BAN takes a value of 0 in 2005–2016 and 1 in 2017–2020.
In April 2016, the Ministry of Commerce of the People’s Republic arbitration results showed that unbleached paper bag paper originating from the US, Europe, and Japan was dumped in the Chinese market [69], the domestic unbleached paper bag paper industry in China was materially injured, and there was a causal relationship between dumping and material injury. Therefore, it was decided to impose a five-year anti-dumping duty on the unbleached paper bag paper imported from the United States, the European Union, and Japan. Therefore, in this paper, anti-dumping duties are added as a dummy variable in the imports of packaging paper products and industrial paper products. According to the time of the policy enactment and implementation, this dummy variable ANTI takes a value of 0 in 2005–2015 and 1 in 2016–2020 for the US, Japan, and EU countries.
The evaluation index system of factors influencing the spatial and temporal evolution of China’s import trade in pulp and paper products in Table 2 contains explained and explanatory variables. Among them, the explanatory variable is the share of imports from trading partners.

2.2.3. Data Sources

Considering the data availability, the trading partners of China and its pulp and paper product imports from 2005 to 2020 were selected as the research samples in this paper. The data on pulp and paper products imported by trading partners involved in the explanatory variables are obtained from the World Bank World Development Indicators Database. The trade data on pulp and paper products are obtained from the International Trade Centre database. The data on GDP per capita in China and GDP per capita in trading partners are obtained from the World Bank World Development Indicators Database. Data on the distance between the capitals of the two trading parties are obtained from the CEPII Geographical Distance Database. The data on exchange rates are obtained from the World Bank World Development Indicators Database. Pulpwood production data for the supply countries are obtained from the FAO and the ITTO databases. The data on trade prices of pulp and paper products are obtained from the United Nations Trade and Development Organization Database. The remainder of the variables are dummy variables, and the values of the dummy variables are determined by the time of policy release and implementation.

3. Results

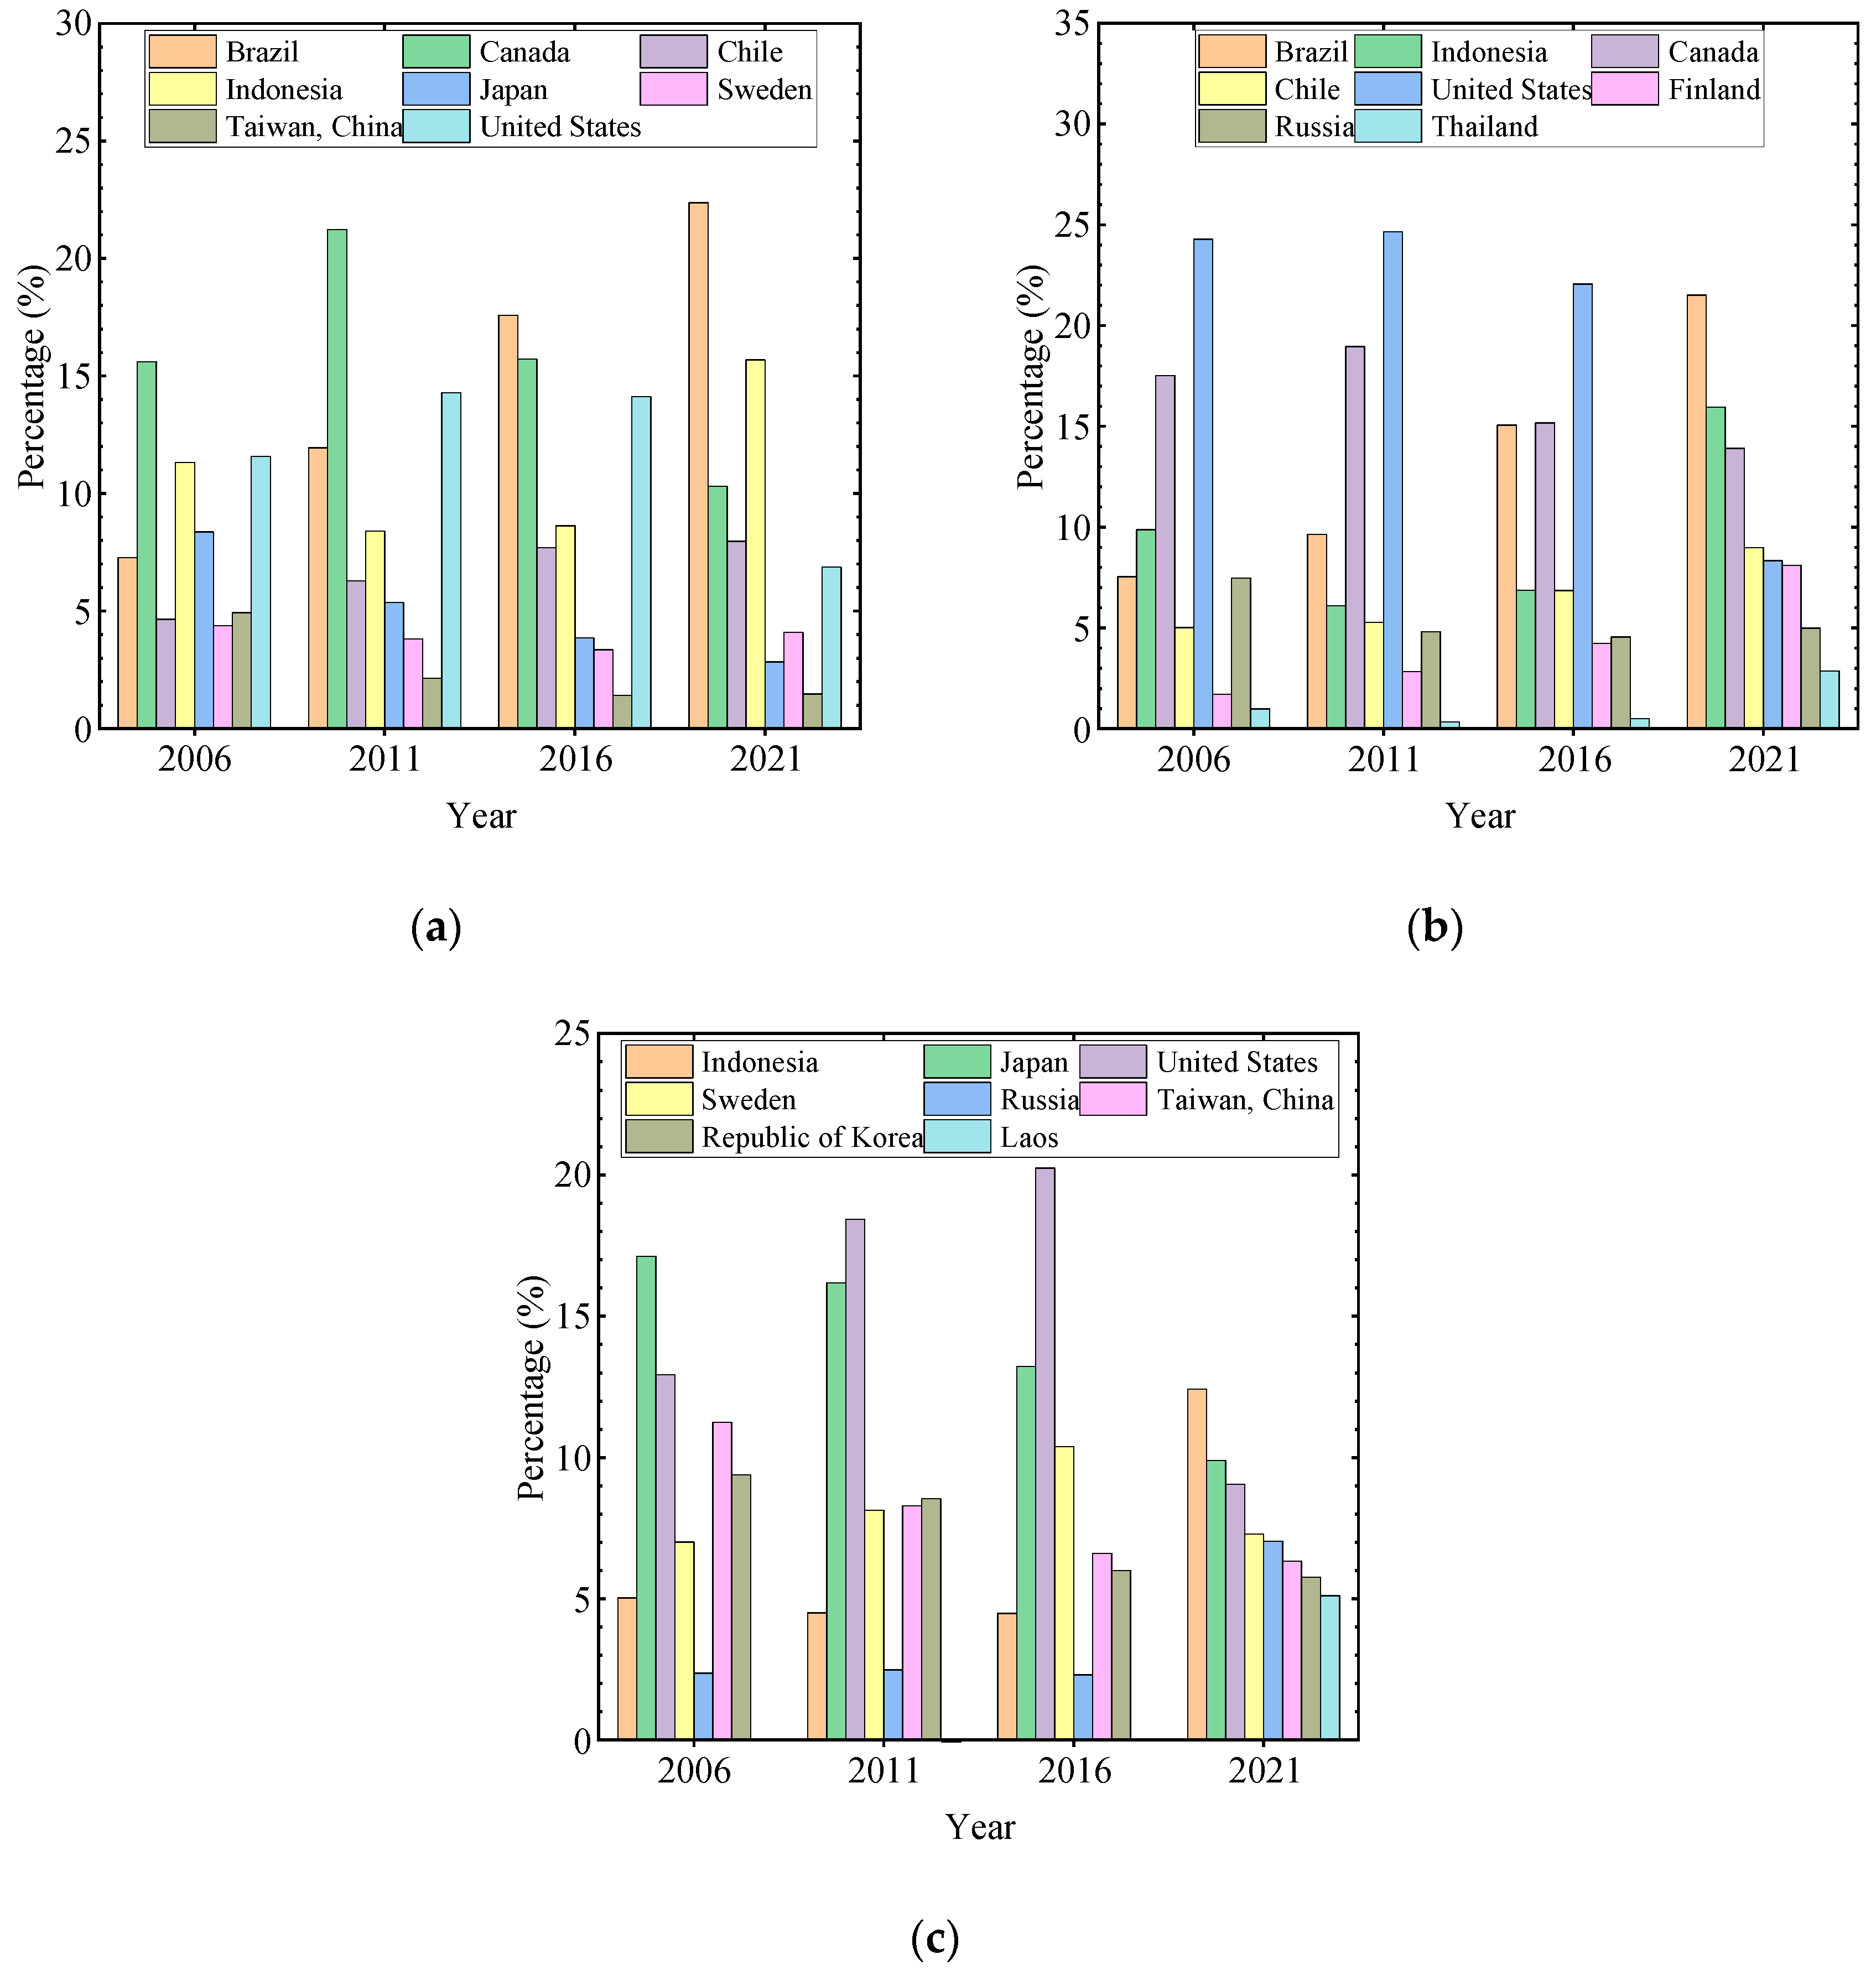
3.1. The Spatial Evolution of China’s Imports of Pulp and Paper Products

Before proceeding to presenting the empirical results, a description of the spatial evolution of China’s imports of pulp and paper products is in order.

3.1.1. The Evolution of the Market Structure of Pulp and Paper Product Imports

During the period 2006–2021, the spatial evolution of China’s pulp and paper product import trade is generally characterized by three aspects. Firstly, the proportion of pulp and paper products imported by China from Brazil, Chile, and other South American countries is increasing annually. Secondly, the proportion of pulp products imported by China from Indonesia and other Southeast Asian countries fluctuates little and is basically in a steady rise. Thirdly, the proportion of China’s pulp imports from the United States, Canada, and other North American countries is decreasing gradually each year (Figure 1a).
Regarding the import situation from trading partners for different product segments, there are two main dimensions. The first is reflected in the import of raw materials. The proportion of raw materials imported by China from countries such as Brazil, Indonesia, and Chile to the total volume of imported raw materials has increased steadily, while the proportion of raw materials imported from two countries, Canada and the United States, to the total imported raw materials has decreased. It is worth noting that in terms of import volume, Brazil’s share of China’s raw material imports surpassed Canada and the United States for the first time in 2017 and 2018, respectively. At this point, Brazil has jumped to the top of the list of China’s raw material import trading partners (Figure 1b).
The second dimension is reflected in the import of paper products. The proportion of paper products imported from Indonesia in China’s annual paper product imports has been growing annually, while at the same time, the proportion of paper products imported from Japan, Republic of Korea, and Taiwan has been decreasing year by year. Since 2017, the proportion of paper products imported from the United States in China’s total paper product imports has been declining yearly. Notably, in 2021, the proportion of paper products imported from Southeast Asian countries, represented by Laos, achieved a major breakthrough in China’s paper product imports, which is reflected in the fact that the proportion went from almost zero to catching up with East Asian countries such as Japan and Republic of Korea (Figure 1c).

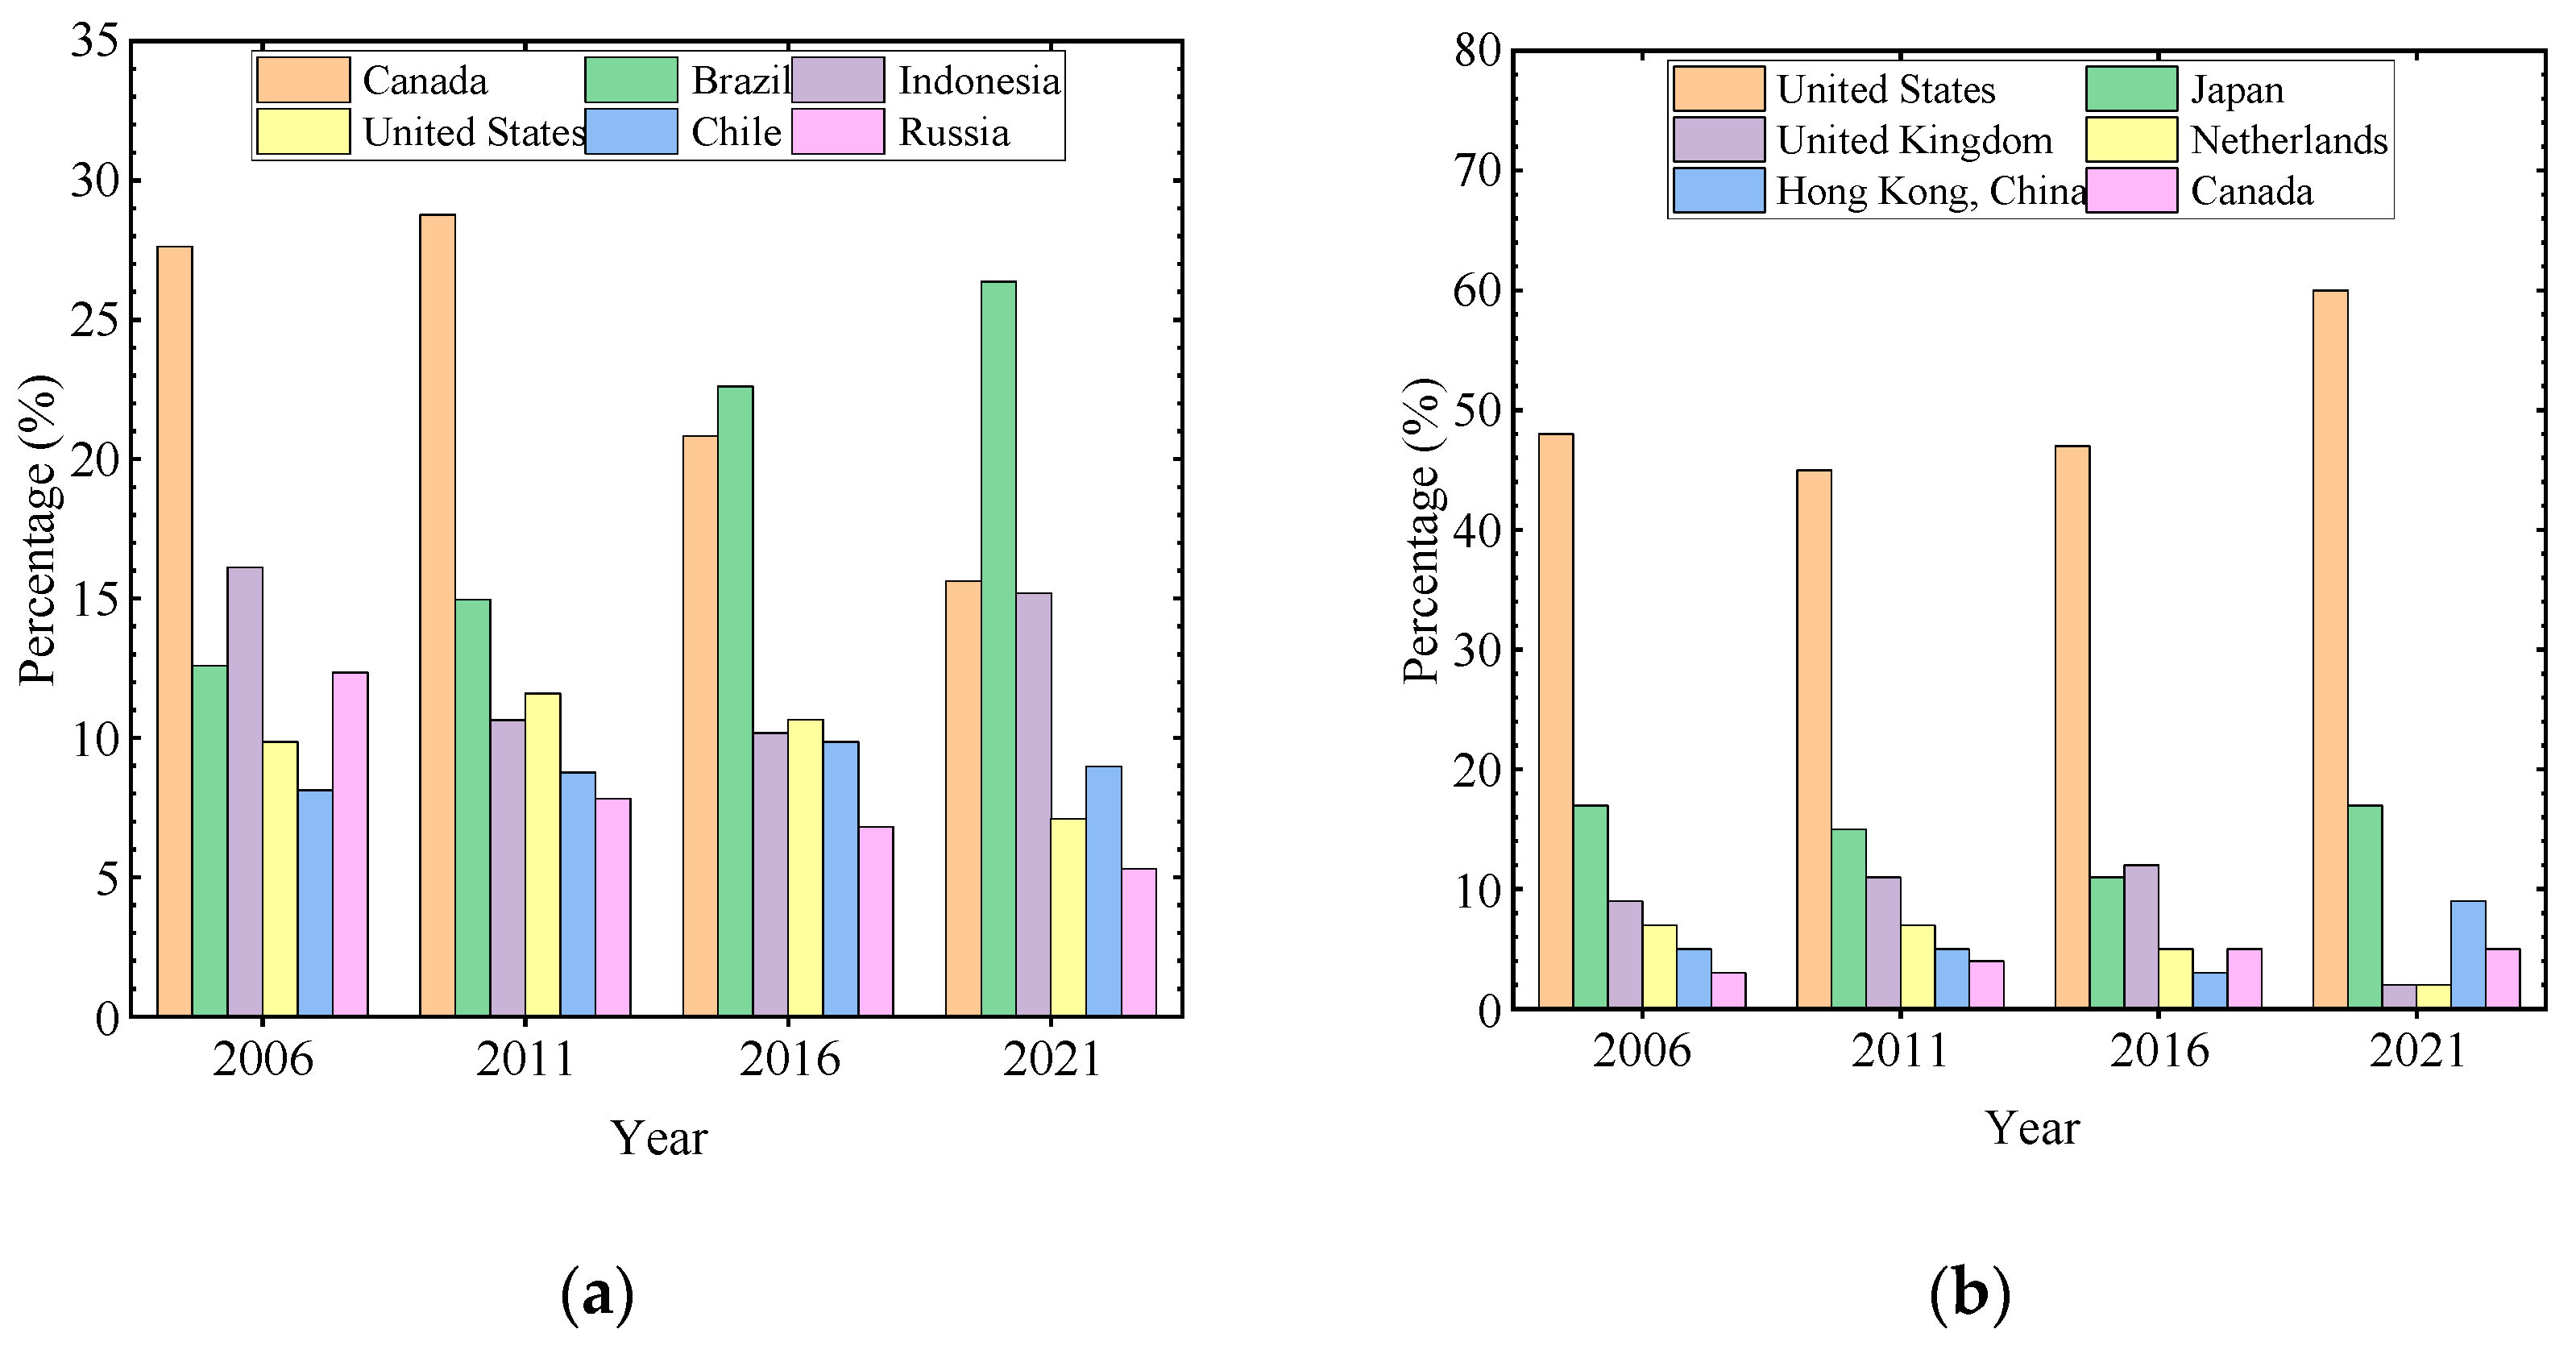
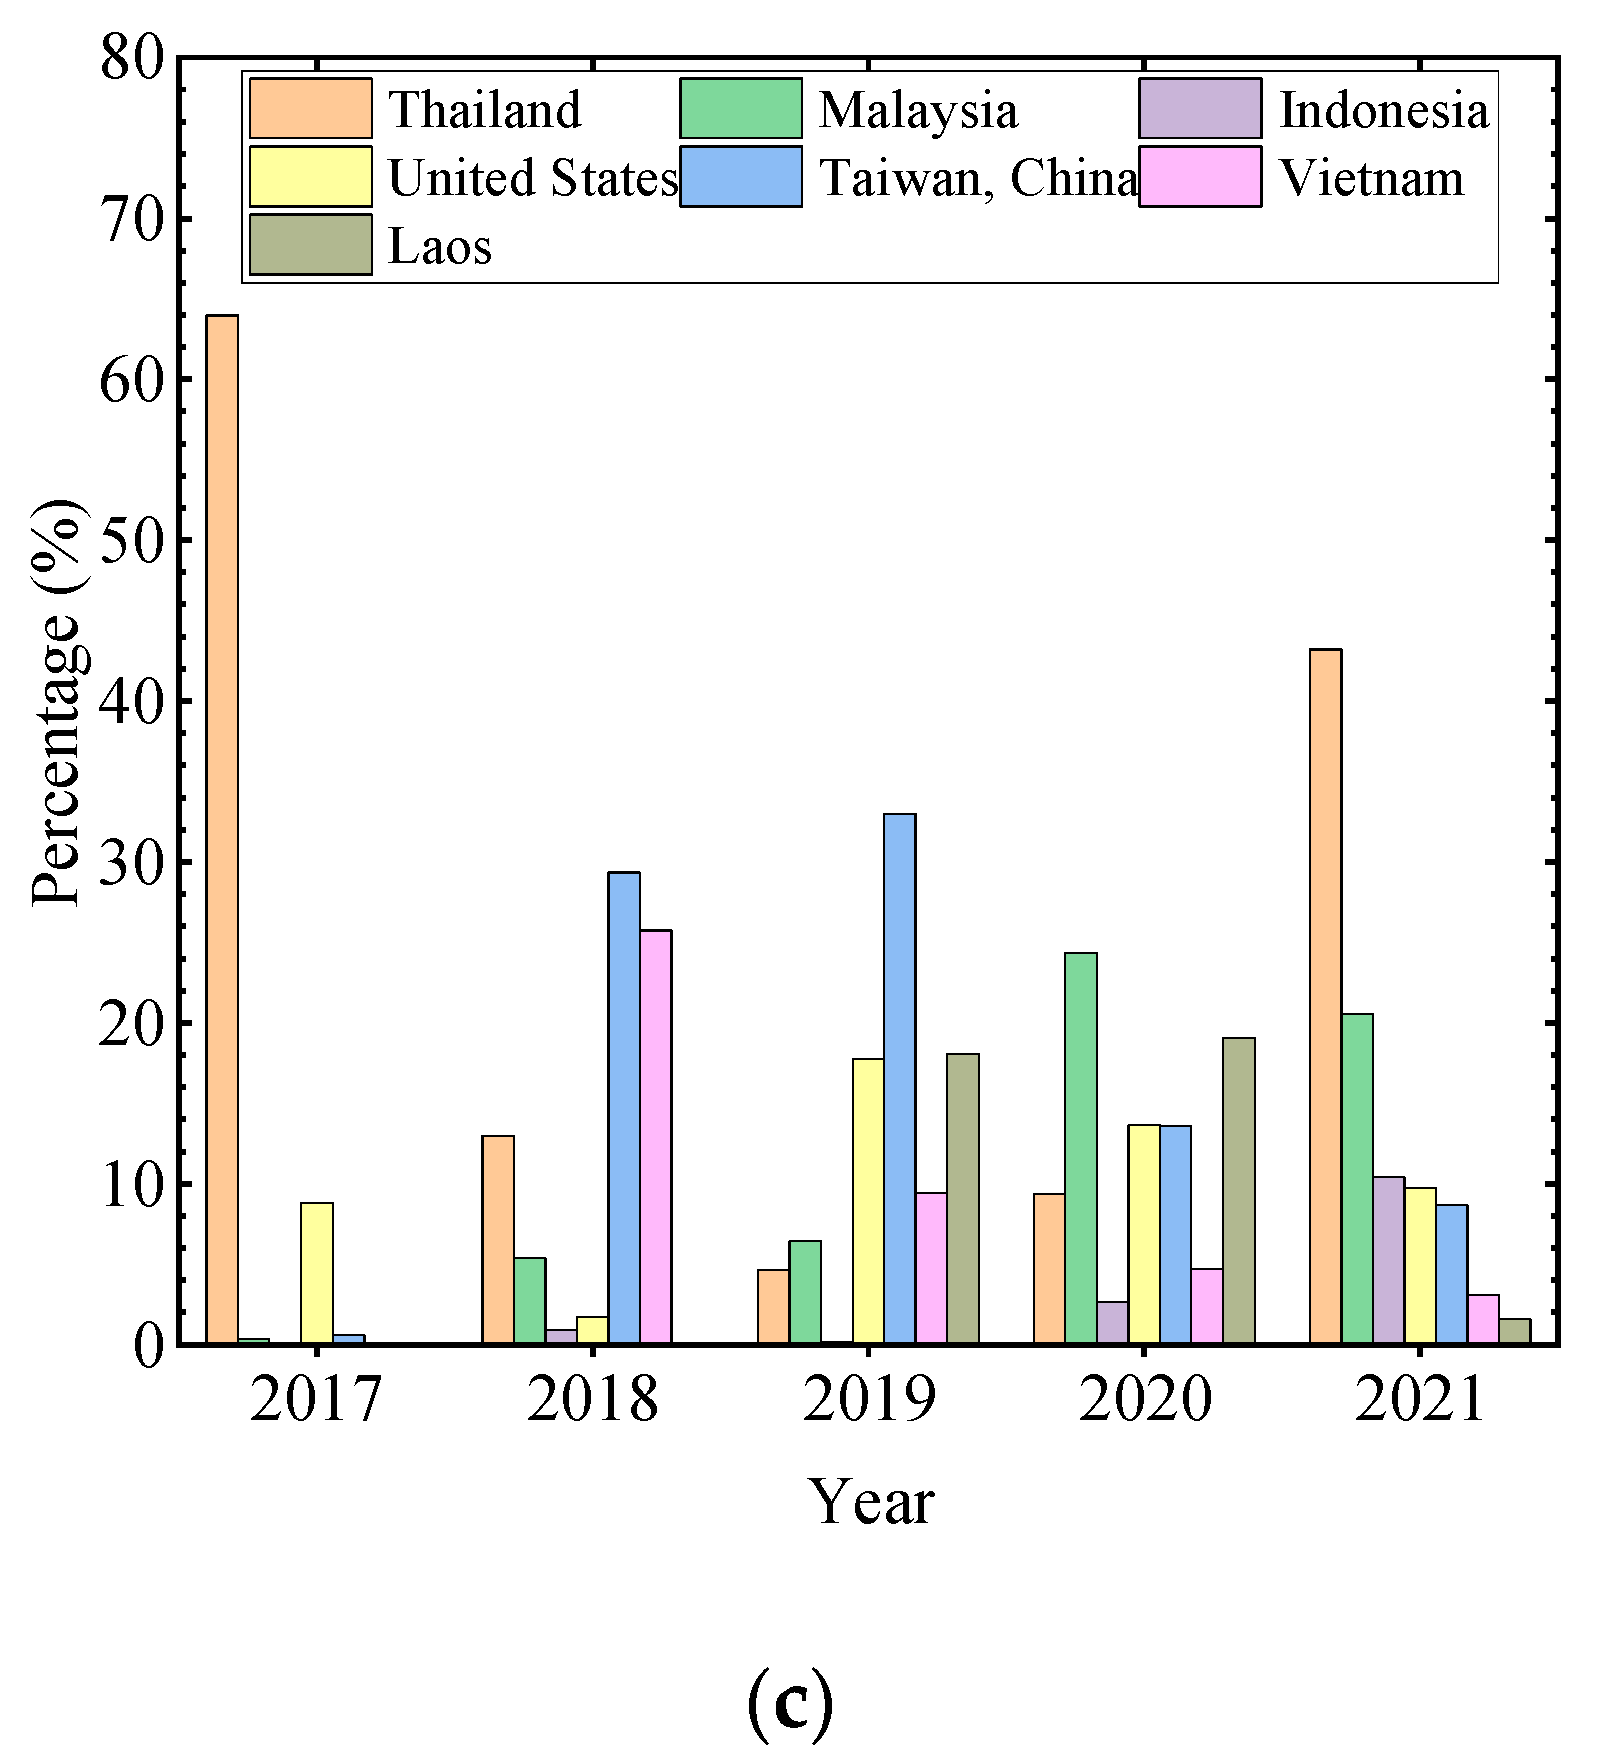
3.1.2. The Evolution of the Market Structure of Paper Raw Material Imports

As China’s paper raw material production capacity is much weaker than the domestic market demand, raw materials such as wood pulp and waste paper are highly dependent on imports. Since 2018, trade friction between China and the US has been escalating, and the US, as the main source of paper raw material imports into China, has been affected in terms of its import proportion [44]. Additionally, the restrictions on waste paper imports that began to be implemented in 2017 have prompted domestic paper manufacturers to start converting to recycled fiber pulp. Moreover, the sharp decrease in the amount of waste paper imported into China will also stimulate waste paper exporters in Europe, the US, and Japan to look for new export markets, thus leading to a change in the world market pattern of paper raw materials [30,31].
As the world’s largest wood pulp importer, China’s imports are highly concentrated in countries such as Brazil, Canada, Indonesia, the United States, and Chile. Influenced by the trade friction between China and the US and the COVID-19 pandemic, the market share of the US and Canada decreases, while the share of Brazil, Indonesia, and Chile increases year by year, and Brazil overtakes Canada as China’s top wood pulp import trade partner since 2016 (Figure 2a). Waste paper import trade is highly concentrated in developed countries such as the US, Japan, and the UK (Figure 2b). During 2017–2021, especially since the trade friction between China and the US and the pandemic, China’s waste pulp imports show a gradually increasing trade share in the Asia-Pacific region and a gradually decreasing share in Europe and the Americas (Figure 2c). This shows that the Asia-Pacific region is replacing Europe and the United States as the most important source of waste pulp imports into China.
After the implementation of waste paper import restrictions in 2017, China started to import a large amount of waste pulp, and Southeast Asian countries saw the huge potential of exporting waste pulp to China at this time, so they increased the import volume of waste paper and processed it into recycled fiber pulp for export to China. China’s waste pulp import concentration declined year by year, and thus Thailand’s share fell from 65% in 2017 to 15% in 2018, while the shares of other Southeast Asian countries outside Thailand began to rise since 2018.

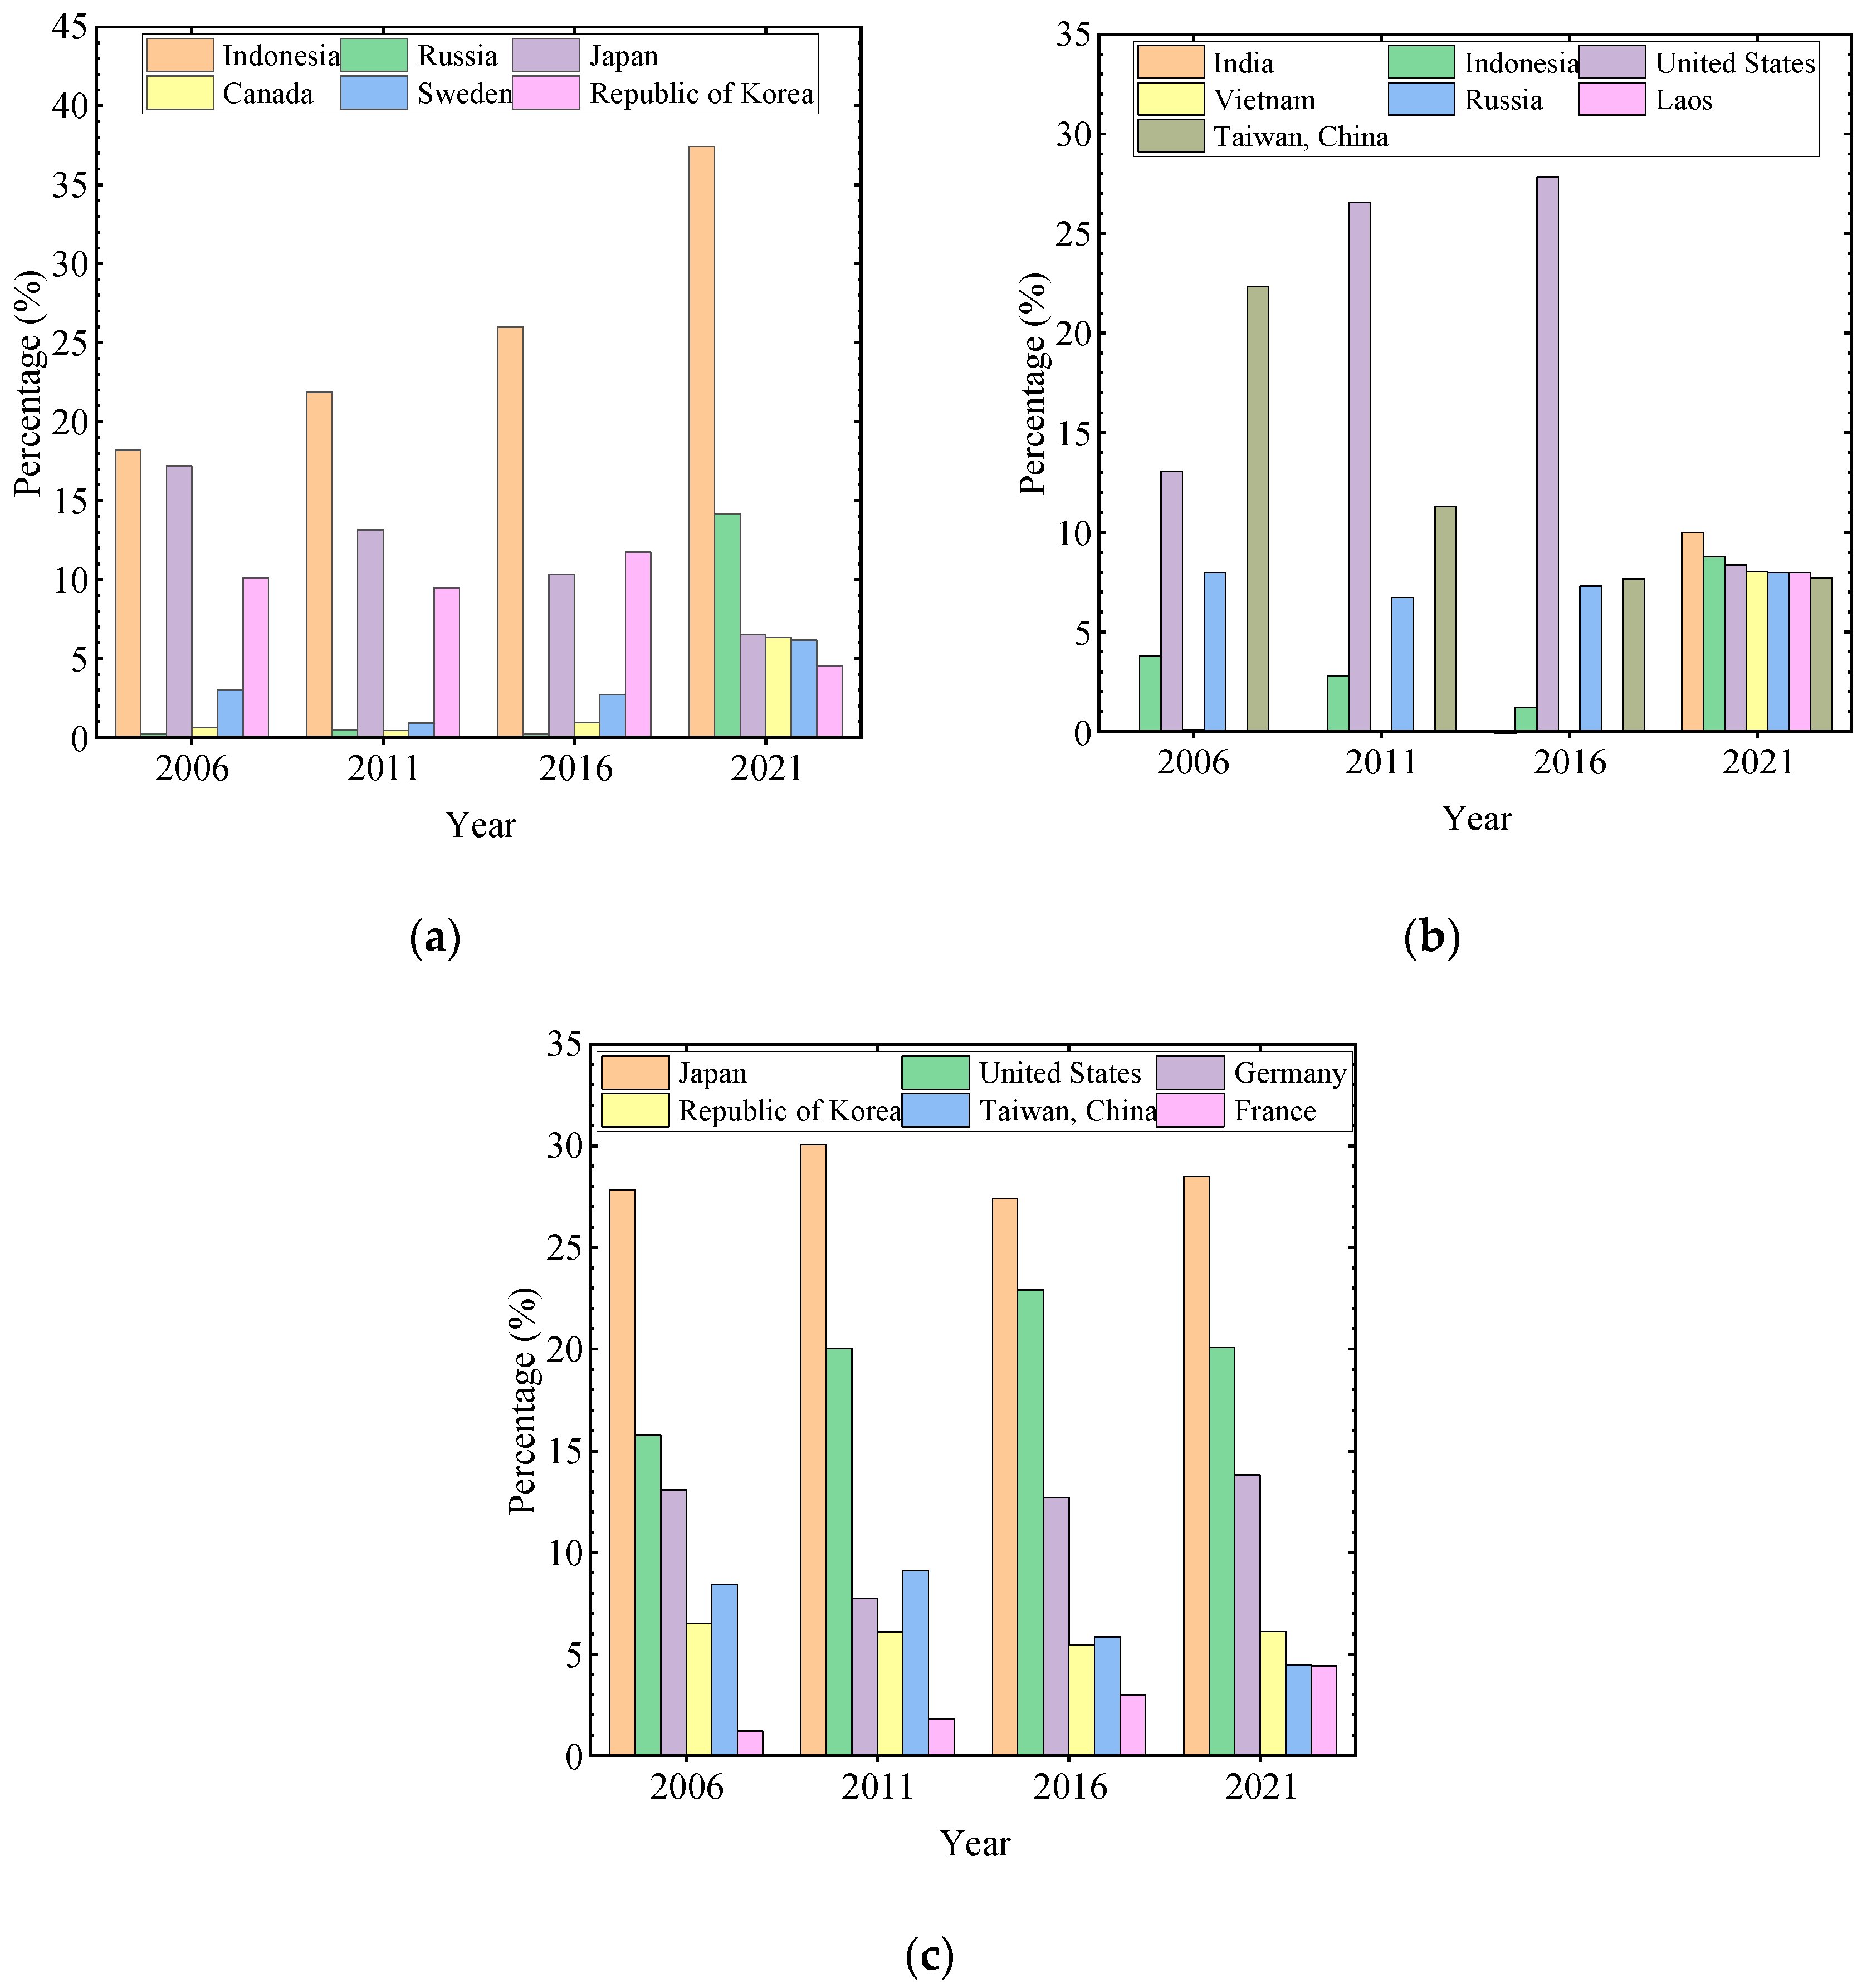
3.1.3. The Evolution of the Structure of the Paper Product Import Market

In the past, the United States, Japan, Republic of Korea, and Taiwan took the leading positions in China’s paper product import trade partners. The trade friction between China and the US from 2018 has an impact on the trade of paper products between China and the US, with changes in the import structure of China’s paper products [44]. In 2019, the COVID-19 outbreak impacted the global paper industry chain and supply chain, while China’s paper product import market structure was adjusted. At the same time, the gradually tightening domestic import restriction policy for waste paper has further affected the structure of China’s paper product import market.
Indonesia, Japan, and Republic of Korea are the top three major import trading partners for newsprint and printing paper. Specifically, Indonesia’s proportion is increasing each year, while Japan and Republic of Korea’s proportion is decreasing each year. Russia and Canada accounted for a significant increase in 2021 (Figure 3a). The concentration of packaging paper product imports decreased, with the US and Taiwan accounting for 16% in 2021, down from 37.9% in 2011, while Asia-Pacific trading partners such as India, Indonesia, Vietnam, and Laos accounted for an increase (Figure 3b). In terms of industrial paper, Japan, the United States, and Germany rank among the top three and have a stable share of China’s industrial paper product imports (Figure 3c). In general, in the various types of paper products imported into China, the United States, Japan, Republic of Korea, and Taiwan’s proportion is gradually declining, while Indonesia, India, and Russia are increasing year by year. In 2021, Indonesia surpassed the United States as China’s top trading partner for paper product imports.

3.2. Panel Regression Results

Based on the panel model constructed in the previous section, the factors influencing the spatial evolution of China’s imports of pulp and paper products were analyzed at the levels of demand side factor, supply side factor, price and cost factors, international environmental factors, and domestic policy factors.

3.2.1. Model Identification

In this paper, STATA15.1 software was used to determine the mixed effects, fixed effects, and random effects of the panel data by F-test, LM test, and Hausman test. The test values and p-value results are shown in Table 3. In the F-test, the original hypothesis of no fixed effects was rejected at 1% level of significance, and the fixed effects model was better than the mixed effects model. In the LM test, the original hypothesis of no random effects is rejected at 1% significant level, and the random effects model is better than the mixed effects model. In the Hausman test, all reject the original hypothesis at 1% significant level, and the fixed effects model is better than the random effects model. In summary, the selected pulp and paper product imports were modeled as fixed effects.

3.2.2. Result of Factors Influencing the Spatial and Temporal Evolution of China’s Import Trade in Pulp and Paper Products

The regression results are presented in Table 4, and several conclusions can be drawn from the results of the panel model as follows.
(1) The improvement in the level of economic development of China and its trading partners positively affects the increase in China’s import share of wood pulp, waste pulp, and packaging paper products. China’s GDP per capita is positively correlated with the import share of wood pulp, waste pulp, and paper products for packaging at a significant level of 5%. This is due to the fact that the improvement in the living standard of Chinese people has pulled up the consumption of paper products in various industries, which increases the imports. The increase in GDP per capita of trade export partners increases the import share of wood pulp, waste pulp, waste paper, and paper products for packaging in China at a significant level of 5%. An increase in the GDP per capita of a trading partner means an increase in the economic development level of its industries, including the paper industry, resulting in a stronger capacity to supply quality pulp and paper to the external region, with an increase in the proportion of pulp and paper products imported by China from such a country. (2) The proportion of imports for each pulp and paper product in China is negatively correlated with economic distance. This is because the increase in the gap between the two sides of the trade in the level of economic development makes it easier for the comparative advantages of the two sides to form industrial complementarity, thus promoting the two sides to trade in paper products. (3) The proportion of imports of pulp and paper products in China is negatively correlated with the exchange rate index. An increase in the exchange rate index implies a devaluation of the national currency and a relative increase in the price of pulp and paper products from trading partners, which discourages the import. (4) The import proportion of pulp and paper products is positively correlated with the per capita pulp production of the trade supplying countries, at a significant level of 1% for each 1% increase in the per capita pulp production of the trade partners, which leads to an increase of 1.117% in the proportion of wood pulp imported by China from each trade partner. The higher the per capita pulp output of the trading country, the stronger the forest endowment of the country, which means that it can provide more high-quality and abundant raw materials for China’s paper industry, thereby increasing the proportion of the wood pulp imports in China’s total imports. (5) The proportion of China’s imports in various types of pulp and paper products is significantly negatively correlated with the prices of their imports, which means that China’s choice of pulp and paper product imports is more inclined to import from trading partners whose prices are lower.
The trade friction between the US and China makes the proportion of imports for wood pulp, waste paper, and packaging paper products significantly reduced at the level of 10%. Wood pulp, waste paper, and paper for packaging products imported from the US accounted for the top three of China’s total imports from 2006 to 2021, indicating that the US is an important trading partner for China’s pulp and paper product imports. However, because of the trade friction between China and the United States, China announced that Chapter 47 and 48 products, including wood pulp, waste paper, and packaging paper products imported from the United States, will be subject to a 25% tariff from 1 June 2019. The increase in import costs prompted China to reduce the import of paper raw materials and packaging paper products from the United States. The share of imports of wood pulp, waste paper, and packaging paper products in the composition of pulp and paper products is significantly reduced. At the same time, China’s paper enterprises also began to look for new raw material and packaging paper product suppliers, resulting in the concentration of pulp and paper product imports declining each year. By 2021, China’s imports of pulp and paper products from South America and the Asia-Pacific region rose to 30% and 24%, respectively, while the proportion of imports from the United States fell to 9.4%, with the center of gravity for import trade moving from the United States to South America and Asia-Pacific countries.
The relationship between the COVID-19 outbreak and the proportion of imports of each pulp and paper product (except packaging paper products) in China is not significant, indicating that its impact on pulp and paper products is not clear. However, the pandemic situation has increased China’s imports of packaging paper products at a significant level of 10%. There are mainly two reasons for this: On the one hand, the global supply chain of pulp and paper products is blocked in the short term under the pandemic, which has a negative impact on the import of most of China’s pulp and paper products. However, as paper products are indispensable to social production and life, the paper industry chain of various countries will be rapidly restored in the post-pandemic era to protect the global supply of pulp and paper products, which will not cause a significant decline in China’s imports of pulp and paper products. On the other hand, with the rapid development of the e-commerce and logistics industries in the post-pandemic era, China’s demand for paper, especially for packaging paper products [48,49], will increase significantly, which is why the pandemic will significantly increase the proportion of packaging paper products in China and in turn improve the status of India, Indonesia, and other packaging paper-exporting partner countries.
The implementation of the import restriction on waste paper contributes significantly to the import of most categories of pulp and paper products (except waste paper) in China. Specifically, the implementation of the restrictions on waste paper prompted China’s wood pulp, waste pulp, newsprint and printing paper, and packaging paper products import ratio to increase by 0.156%, 4.643%, 0.686%, and 1.816% at a significant level of 1%, respectively. Meanwhile, it made the import of waste paper drop significantly by 0.742%. The implementation of waste paper import restrictions cut off one of the main sources of raw materials for original paper production, and domestic paper companies increased the import of wood pulp and waste pulp to make up for the raw material gap [70]. Brazil and Indonesia are among the top ten forest areas in the world and have high-quality pulp materials, and Southeast Asian countries have become global waste pulp production plants due to cheap labor. The substitution effect of the above trading partners for US paper raw materials makes the center of gravity of China’s pulp and paper raw material imports shift, specifically from the United States to Brazil, Chile, and Southeast Asian countries. The reduction in paper raw materials will also directly stimulate the import of paper products. Indonesia, India, and Russia have become the new focus of China’s paper product imports due to their rich forest resources as well as the small economic distance from China.

3.3. Robustness Tests

Although the problem of omitted variables is mitigated to some extent by controlling variables in the baseline regression results, there are still certain factors that inevitably have an impact on the empirical results. Therefore, this study conducts robustness tests in the following dimensions:
(1) The dependent variable substitution method. To further test the reliability of the benchmark regression, the robustness test is conducted by using the dependent variable substitution method in this article. As the trade volume of China’s pulp and paper products with each trading country is positively correlated with the trade volume proportion, the robustness of the model is tested by replacing the trade volume proportion with the trade volume of each pulp and paper product in the baseline regression model. The model settings in Table 5 are consistent with those in Table 4. Limited by the length of the paper, only some important results are presented in this section. The results in Table 5 show that the effects of trade disputes between China and the United States, COVID-19, and waste paper import restrictions on the import quantity of each pulp and paper product in China are consistent with the mechanism of action of the proportion of trade volume, and the significance and direction of effect are exactly the same. This indicates that the conclusion of taking the proportion of trade volume as the explained variable is robust and reliable.
(2) Discussion of the endogeneity problem. The static fixed effects panel model does not take into account the effect of pulp and paper product imports in the previous period on the current period, and the possible two-way causality between some explanatory variables and other explanatory variables. As a result, endogeneity problems occur in the model measurement estimation, resulting in biased and non-consistent model estimation results. Therefore, this study adds a one-period lagged term of the explanatory variables to the static panel model and uses the system Generalized Method of Moments (GMM) proposed by Blundell and Bond to estimate the dynamic panel model. Adding the explanatory variables with a one-period lag to the model as explanatory variables can improve the credibility of the estimation results and more accurately reflect the dynamic adjustment process of each economic variable. Based on the analysis above, the following dynamic panel regression model is developed.
L n T i j t = c + α L n T i j t 1 + k = 1 K β k X k i t + μ i + ω t + ε i t
where LnTijt−1 is the first-order lagged term of the trade volume share, and the other indicators are as before.
Table 6 shows the estimation results for wood pulp, waste pulp, waste paper, newsprint and printing paper, packaging paper products, and industrial paper products. Firstly, the Sargan test of this study accepts the original hypothesis of “all instrumental variables are exogenous”, i.e., the instrumental variables selected in this study are considered valid. Secondly, in the autocorrelation (AR test) of the system GMM perturbation terms, the p-values of the AR (1) test are <0.1, rejecting the original hypothesis that there is no significant autocorrelation in the random perturbation terms of the model, and concluding that there is significant autocorrelation in the first-order autoregression. The p-values of AR (2) tests are all >0.1, accepting the original hypothesis that the random disturbance terms of the model are not significantly autocorrelated. Therefore, the dynamic panel model constructed in this study is reasonable, and the estimation results are reliable.
As shown in Table 6, the coefficients of the first-order lagged pulp and paper product trade volume shares are all significant, which indicates that the market share of pulp and paper product imports in the current period is closely related to the market share of that partner in the previous period, and the evolution of the market structure of pulp and paper product imports is a dynamic adjustment process. Meanwhile, the positive and negative coefficients of each explanatory variable, the significance, and the findings of the previous fixed effects panel model remain largely consistent. It is shown that the results of the econometric tests are still plausible after taking into account the endogeneity problem of the model.

4. Discussion

4.1. Supply and Demand Factors

The results show that the economic development level of the trade bilateral affects the import market structure of some Chinese pulp and paper products. The increase in the level of economic development of both trading sides leads to an increase in the proportion of pulp and paper products imported by China from the trading partner country, which extends the finding of previous studies that the economic level of both trading sides affects the trade volume [16,17,18,19,20,21,22]. Also, the study found that the level of economic development of the trade bilateral affects the import market layout of importing countries as well. Trade partners for China’s paper product imports with a cumulative proportion of imports in the top 70% include developed countries such as the United States, Japan, Republic of Korea, Sweden, and Canada, and emerging market countries such as Brazil, Chile, Indonesia, etc. This also supports the finding that China prefers to import paper raw materials and paper products from trading partners with a higher level of economic development. The larger the economic distance between the two sides of trade, the smaller the comparative advantage for both parties will be. According to the theory of comparative advantage in international trade, the share of pulp and paper products imported by China from that trading partner becomes smaller. Compared with the geographical distance used in previous studies [16,17,23], this study finds that economic distance can more accurately explain the impact of bilateral trade gaps on the layout of import markets. China imports from these countries to make up for the raw material gap in paper production, since Canada, Brazil, Chile, and Indonesia have higher quality and richer wood pulp resources compared with China.
From the empirical analysis, this study finds that although the exchange rate affects the quantity of Chinese pulp and paper products imported [17,25], it does not have a significant effect on the spatial market structure of pulp and paper products. Only the structure of the import market for wood pulp among Chinese pulp and paper products is significantly positively correlated with the per capita wood pulp production of the exporting countries, which indicates that China prefers to import wood pulp as a raw material for paper production from countries with abundant wood pulp resources. This finding is consistent with the main view of factor endowment theory [20]. As for the price factor, it was found in this study that among all pulp and paper categories, only the proportion of imports of wood pulp and packaging paper products is significantly negatively related to product prices [5], while the increase in prices of wood pulp and packaging paper products from trading partner countries will make China shift part of its import share to countries with lower prices [20].

4.2. COVID-19 Pandemic, Waste Paper Restrictions, and US-China Trade Friction

The outbreak of the COVID-19 pandemic caused China to reduce imports of most pulp and paper products except packaging paper, while significantly boosting imports of paper products for packaging, which is consistent with the view of Fang [70]. It was predicted that the adverse impact of the global spread of COVID-19 would reduce China’s GDP by 2.27%–3.28% [1], and both domestic secondary and tertiary industries would suffer from the impact, with a pessimistic consumer expectation, a decrease in domestic demand for paper, and a decrease in the proportion of pulp and paper products imported [70]. However, the demand for packaging logistics stimulated the import demand for packaging paper products in China due to the rapid development of online shopping as people’s travel was restricted under the virus pandemic [69,71]. The COVID-19 pandemic brought more changes in the import volume of pulp and paper products, with no significant impact on the changes in market structure.
China’s paper raw material structure has a high proportion of waste paper, while the market concentration of waste paper and paper product imports is high with a high market share of the United States. In relation to this, the ever-tightening solid waste import policy and the trade friction between China and the United States have become important factors affecting the trade of pulp and paper products in China [11,12]. The United States is the top source of waste paper in China; however, under the restriction of zero solid waste imports, China started to turn its attention to wood pulp and waste paper pulp. Since Brazil, Chile, and Indonesia have high-quality wood pulp and the world’s major recycled fiber pulp production lines are concentrated in Southeast Asia [72], the waste paper restriction has shifted China’s raw material imports from the United States to South America and Southeast Asia, which coincides with Ma’s view [31]. Meanwhile, the shortage of recycled fiber has also limited China’s finished paper production, and under the trade friction between the US and China, China is meeting domestic demand for paper by increasing imports of paper products from trading partners outside the US. As a result, the import of finished paper has also gradually shifted from the United States to forest-endowed countries such as Indonesia and Russia.

5. Conclusions and Outlook

5.1. Conclusions

In this paper, the factors affecting the spatial evolution of China’s imports of pulp and paper products against the background of the COVID-19 pandemic, waste paper import restrictions, and trade disputes between China and the United States are analyzed according to the expanded trade gravity model and OLS. The conclusions of the study are as follows:
(1)
The increase in bilateral economic development significantly increases the proportion of wood pulp, waste pulp, and packaging paper products in the import structure of China’s pulp and paper products. The level of economic development on both the supply and demand sides of the trade is very significant. In this paper, the stable economic growth of both sides promotes the consumption of paper products, thus increasing the import of papermaking raw materials and packaging paper products in China.
(2)
The import proportion of pulp and paper products is negatively related to the cost factors of trade prices (including import prices, economic distance, and exchange rates). In particular, the increase in import prices significantly reduces the proportion of China’s imports of wood pulp and packaging paper products, while the increase in economic distance significantly reduces the proportion of China’s imports of wood pulp, waste paper, newsprint and printing paper, and industrial paper products. The increase in the exchange rate index significantly reduces the proportion of China’s imports of waste pulp, and China tends to import pulp and paper products with lower trade prices and costs.
(3)
The outbreak of the COVID-19 pandemic significantly increased China’s packaging paper product imports, while it showed a non-significant correlation with other pulp and paper product imports. The state of declining demand for packaging paper products at the beginning of the pandemic will improve with the coming of the post-pandemic era and the rapid development of the e-commerce logistics industry. The increase in demand for packaging paper imports has led to a rapid rise in the position of Indonesia as China’s main trading partner for paper imports.
(4)
The implementation of import restrictions on waste paper significantly promotes the importation of wood pulp, waste pulp, and various paper products in China. Due to the huge demand for paper products in China, the restriction on waste paper has prompted China’s paper companies to start increasing the importation of wood pulp and waste pulp to replace waste paper to meet China’s demand for paper raw materials. The focus of raw material imports has shifted from North America to South America and the Asia-Pacific region. In addition, for various types of paper products, especially newsprint and printing paper as well as packaging paper products, the proportion of imports will also increase accordingly. The Asia-Pacific region, such as India and Indonesia, is gaining ground as a trading partner with China.
(5)
Trade disputes between China and the United States significantly reduce China’s imports of wood pulp, waste paper, and packaging paper products. As the United States was China’s main import trade partner country for wood pulp, waste paper, and packaging paper products, China’s response to trade frictions between China and the United States in the imposition of tariff measures to a certain extent inhibits the normal importation of pulp and paper products, especially the raw materials for paper. Showing a decline in US partner status, the Southeast Asia region has gained importance.

5.2. Limitations and Prospects

In terms of the influencing factors of pulp and paper product trade, although this paper has set common control variables for different pulp and paper products as well as their own specific control variables, in an attempt to find the most suitable control variables for each variable so that the regression results are more reliable, the final selected control variables do not depart from the previous experience and lack innovation. In addition, due to the limitations of space and workload, this paper does not study the influencing factors for all the trading partners of pulp and paper products in China, and only tries to make the trade data representative by using the top 70% of the trade volume. Finally, this paper only presents a descriptive analysis of the market structure of pulp and paper products, and does not verify the spatial relevance of China’s pulp and paper trade through spatially relevant indicators such as the Moran index, which could be a direction for future efforts in this field.
In future research, we will try to quantitatively measure the spatial relevance of China’s pulp and paper product trade through spatially correlated indicators, and predict the future spatial structure trend of pulp and paper trade through scenario analysis with the help of the empirical findings of this paper.

Author Contributions

Conceptualization, H.C. and M.H.; methodology, H.C. and J.W.; software, H.C.; validation, H.C., J.W. and M.H.; formal analysis, H.C. and J.W.; investigation, H.C. and M.H.; resources, H.C. and M.H.; data curation, J.W. and M.H.; writing—original draft preparation, H.C. and J.W.; writing—review and editing, H.C., J.W. and M.H.; visualization, H.C., J.W. and M.H.; supervision, M.H.; project administration, M.H. All authors have read and agreed to the published version of the manuscript.

Funding

This research received no external funding.

Data Availability Statement

Not applicable.

Conflicts of Interest

The authors declare no conflict of interest.

References

  1. Wang, F.; Wu, M. The Impacts of COVID-19 on China’s Economy and Energy in the Context of Trade Protectionism. Int. J. Environ. Res. Public Health 2021, 18, 12768. [Google Scholar] [CrossRef] [PubMed]
  2. Gagnon, B.; MacDonald, H.; Hope, E.; Blair, M.J.; McKenney, D.W. Impact of the COVID-19 Pandemic on Biomass Supply Chains: The Case of the Canadian Wood Pellet Industry. Energies 2022, 15, 3179. [Google Scholar] [CrossRef]
  3. Tian, G. Study on China’s Import Trade and Market in Main Forest Products. Chin. For. Sci. Technol. 2005, 4, 5. [Google Scholar]
  4. Sun, X.; Katsigris, E.; White, A. Meeting China’s demand for forest products: An overview of import trends, ports of entry, and supplying countries, with emphasis on the Asia-Pacific region. Int. For. Rev. 2004, 3a4, 1–10. [Google Scholar] [CrossRef]
  5. Muhammad, A. The end of the trade war? Effects of tariff exclusions on US forest products in China. For. Policy Econ. 2021, 1, 1–10. [Google Scholar]
  6. Turner, J.; Maplesden, F.; Walford, B.; Jacobi, S. Tariff and non-tariff barriers to New Zealand’s exports of wood-based products to China. N. Z. J. For. 2005, 50, 27–33. [Google Scholar]
  7. Robbins, A.S.T.; Perezgarcia, J. Impacts of Illegal Logging Restrictions on China’s Forest Products Trade. Master’s Dissertation, University of Washington, Seattle, WA, USA, 2014. [Google Scholar]
  8. Zhang, J.; Li, F.; Liu, Y.; Cheng, B. An Assessment of Trade Facilitation’s Impacts on China’s Forest Product Exports to Countries Along the “Belt and Road” Based on the Perspective of Ternary Margins. Sustainability 2019, 11, 1298. [Google Scholar] [CrossRef] [Green Version]
  9. Yang, H.; Nie, Y.; Ji, C. Study on China’s timber resource shortage and import structure: Natural Forest Protection Program outlook, 1998 to 2008. For. Prod. J. 2010, 60, 408–414. [Google Scholar] [CrossRef] [Green Version]
  10. Gan, J.B. Effects of China’s WTO accession on global forest product trade. For. Policy Econ. 2004, 6, 509–519. [Google Scholar] [CrossRef]
  11. Jiang, H.; Guo, H.; Li, J. Analysis on Market Characteristics of China’s Forest Products Top Trade Partners. For. Econ. 2019, 41, 45–49. [Google Scholar]
  12. Chen, Y.; Wang, D.; Su, H.; Jiang, H.; Zhang, X. The Impact of Sino-US Trade War on Forest Products Trade and Its Countermeasures. Issues For. Econ. 2019, 39, 1–7. [Google Scholar]
  13. Bank, T.W. Indonesia—Production Forestry: Achieving Sustainability and Competitiveness. Pre-2003 Economic or Sector Report; Washington, DC, USA. 2015. Available online: http://documents.worldbank.org/curated/en/939711468268800796/Indonesia-production-forestry-achieving-sustainability-and-competitiveness (accessed on 20 February 2023).
  14. Sharma, R. Indonesian Pulp and Paper Industry. Pap. Asia 2006, 22, 9–11. [Google Scholar]
  15. Bajpai, P. Future Trends. Pulp Pap. Ind. 2015, 6, 315–320. [Google Scholar]
  16. Xiong, L.; Cheng, B. Study on Trade Cost of Forest Products in China and Its Influencing Factors. J. Int. Trade 2017, 419, 25–35. [Google Scholar]
  17. Li, W.; Wan, L.; Yuan, L. Study on the Influencing Factors of China’s Waste Paper Import Trade. Issues For. Econ. 2018, 38, 21–26+101. [Google Scholar]
  18. Tajdini, A. Estimating the Import Demand Function for Paper and Paper board Products in Iran. Austrian J. For. Sci. 2015, 4, 132–149. [Google Scholar]
  19. Zhang, D. Tariff and US Paper Products Trade. For. Sci. 2019, 65, 77–86. [Google Scholar] [CrossRef] [Green Version]
  20. Tang, S. Study on the influential Factors and International Competitiveness of China’s Paper Trade. Ph.D. Dissertation, Beijing Forestry University, Beijing, China, 2015. [Google Scholar]
  21. Wang, H.; Sui, D. Analysis on the Current Situation, Influencing Factors and Development Countermeasures of Pulp Import Trade in China. Econ. Forum 2019, 2, 116–120. [Google Scholar]
  22. Zhang, R.; Song, W. An Analysis of the Influencing Factors of Chinese Paper and Paperboard Imports. For. Econ. 2015, 37, 52–57. [Google Scholar]
  23. Wang, F.; Liu, S.; Cheng, B.; Jiang, Q.; Tian, Y.; Xiong, L. How Can Intra-Industry Trade of Forest Products be Promoted? An Empirical Analysis from China. Forests 2019, 10, 882. [Google Scholar] [CrossRef] [Green Version]
  24. Cai, X.; Tian, M.; Cai, F.; Wu, C.; Han, M. Empirical Analysis on the Influencing Factors of the Wood Pulp Import in China. For. Econ. 2013, 6, 58–69. [Google Scholar]
  25. Zhang, D.; Li, Y. Forest endowment, logging restrictions, and China’s wood products trade. Chin. Econ. Rev. 2009, 20, 46–53. [Google Scholar] [CrossRef]
  26. Sun, L. Research on Interaction Between Foreign Trade of Paper Products and the Development of China’s Paper Industry. For. Econ. 2012, 244, 61–65. [Google Scholar]
  27. Luo, J. Chinese Newsprint and Printing & Writing Paper Industry. Master’s Dissertation, School of Economics Georgia Institute of Technology, Atlanta, GA, USA, 2003. [Google Scholar]
  28. Phillips, R.B. Global dynamics of the pulp and paper industry-2013. N. Z. J. For. 2013, 58, 34–42. [Google Scholar]
  29. Duan, X. The Research of Environment Regulation Effects on Forests Paper Products Trade in China. Master’s Dissertation, South China Agricultural University, Guangzhou, China, 2018; pp. 48–49. [Google Scholar]
  30. Okoro, S. China’s new policy triggers global change: Capitalization opportunities from imported waste paper policy. China Pap. 2019, 40, 36–39. [Google Scholar]
  31. Ma, Z.; Yi, Y.; Chen, W.; Wang, P.; Wang, C.; Zhang, C.; Gan, J. Material Flow Patterns of the Global Waste Paper Trade and Potential Impacts of China’s Import Ban. Environ. Sci. Technol. 2021, 55, 8492–8501. [Google Scholar] [CrossRef]
  32. Shang, D.; Diao, G.; Liu, C.; Yu, L. Study on the Impacts of China’s Waste Paper Import Restrictive Policies on the Cycle Synchronization between the Chinese and International Waste Paper Markets. J. For. Econ. 2022, 37, 295–318. [Google Scholar] [CrossRef]
  33. Cheng, Y. Impact of China’s New Solid Waste Import Policy on Waste Paper Trade—Based on Historical Data Analysis. J. Hubei Coll. Econ. 2020, 17, 28–30. [Google Scholar]
  34. Di, S.; Gang, D.; Zhao, X. Have China’s regulations on imported waste paper improved its quality. For. Policy Econ. 2020, 119, 102287. [Google Scholar] [CrossRef]
  35. Feng, S.; Chen, K. Impact of Environmental Information Disclosure Policy and Trade on Chinese Paper Industry Environmental Effects. Int. J. Environ. Res. Public Health 2022, 19, 11614. [Google Scholar] [CrossRef]
  36. Zhang, L.; Meng, Z. The impact of carbon peaking and carbon neutrality on the paper industry in the 14th Five-Year Plan period. China Pap. 2021, 42, 9–13. [Google Scholar]
  37. Yang, Y.C. Environmental Regulation and International Trade. Ph.D. Dissertation, University of Connecticut, Storrs, CT, USA, 2006. [Google Scholar]
  38. Huang, J.; Wu, Z. Impact of Environmental Regulations on Export Trade—Empirical Analysis Based on Zhejiang Province. Int. J. Environ. Res. Public Health 2022, 19, 12569. [Google Scholar] [CrossRef] [PubMed]
  39. Tian, G.; Yu, W.; Vu, T.T.H.; Ma, G.-Y. Green Assessment of Imports and Exports of Wooden Forest Products Based on Forest Processing Industry: A Case Study of China. Forests 2021, 12, 166. [Google Scholar] [CrossRef]
  40. Zhang, F. The Impact of Trade Dispute on Import Demand for Coated Graphic Printing Paper Products in the U.S. In Proceedings of the 2015 Society of American Foresters Annual Convention, Baton Rouge, LA, USA, 3–7 November 2015. [Google Scholar]
  41. Han, J.; Song, J. Impact of Sino-US Trade Friction on Import and Export Trade Pattern of Soybean in Heilongjiang. Asian Agric. Res. 2019, 3, 4. [Google Scholar]
  42. Yu, L.; Chen, Y.F.; Han, Y.J. Evolution characteristics and policy implications of the global soybean trade network. Res. Agric. Mod. 2019, 40, 674–682. [Google Scholar]
  43. Yue, L.; Lou, C.; Du, Y.; Tu, X. An Analysis of the Impact of Sino-US Trade Friction Based on the Tariff Lists. J. Financ. Econ. 2019, 45, 59–72. [Google Scholar]
  44. Zhang, W.; Zhang, X.; Wang, Y. The Impact of Sino-US Trade Friction on China’s Forest Products Trade—A Simulation Analysis Based on GTAP Model. For. Econ. 2019, 41, 3–9. [Google Scholar]
  45. Gan, J.B. Forest certification costs and global forest product markets and trade: A general equilibrium analysis. Can. J. For. Res. 2005, 35, 1731–1743. [Google Scholar] [CrossRef]
  46. Chen, J.; Wang, L.; Li, L.; Magalhães, J.; Song, W.; Lu, W.; Xiong, L.; Chang, W.; Sun, Y. Effect of Forest Certification on International Trade in Forest Products. Forests 2020, 11, 1270. [Google Scholar] [CrossRef]
  47. Zhang, J.; Zhao, Z.; Zhao, W.; Tao, C.; Cheng, B. The Impact of Forest Certification on the Ternary Margins of China’s Forest Product Export. Forests 2022, 13, 1313. [Google Scholar] [CrossRef]
  48. Millan. WTO dispute settlement proceeding regarding China-countervailing and anti-dumping duties on grain oriented flat-rolled electrical steel from the United States-recourse by the United States to article 21.5 of the dsu. Fed. Regist. 2009, 79, 13731–13732. [Google Scholar]
  49. Shen, Y.; Yan, H.; Wei, W.U. Anti-Dumping, Industry Protection and SMEs Development: Reflection on the Case of Chinese Coated Paper. In Proceedings of the 12th West Lake International Conference on Small & Medium Business, Hangzhou, China, 24–26 October 2010. [Google Scholar]
  50. Qiu, X.; Yu, J. Changes in the rules of the international competitive environment of China’s paper industry and their impact—An analysis based on a low-carbon perspective. Pract. Foreign Econ. Relat. Trade 2014, 9, 40–43. [Google Scholar]
  51. Buongiorno, J. GFPMX: A Cobweb Model of the Global Forest Sector, with an Application to the Impact of the COVID-19 Pandemic. Sustainability 2021, 13, 5507. [Google Scholar] [CrossRef]
  52. Zanello, R.; Shi, Y.; Zeinolebadi, A.; Kooten, G. COVID-19 and the Mystery of Lumber Price Movements. Forests 2023, 14, 152. [Google Scholar] [CrossRef]
  53. Muhammad, A.; Hellwinckel, C.M.; Anosike, E.; Taylor, A. Economic Impact of the COVID-19 Pandemic on Tennessee Forest Product Exports; Extension Report; University of Tennessee: Knoxville, TN, USA, 2022. [Google Scholar]
  54. Morland, C.; Schier, F.; Weimar, H. The Structural Gravity Model and Its Implications on Global Forest Product Trade. Forests 2020, 11, 178. [Google Scholar] [CrossRef] [Green Version]
  55. Shen, X.; Lovri, M. Structural determinants of global trade in graphic paper and pulp products. For. Policy Econ. 2022, 134, 102629. [Google Scholar] [CrossRef]
  56. Jonsson, R. Trends and Possible Future Developments in Global Forest-Product Markets—Implications for the Swedish Forest Sector. Forests 2011, 2, 147–167. [Google Scholar] [CrossRef] [Green Version]
  57. Nasrullah, M.; Liu, C.; Khan, K.; Rizwanullah, M.; Zulfiqar, F.; Ishfaq, M. Determinants of forest product group trade by gravity model approach: A case study of China. For. Policy Econ. 2020, 113, 102117. [Google Scholar] [CrossRef]
  58. Guan, Z.; Sheong, J. Determinants of bilateral trade between China and Africa: A gravity model approach. J. Econ. Stud. 2020, 47, 1015–1038. [Google Scholar] [CrossRef]
  59. Tae-Young, K.; Kyung-Ae, A. The Effects of WTO Trade Facilitation on Bilateral Trade Flows: Spatial Gravity Model Approach. Korea Trade Rev. 2014, 39, 161–183. [Google Scholar]
  60. Zhang, H. A Review of Extensions and Applications of Trade Gravity Models. Bus. Econ. 2010, 2, 68–70. [Google Scholar]
  61. Bakouan, M.; Ouedraogo, I.M. Intra-African Trade and Spatial Dependence: Revisiting Africa Intra-Trade Determinants with a Spatial Structural Gravity Model. Theor. Econ. Lett. 2022, 12, 149–171. [Google Scholar] [CrossRef]
  62. Yue, Y.; Xie, D. Study of Factors Influencing China-ASEAN Agricultural Product Trade Development in the Context of “the Belt and Road”. Asian Agric. Res. 2021, 12, 20–26. [Google Scholar]
  63. Joseph, B. Gravity models of forest products trade: Applications to forecasting and policy analysis. Forestry 2016, 89, 117–126. [Google Scholar]
  64. Wu, T.; Zhang, B.; Cao, Y.; Sun, P. Impact of Multi-Dimensional and Dynamic Distance on China’s Exports of Wooden Forest Products to Countries along the “Belt and Road”. Sustainability 2020, 12, 3339. [Google Scholar] [CrossRef] [Green Version]
  65. Tian, M.; Niu, J.; Chen, K.; Chen, J.; Cheng, J. Analysis of the Impact of Sino-US Trade Friction on International Trade of Chinese Wood Forest Products. Issues For. Econ. 2022, 42, 449–461. [Google Scholar]
  66. Wang, M. New Changes in the global trade pattern in the post-epidemic era and China’s policy response. Prices Mon. 2022, 5, 34–41. [Google Scholar]
  67. Shah, P. COVID-19 Impact Analysis on Logistics Industry. 2020. Available online: https://xueshu.baidu.com/usercenter/paper/show?paperid=1b0y00g0jg7r0aw0hy0u0v60c9032591&site=xueshu_se&hitarticle=1%E2%80%9D (accessed on 20 February 2023).
  68. Niu, Q. Zero imports after the domestic paper recycling industry how to deal with opportunities and challenges. China Pap. Newsl. 2021, 2, 13–16. [Google Scholar]
  69. Kawasaki, T.; Wakashima, H.; Shibasaki, R. The use of e-commerce and the COVID-19 outbreak: A panel data analysis in Japan. Transp. Policy 2021, 115, 88–100. [Google Scholar] [CrossRef]
  70. Fang, J. Analysis of the impact of the new crown epidemic on the packaging paper market in 2020. China Pulp Pap. Ind. 2021, 42, 59–60. [Google Scholar]
  71. Halim, M.A. The Impact of E-commerce on Consumer Purchasing Behavior for the Coronavirus Disease (COVID-19). Sustain. Bus. Econ. 2022, 5, 9. [Google Scholar]
  72. Zhao, H.; Wangm, L. Global waste paper market: A shifting trade landscape. China Pulp Pap. Ind. 2021, 42, 57–59. [Google Scholar]
Figure 1. Percentage of China’s main import trading partners for pulp and paper products. (a) Pulp and paper products; (b) paper raw materials; (c) paper products.
Forests 14 00674 g001
Figure 2. Percentage of major import trading partners of paper raw materials. (a) Wood pulp; (b) waste paper; (c) waste paper pulp.
Forests 14 00674 g002aForests 14 00674 g002b
Figure 3. Percentage of major import trading partners for paper products in 2006–2021. (a) Newsprint and printing paper; (b) packaging paper products; (c) industrial paper products.
Forests 14 00674 g003
Table 1. Major trading partners selected and trade share in 2021.
Pulp and Paper ProductsTrade
Share (%)
Raw MaterialsTrade Share (%)Paper ProductsTrade Share (%)Wood PulpTrade Share (%)Waste PaperTrade Share (%)
Brazil22Brazil22Indonesia12Brazil26US60
Indonesia16Indonesia16Japan10Canada16Japan17
Canada10Canada14US9Indonesia15Hong Kong9
Chile8Chile9Sweden7Chile9Canada5
US7US8Russia7US7UK2
Sweden4Finland8Taiwan6Russia5Netherlands2
Japan3Russia5Republic of Korea6
Taiwan1Thailand3Laos5
Waste PulpTrade
Share (%)
Newsprint and Printing PaperTrade Share (%)Packaging PaperTrade Share (%)Industrial PaperTrade Share (%)
Thailand43Indonesia37India11Japan29
Malaysia21Russia14Indonesia10US20
Indonesia10Japan7US9Germany14
US10Canada6Vietnam9Republic of Korea6
Taiwan9Sweden6Russia9Taiwan4
Vietnam3Republic of Korea5Laos9France4
Laos2 Taiwan9
Table 2. Variable selection.
VariableIndicator DescriptionUnit
Explained
variables
IMPProportion of pulp imported by trading partners%
IMPPProportion of paper products imported by trading partners%
Explanatory
variables
PGDPCGDP per capita in Chinadollar
PGDPGDP per capita of trading partnersdollar
DISEconomic distance between trade supply and demandkm/dollar
ROEExchange rate index_
PERM3Pulpwood production per capita of trading partnersM3/
PRICETrade price of pulp and paper productsdollar
ANTIChina’s anti-dumping duty on US, Europe, and Japan
COVID-19COVID-19 pandemic_
BANChina’s restrictions on waste paper imports_
WARTrade disputes between China and the United States_
Table 3. Results of robustness tests.
VariablesF-TestLM TestHausman Test
Wood pulp63.88 ***55.94 ***55.21 ***
0.000.000.00
Waste pulp8.81 ***69.62 ***34.53 ***
0.000.000.00
Waste Paper16.86 ***145.38 ***26.84 ***
0.000.000.00
Newsprint and printing paper7.25 ***56.7 ***29.14 ***
0.000.000.00
Packaging paper11.6 ***192.1 ***67.78 ***
0.000.000.00
Industrial Paper48.30 ***55.61 ***116.41 ***
0.000.000.00
Note: ***, **, and * represent significance levels of 1%, 5%, and 10%, respectively.
Table 4. Results of pulp and paper product imports.
VariablesWood PulpWaste PulpWaste PaperNewsprint and Printing PaperPackaging
Paper
Industrial
Paper
LNPGDPC1.834 ***5.406 ***0.9301.0425.016 ***0.0329
(0.197)(1.266)(0.714)(0.796)(1.473)(0.262)
LNPGDP3.090 ***17.63 ***8.767 **0.13412.98 ***1.189
(0.604)(3.097)(3.502)(2.206)(3.191)(0.783)
LNDIS−0.109 *−0.775−5.189 *−0.614 **−0.361−0.364 **
(0.0573)(0.548)(2.930)(0.261)(0.400)(0.141)
LNROE−0.0432−0.327 *−0.0468−0.0553−0.0609−0.00336
(0.0318)(0.175)(0.0541)(0.120)(0.129)(0.0328)
LNPERM31.117 ***0.4150.2031.4480.2170.0291
(0.219)(0.479)(0.308)(1.207)(0.595)(0.219)
LNPRICE−0.448 *−0.0195−0.00175−0.272−2.740 ***−0.00705
(0.252)(0.323)(0.418)(0.258)(0.606)(0.0277)
WAR−0.306 *−0.942−0.667 *−0.465−0.247 *−0.282
(0.172)(1.023)(0.373)(0.947)(0.713)(0.219)
COVID-19−0.0169−0.326−1.407 ***−0.4451.285 *−0.0350
(0.153)(0.891)(0.349)(0.812)(0.715)(0.224)
BAN0.156 ***4.643 ***−0.742 ***0.686 **1.816 ***0.156
(0.149)(0.926)(0.269)(0.739)(0.606)(0.162)
ANTI −0.741−0.152
(0.812)(0.139)
Constant32.54 ***−116.6 ***−97.48 **0.671−46.34 **21.43 ***
(5.171)(24.24)(45.96)(17.91)(20.58)(7.006)
Observations304304304304304304
R-squared0.8290.7210.6320.4100.7370.370
p-value0.00040.00060.0000.00160.00000.0013
Note: ***, **, and * represent significance levels of 1%, 5%, and 10%, respectively.
Table 5. Results of robustness tests.
VariablesWood PulpWaste PulpWaste PaperNewsprint and
Printing Paper
Packaging
Paper
Industrial
Paper
WAR−0.094 *−5.064−0.521 *−0.163−0.477 *−0.0324
(0.189)(1.207)(0.358)(0.873)(0.721)(0.206)
COVID-19−0.321−0.619−1.192 ***−0.2270.321 *−0.274
(0.167)(0.842)(0.362)(0.802)(0.618)(0.182)
BAN0.0855 ***1.770 ***−0.157 ***0.709 **1.940 ***0.177
(0.161)(1.087)(0.294)(0.643)(0.629)(0.184)
R-squared0.8210.6600.6110.4200.7620.380
p-value0.0000.0000.0000.0000.0000.001
Note: ***, **, and * represent significance levels of 1%, 5%, and 10%, respectively.
Table 6. Results of systematic GMM estimation.
VariablesWood PulpWaste PulpWaste PaperNewsprint and
Printing Paper
Packaging
Paper
Industrial
Paper
L.IMP1.405 ***0.7447 **1.231 ***1.2781 ***1.8538 ***0.3308 ***
(0.1748)(0.3198)(0.3838)(0.0653)(0.6378)(0.4095)
LNPGDPC1.569 ***9.758 ***2.4101.1410.15 ***2.919
(0.032)(0.052)(0.657)(0.820)(0.095)(1.754)
LNPGDP2.718 ***12.65 **7.92 **5.08910.88 ***5.858
(0.846)(0.403)(0.076)(5.365)(0.091)(1.956)
LNDIS−0.275 *−0.424−6.21 **−0.345 **−2.770−1.639 ***
(0.154)(2.182)(2.451)(0.722)(7.126)(0.243)
LNROE−0.00178−0.235 *−0.0276−0.0525−0.159−0.0111
(0.0316)(0.216)(0.0377)(0.0929)(0.131)(0.0213)
LNPERM30.518 ***0.6570.4691.7190.5980.647
(0.570)(1.138)(0.527)(1.469)(0.655)(0.592)
LNPRICE−0.763 *−0.330−0.659−0.373−1.478 ***−0.0129
(0.501)(0.504)(0.375)(0.205)(1.110)(0.0144)
WAR−0.235 *−0.582−0.426 *−1.901−1.932 *−0.313
(0.334)(2.150)(0.395)(0.874)(1.323)(0.291)
COVID-19−0.178−1.469−0.735 **−0.4192.805 **−0.0292
(0.279)(1.999)(0.518)(0.315)(1.267)(0.233)
BAN0.270 ***3.727 ***−0.105 ***0.320 **3.340 ***0.154
(0.235)(1.522)(0.237)(0.499)(1.066)(0.138)
ANTI −3.340−0.154
(1.066)(0.138)
Observation304304304304304304
AR (1)−2.517 **−2.378 **−3.39 ***−2.11 **−2.026 **−2.74 ***
AR (2)1.53−0.3810.851.341.428−0.74
Sargan67.6469.0771.4670.2568.860.16
Note: ***, **, and * represent significance levels of 1%, 5%, and 10%, respectively.
Disclaimer/Publisher’s Note: The statements, opinions and data contained in all publications are solely those of the individual author(s) and contributor(s) and not of MDPI and/or the editor(s). MDPI and/or the editor(s) disclaim responsibility for any injury to people or property resulting from any ideas, methods, instructions or products referred to in the content.

