Article

Vegetation Dynamics and Their Response to Climate Changes and Human Activities: A Case Study in the Hanjiang River Basin, China

1
Faculty of Resources and Environmental Science, Hubei University, Wuhan 430062, China
2
School of Politics and Public Administration, Zhengzhou University, Zhengzhou 450001, China
3
School of Land Science and Technology, China University of Geosciences (Beijing), Beijing 100083, China
*
Author to whom correspondence should be addressed.
Forests 2023, 14(3), 509; https://doi.org/10.3390/f14030509
Submission received: 13 January 2023 / Revised: 25 February 2023 / Accepted: 27 February 2023 / Published: 4 March 2023

Abstract

:
The Hanjiang River Basin (HJRB) is an important water conservation and ecological barrier area for the South–North Water Transfer Central Project. The quantitative analysis of regional differences in vegetation changes and their main drivers is important for the monitoring of the ecological environment of the basin and formulation of ecological protection measures. Based on MODIS13Q1 data from 2000 to 2020, spatiotemporal variation characteristics of vegetation in the HJRB were analyzed using Theil–Sen + Mann–Kendall, the Hurst index, and correlation analysis. Then, we detected the drivers using an optimal parameter geographic detector. The results showed that from 2000 to 2020, the average NDVI value increased from 0.651 to 0.737, with a spatial distribution pattern of “high in the northwest and low in the southeast”, and 88.68% of the study area showed an increase in vegetation cover, while 5.80% showed a significant degradation. The positive persistence of future vegetation changes is stronger than the negative. It may show a slowdown or degradation trend, among which the vegetation restoration along the Han River and urbanized areas need to be strengthened. The factor detector indicated that the main factors influencing vegetation change were topography and climate, for which the most influential variables, respectively, were elevation (0.1979), landform (0.1720), slope (0.1647), and soil type (0.1094), with weaker influence from human activity factors. The interaction test results showed that the interaction of various geographic factors enhanced the explanatory power of vegetation changes and showed mainly nonlinear and two-factor enhancements. The dominant factor varies between sub-basins; for example, the interaction between wind speed and land use conversion was the dominant factor in the middle reaches of the HJRB; the dominant factor in the lower reaches of the HJRB was expressed as the interaction between land use conversion and temperature. Finally, the effects of the range or category of different drivers on vegetation growth were systematically analyzed. The results of the study contribute to the understanding of the dynamic changes of vegetation based on a comprehensive consideration of the interaction of topography, climate, and human activities, taking into account the totality and variability of the geographical environment, and provide a reference for the ecological restoration and rational use of vegetation resources in the HJRB.

1. Introduction

As an essential part of terrestrial ecosystems, vegetation plays a crucial role in global soil conservation, climate regulation, hydrologic processes, the carbon cycle, and ecosystem stability [1,2,3]. Vegetation not only represents the dynamic characteristics of terrestrial ecosystems, but is also considered a sensitive indicator of ecosystems’ responses to climate change and human activities, and essentially represents the overall situation of the ecological environment [4]. Changes in the spatial–temporal patterns of vegetation not only change the pattern and function of the regional landscape, but also affect the ecosystem structure, leading to weaker resilience in maintaining and promoting the stability of the ecosystem [5,6,7]. Therefore, monitoring long-time-series vegetation dynamics and identifying the driving mechanisms is essential to elucidating the interactions between vegetation and ecosystems. They can provide an important references for regional ecological security and sustainable development [8,9,10].
Remote sensing data have become an effective means of monitoring and evaluating vegetation and obtaining ecological information due to their advantages of having long time series, short interval periods, and broad coverage [11,12]. The ratio vegetation index (RVI), difference vegetation index (DVI), and normalized difference vegetation index (NDVI) are the more common forms of vegetation indices [13]. The normalized difference vegetation index (NDVI) is a parameter of the ratio of the reflectivity of the infrared band (RED) and the near-infrared band (NIR) to reflect the growth status, biomass, and type of vegetation. It can eliminate most radiometric errors caused by sun angle, topography, and cloud shadows and is widely used to monitor vegetation changes [14,15]. GIMMS NDVI is suitable for long-time-series vegetation cover studies, but has low spatial resolution and performs poorly in humid regions [16]. SPOT NDVI time series are relatively long and have high spatial resolution, but can introduce errors in vegetation change due to sensor variation [17]. MODIS NDVI sensors are specifically designed for vegetation index inversion, and the improvement of synthetic data algorithms has also improved the ability to monitor changes in MODIS NDVI products, avoiding problems of sensor degradation and data uncertainty [18]. In addition, various alternative indicators have been proposed for the issue of saturation at higher biomass levels and the effect of soil brightness. For example, the enhanced vegetation index (EVI), which can improve saturation at higher biomass levels, and has obvious advantages in vegetation change in tropical, subtropical, or complex vegetation types [19], or the soil adjusted vegetation index (SAVI), which is more suitable for arid areas with sparse vegetation and bare soil surfaces [20].
Climate change and human activities are the main drivers of vegetation change, while the diversity and heterogeneity of geographical environments can also contribute to spatial differences in factors affecting vegetation [21,22].Climatic factors mainly affect the growth of vegetation through the direct or indirect control of heat, water, and nutrients through changes in precipitation and temperature [23,24,25]. For instance, Ji et al. [26] showed that continued increases in temperature could extend the growing season and promote vegetation growth in high latitudes and mountainous regions. However, Zheng et al. [27] found that higher temperatures intensify drought and inhibit vegetation growth in mid–low latitudes and arid and semi-arid regions. Cheng et al. [28] identified precipitation as the critical condition for vegetation growth in arid and semi-arid regions. Instead, in humid regions.,the increase in precipitation will inhibit the growth of vegetation. In addition to climate change, human activities also significantly impact vegetation changes. Examples include urbanization [29], population migration [30], cropland abandonment [31], overgrazing [32], large water conservancy projects [33], and ecological engineering [34] having significant positive or negative effects on vegetation change. In the late 1990s, the Chinese government launched the Grain for Green Project, which has been proven to significantly contribute to the increase in vegetation coverage on the Loess Plateau [35,36,37]. Compared with climate factors and human activities, topographic factors are more stable. They mainly directly control the redistribution of water and heat, and indirectly affect soil’s physical and chemical properties and vegetation changes. However, in a specific area, geomorphic conditions often play a central role in interacting with physical and geographical elements such as hydrology, vegetation, and soil [38,39]. Therefore, vegetation change is a process in which various factors interact, and it remains challenging to quantitatively assess the contribution of multiple factors to vegetation change.
At present, many studies have used methods such as correlation analysis [40], linear regression [41], and residual analysis [42] to monitor and attribute dynamic vegetation changes, assuming that there is a significant linear relationship between vegetation changes and driving factors. However, the driving factors (natural factors or human activities) affecting vegetation change do not exist in isolation; rather, they are interconnected, interacting, and restrict one another [43]. Due to the interaction of multiple factors, the responses of vegetation to environmental disturbances and changes are complex and non-linear [44,45,46,47]. Although residual analysis is widely used to distinguish the relative influence of climatic factors and human activities on vegetation dynamics, it is difficult to explore the strength of the explanatory power of vegetation cover changes when climatic factors and human activities interact [48]. The geographic detector is a new statistical method model based on the theory of spatially stratified heterogeneity, which not only quantifies the influence of each factor on geographic phenomena or attributes, but also can detect the unique advantages of the interaction between different factors in relation to the geographic phenomena or attributes [49]. It does not have to follow the linear assumptions of traditional statistical methods strictly and has been widely used in the fields of human health [50,51], land use [52,53], and ecosystem services [54,55]. Determining the optimal scale of spatial stratification heterogeneity through spatial data discretization is a crucial link in using geographic detectors, but generally, based on experience, the optimal combination of spatial differentiation is rarely used as a geographic detector model parameter to reveal the driving factors [56].
As a significant ecological security barrier in China, the Hanjiang River Basin (HJRB) is the water source of the central route of the South-to-North Water Transfer Project, and its environmental position is significant [57]. With the development of society and the economy, the contradiction between environmental protection and economic growth in the HJRB has gradually become prominent, and ecological resources such as vegetation are threatened, so it is urgent to carry out monitoring and evaluation to understand the spatial and temporal dynamic characteristics of vegetation and the driving forces behind it, in order to achieve the precise and sustainable management of vegetation resources in watersheds. Previous studies on the spatial and temporal changes of vegetation cover in the HJRB have mainly focused on the effects of basin-wide climate change on vegetation changes [58,59,60]. Research on the mechanisms of influence on the dynamics of vegetation changes in sub-basins is still insufficient. In addition, the driving mechanisms of climate, topography, hydrology, soil, and human activities on vegetation change and the interaction of internal factors have yet to be systematically studied, ignoring the variability and integrality of the geographical environment. Based on the comprehensive consideration of topography, climate change, human activities and other factors, this study introduces an optimal parameter geographic detector to identify the dominant factors and their interactions with vegetation changes in different watersheds and sub-basins. It is helpful to understand the process mechanism of vegetation change, predict future development directions, and propose scientific regulation strategies. The main objectives of this study are: (1) to analyze the temporal and spatial dynamic trends and future change patterns of vegetation in the HJRB; (2) to identify the response mechanism of vegetation changes in the HJRB to climate change; and (3) to identify the dominant factors and interactions of vegetation change in the HJRB.

2. Materials and Methods

2.1. The Study Area

The Hanjiang River is the first major tributary of the Yangtze River, originating at the southern foot of the Qinling Mountains in Shaanxi Province, with a total length of 1577 km and a total area of 159,000 km2 through Shaanxi and Hubei Provinces. It is located between 106°15′ E~114°20′ E and 30°10′ N~34°20′ N, and has a subtropical monsoon climate, with an annual average precipitation of 804 mm and an annual average temperature of 12–16 °C [61]. In this study, the HJRB was divided into three tertiary basins based on water resource zoning (Figure 1a): the basin above the Danjiangkou (upstream), the Tangbai River Basin (midstream), and the basin below the Danjiangkou (downstream) [57].

2.2. Data

In this study, the MODIS vegetation data were obtained from MOD13Q1 data released by the NASA MODIS Land Processes Distributed Active Archive Center (https://ladsweb.modaps.eosdis.nasa.gov/, accessed on 28 June 2022), with a spatial resolution of 250 m and a temporal resolution of 16 days, spanning the period from February 2000 to December 2020. After preprocessing the obtained data with MRT (MODIS Reprojection Tools) software for format conversion, reprojection, and stitching, we used Matlab 2022b for Savitzky–Golay filtering to eliminate the mixing noise in the images and improve the NDVI band quality. The maximum value composite (MVC) method was used to eliminate the effects of atmospheric, cloud, and solar altitude angle factors to obtain monthly NDVI. We selected NDVI data from the vegetation growing season (April-October) for analysis, and the annual-scale MODIS-NDVI dataset was obtained by mean synthesis using ArcGIS10.8 software.
Meteorological data were obtained using daily temperature, precipitation, relative humidity, sunshine duration, and wind speed from 90 meteorological stations around the HJRB from 2000 to 2020, provided by the National Meteorological Science Data Center (https://data.cma.cn/, accessed on 10 October 2021). The raster data with the same spatial and temporal resolution and projection as the vegetation NDVI were obtained using ANUSPLIN 4.2 interpolation [62], which effectively captured differences in climate data with changes in the altitude gradient.
The soil type, landform type, vegetation type, and land use data were obtained from the Resource and Environment Data Center of the Chinese Academy of Sciences (https://www.resdc.cn/, accessed on 10 May 2022), and were processed with reference to the 1:1 million Soil Map, 1:1 million Landform Map, 1:1 million Vegetation Atlas to obtain the respective first-level types, and resampled to 250 m resolution.
Digital elevation model (DEM) data (250 m × 250 m) were obtained from the Geospatial Data Cloud (https://www.gscloud.cn/, accessed on 20 May 2021), and the aspect and slope data were processed using ArcGIS 10.8.
Population density data were obtained from the WorldPop data platform (https://www.worldpop.org/, accessed on 10 June 2021).
The night lighting data from the China Artificial Nighttime Lighting Dataset (PANDA) was provided by the National Tibetan Plateau Scientific Data Center (https://data.tpdc.ac.cn/, accessed on 27 June 2022) for the period 2000-2020.

2.3. Analysis Method

2.3.1. Theil–Sen Trend Analysis and Mann–Kendall Significance Test

Theil–Sen median analysis is a trend method for long time series with stable nonparametric statistics. The advantage of this method is that the sample does not have to follow a specific distribution during the calculation process and is free from outlier interference, noise immunity, and more scientifically, credible results [63]. The formula was calculated as follows:
β = m e a n ( x i x j i j ) , j > i
where  x i  and  x j  are time series data; when  β  > 0, it reflects that the NDVI shows an increasing trend, and vice versa.
The Mann–Kendall test is a non-parametric statistical test to assess the significance of a trend, given as follows [64]:
S = i n 1 j = i + 1 n s g n ( x j x i )
w h e r e , s g n ( x j x i ) = { + 1 , x j x i > 0 0 , x j x i = 0 1 , x j x i < 0
Z c = { S 1 V a r ( S ) , i f   S > 0                   0 , i f   S = 0 S + 1 V a r ( S ) , i f   S < 0
where  S  is the test statistic;  Z c  is the standardized test statistic;  x i  and  x j  are the time series data, and n is the number of series samples.
w h e r e V a r ( S ) = n ( n 1 ) ( 2 n + 5 ) 18
When |Z| > 1.65, |Z| > 1.96, and |Z| > 2.58, the trend passes the significance test of 90%, 95%, and 99%, respectively. We set α = 0.05 in this study.

2.3.2. Hurst Index

The Hurst index is based on the rescaling range analysis method (R/S), which can quantitatively characterize the persistence of variables in time series and determine the time direction [65]. The formula was calculated as follows:
R ( T ) S ( T ) = ( m T ) H
R ( T ) = X 1 t T m a x ( t , T ) X 1 t T m i n ( t , T )
S ( T ) = 1 T t = 1 T ( N D V I T N D V I T ¯ ) 2
X ( t , T ) = t = 1 T ( N D V I t N D V I T ¯ )
N D V I T ¯ = 1 T t = 1 T N D V I x
where H is the Hurst index;  R ( T )  is the extreme deviation series;  S ( T )  is the standard deviation series; m is a constant with the value of 1;  X ( t , T )  is the cumulative deviation;  N D V I t  (t = 1, 2, …, n) is the NDVI time series;  N D V I T ¯  (T = t, t + 1, …, n) is the  N D V I t  mean value series.
If H = 0.5, it means that the future change trend is not related to the past change; if 0 < H < 0.5, it means that the future change trend is opposite to the past change; if 0.5 < H < 1, it means that the future change trend is consistent with the past change; the closer H is to 1, the stronger the continuity.

2.3.3. Correlation Analysis

Correlation analysis reflects the degree and direction of correlation between elements, and the correlation coefficient was used to express the correlation between NDVI and meteorological factors in this study [28]. The formula was calculated as follows:
R x y = i = 1 n ( x i x ¯ ) ( y i y ¯ ) i = 1 n ( x i x ¯ ) 2 i = 1 n ( y i y ¯ ) 2
where x and y are the means of different variables during the study period. The t-test was used for significance testing, and the correlation between NDVI and climatic factors was classified as significantly correlated (p < 0.05) and not significantly correlated (p < 0.05).

2.3.4. Geographical Detector Model (GDM)

Three parts of the OPGD model were used in this study to explore factors influencing the NDVI, including optimal discretization, factor detector, and interaction detector.

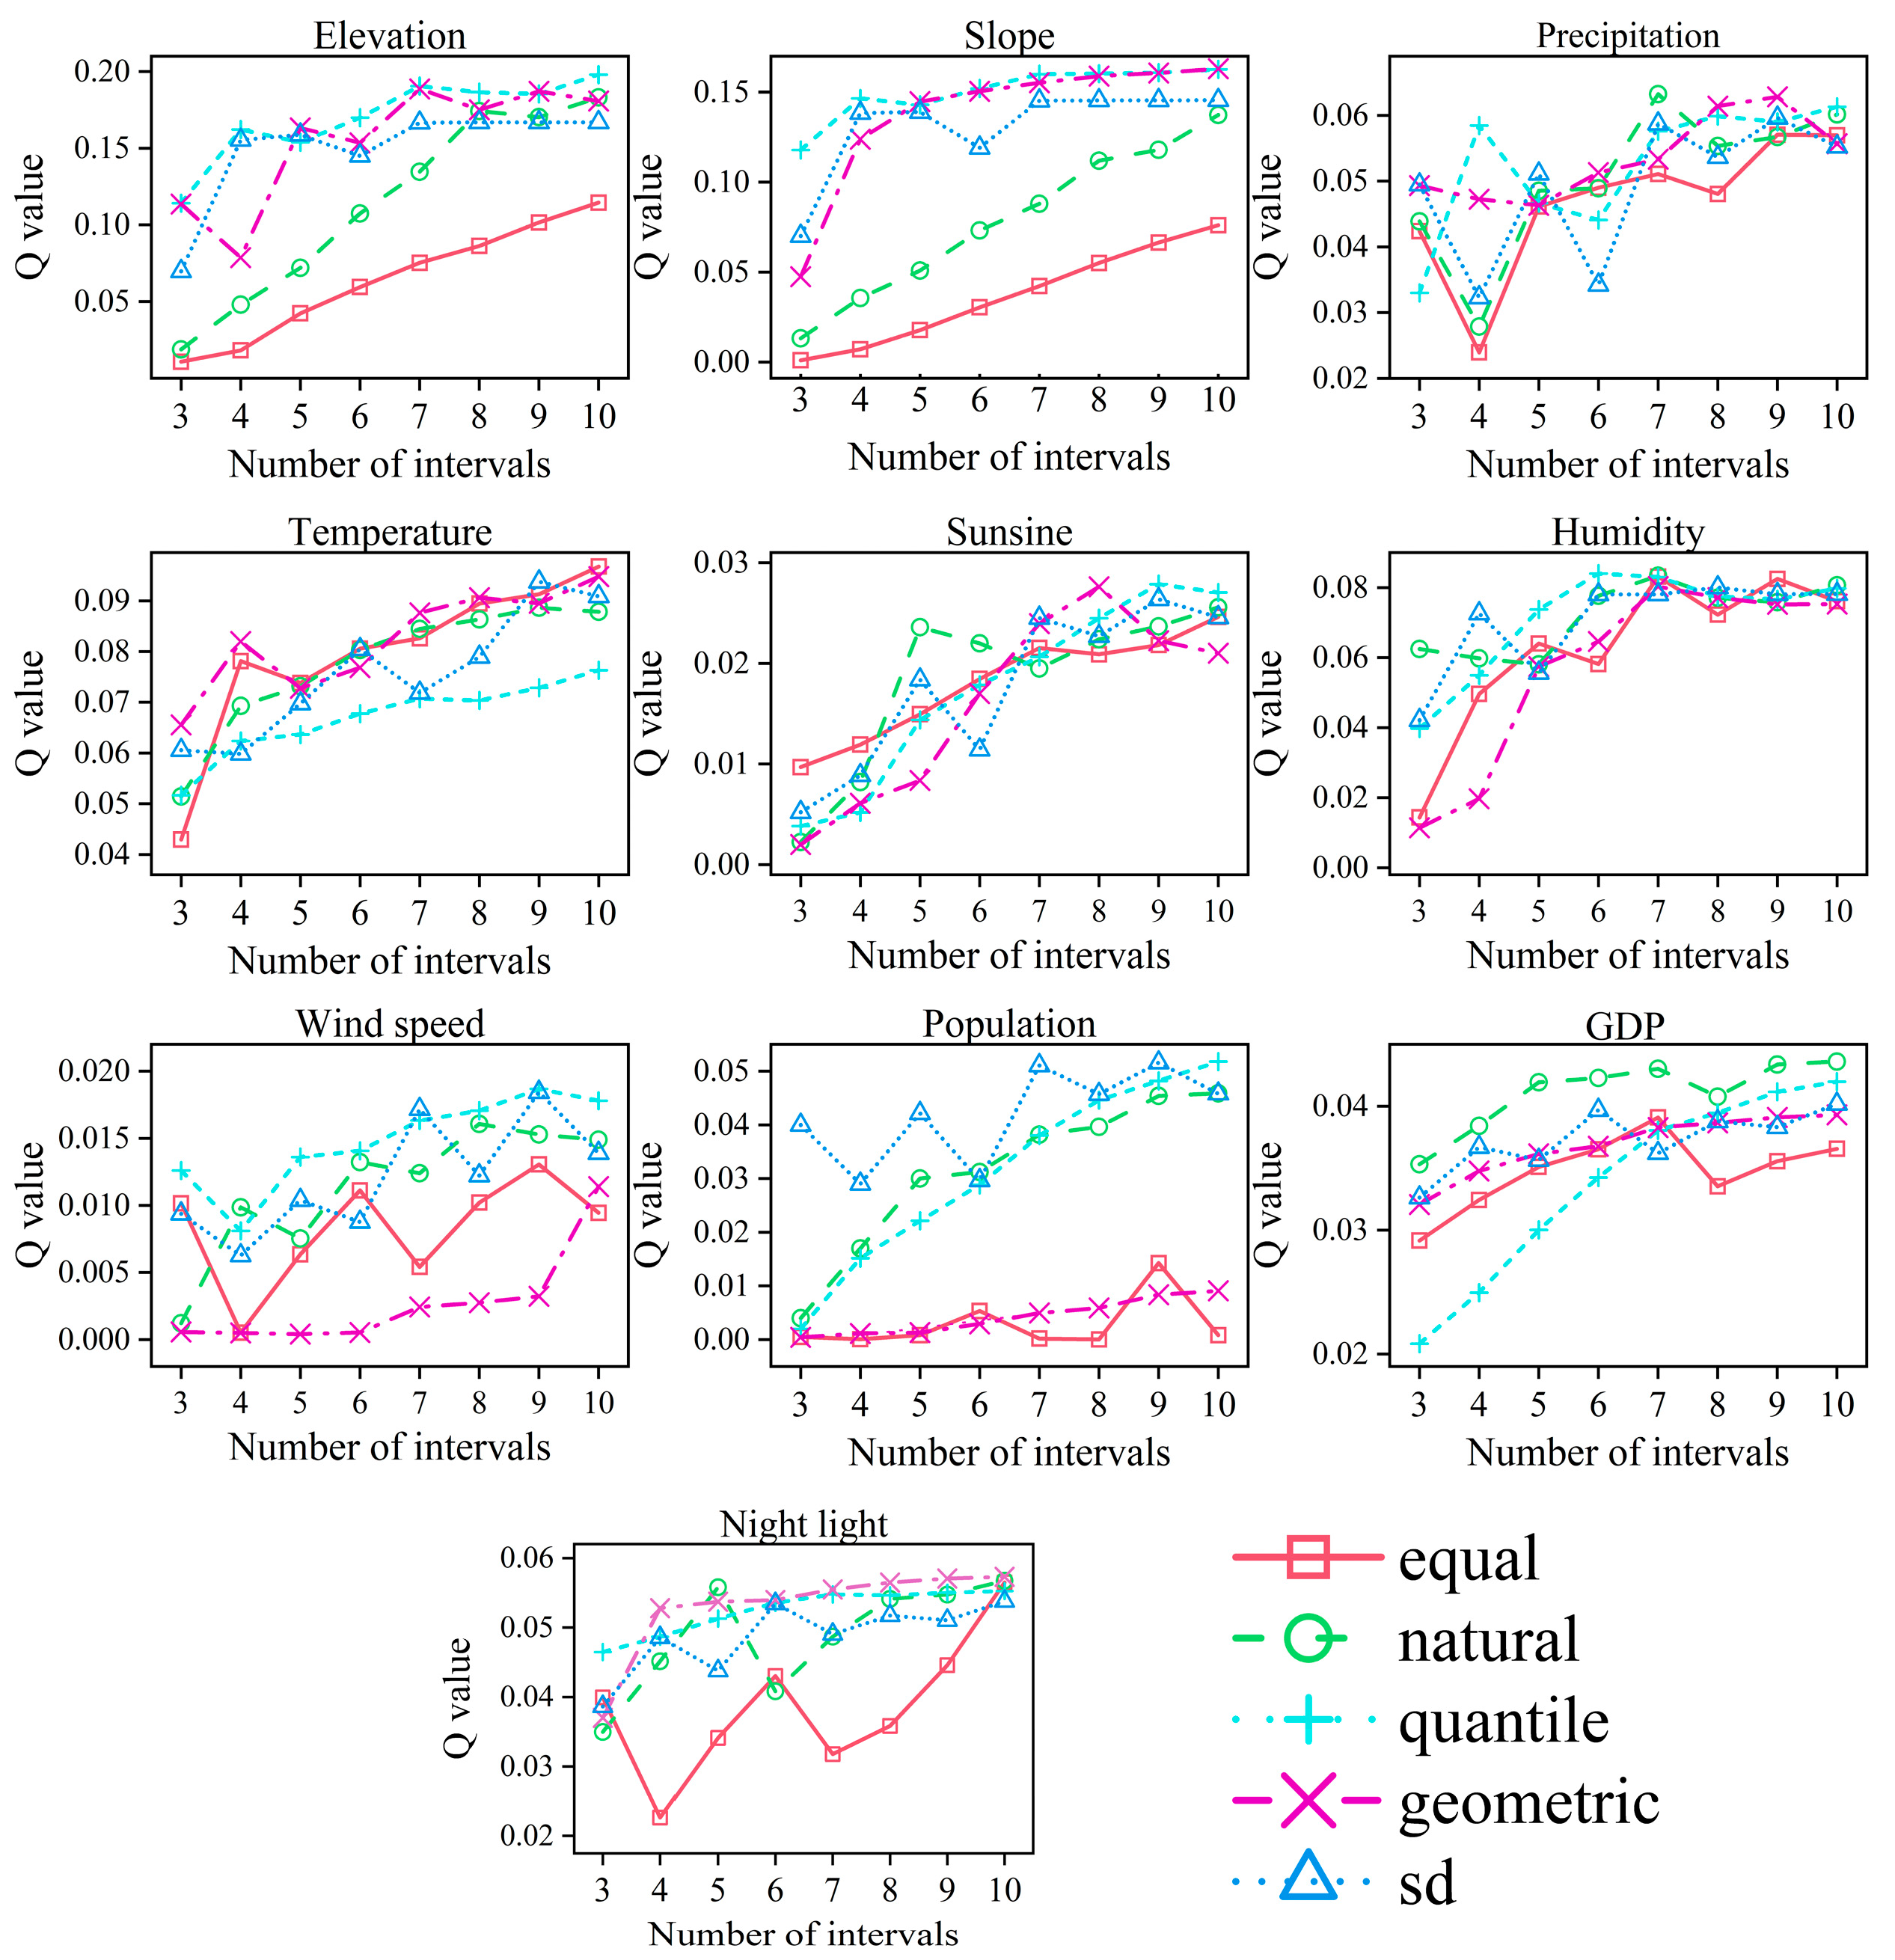
OPGD-Based Data Analysis Method

The purpose of optimal discretization is to discretize continuous variables into categorical variables. This study used the “GD” package of R programming to run the OPGD model [56]. Determining the optimal scale of spatially stratified heterogeneity through spatial data discretization is a crucial aspect of using the geographical detector. In this study, we used five discretization methods (equal, natural, quantile, geometric, and standard deviation) to convert continuous data into categorical data. Combining related studies [8,66,67] and the stability values observed in this study(Figure 2), the maximum number of stratifications was limited to 10, and a combination of the discrete method and the number of intervals with the highest q value was automatically selected for the final dispersion.

Geographical Detector

(1) Factor detector. The driving force of the spatial variation of vegetation change is revealed by using the factor detector in the geographic detector based on the selection of optimal parameters.
q = 1 h = 1 L N h σ h 2 N σ 2 = 1 S S W S S T
where the q value represents the explanatory power of the factor, and its value range is 0 to 1.  N h  and  N  are the numbers of units in layer h and the entire region; h is the stratification of explanatory variables or explained variables.  σ h 2  and  σ 2 , respectively, represent the variance of layer h and the Y value of the whole area; SSW and SST are the sum of the variance within the layer and the total variance of the entire region, respectively.
(2) Interaction detector. The interaction detector judges the characteristics of the interaction between two variables by comparing the q value of the single factor and the q value of the two-factor interaction [49]. Interaction discriminations are shown in Table 1 for reference.

Factor Selection

The formation of the spatial characteristics of vegetation cover results from the joint action of the natural environment and socioeconomic factors. Based on the previous studies and the actual situation of the HJRB, we selected 15 geographic factors in three categories: basic topography, climate change, and human activities. These are based on two perspectives: static and spatiotemporal dynamic changes. (i) The variability of NDVI in the HJRB was used as the dependent variable to be analyzed; (ii) elevation, landform type, slope, aspect, vegetation type, and soil type were the basic natural factors, characterizing the static shaping effect of the basic geographic pattern. (iii) We used Matlab 2022 trend analysis applied to the rate of change of precipitation, temperature, sunshine duration, relative humidity, wind speed, population density, GDP, and night light index to characterize the spatiotemporal variability of climatic factors and human activities. Land-use conversion types were obtained by overlaying 2000 and 2020 land use data with the ArcGIS 10.8 raster calculator. The final data set consisted of 1 dependent variable and 15 independent variable resolution factors, which were used as input data for the geodetector.

3. Results

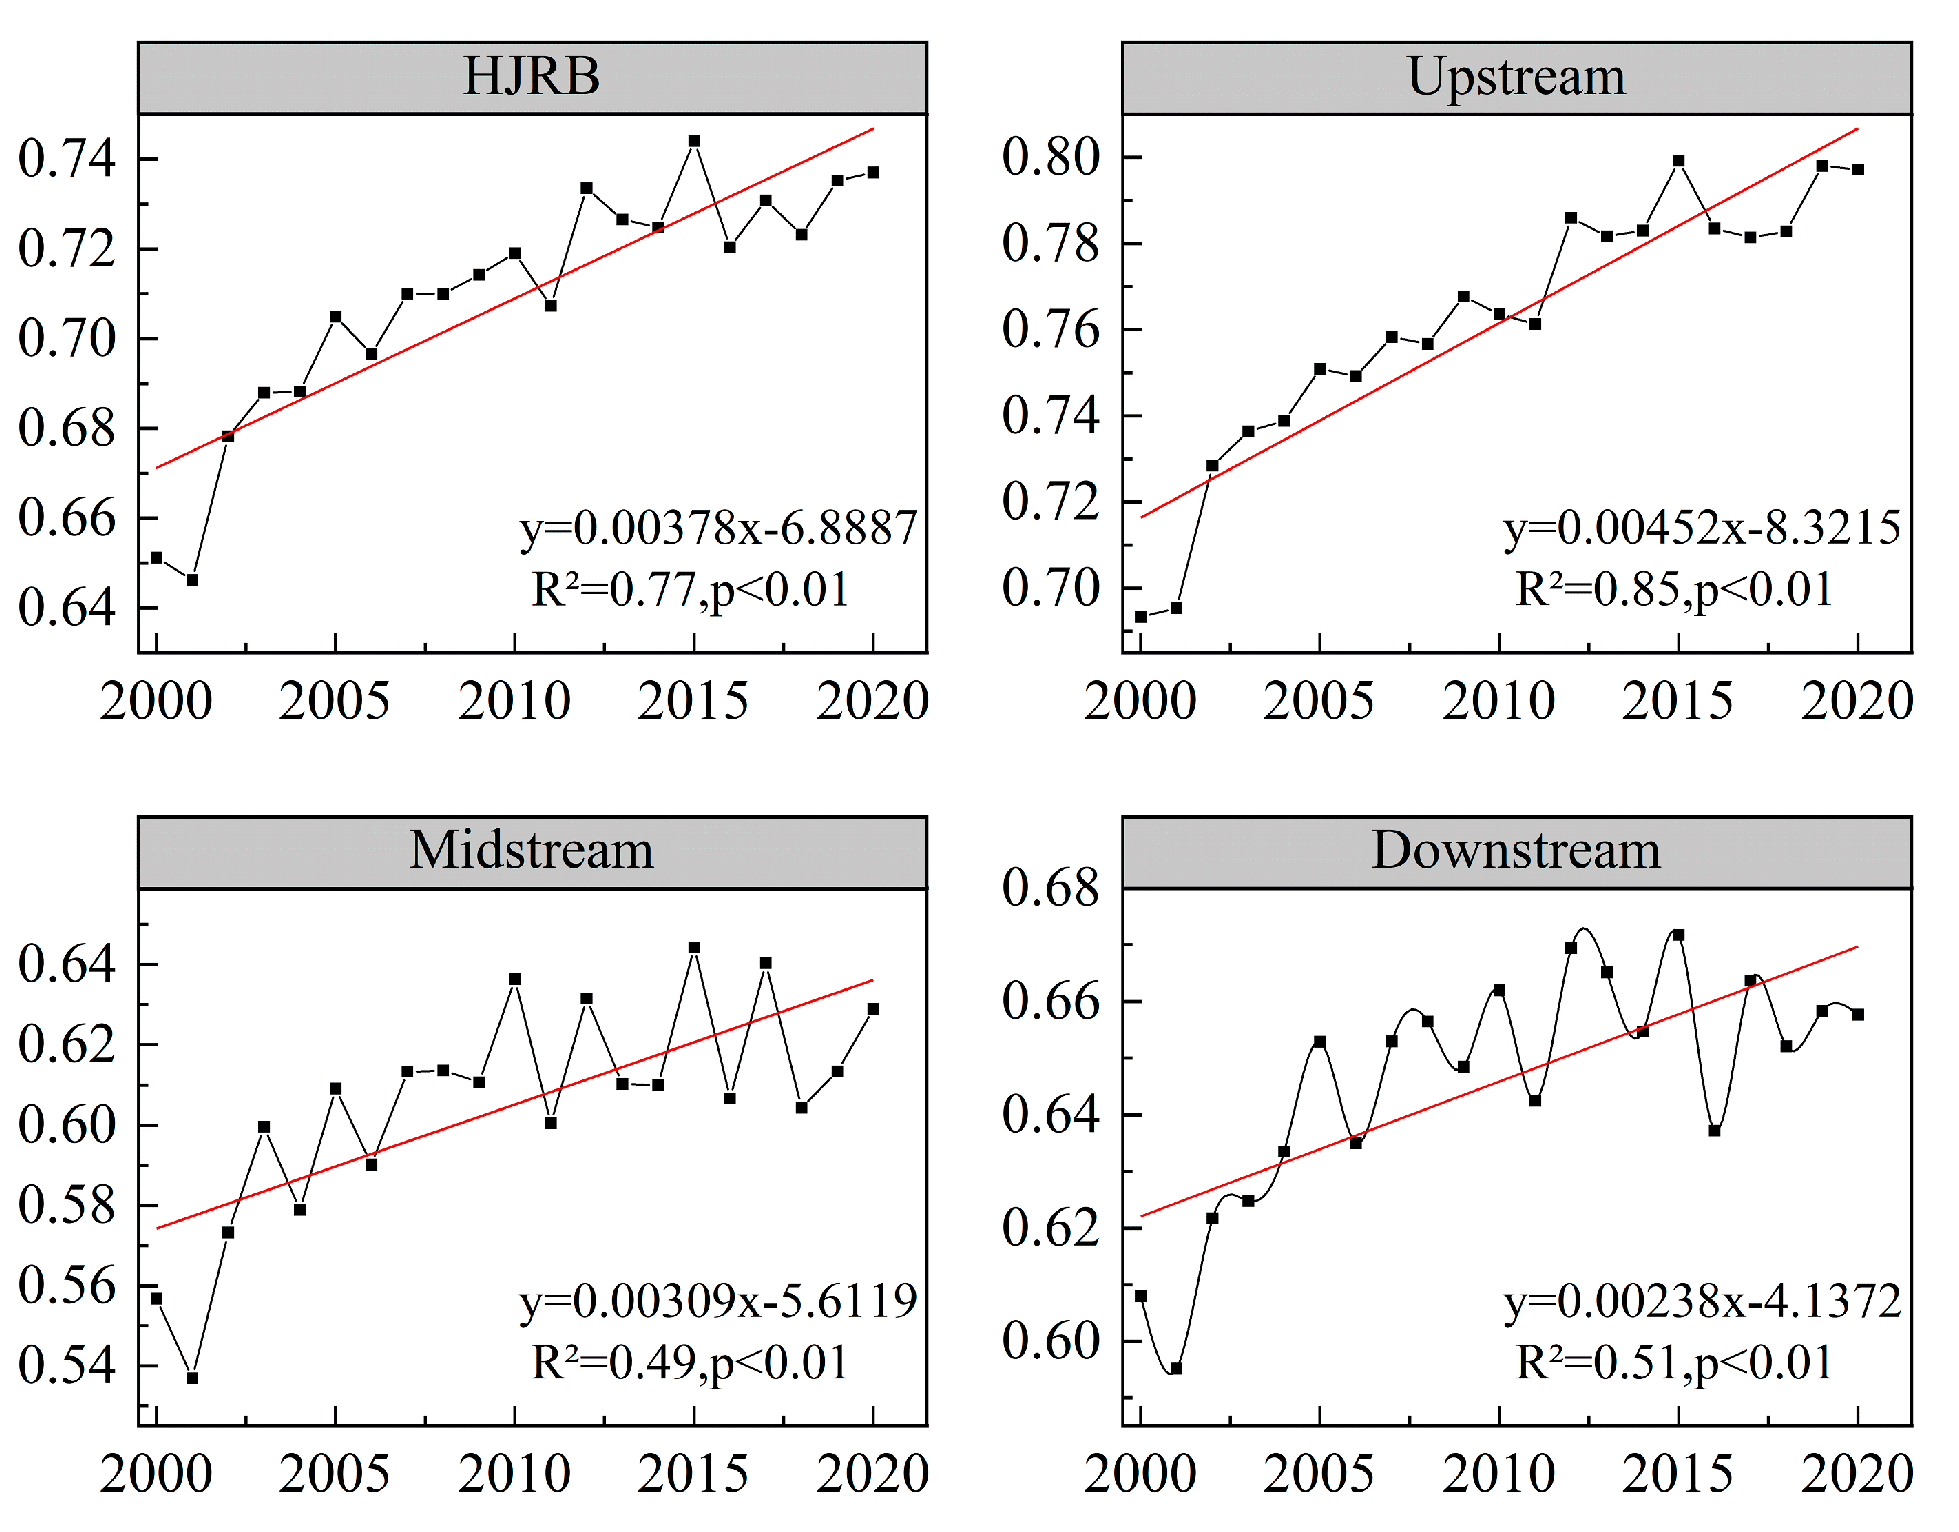
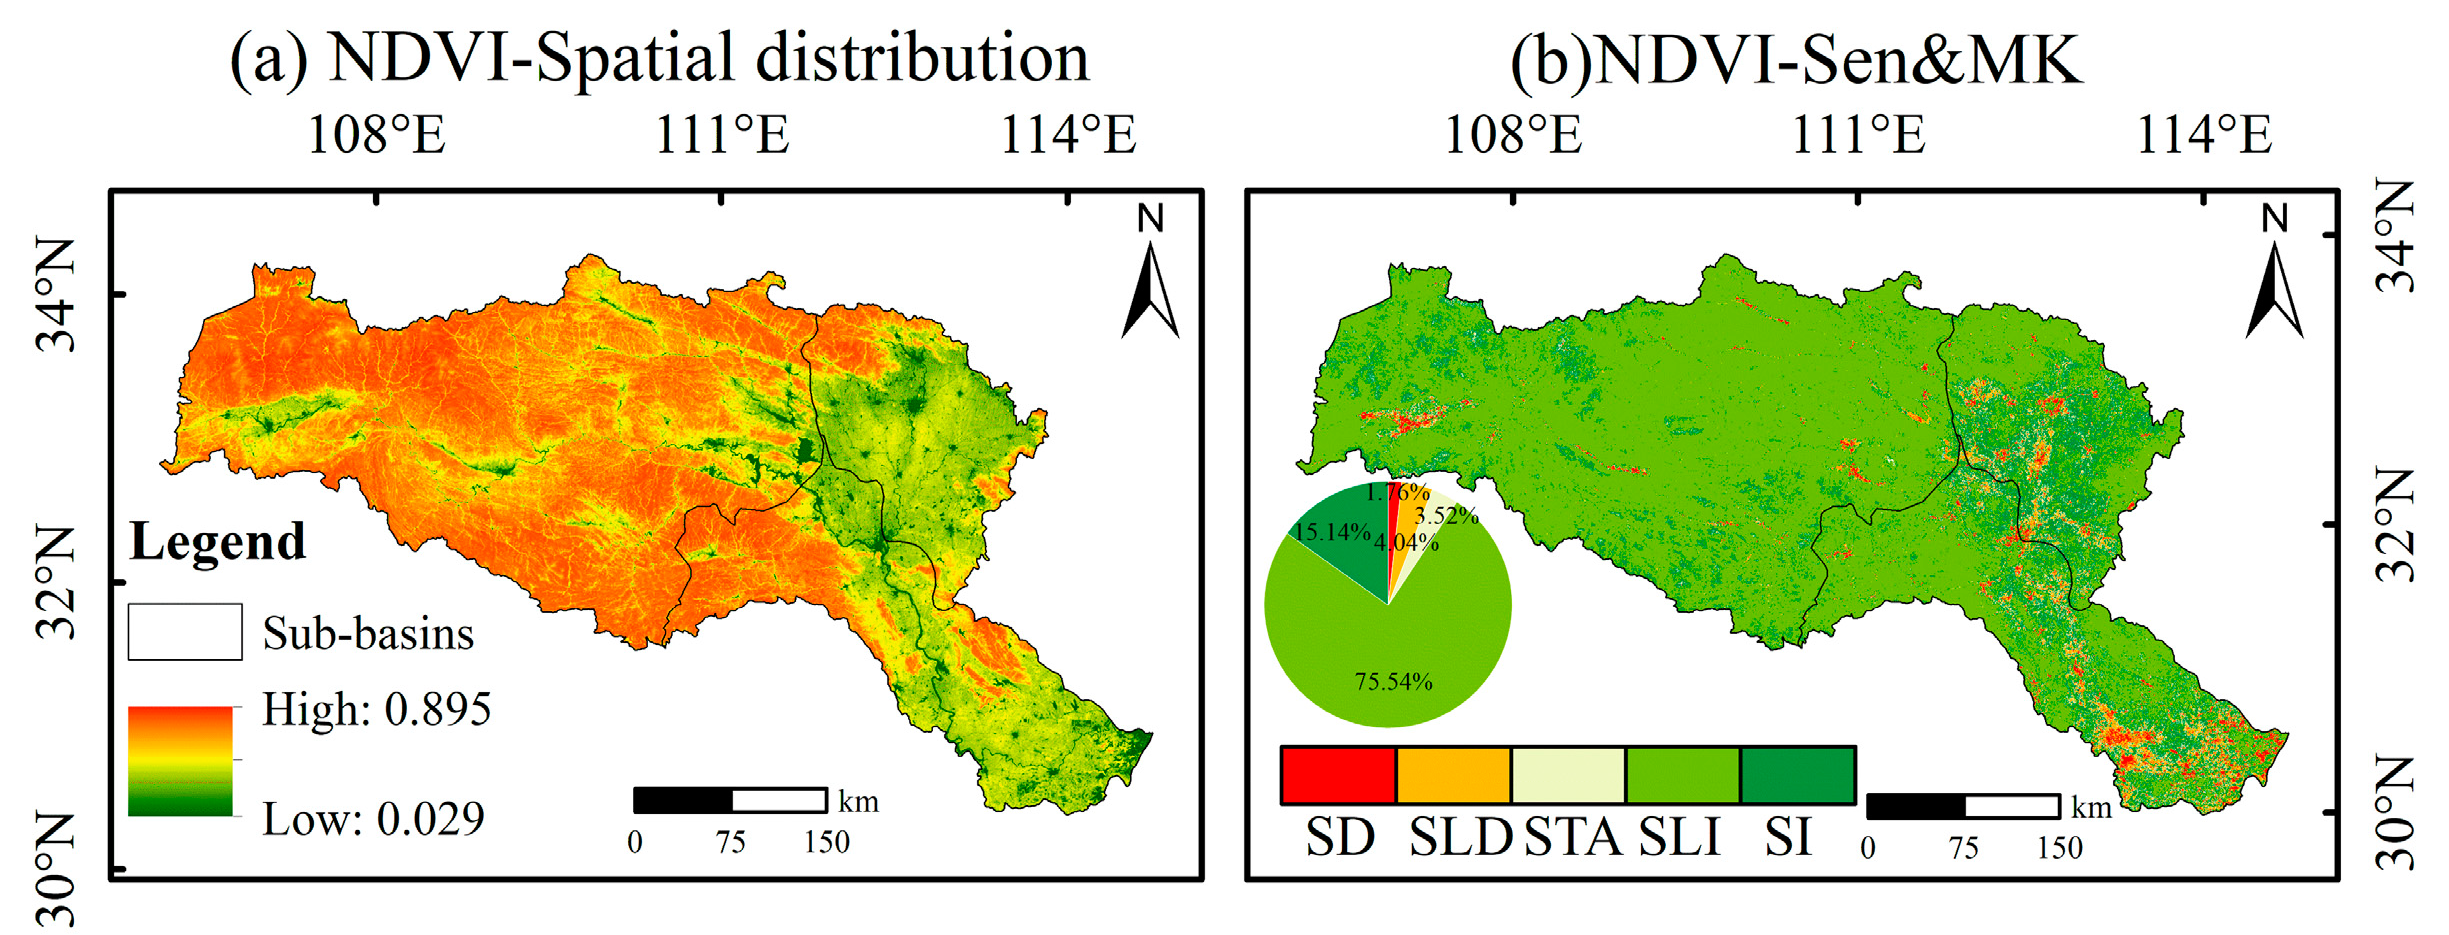
3.1. Spatiotemporal Changes of the NDVI in the HJRB

From 2000 to 2020, the interannual variation in the growing season vegetation in the HJRB showed a significant fluctuation and increasing trend (Figure 3), with an interannual growth rate of 0.00380/y, from 0.651 in 2000 to 0.737 in 2020; the lowest value appeared in 2001, and the highest value appeared in 2015. The multi-year growth rate is 13.21%, and the HJRB vegetation has been effectively improved in the past 21 years. Vegetation in different watersheds showed a fluctuating increasing trend in growing seasons, but specific differences existed. The overall trend was as follows: the upper reaches of the HJRB (4.52%/10a) > the lower reaches of the HJRB (3.09%/10a) > the middle reaches of the HJRB (2.38%/10a).
As can be seen from Figure 4a, the overall NDVI of the HJRB shows a spatial distribution pattern of “high in the northwest and low in the southeast”. The Theil–Sen median analysis combined with the Mann–Kendall test was used to divide the results into five categories: significant degradation (SD), slight degradation (SLD), stable (STA), slight improvement (SLI), and significant improvement (SI) (Table 2). Slight improvement and significant improvement occupy the most prominent positions, accounting for 74.54% and 15.14%, respectively; they are mainly distributed in forests, grassland, or forest protection areas in the upper HJRB, which are also the main implementation areas for ecological protection and restoration. The proportions of significant degradation and slight degradation are 1.76% and 4.04%, respectively, showing the characteristics of “surrounding points along the line”, concentrated in urban and riverside areas. In general, the vegetation coverage in the HJRB was in a better condition from 2000 to 2020, as the area of vegetation improvement was gradually increasing in this period, and the area of degradation was slowly decreasing.

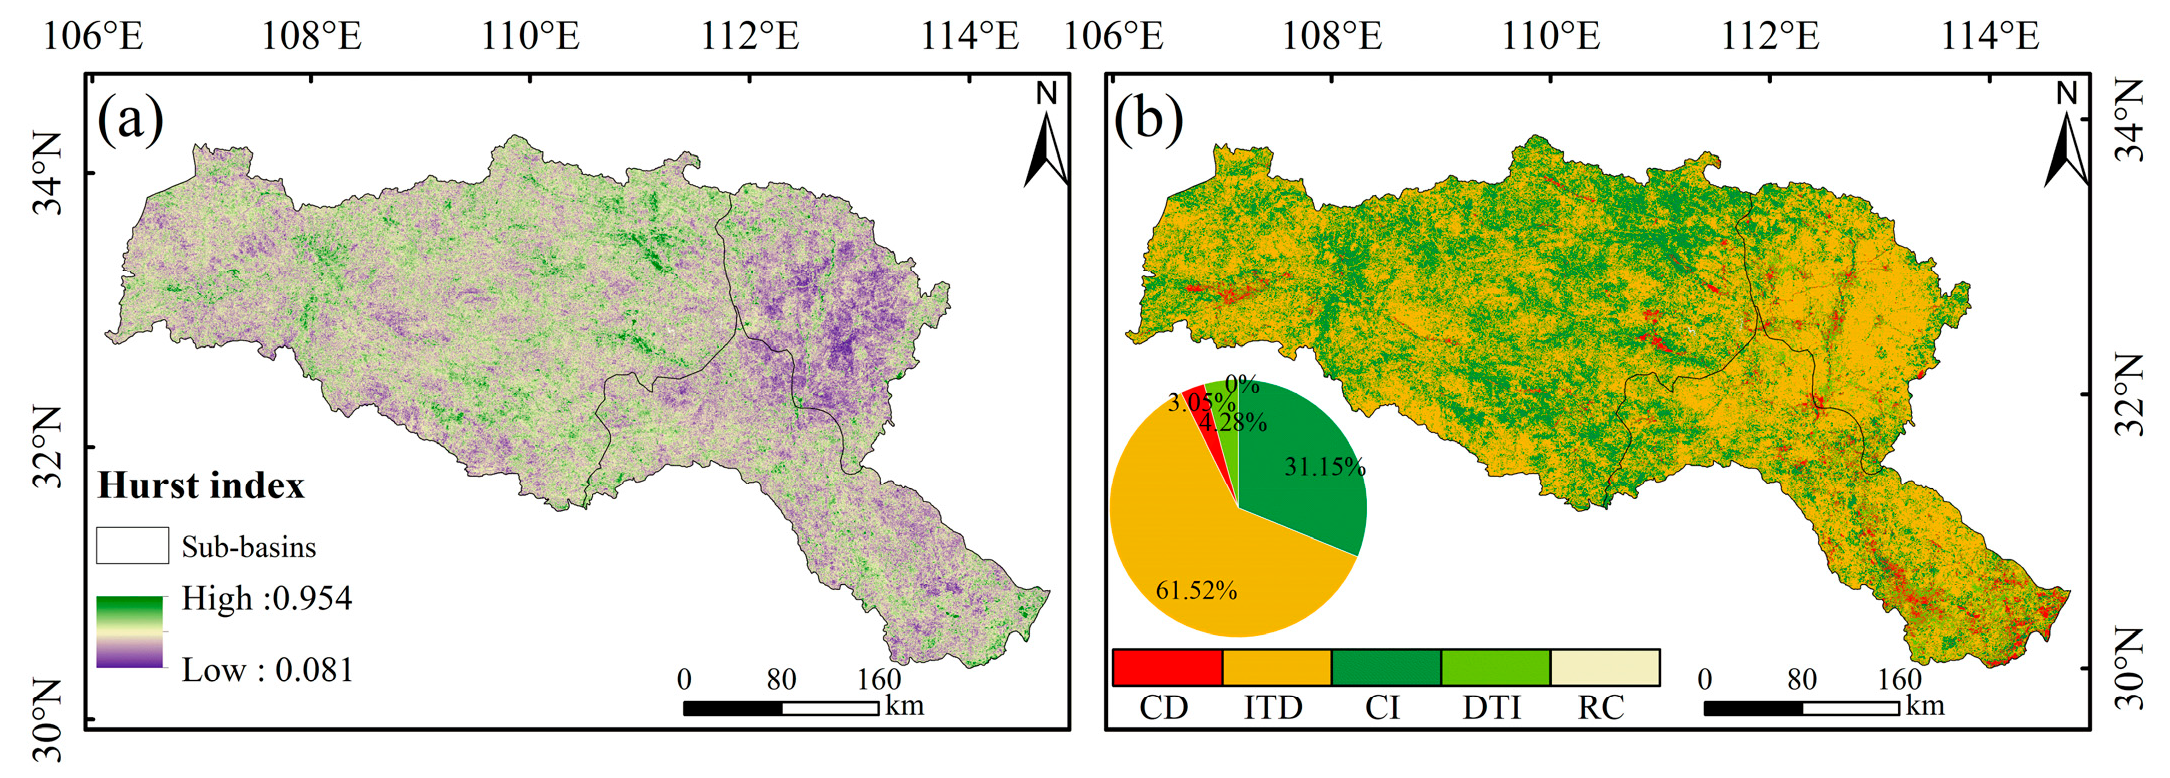
3.2. Sustainability Characteristics of Vegetation Cover Change

The Hurst index of vegetation coverage in the HJRB from 2000 to 2020 ranged from 0.0814 to 0.9543, and the average Hurst index was 0.5331. The percentage of the Hurst index greater than 0.5 is 65.80%, and for that less than 0.5, it is 34.20%, indicating that the positive persistence of vegetation change in the HJRB is stronger than the negative persistence (Figure 5). The future change trend of vegetation is obtained by superimposing the Hurst index and the Sen trend, and the results are divided into five levels: continuous improvement (CI), increasing to decreasing (ITD), continuous decreasing (CD), decreasing to increasing (DTI), and random change (RC).
The future continuous improvement area reached 31.16%, mainly in the upper reaches of the HJRB, which is a key area for ecological protection and management. The percentage of an area that may develop from an increasing to decreasing trend in the future is 61.50%, which is mainly situated in the Nanyang Basin and the northwestern part of the HJRB. In recent years, implementing ecological restoration projects has led to a rapid recovery of vegetation coverage for a short period. However, ecological restoration has become more difficult due to the diminishing marginal utility of ecological effects. The area that will turn from decreasing to increasing in the future is 3.05%, mainly in the Nanyang Basin and along the HJR, and various ecological restoration projects have promoted vegetation improvement. The area of continuously decreasing areas is 4.28%, mainly located in the Nanyang Basin and the rapid urbanization area of Wuhan City Circle, which needs to focus on ecological restoration.

3.3. Driving Mechanisms of Changes in Vegetation Coverage

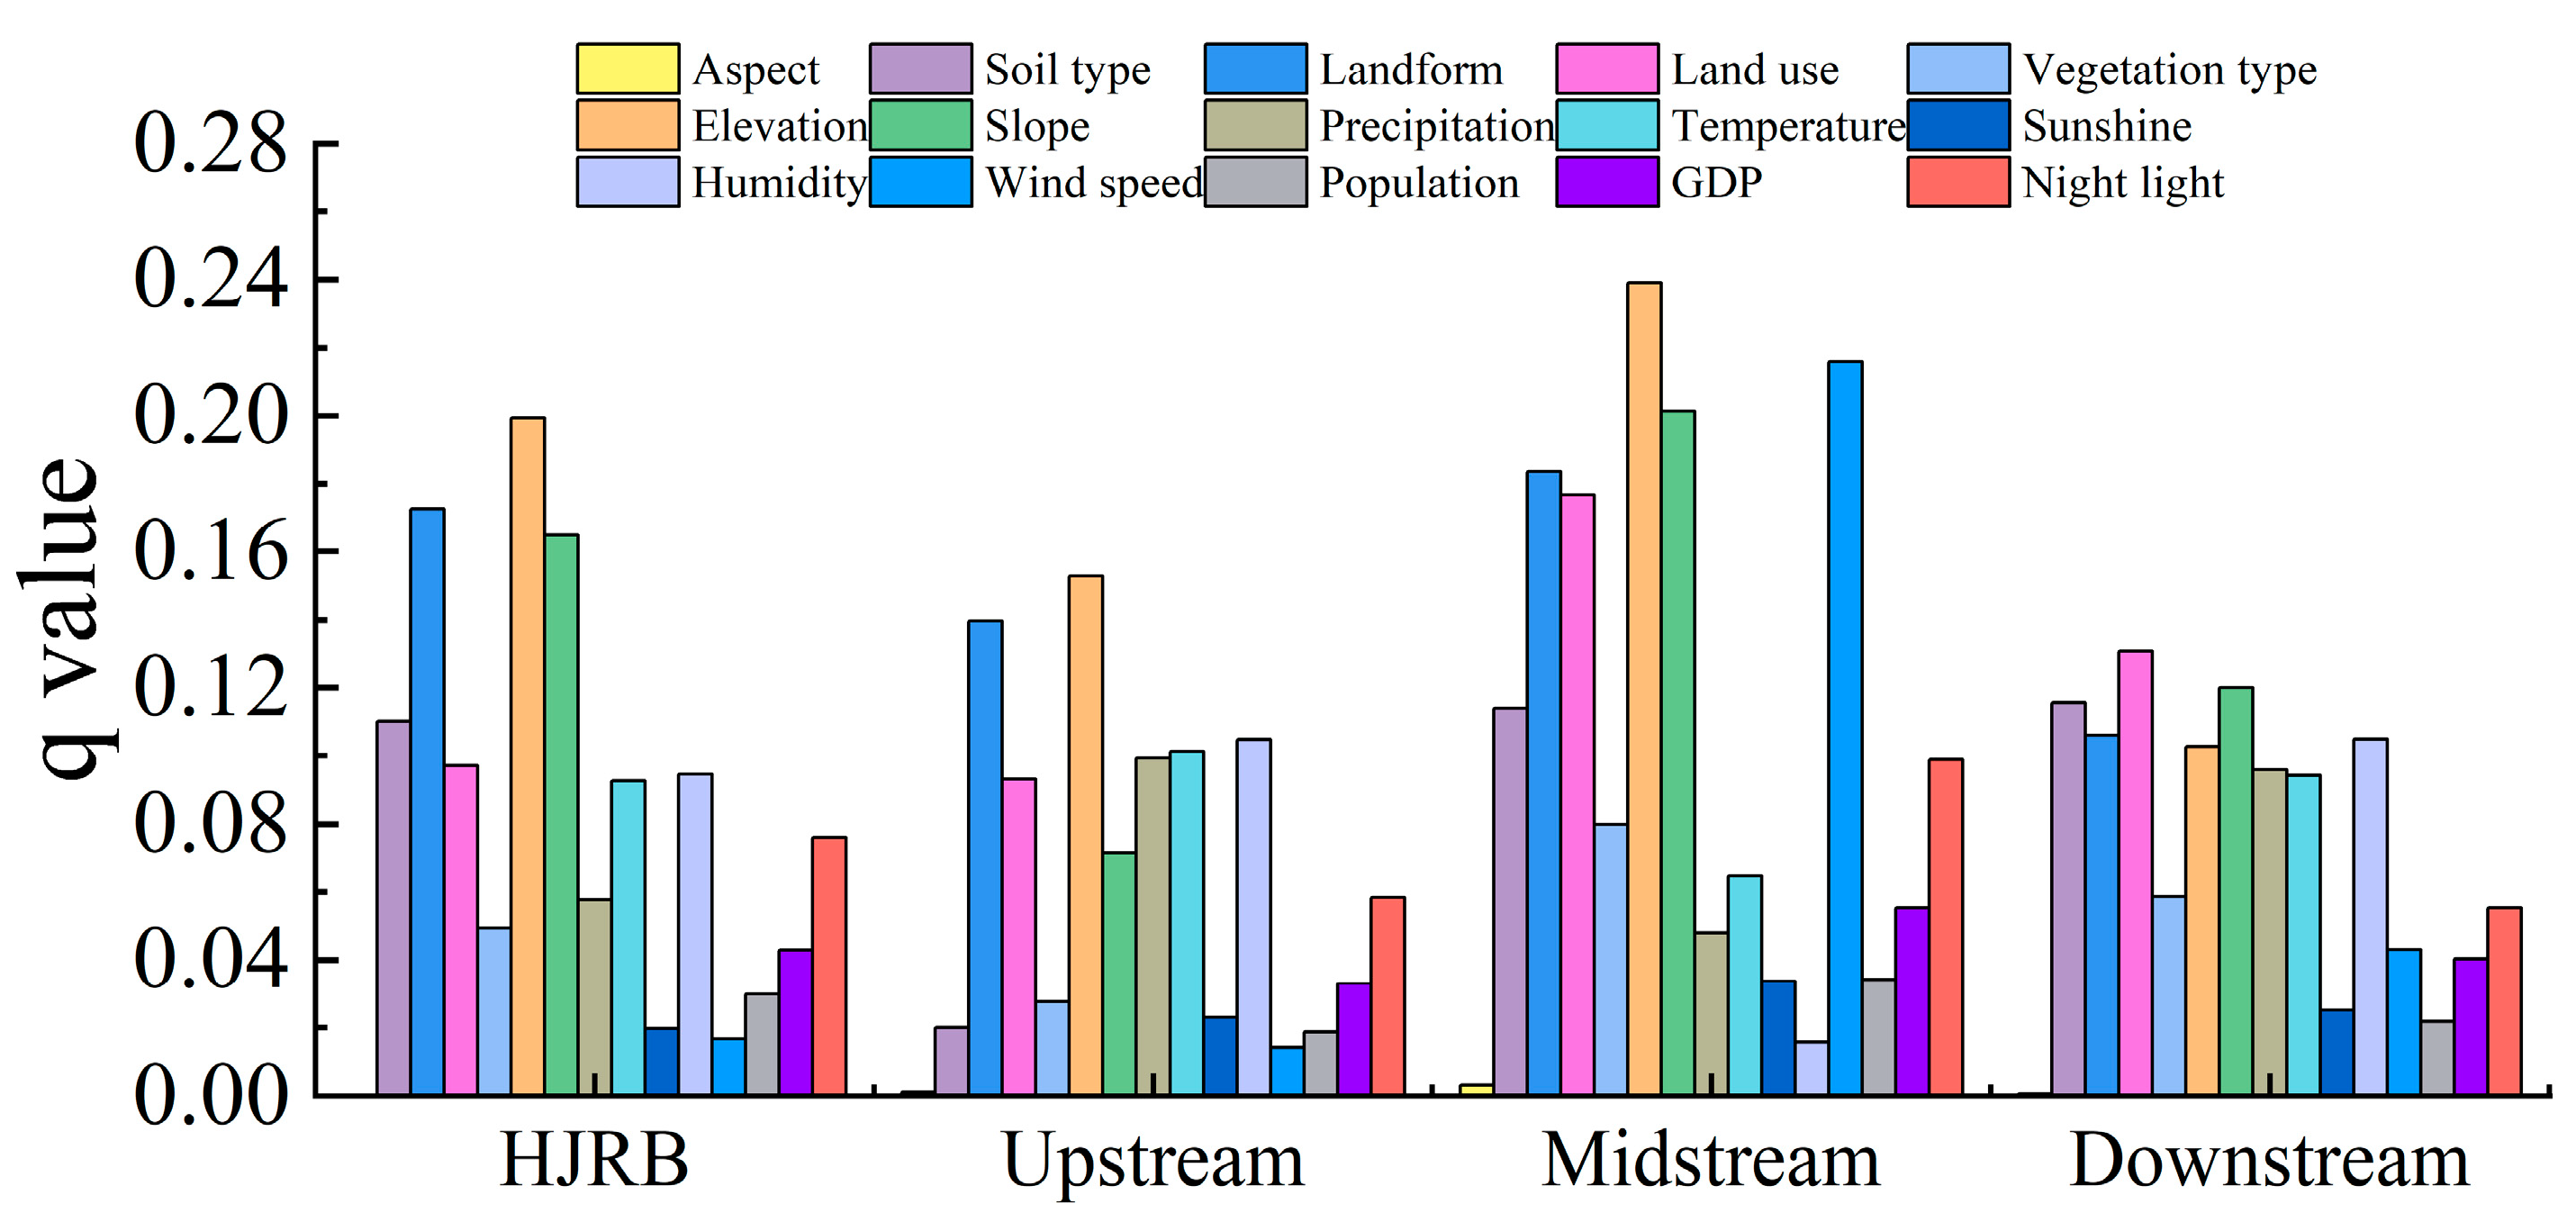
3.3.1. Independent Effects of Factors Affecting Vegetation Change

The factor detection results showed that all factors had significant explanatory power (p < 0.01), indicating that basic topographic factors, climate change and human activities significantly impacted the spatiotemporal dynamics of NDVI in the HJRB. As shown in Figure 6, the order of explanatory power of each factor in relation to NDVI was elevation (q = 0.1979) > landform (q = 0.0.1720) > slope (q = 0.1647) > soil type (q = 0.1094) > temperature (q = 0.0972) > land use (q = 0.0945) > relative humidity (q = 0.0842) > night light (q = 0.0575) > precipitation (q = 0.0550) > vegetation type (q = 0.0493) > GDP (q = 0.0414) > population density (q = 0.0321) > sunshine duration (q = 0.0284) > wind speed (0.0150) > aspect (q = 0.0031). Except for aspect, the explanatory power of all the basic topographic factors was higher than 0.16. The basic topographic factors more strongly shape the vegetation in the HJRB, and elevation was the decisive factor.
We found significant differences in the effects of the factors on vegetation changes in different sub-basins. Elevation, landform, and relative humidity were the dominant factors for NDVI changes in the upper HJRB. In contrast, elevation, wind speed, and slope had higher q-values in the middle HJRB, and land use change, slope, and soil type had the biggest q-values in the lower HJRB. Climate and anthropogenic drivers had weaker explanatory power for vegetation NDVI changes than macroscopic factors such as landform and elevation. Vegetation change is more strongly shaped by underlying topographic factors and is more dynamic in spatial processes than in temporal ones.

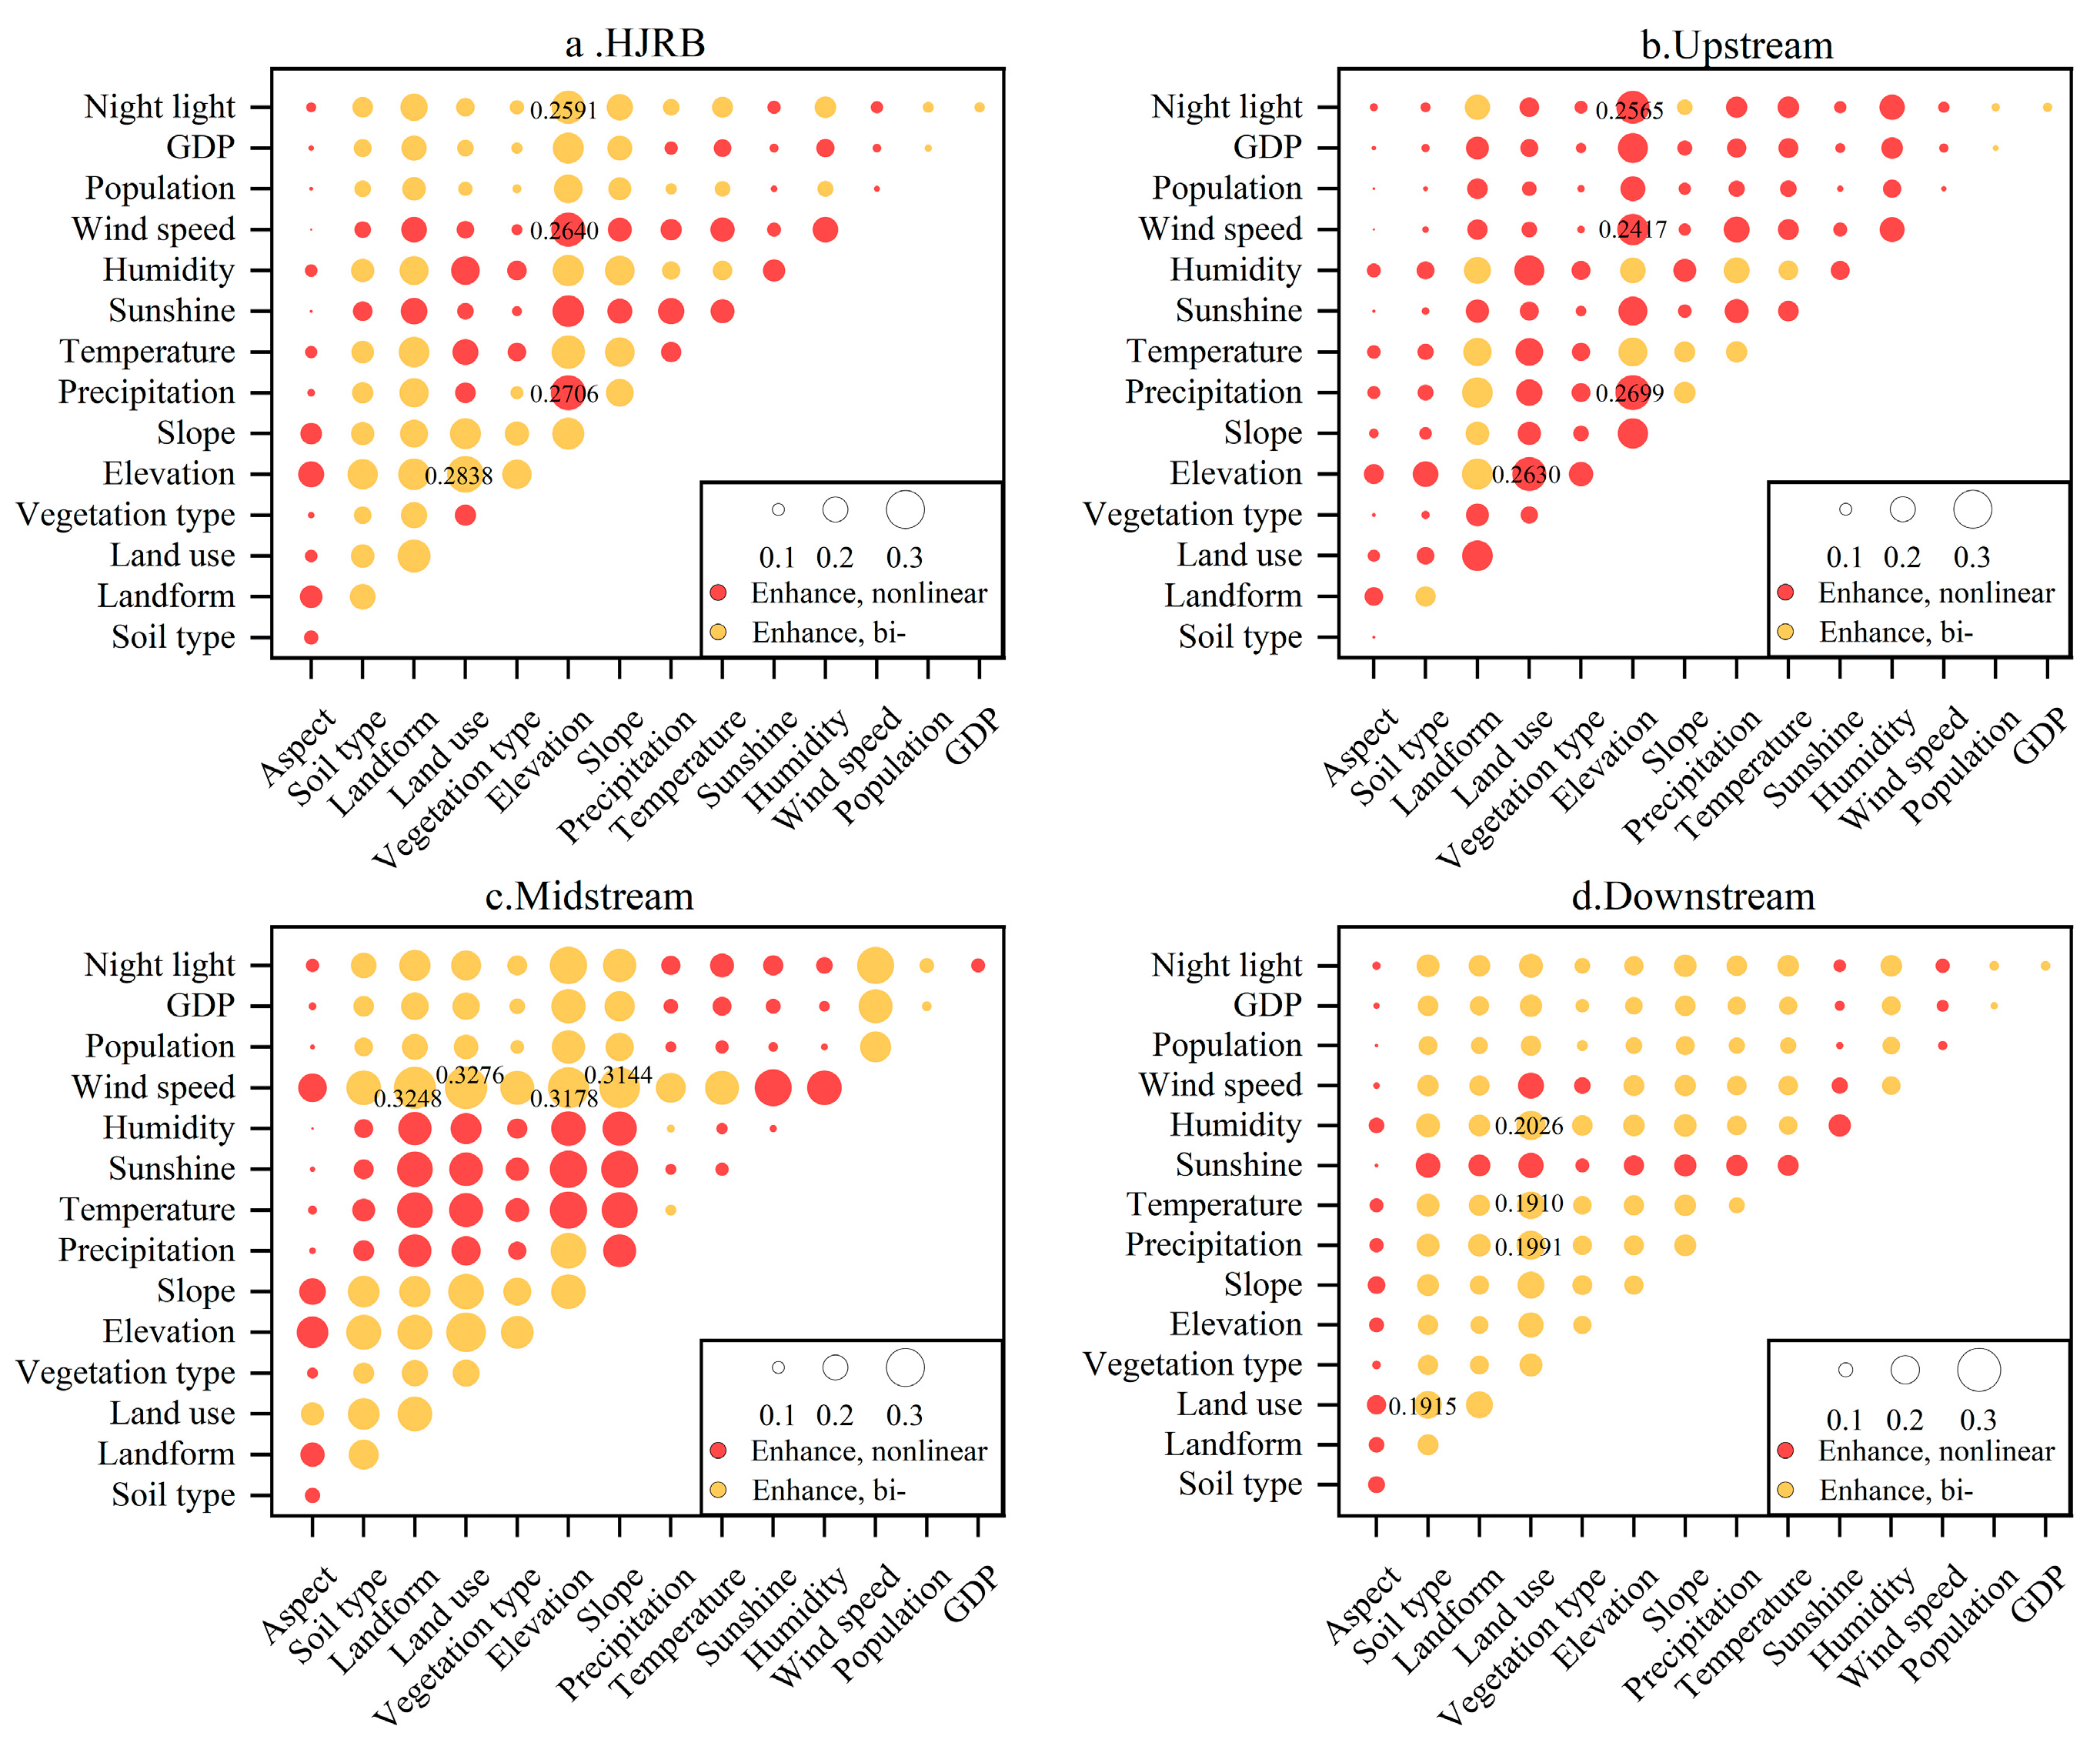
3.3.2. Interaction Analysis of the Factors

The interaction detection results showed (Figure 7) that the interaction of the geographic factors enhances the explanatory power of NDVI, manifesting as a two-factor enhancement and a non-linear enhancement. Figure 7 shows that the interaction factors between elevation ∩ land use, elevation ∩ precipitation, and elevation ∩ wind speed were the dominant interaction factors for NDVI changes in the HJRB, and all of them contribute more than 25%. As regards the different sub-basins, in the upper HJRB, the dominant interaction factor was that between elevation and land use. In the middle reaches of the HJRB, the interaction factor between wind speed and land use was the dominant interacting factor. In the lower HJRB, the interaction between land use and temperature was the dominant factor. In general, there were various types and combinations of dominant interaction factors for NDVI changes in the HJRB and sub-basins. Still, there are regularities among the influencing factors, and the interaction combination of land use with climatic factors and elevation makes the highest contribution. The above dominant factors are coupled with each other and driven by regularity, zonality, and localization to form the spatial and temporal variation pattern of NDVI changes in the HJRB.

3.4. Analysis of Vegetation NDVI and Related Geographic Factors

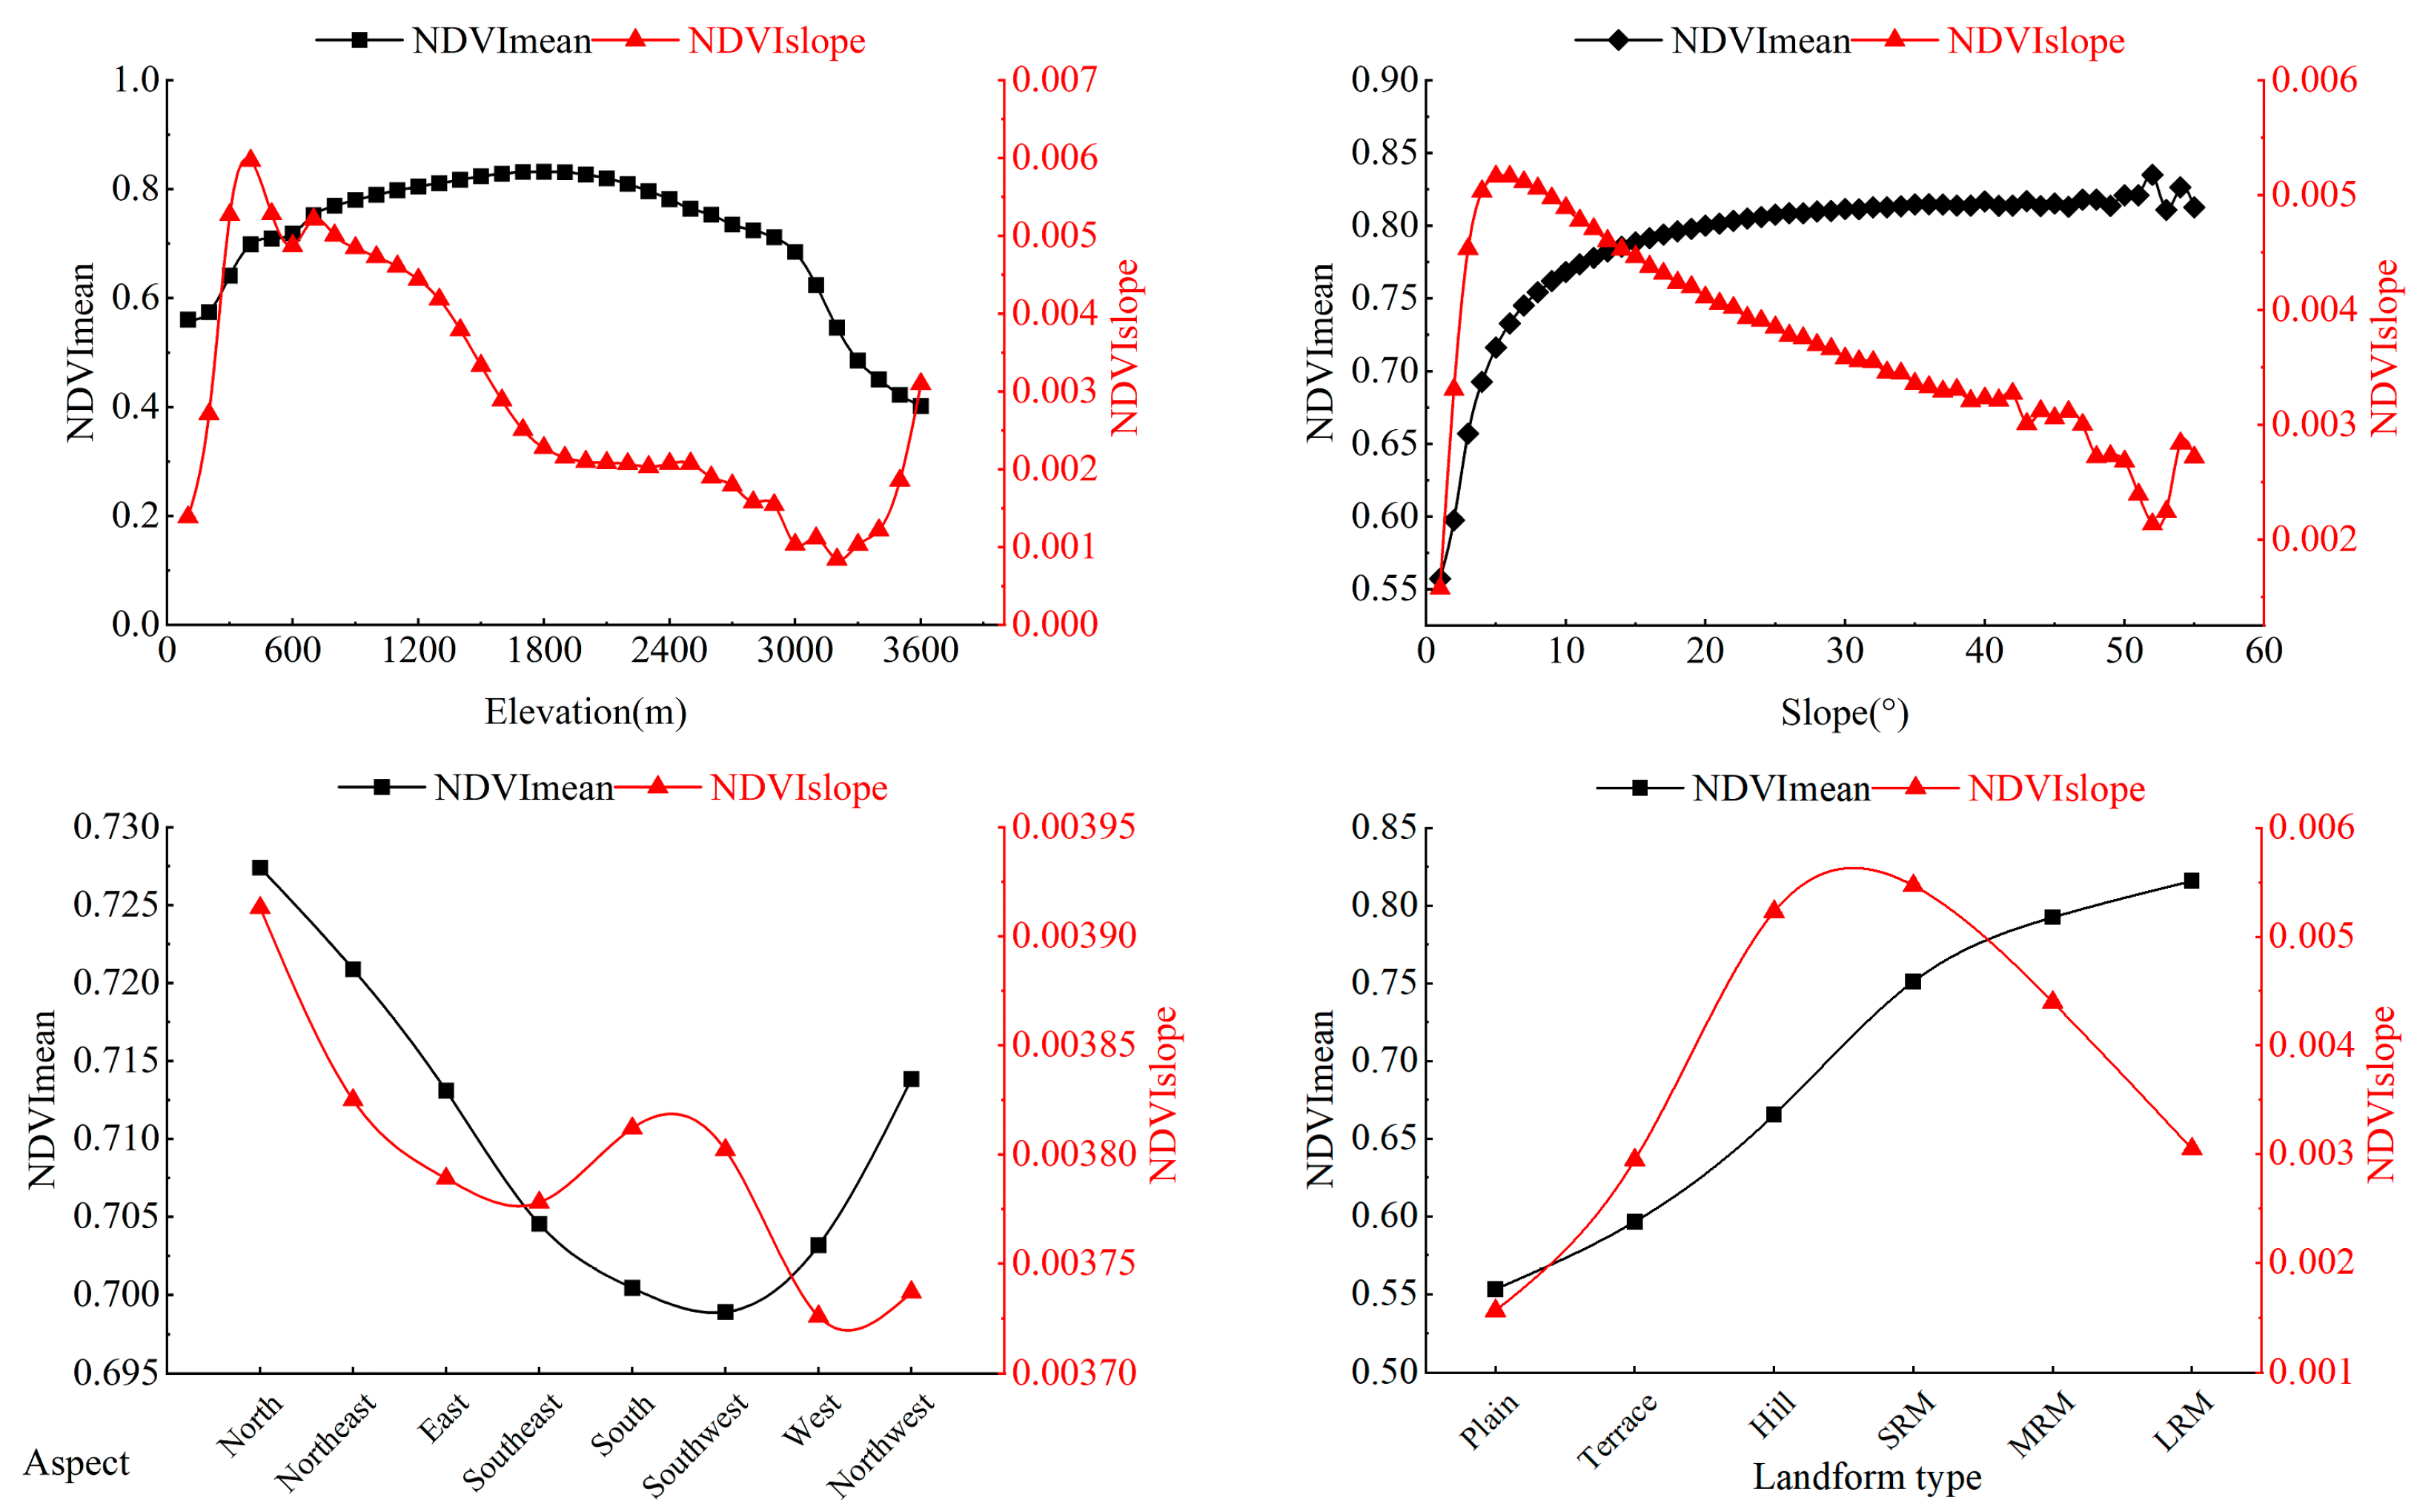
3.4.1. Relationship between Vegetation Cover and Topography

Various factors influence vegetation growth, and topographic elements (elevation, slope, aspect, and landform type) affect vegetation growth by changing hydrothermal conditions in the local area. The trends of NDVI of vegetation under different topographic conditions were analyzed at intervals of 100 m elevation, 1° slope, 45° aspect, and first-class landform type (Figure 8). The average NDVI values show a characteristic of a “fluctuating increase followed by a sharp decrease” with increasing elevation. The NDVI growth rate increases sharply and reaches a peak when the elevation is less than 400 m; then, the NDVI growth rate decreases sharply, and when the elevation is greater than 3200 m, the NDVI growth rate rises again. The average value of vegetation NDVI increases with the increase in slope; at 0–53°, the NDVI growth rate rises sharply to the peak and then decreases slowly, and when the slope is greater than 53°, the NDVI growth rate fluctuates and increases. The mean NDVI values and trends of the aspect were best on the north aspect, and the shaded aspect received shorter sunshine duration than the sunny aspect, and was wetter with less evaporation, meaning the NDVI was higher. The variation in the NDVI of vegetation in different landform types showed obvious differences. The average value of vegetation NDVI increased with the uplifting of the landscape and was highest in large relief mountains (LRM). In contrast, the change in vegetation NDVI showed a “trend of increasing first and then decreasing”, with the rate of increase peaking in small relief mountains (SRM) and then decreasing.

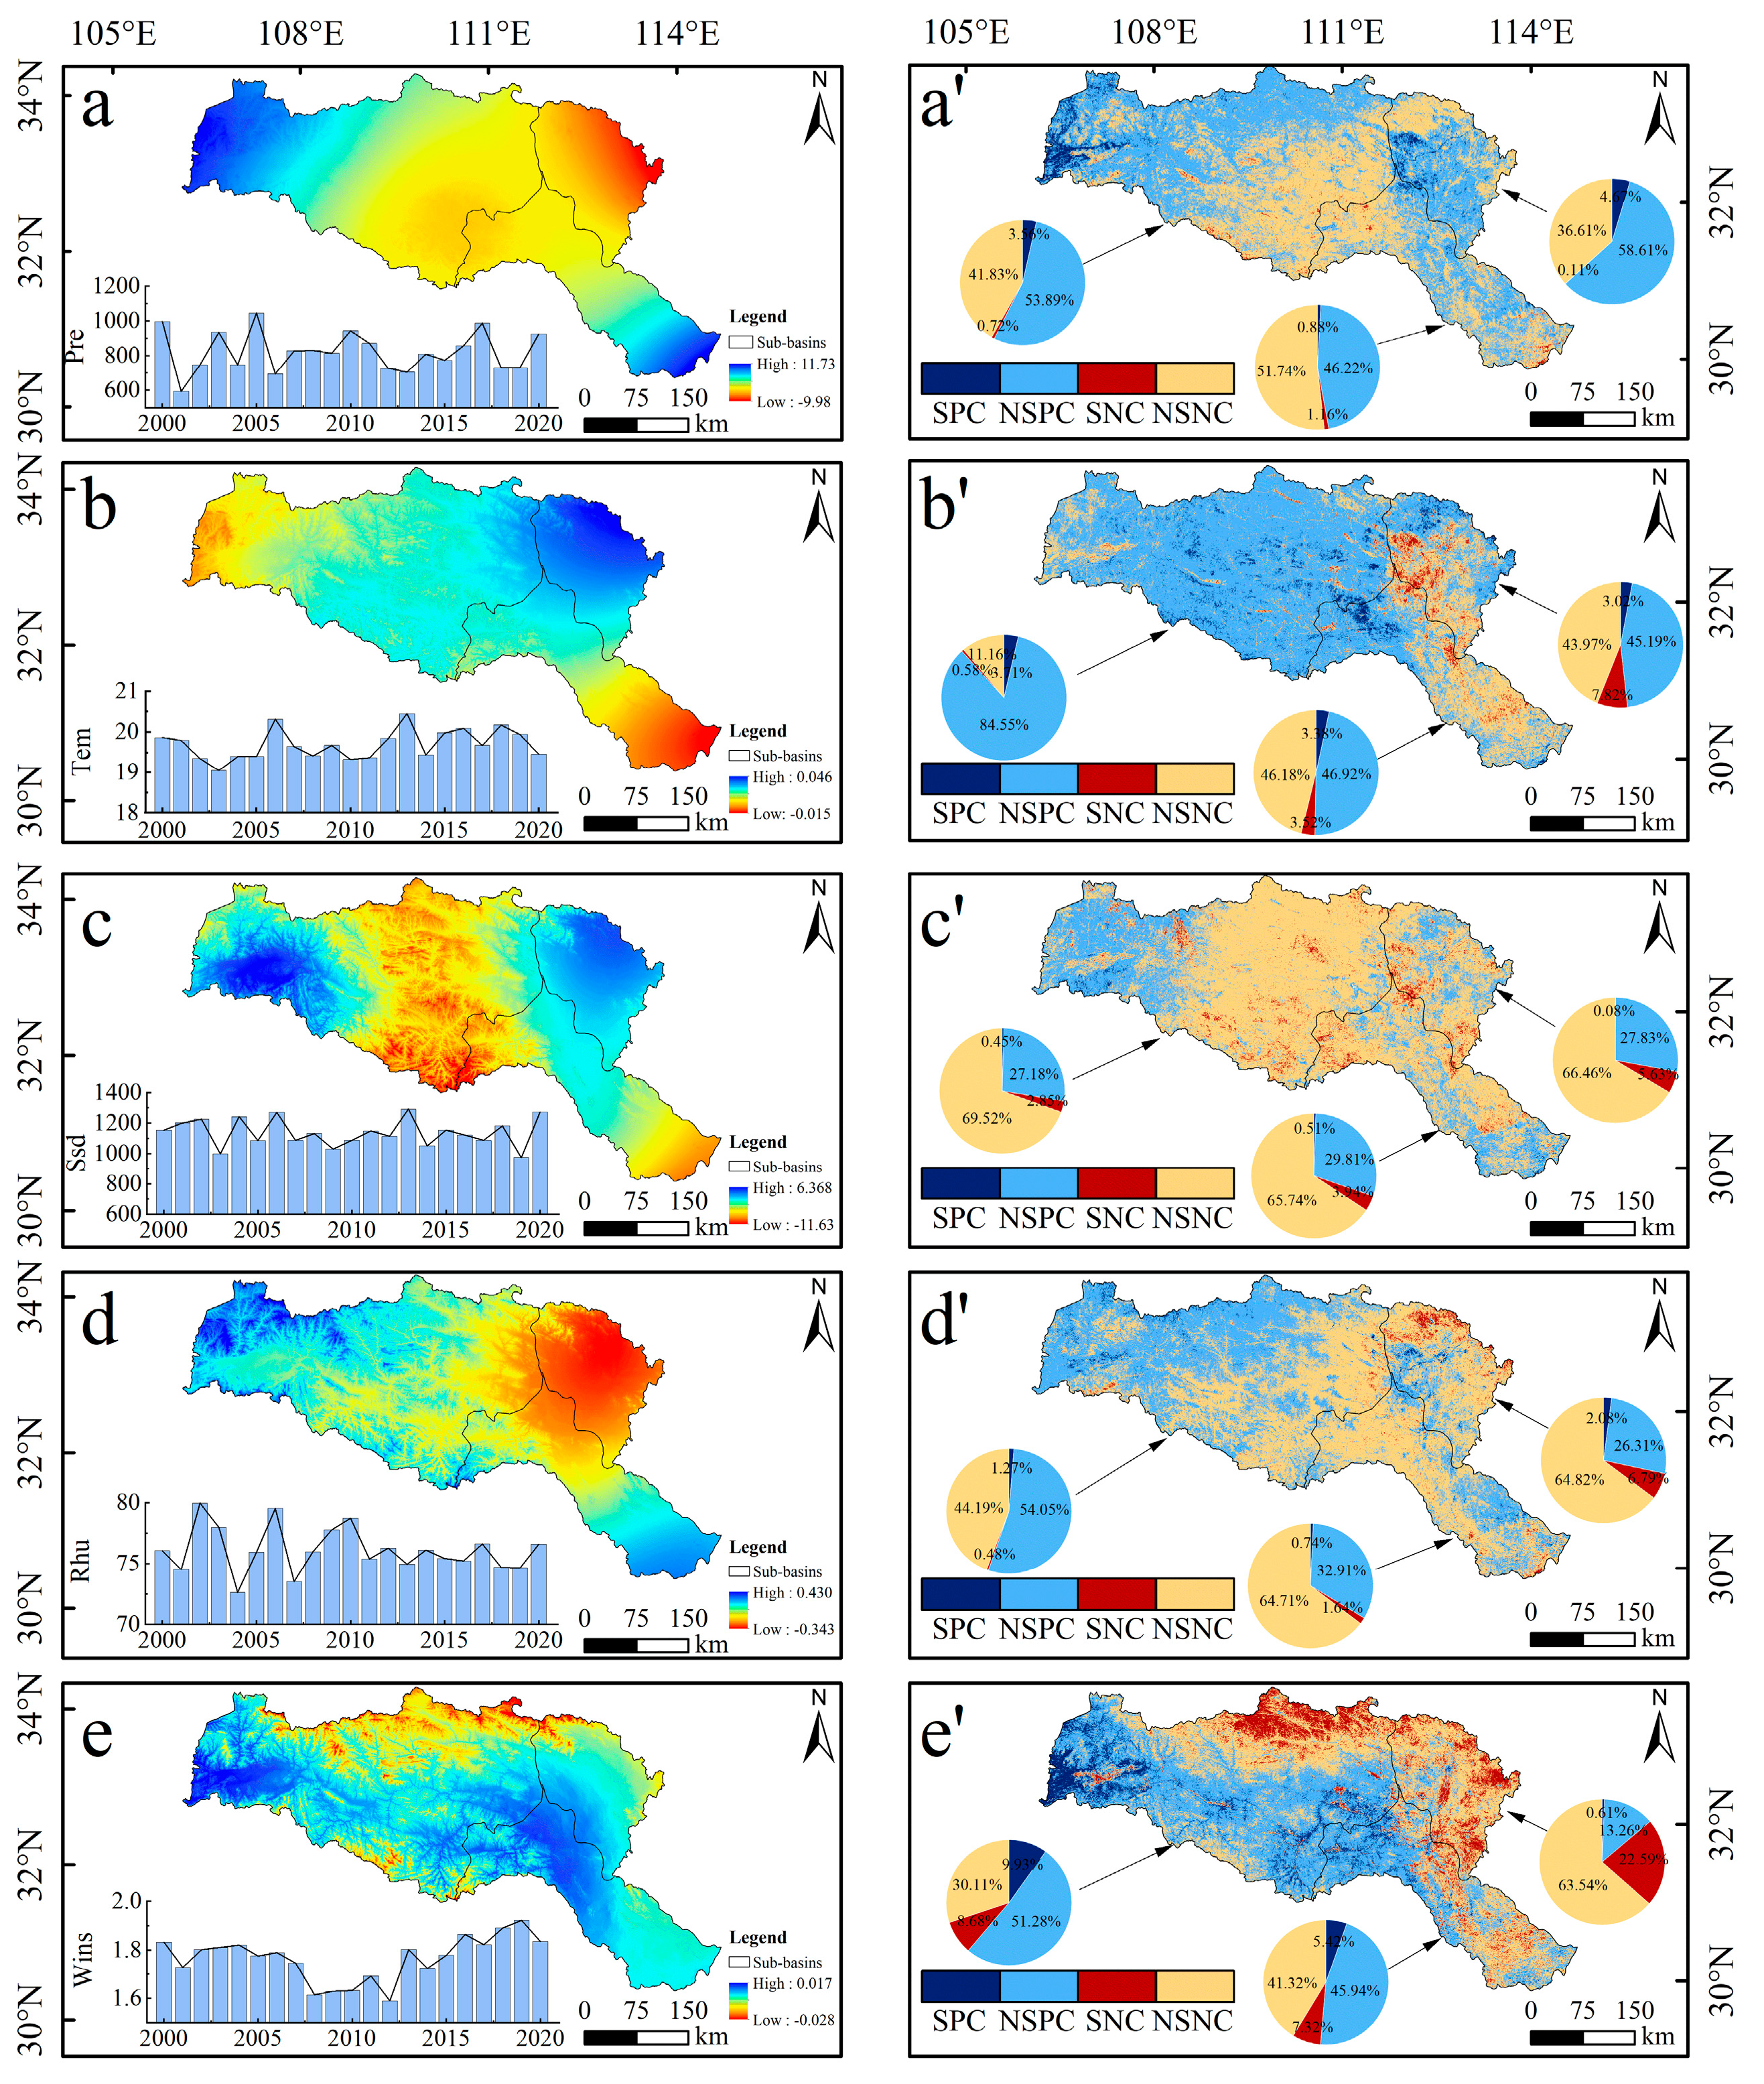
3.4.2. The Relationship between Vegetation Cover and Climate Change

Climatic factors are essential factors affecting the distribution and growth of NDVI, and the relationship between NDVI changes in the growing season and climate is particularly close. The results show that in terms of positive effects, NDVI has a greater effect on temperature (PC: 72.81%, NC: 27.19%) (Figure 9b’) than precipitation (PC: 55.89%, NC: 44.11%) (Figure 5a’) and wind speed (PC: 51.34%, NC: 48.66%) (Figure 9e’), which are more sensitive (Figure 9a). For the negative effect, the effect of sunshine duration (NC: 71.68%, PC: 28.32%) (Figure 9c’) on NDVI was greater than that of relative humidity (NC: 54.14%, PC: 45.86%) (Figure 9d’). Among different sub-basins, except for the sunshine duration, other climatic factors in the upper reaches of the HJRB were positively correlated with NDVI, and there was a significant positive correlation with temperature (PC: 88.26%). The NDVI in the middle reaches of the HJRB showed a positive correlation with precipitation, and other meteorological factors showed a negative correlation, among which the negative correlation between wind speed and NDVI was the most significant (NC: 86.13%). In the lower reaches of the HJRB, NDVI was negatively correlated with precipitation, sunshine duration, and relative humidity, and positively correlated with wind speed and temperature.

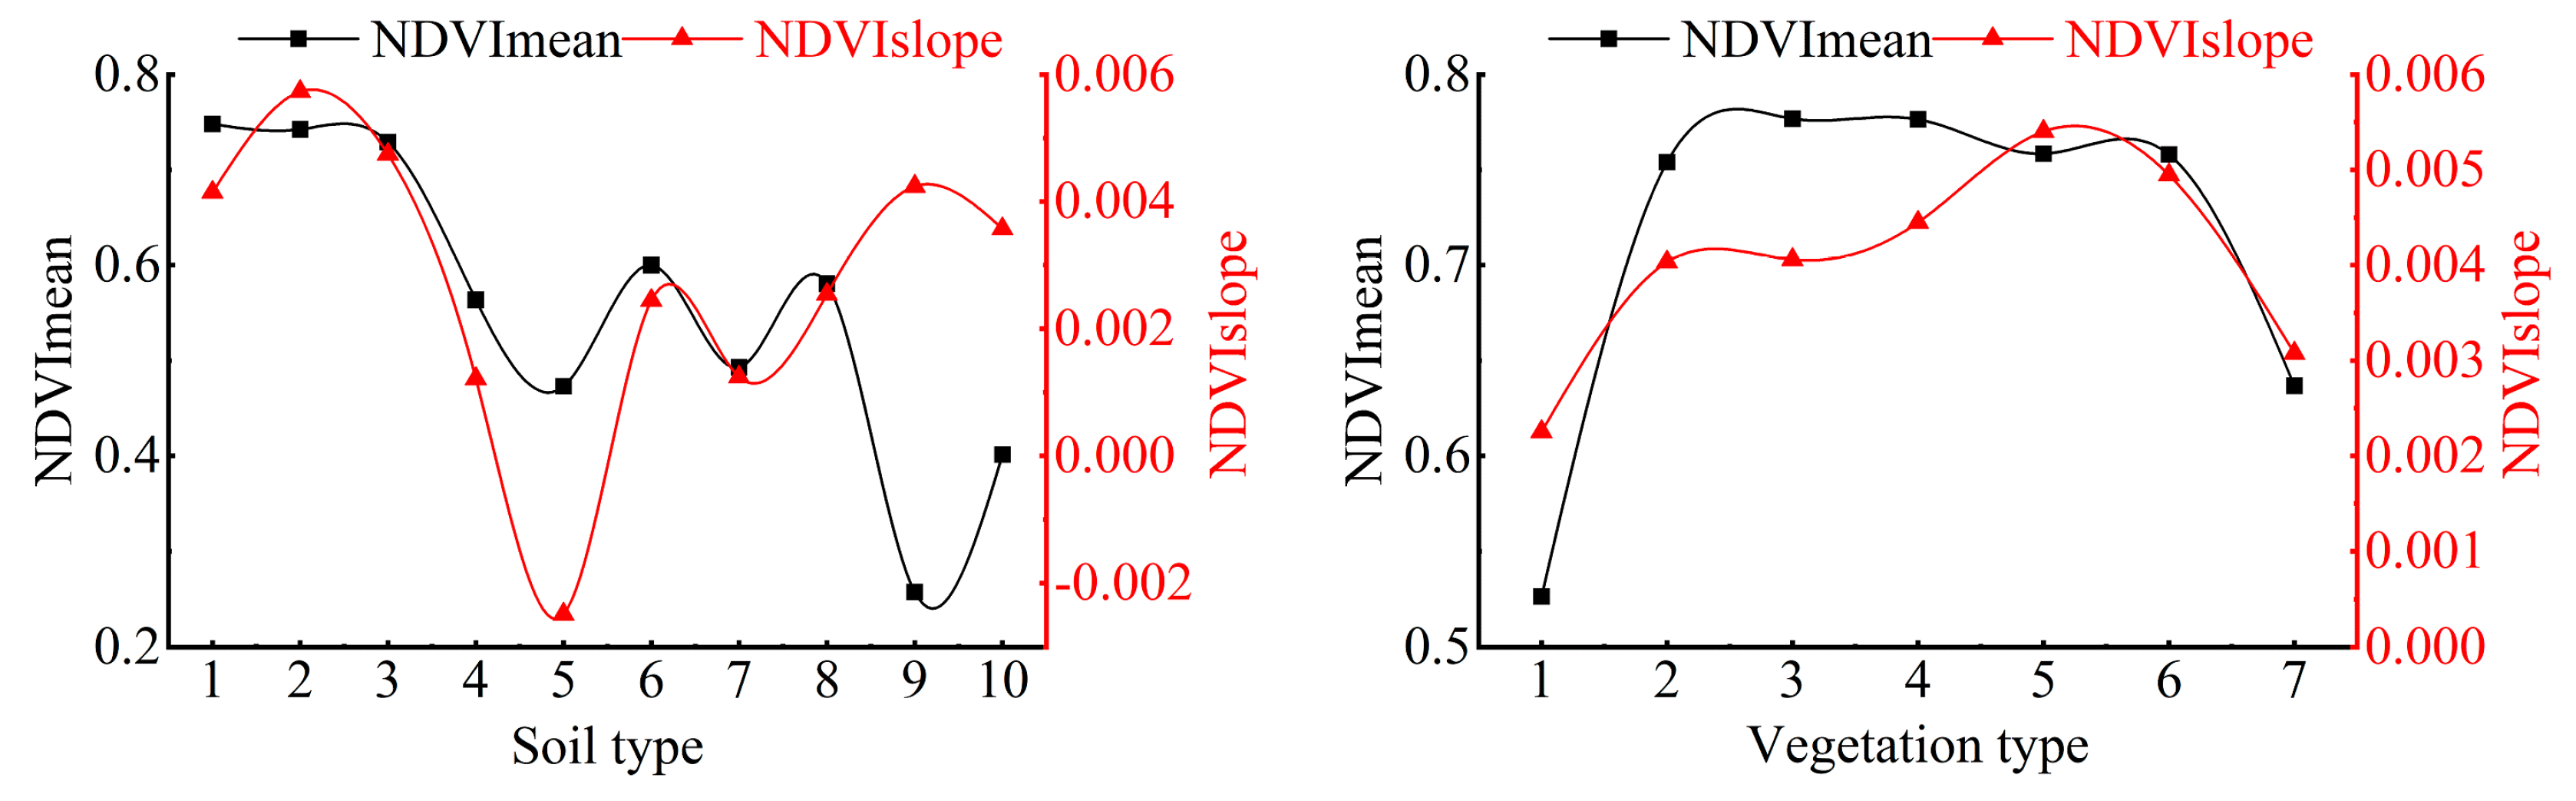
3.4.3. Relationship between Vegetation and Soil Types

The highest mean NDVI values and change trends were 0.748 and 0.591/a, respectively, for leached soils, followed by primeval soils and degraded vegetation changes for hydromorphic soils (Figure 10). The hydromorphic soils in the HJRB are mainly marshes, and in recent years, along with climate change and human activities, there has been a trend of shrinking wetland areas.
From the mean NDVI values and trends of each vegetation type (Figure 10), it can be seen that the broad-leaved forest had the highest mean NDVI value of 0.777, followed by brushwood and grass. Grass had the highest NDVI trend with a growth rate of 0.0054/a, followed by meadow and brushwood, while cultivated plants had the lowest mean NDVI values and a slower growth rate.
In future vegetation restoration, the soil formation conditions, processes, and physicochemical properties of different soils should be considered, and vegetation types should be reasonably matched to form a stable plant community.

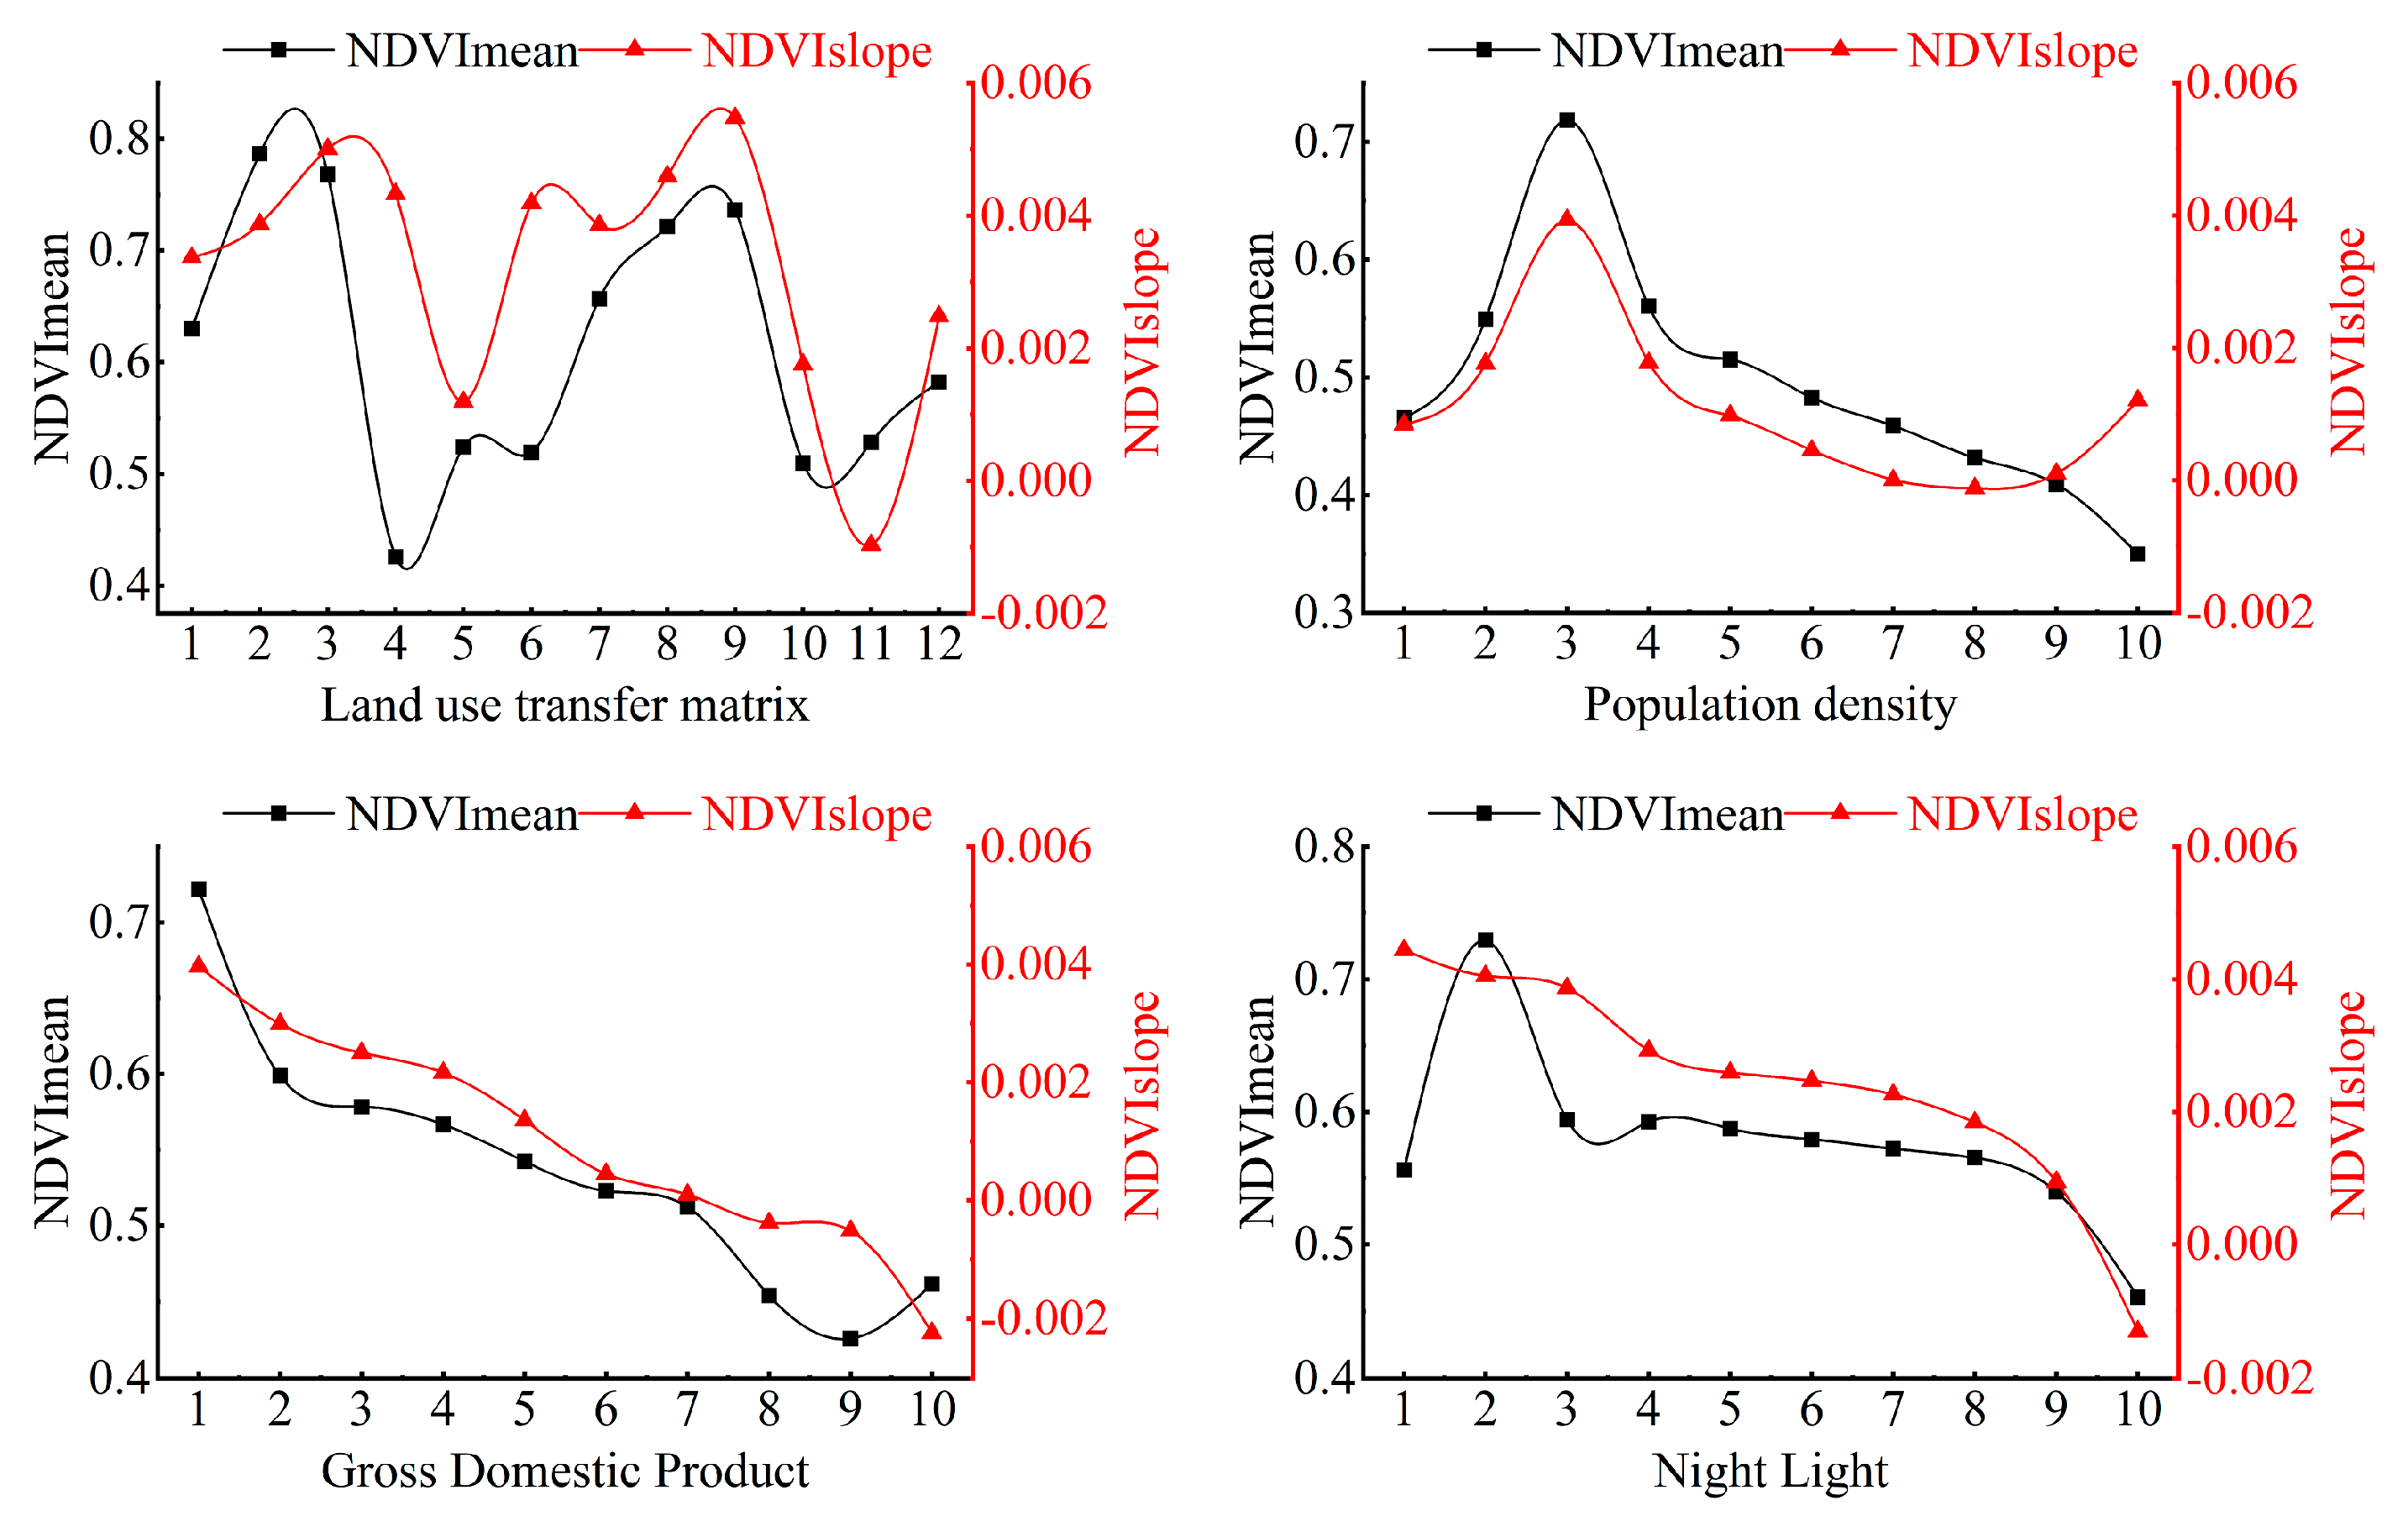
3.4.4. Relationship between Human Activities

The average NDVI values of forest land and grassland in the HJRB in the period 2000–2020 were much higher than those of other land types. The impact of land use change on vegetation had noticeable positive and negative effects (Figure 11), with the most significant increase in NDVI under the return of farmland to forest and grassland. Negative speed is mainly due to construction land transfer into the area. Large-scale urbanization has led to the conversion of agricultural and forest land to construction land and has destroyed the land cover around the city, thereby significantly reducing vegetation coverage. Ecological engineering and urbanization are the dominant human factors contributing to vegetation change in the HJRB.
According to the optimal parameter combination, the NDVI mean value and change trend statistics under the classification of population density, GDP, and night light can be determined (Figure 11). The average values and change trends of the NDVI of vegetation showed an increase, and then a decreased with the increase in population density, and the change trends of NDVI showed a decrease with the increase in GDP and night light index.

4. Discussion

4.1. Spatiotemporal Variation in Vegetation Cover

The overall vegetation in the HJRB showed a fluctuating increase from 2000 to 2020, but there is large spatial and temporal heterogeneity; the temporal trend was one of increasing at both the basin and sub-basin scales, similar to previous studies [60,68]. At the basin scale, the peaks occurred in 2001 and 2015, respectively, and the NDVI increased year by year after 2016. The lowest value appeared in 2001, which may be closely related to the abnormally dry climate in 2001.
Since 2000, the HJRB has implemented the Protected Forest Project, the Natural Forest Protection Project, and the Return of Cropland to Forests and Grasslands Project. As a key area of the project, the upper reaches of the HJRB have seen a significant increase in the area of woodland and grassland, with a much higher growth rate than the middle and lower reaches [57]. In this study, it was found that the growth of vegetation in the middle reaches of the HJRB is the slowest, which may be related to the implementation of the permanent basic farmland policy and the construction of the South-to-North Water Diversion Project, and the growth of vegetation is relatively limited. With the acceleration of urbanization, land reclamation, and the construction of water conservancy projects, cultivated land and forest land are transformed into construction land, and the vegetation coverage in the Jianghan Plain, Nanyang Basin, and its urban built-up areas shows a downward trend [69,70,71]. In 2016, after the Chinese government set up the conservation of the Yangtze River and stopped its overdevelopment, vegetation growth became relatively stable and less volatile, and the ecological benefits gradually came to the fore.

4.2. Driving Forces of Vegetation Change

The topography of the HJRB is complex, and climate change shows obvious spatial heterogeneity and plays a key role in vegetation change [72]. Based on the previous studies focusing on the two key climate factors of temperature and precipitation, this study considered meteorological factors such as sunshine duration, relative humidity, and wind speed. It more comprehensively analyzed the differences in spatial responses of vegetation growth to climate factors.
In the past 21 years, the climate in the southeast and northwest of the HJRB showed a warming–wetting trend, while in the northeast, it displayed a warming–drying trend. According to the correlation analysis between NDVI and meteorological factors, it can be seen that temperature is the most important climatic factor contributing to vegetation growth in the HJRB. Especially in the upper HJRB, nearly 88.26% of the regional vegetation exhibited a positive correlation with temperature. Higher altitudes are sensitive to temperature changes, and lower temperatures may lead to weaker photosynthesis and soil nutrient release rates, as well as shorter growth times to limit vegetation growth [73]. However, in the Nanyang basin, higher temperatures and increased sunshine duration usually mean less precipitation, and increased wind speeds lead to higher evaporation and exacerbate drought levels. In total, 86.13% of the regional vegetation negatively correlated with wind speed, which greatly limits crop vegetation growth, especially in arable land. Wind speed became the main factor affecting vegetation growth in the Nanyang Basin [74]. The q value of the effect of sunshine duration on NDVI trends in the HJRB was found to be low (Figure 9d), and it was found that the area is rich in light resources, and the increase in sunshine duration led to an increase in evapotranspiration, which was detrimental to vegetation growth [75,76]. The monsoon climate strongly influences the lower reaches of the HJRB. Excessive precipitation increases soil moisture and leads to the large evaporation of the latent surface heat. At the same time, a drop in temperature reduces photosynthetic efficiency and water use efficiency, thus inhibiting vegetation growth [77,78].
This study found that vegetation change was closely related to topographic factors (altitude, landform type, and slope) (q-statistic > 0.17, Figure 6), among which elevation contributed the most (q = 0.1979). Topography affects the evolution of soil properties by controlling the water and heat conditions of the local environment, and suitable heat and water conditions are more conducive to vegetation growth [67,79]. Consistent with previous studies, there is a threshold between vegetation change and altitude [44,66]. We found lower mean values of vegetation in low altitude areas (<400 m), gentle slopes (<6°), shady slopes, and small relief mountain regions, but with higher growth rates. These areas are close to the radiation range of local human settlements, but their terrain and light conditions are not conducive to other socioeconomic activities, thus becoming the focus areas for to the implementation of ecological construction projects and showing significant vegetation conservation results. According to the factor detector, aspect has a much smaller effect on vegetation change than elevation and slope, which is consistent with previous studies [10,19]. The HJRB is located in the summer monsoon region and compared to the shaded aspect, the sunny aspects (southern, southwestern, and western) have longer sunshine hours, higher temperatures and high evaporation, and less available soil moisture, accompanied by heavy precipitation washout, which is not conducive to vegetation growth. Vegetation changes in different soil types are significantly different. Leach soils have high water content, and organic matter is rich in nutrients. Vegetation comprises mainly trees and shrubs, with a strong self-regulation ability, which facilitates vegetation growth [80]. Due to the long-term accumulation of water and the cohesive soil texture of swampy soils, many herbaceous plants grow in an accumulation of water and in a humid environment, which is not conducive to the rapid recovery and growth of vegetation.
According to factor detector, it can be seen that land use change makes a strong contribution to vegetation change [81]. The growth rate of grassland transferred to the area from 2000 to 2020 was 0.00547/y, ranking first, indicating that the implementation of the project of returning farmland to forest and grass has significantly improved vegetation coverage. The crop types and planting structure of arable land mainly remained the same. However, the NDVI growth rate was 0.00337/y, mainly due to the development of agricultural science and technology that promoted vegetation growth [82]. This study found that the growth rate of vegetation in areas where construction land was transferred was negative. In the rapidly urbanizing areas of the Nanyang Basin and the Wuhan urban circle, urban expansion encroached on production and ecological land, reducing plant biomass and increasing vegetation degradation [29,83,84]. In addition, the construction of water projects in the non-urban areas of the Nanyang Basin negatively affected the growth of vegetation (e.g., forests and grasslands) along the construction route. After the Danjiangkou Dam’s completion, water storage increase causing a large amount of natural vegetation and cultivated land to be submerged, and the vegetation showed a declining trend [60]. Population reduction is conducive to vegetation growth, which is consistent with previous research [83]. This study also found that with the increase in population, the increase in green park space in urban built-up areas also promoted increased vegetation coverage [85]. Unlike the change in population density, with the increase in GDP and night light index, the growth of vegetation coverage shows a clear increasing trend, further confirming that urbanization leads to vegetation degradation.
The results of interaction detection in this study show that a single factor has a stronger explanatory power when interacting with other factors. Vegetation changes are not affected by a single factor, and the impact of the natural environment and human activities on the spatial heterogeneity of NDVI is complex [10,32,66,81]. For example, sunshine duration and wind speed have weak explanatory power for vegetation NDVI changes in the HJRB. However, they have higher explanatory power after interacting with elevation and show a non-linear enhancement effect. Elevation changes affect the gradient distribution of sunshine duration and wind speeds, and the interaction between the two affects vegetation changes more significantly [67]. Similarly, the combination of dominant factors and interaction types in different sub-basins is more diverse. The explanatory power of terrain, climate, and human activity factors has also been improved. For example, the interaction of wind speed with land use and topographic factors becomes the decisive factor for the spatial differentiation of NDVI in the middle reaches of the HJRB; the interaction of land use with climatic factors and soil type is a determinant of the significantly higher impact of vegetation growth in the lower reaches of the HJRB. These results suggest that none of these drivers acted independently on vegetation change.

4.3. Policy Recommendations for Revegetation and Conservation in the HJRB

The results show that topographic factors (elevation and slope) significantly affected vegetation change independently or in interaction with other drivers (climate change and human activities). Therefore, the comprehensive influence of these factors should be considered when formulating effective countermeasures for vegetation resource management. The following suggestions are made:
(1) In the middle reaches of the HJRB, under the premise of conforming to national land space planning and use control, rationally adjust and optimize the land use layout, combine high-standard farmland with the construction of farmland shelterbelts, match trees and shrubs, evergreen and deciduous trees, strengthen the construction of irrigation infrastructure, and improve water resource utilization;
(2) Carry out the integrated afforestation of forest and seedlings along with the water conservancy project, expand the green space along the main canal in a targeted manner, increase the biodiversity and landscape functions along the main canal, and enhance the ecological barrier role of the main canal shelter forest;
(3) In the upper reaches of the HJRB, continue to promote the conversion of farmland to forest and grassland, close mountains for afforestation, and carry out restoration with the plant community replacement mode of bare land→grass→shrub, grass→coniferous forest→coniferous and broad-leaved mixed forest to increase the rate of vegetation restoration;
(4) In the lower reaches of the HJRB, coordinate the relationship between regional urbanization and ecological protection, strengthen the connection with the Yangtze River protection strategy, rationally delineate the boundaries of urban development, and strengthen the construction of green infrastructure.

4.4. Limitations and Future Works

Compared with previous studies, this article considers more climate variables (precipitation, temperature, sunshine duration, relative humidity and wind speed) based on the entire geographical environment and differences (watersheds and sub-basins). It is helpful to reveal NDVI trends in the HRJB under the process of the spatiotemporal dynamic interaction of geographical elements to promote NDVI research from single static to spatiotemporal dynamic interaction. The stratification of spatial heterogeneity is mainly based on experience and subjective judgments, which leads to biased results. The optimal parameter geographic detector (OPGD) discretizes spatial data based on the combination of optimal parameters, which can more scientifically perform the analysis of the driving forces of multiple geographic elements on NDVI.
(1) Although the MODIS NDVI dataset has improved the data quality of NDVI based on Savitzky–Golay and MVC preprocessing to reduce atmospheric, cloud, and solar angle, residual noise still exists, and more advanced approaches to improve data quality are its focus in the future. For the problem of the 250 m resolution of NDVI, remote sensing products such as GEE to Landsat, Sentinel, or Himawari datasets can be used in the future to improve observation accuracy.
(2) Due to the limitations of MODIS NDVI, it can be combined with other vegetation indices (e.g., EVI, SAVI) in the future to eliminate the uncertainty of a single data source and obtain more accurate results. In addition, there may be a certain lag in the vegetation response to climate change due to the differences in different seasons and months. Therefore, the driving mechanism of geographic elements in vegetation cover change should be quantified more comprehensively from multi-scale and multiple vegetation indices.

5. Conclusions

The results of this study revealed the spatiotemporal and future change patterns of vegetation in the HJRB and sub-basins from 2000 to 2020, and analyzed the response of the vegetation NDVI to climate factors. Finally, the dominant factors of vegetation change and their interactions were analyzed based on the optimal parameter geodetector.
(1) From 2000 to 2020, the NDVI of vegetation in the HJRB showed an increasing trend of 0.038/10a, with different sub-basin divisions: upstream (4.52%/10a) > downstream (3.09%/10a) > midstream (2.38%/10a), and different sub-basins showed a fluctuating increasing trend. The spatial distribution pattern was one of “high in the northwest and low in the southeast”, with 88.68% of areas showing vegetation growth and 5.8% showing significant vegetation degradation. In terms of future changes, the positive persistence of NDVI changes in the basin is stronger than the negative persistence, and the NDVI is likely to slow down or degrade in the future, especially along the Han River and in urban areas, meaning the vegetation restoration along the Han River and urbanized areas need to be strengthened.
(2) Temperature, precipitation, and wind speed positively affect NDVI in the Han River basin, among which the positive effect of temperature was the most significant. In contrast, sunshine hours and relative humidity had negative effects on vegetation. The NDVI response of vegetation to climate change in different sub-basins showed significant geographical differences.
(3) In the HJRB, elevation was the dominant factor of NDVI change with an explanatory power of 0.1979, followed by landform type (0.1720), slope (0.1647), and soil type (0.1094); the explanatory power of anthropogenic influences were all less than 0.05. The dominant factors differ in different sub-basins; for example, land use conversion was the dominant factor in the lower HJRB. The interactions showed a non-linear and mutually reinforcing pattern, and the interactions of different influencing factors enhance the explanation of vegetation change. Vegetation change was mainly attributed to the interaction of topography, climate change, and land use conversion.
The study results will help decision makers consider regional differences in vegetation changes more comprehensively, and can provide a reference for scientific decisions regarding the effective management of vegetation resources and ecological construction under the “set up conservation of the Yangtze River and stop its over development” strategy.

Author Contributions

Conceptualization, Z.Z.; methodology, Z.Z.; software, Z.Z.; validation, Z.Z. and S.L.; formal analysis, Z.Z.; data curation, Z.Z.; writing original draft preparation, Z.Z. and Y.X. writing—review and editing, Z.Z. and S.L. supervision, Z.Z.; funding acquisition, S.L. All authors have read and agreed to the published version of the manuscript.

Funding

This research was funded by the National Natural Science Foundation of China (grant no. 41601210).

Data Availability Statement

All data, models, or code generated or used during the study are available from the author by request (zzz@stu.hubu.edu.cn).

Acknowledgments

The authors would like to thank editors and anonymous reviewers for their constructive comments and suggestions.

Conflicts of Interest

The authors declare no conflict of interest.

References

  1. Piao, S.; Wang, X.; Ciais, P.; Zhu, B.; Wang, T.; Liu, J. Changes in satellite-derived vegetation growth trend in temperate and boreal Eurasia from 1982 to 2006. Glob. Chang. Biol. 2011, 17, 3228–3239. [Google Scholar] [CrossRef]
  2. Zhang, Z.; Chang, J.; Xu, C.; Zhou, Y.; Wu, Y.; Chen, X.; Jiang, S.; Duan, Z. The response of lake area and vegetation cover variations to climate change over the Qinghai-Tibetan Plateau during the past 30years. Sci. Total Environ. 2018, 635, 443–451. [Google Scholar] [CrossRef] [PubMed]
  3. Wei, X.; Li, Q.; Zhang, M.; Krysta, G.-H.; Liu, W.; Fan, H.; Wang, Y.; Zhou, G.; Piao, S.; Liu, S. Vegetation cover-another dominant factor in determining global water resources in forested regions. Glob. Chang. Biol. 2018, 24, 786–795. [Google Scholar] [CrossRef]
  4. Li, H.; Xie, M.; Wang, H.; Li, S.; Xu, M. Spatial Heterogeneity of Vegetation Response to Mining Activities in Resource Regions of Northwestern China. Remote Sens. 2020, 12, 3247. [Google Scholar] [CrossRef]
  5. Liu, Y.; Zhao, W.; Hua, T.; Wang, S.; Fu, B. Slower vegetation greening faced faster social development on the landscape of the Belt and Road region. Sci. Total Environ. 2019, 697, 134103. [Google Scholar] [CrossRef]
  6. Li, A.; Wu, J.; Huang, J. Distinguishing between human-induced and climate-driven vegetation changes: A critical application of RESTREND in inner Mongolia. Landsc. Ecol. 2012, 27, 969–982. [Google Scholar] [CrossRef]
  7. Xu, M.; Kang, S.; Chen, X.; Wu, H.; Wang, X.; Su, Z. Detection of hydrological variations and their impacts on vegetation from multiple satellite observations in the Three-River Source Region of the Tibetan Plateau. Sci. Total Environ. 2018, 639, 1220–1232. [Google Scholar] [CrossRef]
  8. Zhang, Y.; Jiang, X.; Lei, Y.; Gao, S. The contributions of natural and anthropogenic factors to NDVI variations on the Loess Plateau in China during 2000–2020. Ecol. Indic. 2022, 143, 109342. [Google Scholar] [CrossRef]
  9. Alistair, W.R.; Seddon, M.M.-F.; Peter, R.; Long, D.B.; Kathy, J.W. Sensitivity of global terrestrial ecosystems to climate variability. Nature 2016, 531, 229–232. [Google Scholar] [CrossRef] [Green Version]
  10. Wang, Y.; Zhang, Z.; Chen, X. Quantifying Influences of Natural and Anthropogenic Factors on Vegetation Changes Based on Geodetector: A Case Study in the Poyang Lake Basin, China. Remote Sens. 2021, 13, 5081. [Google Scholar] [CrossRef]
  11. Chu, H.; Venevsky, S.; Wu, C.; Wang, M. NDVI-based vegetation dynamics and its response to climate changes at Amur-Heilongjiang River Basin from 1982 to 2015. Sci. Total Environ. 2019, 650, 2051–2062. [Google Scholar] [CrossRef]
  12. Fensholt, R.; Langanke, T.R.; Rasmussen, K.; Reenberg, A.; Prince, S.D.; Tucker, C.; Scholes, R.J.; Le, Q.B.; Bondeau, A.; Eastman, R.; et al. Greenness in semi-arid areas across the globe 1981–2007—An Earth Observing Satellite based analysis of trends and drivers. Remote Sens. Environ. 2012, 121, 144–158. [Google Scholar] [CrossRef]
  13. Li, S.; Xu, L.; Jing, Y.; Yin, H.; Li, X.; Guan, X. High-quality vegetation index product generation: A review of NDVI time series reconstruction techniques. Int. J. Appl. Earth Obs. 2021, 105, 102640. [Google Scholar] [CrossRef]
  14. Chen, R.; Yin, G.; Liu, G.; Li, J.; Verger, A. Evaluation and Normalization of Topographic Effects on Vegetation Indices. Remote Sens. 2020, 12, 2290. [Google Scholar] [CrossRef]
  15. Kumari, N.; Saco, P.M.; Rodriguez, J.F.; Johnstone, S.A.; Srivastava, A.; Chun, K.P.; Yetemen, O. The Grass Is Not Always Greener on the Other Side: Seasonal Reversal of Vegetation Greenness in Aspect-Driven Semiarid Ecosystems. Geophys. Res. Lett. 2020, 47, e2020GL088918. [Google Scholar] [CrossRef]
  16. Tian, F.; Fensholt, R.; Verbesselt, J.; Grogan, K.; Horion, S.; Wang, Y. Evaluating temporal consistency of long-term global NDVI datasets for trend analysis. Remote Sens. Environ. 2015, 163, 326–340. [Google Scholar] [CrossRef]
  17. Fensholt, R.; Rasmussen, K.; Nielsen, T.T.; Mbow, C. Evaluation of earth observation based long term vegetation trends—Intercomparing NDVI time series trend analysis consistency of Sahel from AVHRR GIMMS, Terra MODIS and SPOT VGT data. Remote Sens. Environ. 2009, 113, 1886–1898. [Google Scholar] [CrossRef]
  18. Liu, Y.; Li, Z.; Chen, Y.; Li, Y.; Li, H.; Xia, Q.; Kayumba, P.M. Evaluation of consistency among three NDVI products applied to High Mountain Asia in 2000–2015. Remote Sens. Environ. 2022, 269, 112821. [Google Scholar] [CrossRef]
  19. Tao, S.; Peng, W.; Xiang, J. Spatiotemporal variations and driving mechanisms of vegetation coverage in the Wumeng Mountainous Area, China. Ecol. Inform. 2022, 70, 101737. [Google Scholar] [CrossRef]
  20. Chen, J.; Xu, C.; Lin, S.; Wu, Z.; Qiu, R.; Hu, X. Is There Spatial Dependence or Spatial Heterogeneity in the Distribution of Vegetation Greening and Browning in Southeastern China? Forests 2022, 13, 840. [Google Scholar] [CrossRef]
  21. Qu, S.; Wang, L.; Lin, A.; Zhu, H.; Yuan, M. What drives the vegetation restoration in Yangtze River basin, China: Climate change or anthropogenic factors? Ecol. Indic. 2018, 90, 438–450. [Google Scholar] [CrossRef]
  22. Ge, W.; Deng, L.; Wang, F.; Han, J. Quantifying the contributions of human activities and climate change to vegetation net primary productivity dynamics in China from 2001 to 2016. Sci. Total Environ. 2021, 773, 145648. [Google Scholar] [CrossRef] [PubMed]
  23. Guan, Y.; Guo, S.; Zhu, X.; Zhang, L.; Sielmann, F.; Fraedrich, K.; Cai, D. Vegetation Dynamics on the Tibetan Plateau (1982–2006): An Attribution by Ecohydrological Diagnostics. J. Clim. 2015, 28, 4576–4584. [Google Scholar] [CrossRef]
  24. Jiang, H.; Xia, X.; Guan, M.; Wang, L.; Huang, Y.; Jiang, Y. Determining the contributions of climate change and human activities to vegetation dynamics in agro-pastural transitional zone of northern China from 2000 to 2015. Sci. Total Environ. 2020, 718, 134871. [Google Scholar] [CrossRef] [PubMed]
  25. Yuan, L.; Chen, X.; Wang, X.; Xiong, Z.; Song, C. Spatial associations between NDVI and environmental factors in the Heihe River Basin. J. Geogr. Sci. 2019, 29, 1548–1564. [Google Scholar] [CrossRef] [Green Version]
  26. Ji, S.; Ren, S.; Li, Y.; Dong, J.; Wang, L.; Quan, Q.; Liu, J. Diverse responses of spring phenology to preseason drought and warming under different biomes in the North China Plain. Sci. Total Environ. 2021, 766, 144437. [Google Scholar] [CrossRef] [PubMed]
  27. Zheng, K.; Wei, J.; Pei, J.; Cheng, H.; Zhang, X.; Huang, F.; Li, F.; Ye, J. Impacts of climate change and human activities on grassland vegetation variation in the Chinese Loess Plateau. Sci. Total Environ. 2019, 660, 236–244. [Google Scholar] [CrossRef]
  28. Cheng, D.; Qi, G.; Song, J.; Zhang, Y.; Bai, H.; Gao, X. Quantitative Assessment of the Contributions of Climate Change and Human Activities to Vegetation Variation in the Qinling Mountains. Front. Earth Sci. 2021, 9, 782287. [Google Scholar] [CrossRef]
  29. Du, J.; Fu, Q.; Fang, S.; Wu, J.; He, P.; Quan, Z. Effects of rapid urbanization on vegetation cover in the metropolises of China over the last four decades. Ecol. Indic. 2019, 107, 105458. [Google Scholar] [CrossRef]
  30. Qin, H. Rural-to-Urban Labor Migration, Household Livelihoods, and the Rural Environment in Chongqing Municipality, Southwest China. Hum. Ecol. 2010, 38, 675–690. [Google Scholar] [CrossRef] [PubMed] [Green Version]
  31. Han, Z.; Song, W. Abandoned cropland: Patterns and determinants within the Guangxi Karst Mountainous Area, China. Appl. Geogr. 2020, 122, 102245. [Google Scholar] [CrossRef]
  32. Wang, K.; Cao, C.; Xie, B.; Xu, M.; Yang, X.; Guo, H.; Duerler, R.S. Analysis of the Spatial and Temporal Evolution Patterns of Grassland Health and Its Driving Factors in Xilingol. Remote Sens. 2022, 14, 5179. [Google Scholar] [CrossRef]
  33. Wen, Z.; Wu, S.; Chen, J.; Lü, M. NDVI indicated long-term interannual changes in vegetation activities and their responses to climatic and anthropogenic factors in the Three Gorges Reservoir Region, China. Sci. Total Environ. 2017, 574, 947–959. [Google Scholar] [CrossRef] [PubMed]
  34. Chen, Y.; Feng, X.; Tian, H.; Wu, X.; Gao, Z.; Feng, Y.; Piao, S.; Lv, N.; Pan, N.; Fu, B. Accelerated increase in vegetation carbon sequestration in China after 2010: A turning point resulting from climate and human interaction. Glob. Chang. Biol. 2021, 27, 5848–5864. [Google Scholar] [CrossRef] [PubMed]
  35. Gu, L.; Gong, Z.; Du, Y. Evolution characteristics and simulation prediction of forest and grass landscape fragmentation based on the “Grain for Green” projects on the Loess Plateau, P.R. China. Ecol. Indic. 2021, 131, 108240. [Google Scholar] [CrossRef]
  36. He, J.; Shi, X.; Fu, Y. Identifying vegetation restoration effectiveness and driving factors on different micro-topographic types of hilly Loess Plateau: From the perspective of ecological resilience. J. Environ. Manag. 2021, 289, 112562. [Google Scholar] [CrossRef]
  37. Shi, S.; Yu, J.; Wang, F.; Wang, P.; Zhang, Y.; Jin, K. Quantitative contributions of climate change and human activities to vegetation changes over multiple time scales on the Loess Plateau. Sci. Total Environ. 2021, 755, 142419. [Google Scholar] [CrossRef]
  38. Iegorova, L.V.; Gibbs, J.P.; Mountrakis, G.; Bastille-Rousseau, G.; Paltsyn, M.Y.; Ayatkhan, A.; Baylagasov, L.V.; Robertus, Y.V.; Chelyshev, A.V. Rangeland vegetation dynamics in the Altai mountain region of Mongolia, Russia, Kazakhstan and China: Effects of climate, topography, and socio-political context for livestock herding practices. Environ. Res. Lett. 2019, 14, 104017. [Google Scholar] [CrossRef] [Green Version]
  39. Zhang, X.; Liu, M.; Zhao, X.; Li, Y.; Zhao, W.; Li, A.; Chen, S.; Chen, S.; Han, X.; Huang, J. Topography and grazing effects on storage of soil organic carbon and nitrogen in the northern China grasslands. Ecol. Indic. 2018, 93, 45–53. [Google Scholar] [CrossRef]
  40. Li, Y.; Li, Z.; Zhang, X.; Gui, J.; Xue, J. Vegetation variations and its driving factors in the transition zone between Tibetan Plateau and arid region. Ecol. Indic. 2022, 141, 109101. [Google Scholar] [CrossRef]
  41. Ma, Y.; Guan, Q.; Sun, Y.; Zhang, J.; Yang, L.; Yang, E.; Li, H.; Du, Q. Three-dimensional dynamic characteristics of vegetation and its response to climatic factors in the Qilian Mountains. Catena 2022, 208, 105694. [Google Scholar] [CrossRef]
  42. Zhang, Y.; Ye, A. Quantitatively distinguishing the impact of climate change and human activities on vegetation in mainland China with the improved residual method. GISci. Remote. Sens. 2021, 58, 235–260. [Google Scholar] [CrossRef]
  43. Gu, Z.; Duan, X.; Shi, Y.; Li, Y.; Pan, X. Spatiotemporal variation in vegetation coverage and its response to climatic factors in the Red River Basin, China. Ecol. Indic. 2018, 93, 54–64. [Google Scholar] [CrossRef]
  44. Liu, H.; Jiao, F.; Yin, J.; Li, T.; Gong, H.; Wang, Z.; Lin, Z. Nonlinear relationship of vegetation greening with nature and human factors and its forecast—A case study of Southwest China. Ecol. Indic. 2020, 111, 106009. [Google Scholar] [CrossRef]
  45. Xu, X.; Liu, H.; Jiao, F.; Gong, H.; Lin, Z. Nonlinear relationship of greening and shifts from greening to browning in vegetation with nature and human factors along the Silk Road Economic Belt. Sci. Total Environ. 2021, 766, 142553. [Google Scholar] [CrossRef] [PubMed]
  46. Piao, S.; Yin, G.; Tan, J.; Cheng, L.; Huang, M.; Li, Y.; Liu, R.; Mao, J.; Ranga, B.M.; Peng, S.; et al. Detection and attribution of vegetation greening trend in China over the last 30 years. Glob. Chang. Biol. 2015, 21, 1601–1609. [Google Scholar] [CrossRef]
  47. Nie, T.; Dong, G.; Jiang, X.; Lei, Y. Spatio-Temporal Changes and Driving Forces of Vegetation Coverage on the Loess Plateau of Northern Shaanxi. Remote Sens. 2021, 13, 613. [Google Scholar] [CrossRef]
  48. Zhang, D.; Jia, Q.; Xu, X.; Yao, S.; Chen, H.; Hou, X. Contribution of ecological policies to vegetation restoration: A case study from Wuqi County in Shaanxi Province, China. Land Use Policy 2018, 73, 400–411. [Google Scholar] [CrossRef]
  49. Wang, J.; Xu, C. Geodetector:Principle and prospective. Acta Geogr. Sin. 2017, 72, 116–134. [Google Scholar] [CrossRef]
  50. Xu, C.; Zhang, X.; Xiao, G. Spatiotemporal decomposition and risk determinants of hand, foot and mouth disease in Henan, China. Sci. Total Environ. 2019, 657, 509–516. [Google Scholar] [CrossRef]
  51. Wu, X.; Yin, J.; Li, C.; Xiang, H.; Lv, M.; Guo, Z. Natural and human environment interactively drive spread pattern of COVID-19: A city-level modeling study in China. Sci. Total Environ. 2021, 756, 143343. [Google Scholar] [CrossRef]
  52. Zhou, Y.; Li, X.; Liu, Y. Land use change and driving factors in rural China during the period 1995-2015. Land Use Policy 2020, 99, 105048. [Google Scholar] [CrossRef]
  53. Chen, W.; Li, J.; Zeng, J.; Ran, D.; Yang, B. Spatial heterogeneity and formation mechanism of ecoenvironmental effect of land use change in China. Geogr. Res. 2019, 38, 2173–2187. [Google Scholar] [CrossRef]
  54. Chen, T.; Feng, Z.; Zhao, H.; Wu, K. Identification of ecosystem service bundles and driving factors in Beijing and its surrounding areas. Sci. Total Environ. 2020, 711, 134687. [Google Scholar] [CrossRef]
  55. Liao, J.; Yu, C.; Feng, Z.; Zhao, H.; Wu, K.; Ma, X. Spatial differentiation characteristics and driving factors of agricultural eco-efficiency in Chinese provinces from the perspective of ecosystem services. J. Clean Prod. 2021, 288, 125466. [Google Scholar] [CrossRef]
  56. Song, Y.; Wang, J.; Ge, Y.; Xu, C. An optimal parameters-based geographical detector model enhances geographic characteristics of explanatory variables for spatial heterogeneity analysis: Cases with different types of spatial data. GISci. Remote. Sens. 2020, 57, 593–610. [Google Scholar] [CrossRef]
  57. Hu, Y.; Yu, X.; Liao, W.; Liu, X. Spatio-Temporal Patterns of Water Yield and Its Influencing Factors in the Han River Basin. Resour. Environ. Yangtze Basin. 2022, 31, 73–82. [Google Scholar] [CrossRef]
  58. Liu, H.; Zheng, L.; Yin, S. Multi-perspective analysis of vegetation cover changes and driving factors of long time series based on climate and terrain data in Hanjiang River Basin, China. Arab. J. Geosci 2018, 11, 509. [Google Scholar] [CrossRef] [Green Version]
  59. Li, X.; Ren, Z.; Zhang, C. The correlation analysis and space-time changes of NDVI andhydro-thermal index in Hanjiang basin. Geogr. Res. 2013, 32, 1623–1633. [Google Scholar] [CrossRef]
  60. Yang, S.; Liu, J.; Wang, C.; Zhang, T.; Dong, X.; Liu, Y. Vegetation dynamics influenced by climate change and human activities in the Hanjiang River Basin, central China. Ecol. Indic. 2022, 145, 109586. [Google Scholar] [CrossRef]
  61. Qi, W.; Li, H.; Zhang, Q.; Zhang, K. Forest restoration efforts drive changes in land-use/land-cover and water-related ecosystem services in China’s Han River basin. Ecol. Eng. 2019, 126, 64–73. [Google Scholar] [CrossRef]
  62. Hutchinson, M.F. Interpolating mean rainfall using thin plate smoothing splines. Int. J. Geogr. Inf. Sci. 1995, 9, 385–403. [Google Scholar] [CrossRef]
  63. Sen, P.K. Estimates of the Regression Coefficient Based on Kendall’s Tau. J. Am. Stat. 1968, 63, 1379–1389. [Google Scholar] [CrossRef]
  64. Mann, H.B. Non-parametric tests against trend. Econometrica 1945, 13, 245–259. [Google Scholar] [CrossRef]
  65. Hurst, H.E. Long-Term Storage Capacity of Civil Reservoirs. Trans. Am. Soc. Civ. Eng. 1951, 116, 770–799. [Google Scholar] [CrossRef]
  66. Huo, H.; Sun, C. Spatiotemporal variation and influencing factors of vegetation dynamics based on Geodetector: A case study of the northwestern Yunnan Plateau, China. Ecol. Indic. 2021, 130, 108005. [Google Scholar] [CrossRef]
  67. Zuo, Y.; Li, Y.; He, K.; Wen, Y. Temporal and spatial variation characteristics of vegetation coverage and quantitative analysis of its potential driving forces in the Qilian Mountains, China, 2000–2020. Ecol. Indic. 2022, 143, 109429. [Google Scholar] [CrossRef]
  68. Xu, Y.; Zheng, Z.; Dai, Q.; Guo, Z.; Pan, Y. Attribution analysis of vegetation NPP variation in Southwest China considering time. Trans. Chin Soc. Agric. Eng. 2022, 38, 297–305. [Google Scholar] [CrossRef]
  69. Zhang, L.; Ding, M.; Zhang, H.; Wen, C. Spatiotemporal Variation of the Vegetation Coverage in Yangtze River Basin during 1982–2015. J. Nat. Resour. 2018, 33, 2084–2097. [Google Scholar] [CrossRef]
  70. Hu, Y.; Huang, J.; Du, Y.; Yu, X.; Wang, C. Spatio-Temporal Trends of Vegetation Coverage and Their Causes in the Danjiangkou Reservoir Region During 2000 to 2015. Resour. Environ. Yangtze Basin. 2018, 27, 862–872. [Google Scholar] [CrossRef]
  71. Liu, H.; Liu, F.; Yuan, H.; Zheng, L.; Zhang, Y.; Deng, Y. Assessing the relative role of climate and human activities on vegetation cover changes in the up–down stream of Danjiangkou, China. J. Plant. Ecol. 2022, 15, 180–195. [Google Scholar] [CrossRef]
  72. Yi, L.; Sun, Y.; Yin, S.; Wei, X.; Ouyang, X. Spatial-temporal variations of vegetation coverage and its driving factors in the Yangtze River Basin from 2000 to 2019. Acta Ecol. Sin. 2023, 43, 798–811. [Google Scholar] [CrossRef]
  73. Gao, S.; Dong, G.; Jiang, X.; Nie, T.; Yin, H.; Guo, X. Quantification of Natural and Anthropogenic Driving Forces of Vegetation Changes in the Three-River Headwater Region during 1982–2015 Based on Geographical Detector Model. Remote Sens. 2021, 13, 4175. [Google Scholar] [CrossRef]
  74. Li, S.; Li, X.; Gong, J.; Dang, D.; Dou, H.; Lyu, X. Quantitative Analysis of Natural and Anthropogenic Factors Influencing Vegetation NDVI Changes in Temperate Drylands from a Spatial Stratified Heterogeneity Perspective: A Case Study of Inner Mongolia Grasslands, China. Remote Sens. 2022, 14, 3320. [Google Scholar] [CrossRef]
  75. Du, J.; Shu, J.; Yin, J.; Yuan, X.; Jiaerheng, A.; Xiong, S.; He, P.; Liu, W. Analysis on spatio-temporal trends and drivers in vegetation growth during recent decades in Xinjiang, China. Int. J. Appl. Earth Obs. Geoinf. 2015, 38, 216–228. [Google Scholar] [CrossRef]
  76. Li, S.; Zhang, Y.; Wang, C.; Wang, T.; Yan, J. Coupling effects of climate change and ecological restoration on vegetation dynamics in the Qinling-Huaihe region. Prog. Geogr. 2021, 40, 1026–1036. [Google Scholar] [CrossRef]
  77. Wang, X.; Wang, B.; Xu, X.; Liu, T.; Duan, Y.; Zhao, Y. Spatial and temporal variations in surface soil moisture and vegetation cover in the Loess Plateau from 2000 to 2015. Ecol. Indic. 2018, 95, 320–330. [Google Scholar] [CrossRef]
  78. Li, P.; Wang, J.; Liu, M.; Xue, Z.; Bagherzadeh, A.; Liu, M. Spatio-temporal variation characteristics of NDVI and its response to climate on the Loess Plateau from 1985 to 2015. Catena 2021, 203, 105331. [Google Scholar] [CrossRef]
  79. Wang, H.; Liu, L.; Yin, L.; Shen, J.; Li, S. Exploring the complex relationships and drivers of ecosystem services across different geomorphological types in the Beijing-Tianjin-Hebei region, China (2000–2018). Ecol. Indic. 2021, 121, 107116. [Google Scholar] [CrossRef]
  80. Wang, X.; Wu, C.; Peng, D.; Gonsamo, A.; Liu, Z. Snow cover phenology affects alpine vegetation growth dynamics on the Tibetan Plateau: Satellite observed evidence, impacts of different biomes, and climate drivers. Agric. For. Meteorol. 2018, 256–257, 61–74. [Google Scholar] [CrossRef]
  81. Zhu, L.; Meng, J.; Zhu, L. Applying Geodetector to disentangle the contributions of natural and anthropogenic factors to NDVI variations in the middle reaches of the Heihe River Basin. Ecol. Indic. 2020, 117, 106545. [Google Scholar] [CrossRef]
  82. Zhan, Y.; Fan, J.; Meng, T.; Li, Z.; Yan, Y.; Huang, J.; Chen, D.; Sui, L. Analysis on vegetation cover changes and the driving factors in the mid-lower reaches of Hanjiang River Basin between 2001 and 2015. Open. Geosci. 2021, 13, 675–689. [Google Scholar] [CrossRef]
  83. Luo, Y.; Sun, W.; Yang, K.; Zhao, L. China urbanization process induced vegetation degradation and improvement in recent 20 years. Cities 2021, 114, 103207. [Google Scholar] [CrossRef]
  84. Feng, D.; Fu, M.; Sun, Y.; Bao, W.; Zhang, M.; Zhang, Y.; Wu, J. How Large-Scale Anthropogenic Activities Influence Vegetation Cover Change in China? A Review. Forests 2021, 12, 320. [Google Scholar] [CrossRef]
  85. Chen, W.; Xia, L.; Xu, G.; Yu, S.; Chen, H.; Jinfeng, C. Dynamic Variation of NDVI and Its Influencing Factors in the Pearl River Basin from 2000 to 2020. Ecol. Environ. Sci. 2022, 31, 1306–1316. [Google Scholar] [CrossRef]
Figure 1. Geographical information of the study area: (a) Geographical location and elevation, (b) land-use types, (c) landform types.
Forests 14 00509 g001
Figure 2. Optimal discretization method and breaks for continuous predictor variables affecting NDVI.
Forests 14 00509 g002
Figure 3. Temporal variation of NDVI in the HJRB from 2000 to 2020.
Forests 14 00509 g003
Figure 4. Spatial variation of NDVI and its significance test in the HJRB from 2000 to 2020.
Forests 14 00509 g004
Figure 5. The 2000–2020 Hurst index of vegetation in the HJRB and future trends. (a) Hurst exponent of vegetation coverage in the HJRB, 2000–2020; (b) Future trends of vegetation coverage in the HJRB, 2000–2020.
Forests 14 00509 g005
Figure 6. The factor detection results of NDVI variability in the HJRB.
Forests 14 00509 g006
Figure 7. Interaction detector of factors influencing vegetation in the HJRB from 2000 to 2020.
Forests 14 00509 g007
Figure 8. Mean values and trends of vegetation in the HJRB in relation to topography.
Forests 14 00509 g008
Figure 9. Spatial distribution of the correlation between NDVI and climate factors in the HJRB. PC: positive correlation, NC: negative correlation. (ae): Spatial trend distributions of precipitation, temperature, sunshine duration, relative humidity, and wind speed, respectively. (a’e’): Spatial distributions of correlation analysis and significance test of NDVI with precipitation, temperature, sunshine duration, relative humidity, and wind speed, respectively.
Forests 14 00509 g009
Figure 10. Mean values and vegetation trends in the HJRB in relation to soil type and vegetation type. The number from 1 to 10 denotes 10 intervals in soil type, which are, respectively: semi-leached soil, leached soil, primary soil, semi-hydromorphic soil, hydromorphic soil, artificial soil, alpine soil, Ferralso soil, others, and water. The number from 1 to 7 denote 7 intervals in Vegetation type, which are, respectively: others, coniferous forest, broad-leaved forest, brushwood, grass, meadow, and cultivated plant.
Forests 14 00509 g010
Figure 11. Mean values and trends of vegetation in the HJRB in relation to human activities.
Forests 14 00509 g011
Table 1. Description of interaction type.
Judgment basisType of interaction
q(X1 ∩ X2) < min(q(X1),q(X2))nonlinear-weaken
min(q(X1),q(X2) < q(X1 ∩ X2) < Max(q(X1), q(X2))uni-variable weaken
q(X1 ∩ X2) > max(q(X1),q(X2))bi-variable enhance
q(X1 ∩ X2) = q(X1)+q(X2)independent
q(X1 ∩ X2) > Min(q(X1) + q(X2))enhance, nonlinear
Table 2. Statistics of NDVI trend.
βZSTrend of NDVI
≥0.0005≥1.96significant improvement
≥0.0005−1.96–1.96slight improvement
−0.0005–0.0005−1.96–1.96stable
<−0.0005−1.96–1.96slight degradation
<−0.0005<1.96significant degradation
Disclaimer/Publisher’s Note: The statements, opinions and data contained in all publications are solely those of the individual author(s) and contributor(s) and not of MDPI and/or the editor(s). MDPI and/or the editor(s) disclaim responsibility for any injury to people or property resulting from any ideas, methods, instructions or products referred to in the content.

