Article

Farmland Hydrology Cycle and Agronomic Measures in Agroforestry for the Efficient Utilization of Water Resources under Karst Desertification Environments

School of Karst, State Engineering Technology Institute for Karst Desertification Control, Guizhou Normal University, Guiyang 550001, China
*
Author to whom correspondence should be addressed.
Forests 2023, 14(3), 453; https://doi.org/10.3390/f14030453
Submission received: 28 January 2023 / Revised: 17 February 2023 / Accepted: 20 February 2023 / Published: 22 February 2023

Abstract

:
Severe soil-water loss and unfertile soil frequently occur under karst desertification environments. The surface-underground dual structure in these areas allows the surface water to leak into the subsurface through cracks and sinkholes, as well as other conduits, causing a special “karst drought”. Hence, water-resource shortage has become a challenge for local agricultural development. To realize efficient utilization of water resources, an urgent need is to clearly understand and study the law of farmland hydrological cycles under agroforestry practices, which is still understudied. Here, we focused on the hydrological cycle at the farmland scale and water-saving measures under agroforestry in three study areas representing different degrees of karst desertification. First, a significant positive correlation was found between total and available precipitations as well as land evapotranspiration (LET). Second, under agronomic measures, the soil water content in the three areas was all higher than that of the control group while soil evaporation was all lower. This indicates that agronomic measures can contribute to the efficient use of water resources by halting soil evaporation and increasing soil water content. Third, dwarf dense planting and pruning technologies were helpful in inhibiting crop transpiration and reducing vegetation interception. Fourth, in the farmland hydrological cycle of agroforestry, 77.45% of precipitation transformed into soil water storage, 24.81% into soil evaporation, 20.73% into plant transpiration, 17.40% into groundwater, and 5.18% into vegetation interception. However, their sum was greater than 100%, suggesting that the farmland-scale water cycle is an open system. The implication is that different agronomic practices under agroforestry bring certain water-saving benefits by constraining the conversion of ineffective water and promoting the storage of effective water, thus opening up promising opportunities for efficiently utilizing water resources in karst desertification areas. The finding is also significant to the control of karst desertification, soil and water conservation, and karst drought alleviation.

1. Introduction

With carbonate rock exposure covering 10% of the world’s land area [1], and providing water for 20%–25% of the world’s population [2], karst regions are undoubtedly one of the most ecologically fragile areas in the world [3]. Karst desertification is a land degradation phenomenon caused by the interaction between unreasonable human activities and a fragile ecological environment in karst areas [4]. This is a serious ecological environment problem [5,6], and gives rise to a delicate ecological system [7,8]. It also constantly results in severe soil and water loss [9,10], and land degradation (a systemic global problem) [11]. In China, karst desertification has been recognized as one of the ecological disasters [12,13,14,15]. The focus of its control is on improving the environment and raising revenue through protecting and establishing vegetation, promoting sustainable land use, and implementing water conservation measures [16]. In Southwest China, afforestation and reforestation projects are important ways of ecological restoration [17]. They have been adopted to combat desertification in the karst regions [18], which has an impact on the hydrologic process [19]. Karst regions are characterized by a discrete hydrological system [20]. Abundant precipitation fails to provide sufficient surface water [2] and unique “Karst Drought” appears. The reason is that rainfall tends to leak underground along rock fissures and pores [14,21]. A week with little rain will induce drought stress on many crops, and thus agronomic water-saving measures are necessary to alleviate this stress and improve crop productivity.
Currently, environmental degradation and loss of biodiversity are threatening the stability of our planet [22]. These problems are especially a focus of the UN Sustainable Development Goals (SDGs), which are trying to improve livelihoods while ensuring the conservation and sustainable use of terrestrial ecosystems [23]. In real practice, agroforestry is being widely implemented with the expectation that it can simultaneously meet each of these goals [24]. It is seen as a way of promoting sustainable dryland use [25], generating the ecological benefits of carbon storage rise [26], and land rehabilitation [27]. Agroforestry systems have so far proven to offer significant co-benefits to the healthy ecological system and crop yield growth and may be especially important for rural populations in low- and middle-income countries [28]. Correspondingly, in karst areas, they not only help to rein the rocky desertification process but also boost the ecological derived industry.
At the farmland scale, there has been some research involving the hydrological cycle of agroforestry in all aspects. One study reported that surface runoff declined by 1%–100% under agroforestry systems [29]. In another, it is said that agroforestry increased the soil water buffering capacity, which enhanced the drought tolerance of the system [30]. Reports on other aspects also appear from time to time. Ling et al. [31] suggested that agroforests generally improved water conditions in shallow soil layers compared to single-culture plantations. A study by Hombegowda et al. [32] showed that coffee plants drew water mainly from the topsoil (56% from 0 to 20 cm). In some extremely dry periods, agroforests are reported to be able to compete to absorb deeper soil water. One case showed that intercropping resulted in jujube trees absorbing deeper water (up to 3 m) in overlap layers below the main root [33]. According to research by Liu et al. [34], 27.83% (4.3%–58.0%) of precipitation recharged the groundwater of the agroforestry watershed in the Sichuan Basin. It was concluded in a study by Wu et al. [11] that agroforestry has the ecological benefit of reducing soil evaporation and crop transpiration. Zhang et al. [35] found that the actual evapotranspiration was 7.64 ± 5.75 mm day−1 in a karst silvopasture system, of which 4.24 ± 3.35 mm day−1 was for crops and 5.78 ± 3.53 mm day−1 was for grass ecosystems.
This line of research shows interest in different aspects like surface water, soil water content, soil water evaporation, plant transpiration, and groundwater. Nevertheless, investigations into hydrological processes are limited [29], and thus it is significant to examine the hydrological cycle at the farmland scale. This study selected the horizontal plots which generate little surface water from natural rainfall, and hence the focus was on rates of precipitation transforming into soil water, groundwater, soil evaporation, plant transpiration, and vegetation interception. This was to make clear the hydrological cycle law at the farmland scale under agroforestry systems, so as to provide a reference for the efficient utilization of water resources and promote the healthy and high-yield development of agroforestry.

2. Materials and Methods
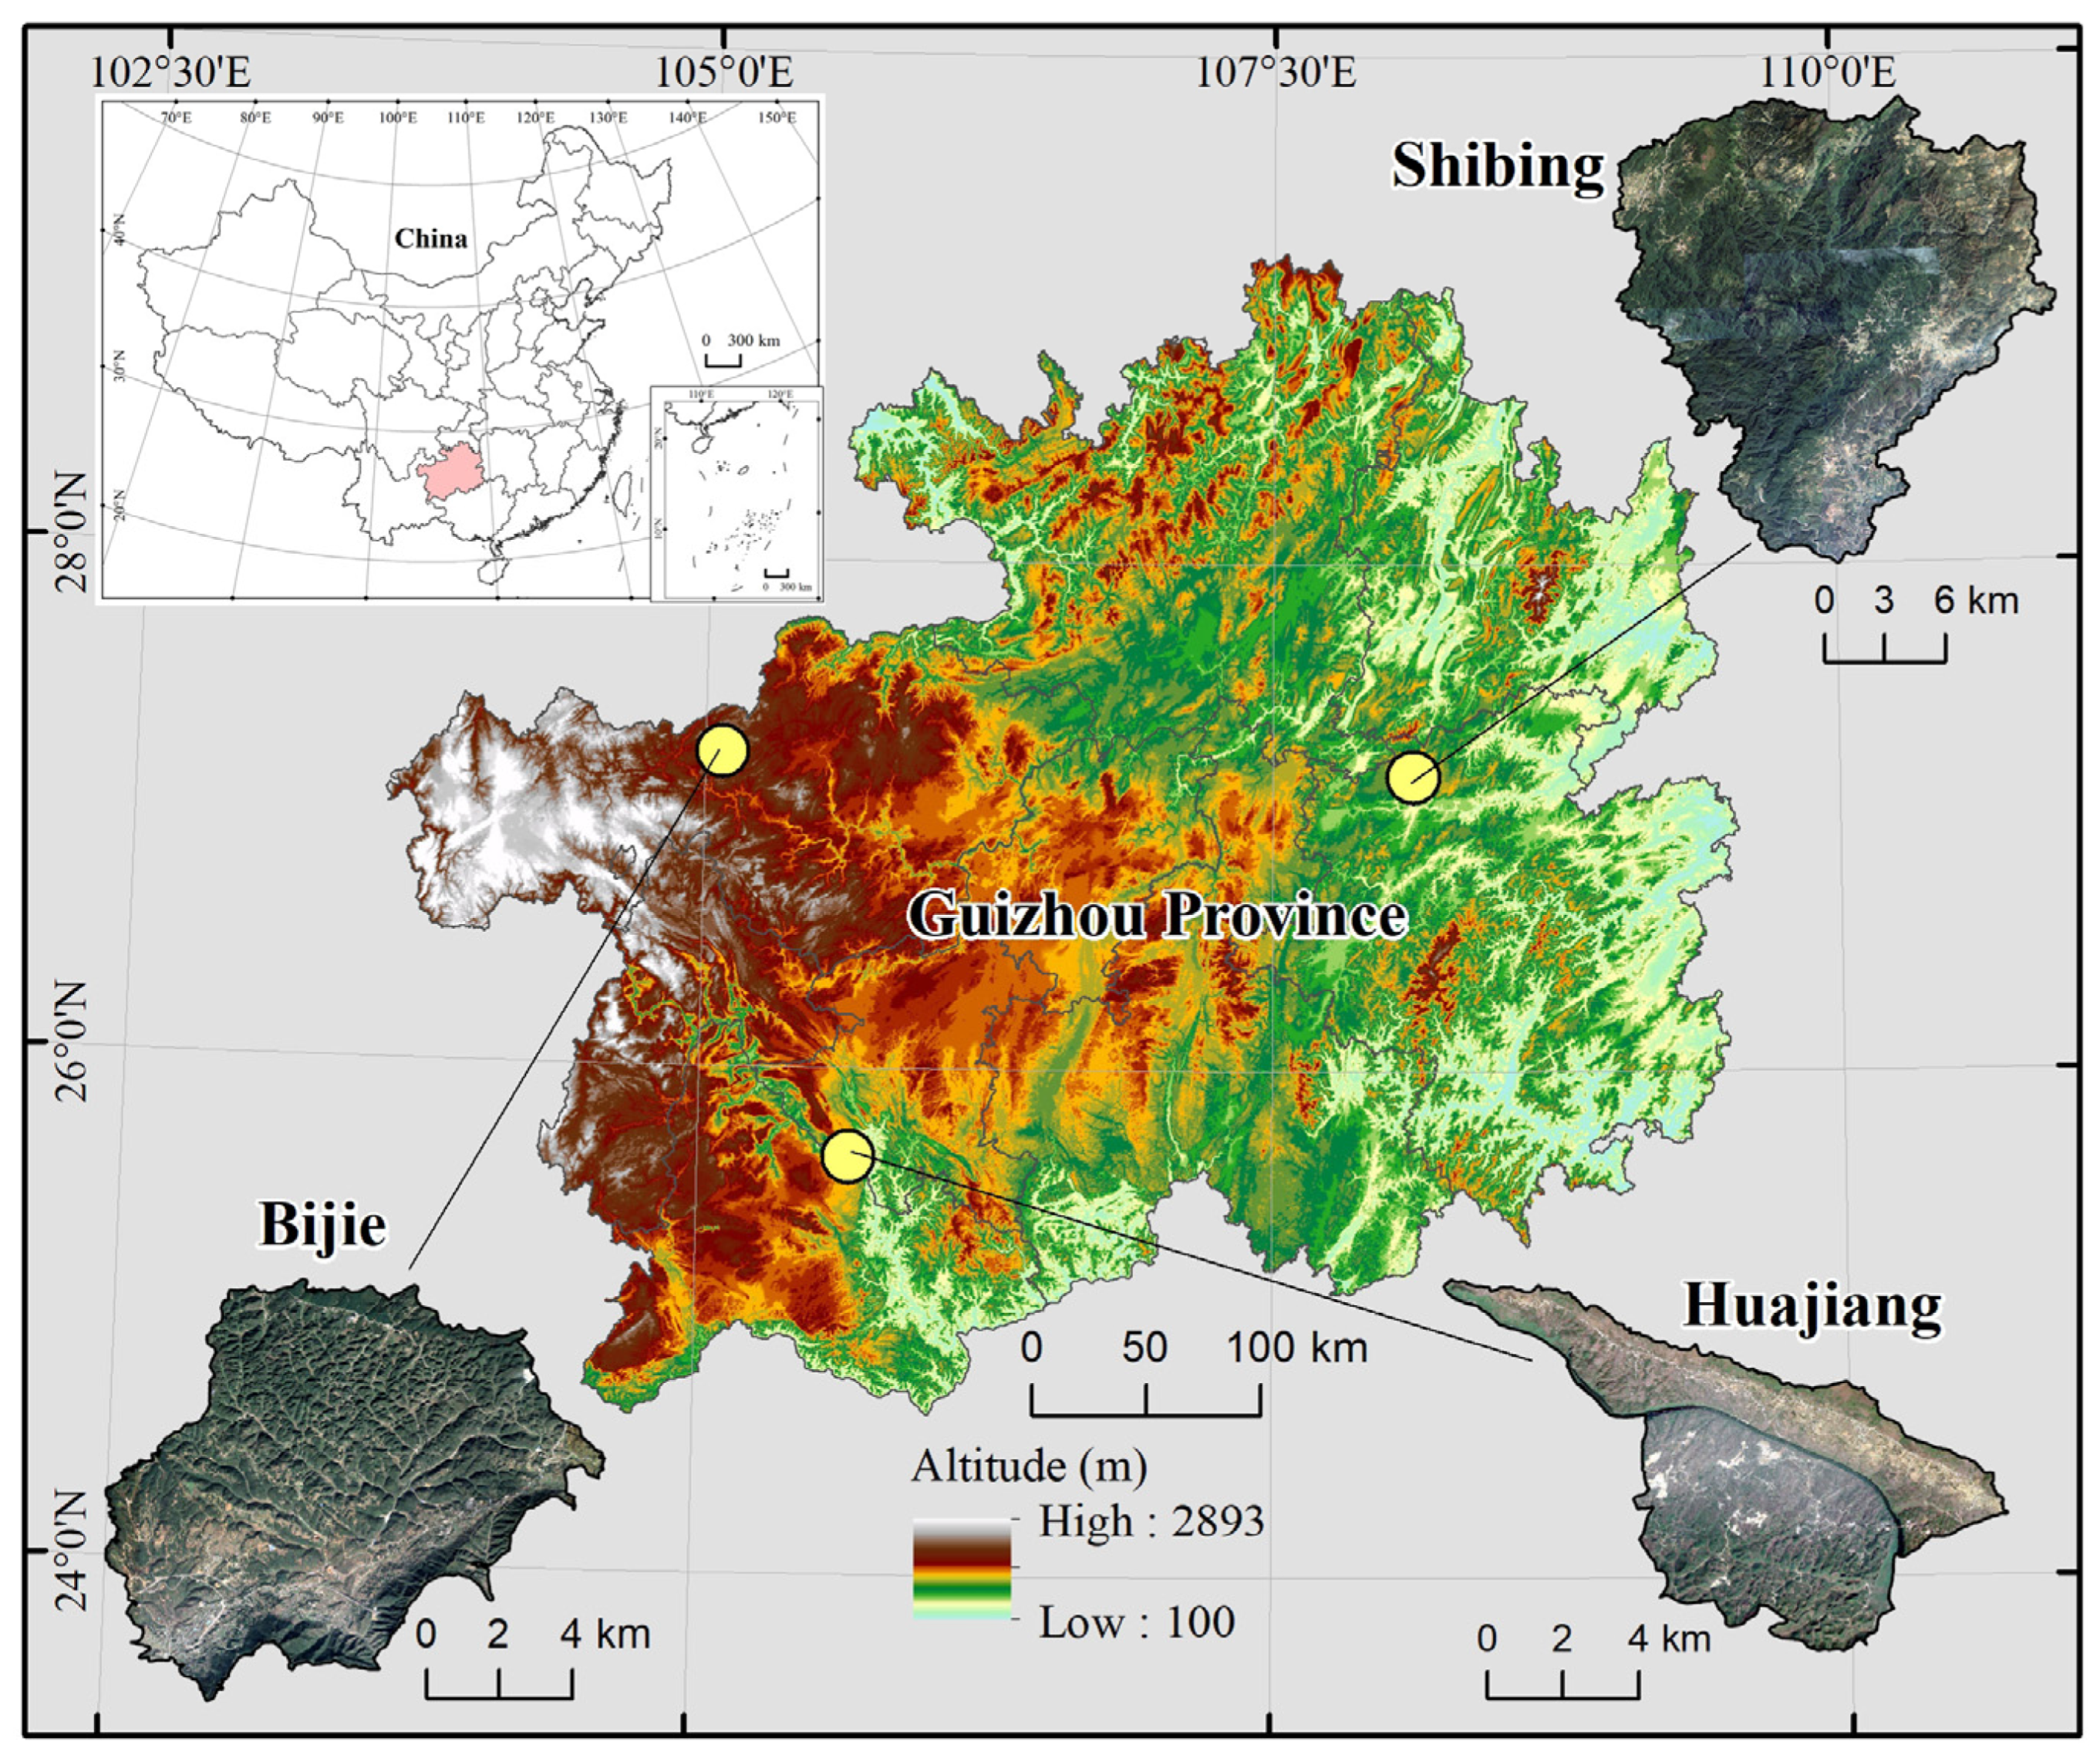
2.1. Study Areas

Located in the northwest of Guizhou Province, Bijie Salaxi Research region (Bijie for short) (105°02′01″–105°08′09″ E, 27°11′36″–27°16′51″ N) covers an area of 86.27 km2, of which 73.94% is karst. The altitude of the region is 1509–2180 m above sea level, and its average annual temperature is 12 °C, with 984.4 mm average annual precipitation. Mostly limestone, this region represents typically potential-mild level karst desertification on the karst plateau. The Guanling—Zhenfeng Huajiang Research Area (Huajiang in brief) (105°36′30″–105°46′30″ E, 25°39′13″–25°41′00″ N) is in the southwest of Guizhou Province. It covers an area of 51.62 khm², of which 87.92% is karst, rising above sea level about 450–1450 m, with a mean annual temperature of 18.4℃ and receiving 1100 mm average rainfall. It is dominated by dolomitic limestone, representing the typical medium-intensity karst desertification in karst plateau canyons. The Shibing Research Area (Shibing in brief) (108°01′36″–108°10′52″ E, 27°13′56″–27°04′51″ N) is in the eastern part of Guizhou Province. It has an area of 282.95 km2, 89.11% of which belongs to karst. Its altitude is 600–1250 m, with a 16 °C annual average temperature and 1220 mm annual mean precipitation. It represents the no-potential karst desertification region in the dolomite plateau valleys (Figure 1).

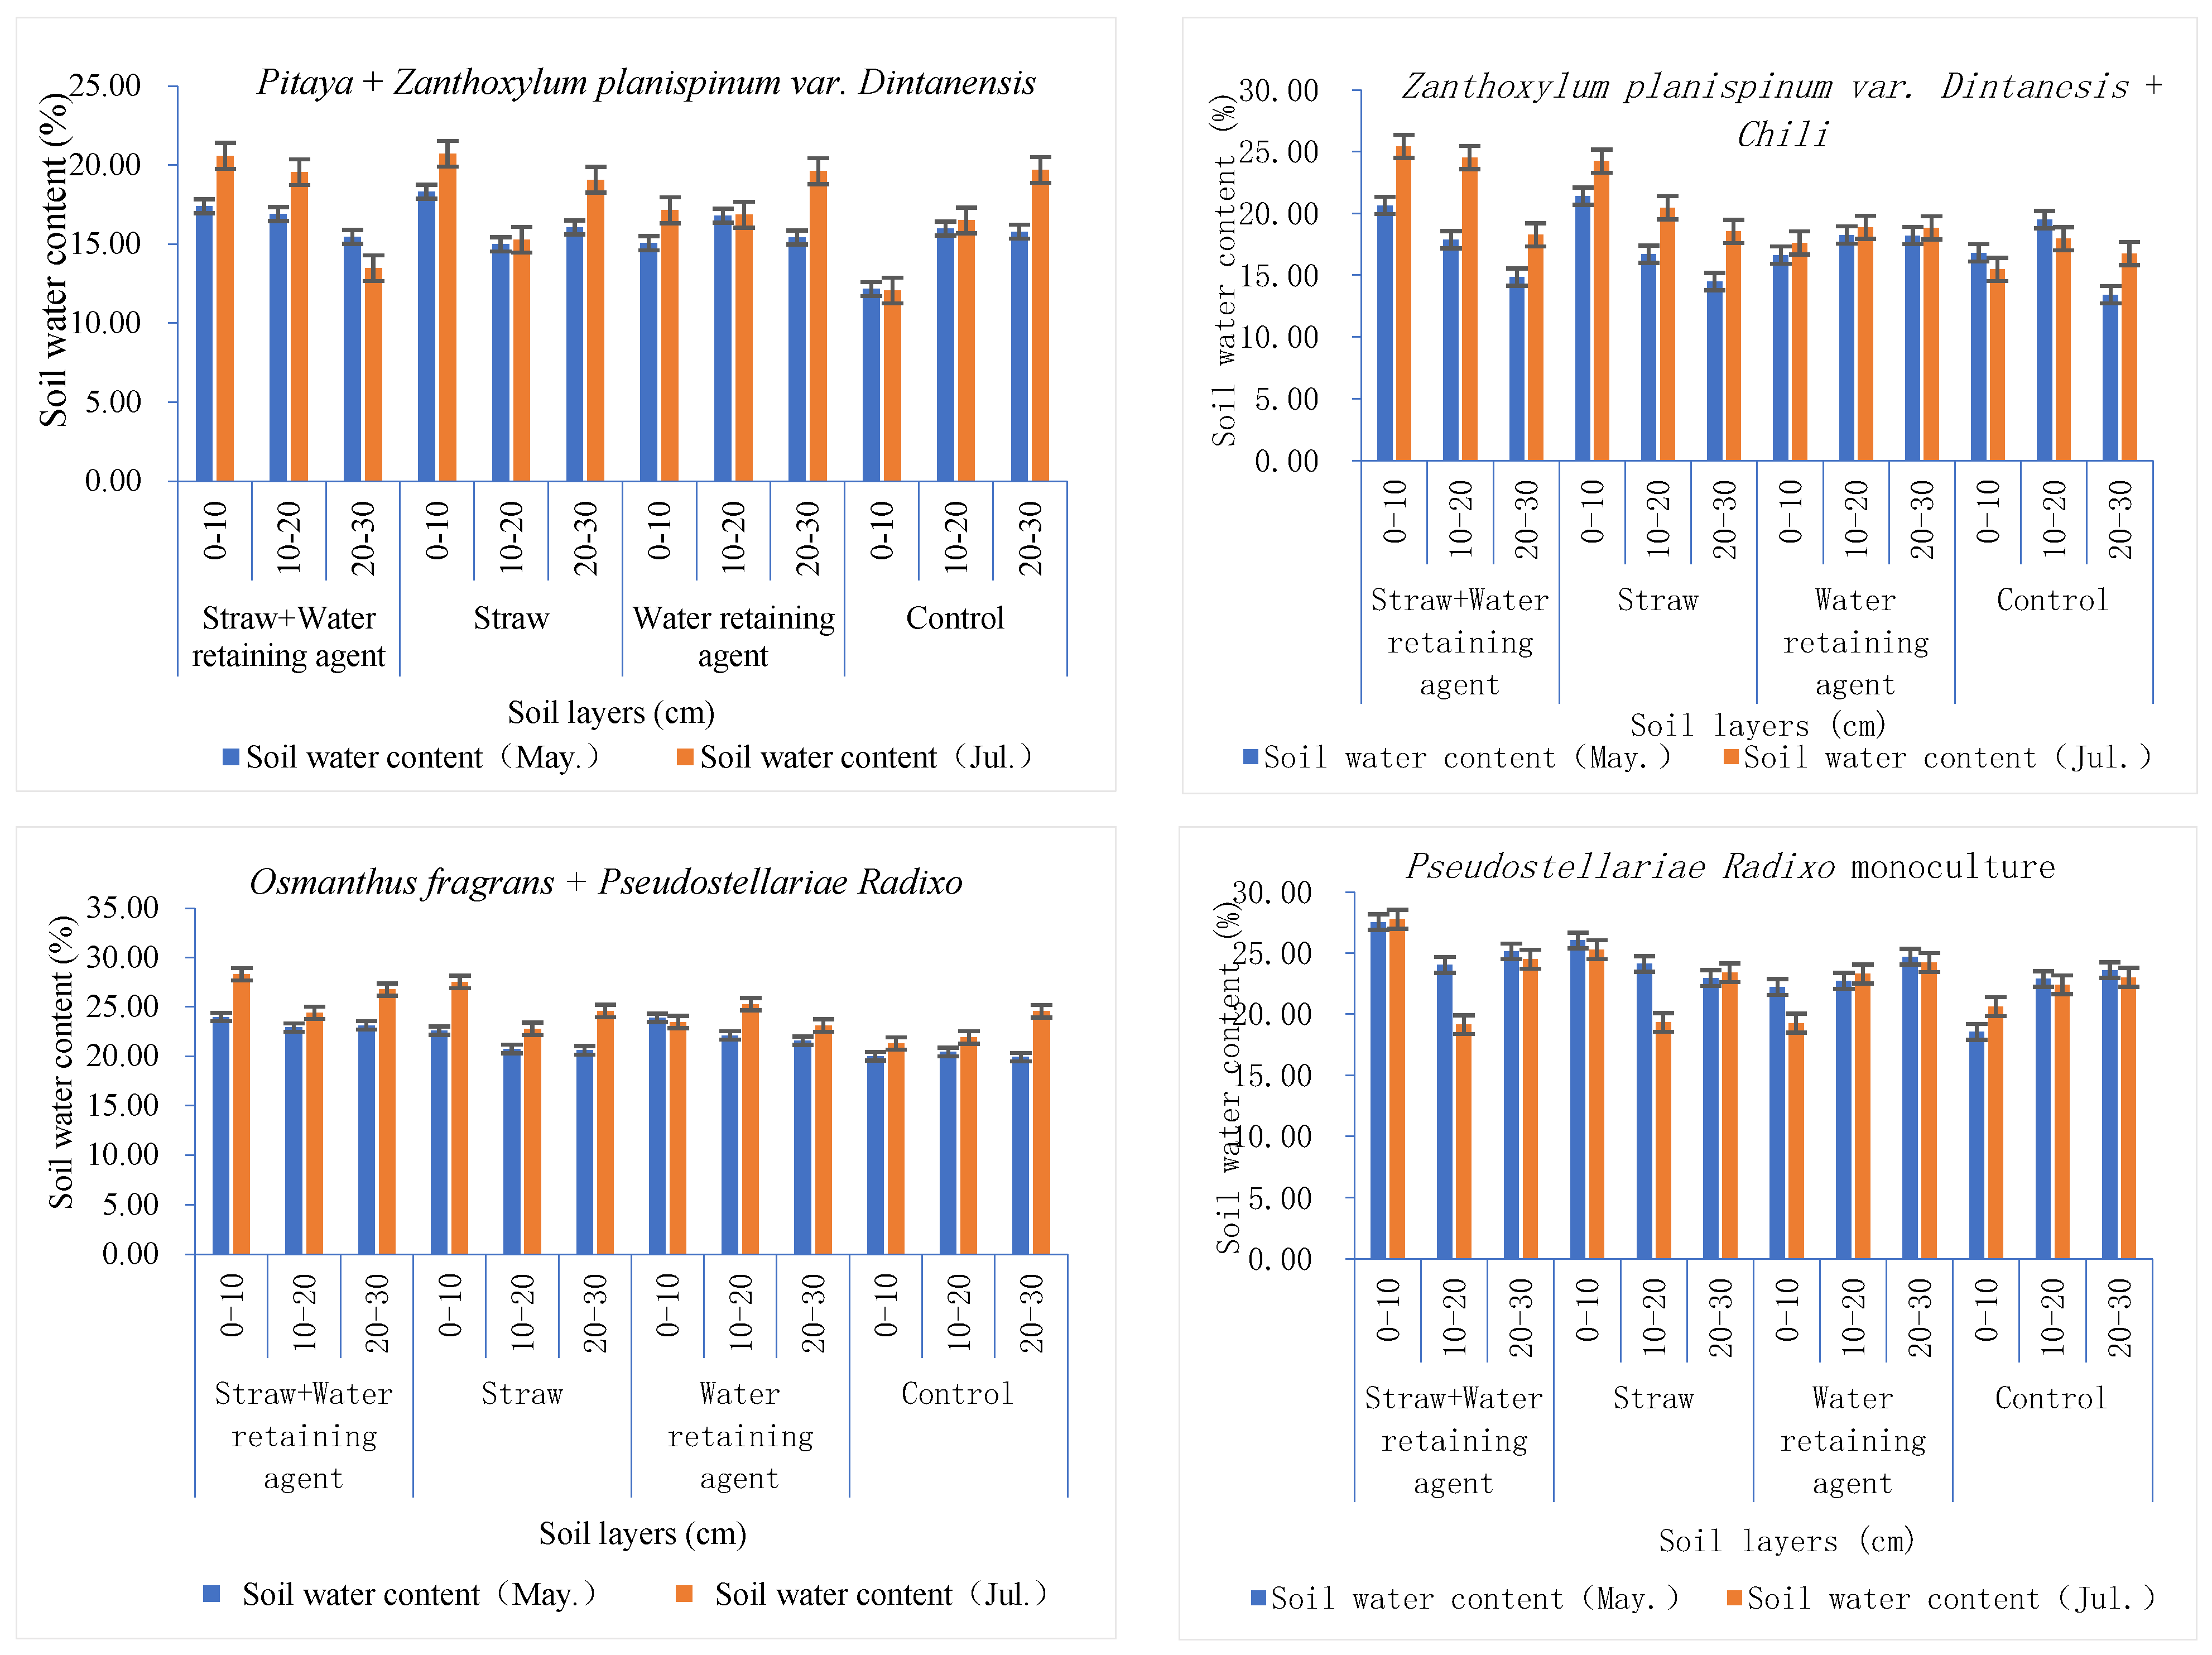
2.2. Experimental Design and Data Processing

There were three study areas, each with two planting patterns and four treatments for each planting pattern, so a total of 24 plots were delineated (4 m × 5 m). The crop selection was based on natural conditions, economic growth needs, reasonable agroforestry configuration, and optimal use of water resources. In Bijie, we selected Rosa roxburghii, Walnut, Potato, and Ryegrass. Rosa roxburghii and Walnut are the dominating cash crop for the local people and Potato is one of the staple foods that is suitable for the natural conditions there. Ryegrass planting conforms to the requirements of controlling karst desertification and local livestock development. In Huajiang, we chose Zanthoxylum planispinum var. Dintanensis, Chili, and Pitaya, for they are drought-resisting and have become the local main cash crops. In Shibing, we selected Osmanthus fragrans and Pseudostellariae Radix because they are locally characteristic industrial crops. We planted these crops as: Rosa roxburghii + Ryegrass (Model A) and Walnut + Potato (Model B) in Bijie, Pitaya + Zanthoxylum planispinum var. Dintanensis (Model C) and Zanthoxylum planispinum var. Dintanensis + Chili (Model D) in Huajiang, and Osmanthus fragrans + Pseudostellariae Radixo (Model E) and Pseudostellariae Radixo monoculture (Model F) in Shibing. The agroforestry models realized the height configuration and avoided interspecific competition so that the species of the agroforestry system could maximize the use of soil water and nutrients and reasonably use rainfall and solar energy resources.
In April 2019, we applied four treatments (Table 1) to the plots according to the real conditions. The first one was straw + water retaining agent (SWR). We used a polyacrylamide water-retaining agent and the solution was prepared at 1% concentration. Later, this was evenly applied to the surface soil where the crop roots were distributed. We then covered the surface soil with 2 cm-long maize straw, to a thickness of 5 cm. The second was straw mulching (STR). We first used 2 cm-long maize straw to cover the surface soil to a thickness of 5 cm. We then dug 10 cm of soil in a vertical direction under the straw with a hoe and mixed them well. The third treatment was only water-retaining agent (WRA), and the same substance and concentration as that in the first treatment. After blending well in a plastic bucket, this was applied evenly into the soil layer where the crop roots were distributed. The fourth condition was the control plot (CON), with no agronomic treatment.
In the 2019 crop growing season (April–August), we monitored the soil’s physical properties at the sample sites. The monitoring was conducted once a month with the cutting ring method, and three layers of soil were taken—0–10 cm, 10–20 cm, and 20–30 cm from the upper, middle, and lower layers (each layer was taken 3 times along an S-shape, and then averaged). Then it was taken back to the laboratory for test analysis to obtain soil properties such as soil water content, porosity, field water capacity, and saturated water content.
We monitored the surface water at the study sites by conducting artificial simulated rainfall tests in March 2019. When the rain intensity reached 140 mm h−1, no surface runoff occurred. Data from the weather station (DAVIS-Vantage Pro), which we installed in the study sites, showed that in 2019 the maximum rain intensity was only 78 mm h−1 in Bijie, 60 mm h−1 in Huajiang, and 97 mm h−1 in Shibing, and the heaviest rainfall was 116 mm d−1, 98 mm d−1, 105 mm d−1, respectively. Meanwhile, we built runoff plots (4 m × 5 m) around the sample plots with iron sheets of 3 mm thickness, 500 mm height, and 1900 mm length. These iron sheets were 200 mm high above the surface and 300 mm deep under the soil. Our monitoring did not find surface runoff. As a result, surface runoff was negligible and excluded from the hydrological cycle in this study.
We used self-made microlysimeters to monitor soil evaporation [36]. On days in the middle of every month from April to August 2019, 48 self-made microlysimeters were placed in the parts with and without vegetation cover in each of the 24 sample plots when there was no rain. Each microlysimeter consisted of inner and outer rings, made of Poly Vinyl Chloride (PVC). The inner ring was 300 mm long, 100 mm in diameter (cross-sectional area: 78.5 mm2), and the wall thickness was 3 mm. The outer ring was 300 mm long, 150 mm in diameter, and 3 mm in wall thickness. At 8:00 on a given day, the inner ring was driven into the soil with a hammer, creating a column of soil in the inner ring. We used a hoe to dig out the inner ring along with the soil column (taking care not to damage the soil column in the inner ring and cleaning up the soil on its outer wall). After this, we wrapped the bottom with nylon netting to prevent soil from leaking. Third, the inner ring with the soil column was weighed with an electronic balance (a measuring range of 5 kg and an accuracy of 0.01 g). Fourth, the outer ring was installed vertically into the pit where the column was excavated so that the upper part was flush with the ground. A scrap newspaper was also placed inside the outer ring to stop the soil from sticking to the bottom of the inner ring. Finally, we placed the inner ring inside the outer ring. At the same time the next morning, the inner ring was taken out and weighed again. The difference between the two days of weighing was the 24-h soil evaporation (g). The average daily soil evaporation was measured for 3 consecutive days in each plot every month.
We conducted real-time monitoring of precipitation and temperature with the installed small weather stations (DAVIS-Vantage Pro) in the three study sites. The Koichiro Takahashi formula (Equation (1)) [37,38,39] was applied to process the collected data to obtain land evapotranspiration and available precipitation. Land evapotranspiration (LET) refers to the loss of water from the land surface into the atmosphere through evaporation from ground and canopy rainfall interception and transpiration from vegetation; it is a key process in the climatic and biogeochemical cycles of terrestrial ecosystems and plays a vital role in the hydrological cycle, energy balance, and carbon cycle [40,41,42]. The two variables were then analyzed using SPSS to identify their relationship with precipitation in the corresponding period. Precipitation occurrence and transformation in the three study areas were analyzed according to temporal scale and spatial variation, hoping to provide a reference for studies on the storage and conversion of soil water, soil evaporation, plant transpiration, vegetation interception, and groundwater.
E = 3100 P 3100 + 1.8 P 2 exp   ( 34.4 t 235 + t )
where E is monthly LET (mm), P is monthly total rainfall (mm), and t is monthly average temperature (°C). Based on this formula, we obtained the following variables through linear equations: available precipitation F (mm) (Equation (2)), evapotranspiration coefficient α (Equation (3)), and available precipitation coefficient β (Equation (4)).
F = P E
α = E / P
β = ( P E ) / P
We used the pruning and weighing method to assess the crop transpiration rates of agroforestry [43,44]. We conducted the measurements in the study sites from April to August 2019. First, we placed a wind-proof electronic balance with a precision of 0.001 in a relatively flat place, which was near the crops to be monitored in the field. We then cut off the standard branches (branches or leaves in the crown of a tree or crop, having an average diameter, length, and average leaf weight), and immediately put them on the balance to weigh. Third, we returned the weighed branches to their respective places and weighed them five minutes later. The difference between the two weights was the transpiration rate and amount (Equation (5)). We weighed the branches from 8:00 in the morning to 6:00 in the evening, once every 2 h, a total of 6 times a day.
E t = m 0 m 1 ( m 0 m z ) × 5 × 60
where Et refers to the transpiration rate (g g−1 h−1), m0 to the initial weight of branches and leaves (g), m1 to the final weight of branches and leaves (g), and mz to the weight of branches (g).
Crop biomass and dry matter need monitoring when calculating transpiration and water use efficiency (WUE). Biomass is constantly changing and thus was obtained by the harvest method [45,46,47]. In order to ensure that continuous positioning monitoring can be carried out in the future, we applied an analogy for crop selection. We selected the crops with the same stand, species, average plant height, stand age, density, and planting method from adjacent plots (4 m × 5 m), which were 5 m apart and had similar altitudes, slope soil type, and agronomic measures. We harvested the aboveground parts of all the crops, weighing the fresh weight and taking them back to the laboratory for dry weight analysis.
We performed the immersion method (Equation (6)) to calculate vegetation interception. We immediately immersed the last-weighed branches and leaves in the water for 5 min and then removed them. After the branches and leaves stopped dripping (about 3 min later), we put them into a plastic bag to weigh. By removing the plastic bag weight, we assessed the difference between the left weight and that of the last-weighed branches and leaves, so as to obtain the weight of intercepted water; that is, the plant water capacity [48].
I v = P b × R w / S × n
where Iv is the amount of vegetation interception (mm), Pb is crop biomass (g), Rw is plant water holding rate, S is the sample area (m2), and n is the number of rainfall.
W g = P W i W r W s
Equation (7) was used to calculate the groundwater of each planting mode. Where Wg represents groundwater (mm), P is rainfall (mm), Wi is the amount of vegetation interception (mm), Wr is surface water (mm), and Ws is soil water (mm).

3. Results

3.1. Characteristics of Precipitation Transformation

In the three research areas, summer (June to August) received the most rain yet spring suffered severe drought. During the 2019 crop-growing season (April to August), Shibing received the largest amount of rain (1003.00 mm), followed by Bijie (981.60 mm), with Huajiang at the bottom (549.90 mm) (Table 2). Spring drought is a meteorological disaster in karst areas. Of the three areas, Huajiang ranked the severest, where little rainfall events occurred in March and May; only 64.70 mm of rainfall was received from April to May. That was only 33.18% of Bijie’s rainfall and 22.75% of Shibing’s during the same period. Occasionally, sporadic light rain fell on the surface of the soil but quickly evaporated under the influence of the climate in the hot and dry valley (high temperature, strong sunshine, intense evaporation). Spring is when crops depend on a large amount of water to grow and is the time little soil water can be absorbed by plants. In Huajiang, severe spring drought was responsible for yellow or wilted crops, including the drought-resisting ones like Zanthoxylum planispinum var. Dintanensis and Pitaya.
In the three areas, we monitored the precipitation from April to August. SPSS was employed to analyze the collected data to reveal the relationship among precipitation, available precipitation, and land evapotranspiration (LET). It was found that precipitation was positively correlated to the other two variables (p < 0.01). The highest correlation coefficient was found with available precipitation (Bijie r = 0.984, p < 0.01; Huajiang r = 0.965, p < 0.01; Shibing r = 0.994, p < 0.01), and the second with LET (Bijie r = 0.780, p < 0.01; Huajiang r = 0.889, p < 0.01; Shibing r = 0.975, p < 0.01). Based on the monitored temperature and precipitation, the Koichiro Takahashi formula was applied to generate the precipitation result; that is, precipitation was the sum of the available precipitation and LET. For instance, in Bijie, precipitation was 981.60 mm, the summation of the available precipitation (637.47 mm) and LET (344.13 mm). The same was true for the rest of the study areas. The implication here is that precipitation transforms into either available precipitation or LET. In other words, the sum of the two variables is precipitation and there is a trade-off between them. For a certain amount of precipitation, the available precipitation is more if the LET is less, and vice versa.

3.2. Storage and Transformation of Soil Water and Efficient Utilization of Water Resources

Soil water consists of transformation amount, and soil water storage—an important index of soil water content. Agronomic treatments were implemented in April and analysis compared the soil water content for May and July. Under each treatment, it was higher in July than in May. While more rain in July did contribute to this, the agronomic measures certainly produced water conservation benefits, for there was higher soil water content under almost all treatments than that of the control plot (the soil water content of some individual treatments was lower than that of the control. A case was found in the model of Rosa roxburghii + Ryegrass. In May, the soil water content was 17.17% in the 0–10 cm soil layer under the water-retaining agent while it was 17.45% in the control plot. This may be because the surface soil was affected by the difference in terrain height, direction, and soil water absorption by plant roots. Analysis between groups produced the result that the average soil water content of the study areas in May and July was 23.17% in Shibing, higher than those for Bijie (18.60%) and Huajiang (17.63%). This was consistent with the distribution in the control group and the total rainfall distribution in the crop-growing season. Another finding was that straw mulching produced higher soil water content in the surface layer (Figure 2). The reason for this was that the straw on the surface of the soil became fertilizer after rotting and hence triggered the “coupling effect of water and fertilizer”, which brought about the effect of “using fertilizer to increase and retain water”. When comparing the soil water content between different measures, we found that the highest was from straw + water-retaining agent (21.83%), with the second from straw (20.42%), and the third from the water-retaining agent alone (19.73%). The lowest was found in the control (17.93%). Agronomic treatments presented obvious water-retaining effects.
Soil water transformation is mainly manifested by soil evaporation. In the crop-growing season, soil evaporation occurred the most in Shibing (327.98 mm); Bijie (168.70 mm) followed and Huajiang (134.90 mm) evaporated the least. This conformed to the same law as the precipitation distribution in the three areas. Between the treatments, the lowest evaporation was found from straw + water-retaining agent (172.37 mm), and the highest from the control plot (253.57 mm), with the other two being in the middle (201.39 mm from the water-retaining agent and 214.78 mm from straw). The evaporation under each measure was lower than that of the control. Correlation analysis generated the following result: soil evaporation was positively related to soil water content (r = 0.602, p < 0.01) but negatively associated with vegetation coverage (r = −0.943, p < 0.01). To sum up, rich soil water content provided a water source for evaporation, which could be effectively slowed down by carrying out more vegetation covering, finally reaching the efficient use of water resources.

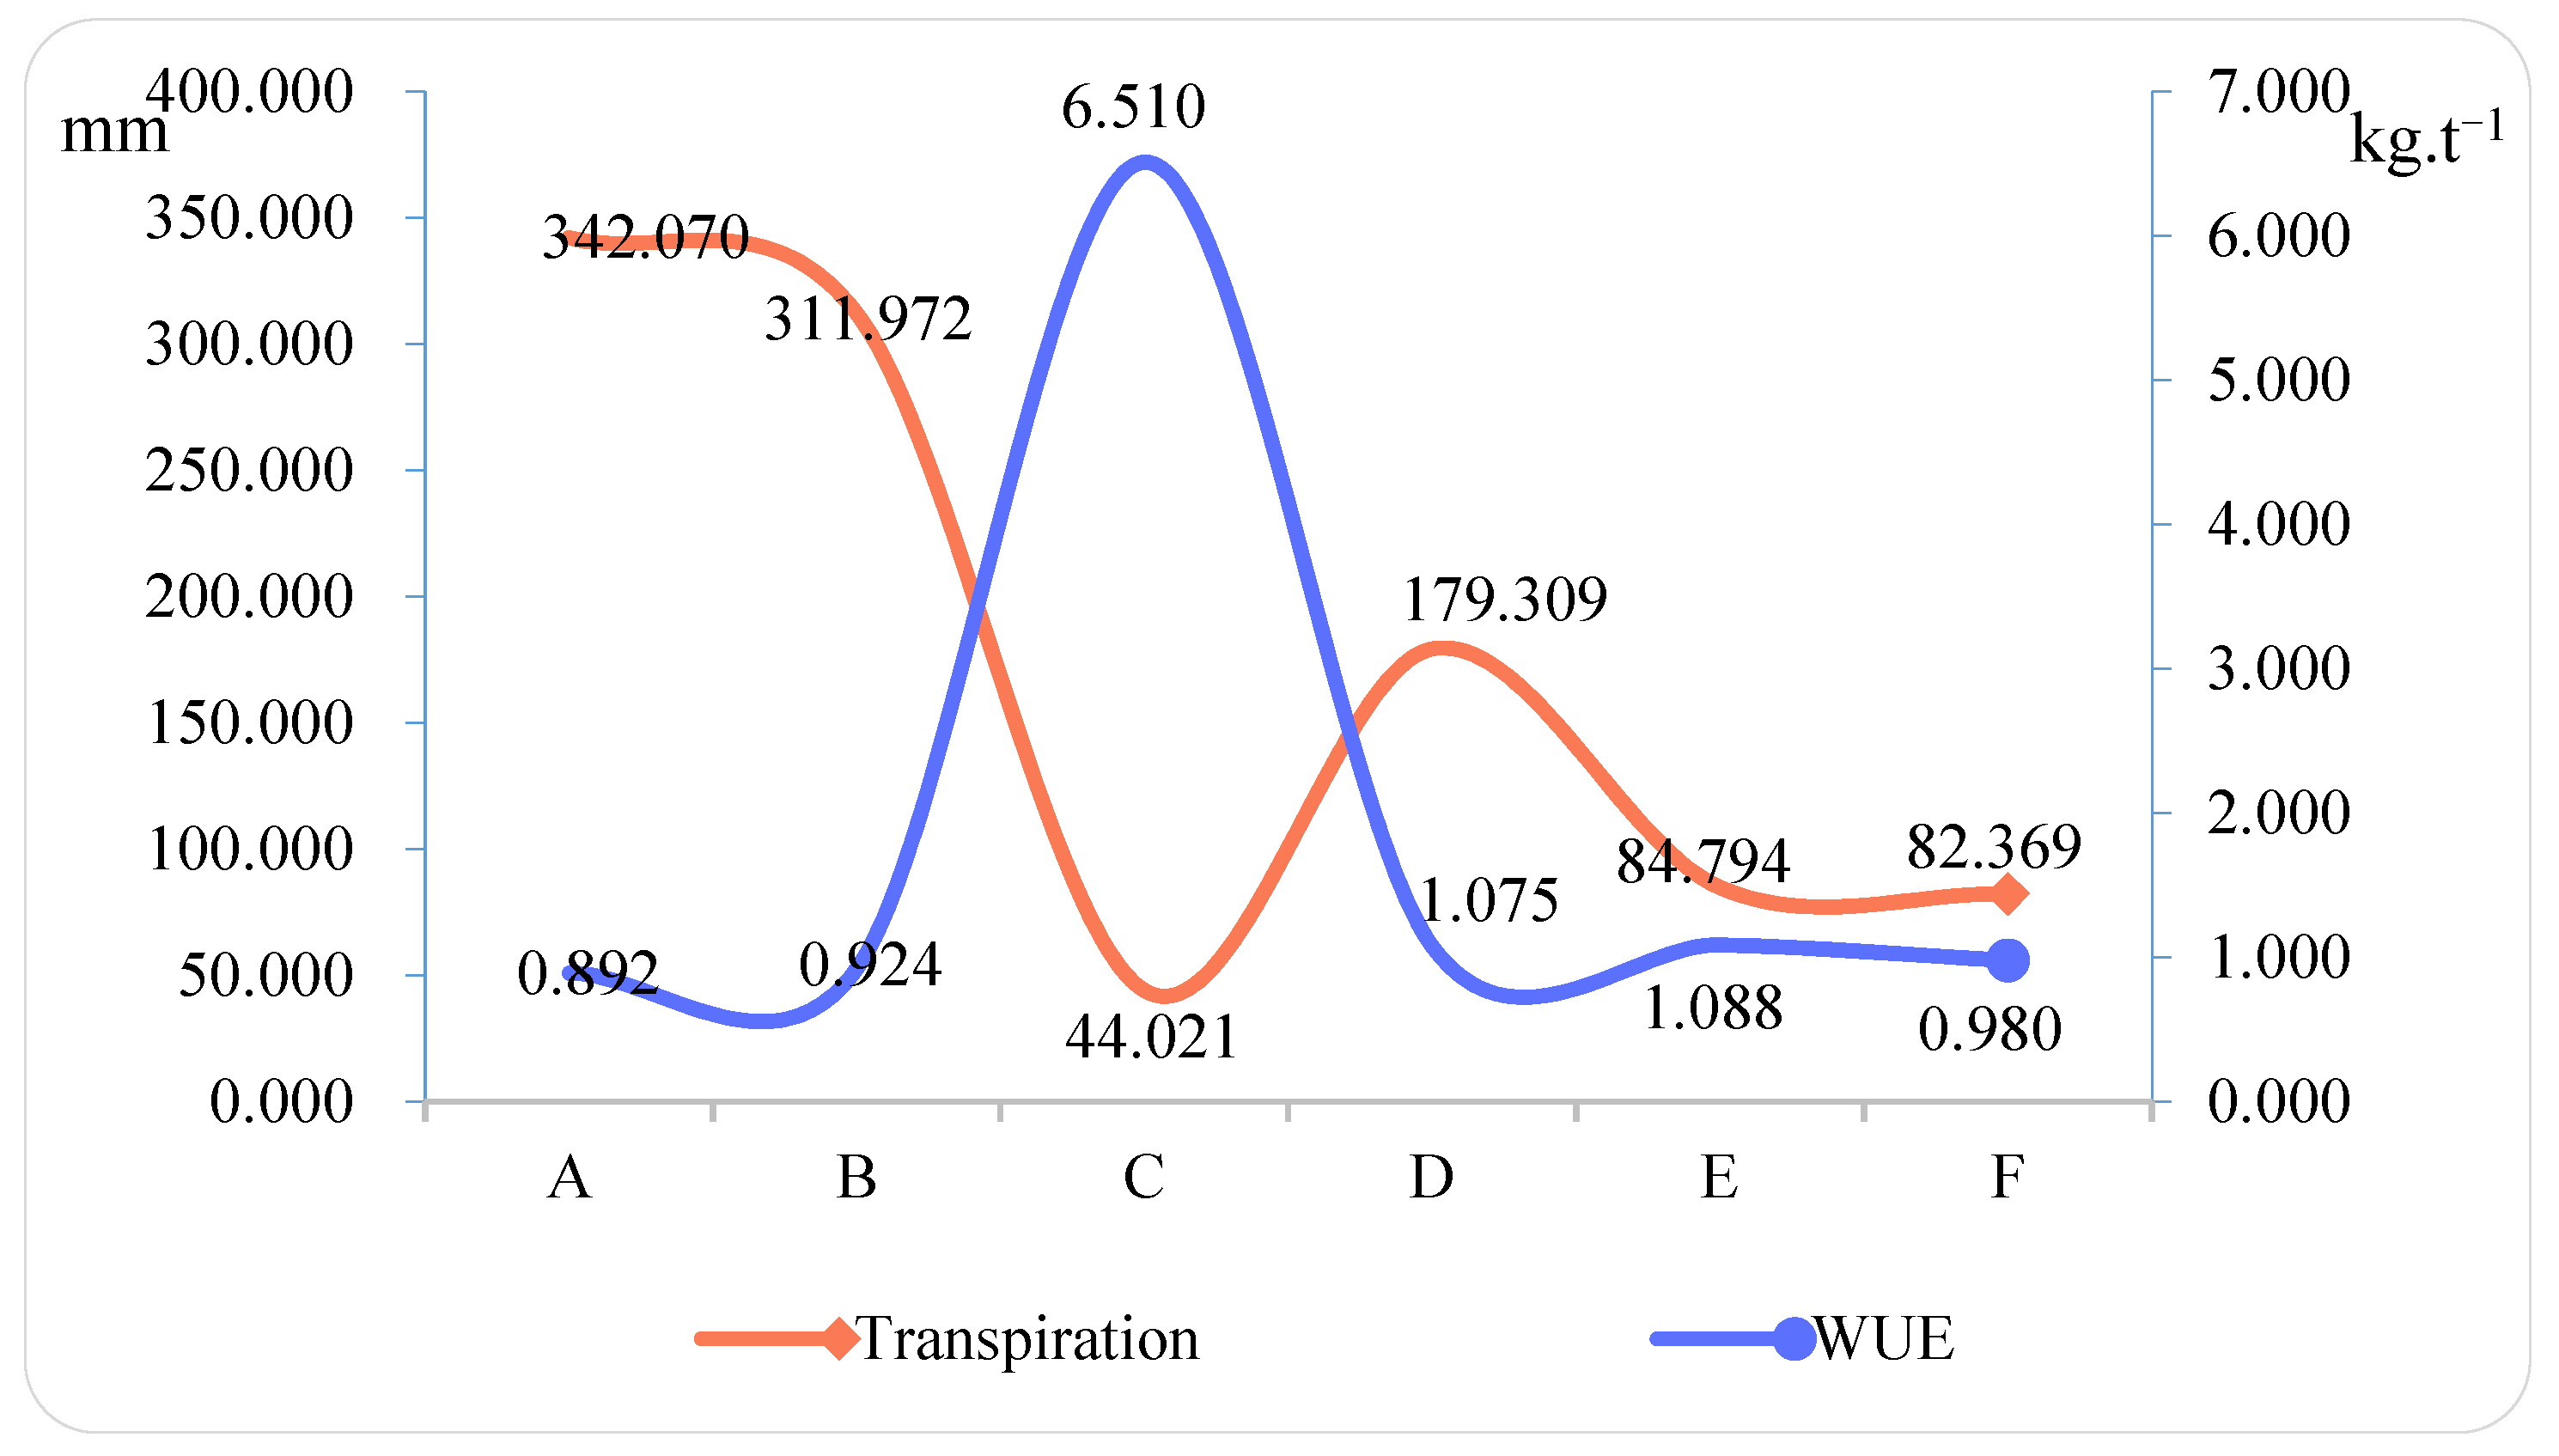
3.3. Characteristics of Plant Water Transformation and Efficient Use of Water Resources

Plant water transforms into transpiration and vegetation interception. The analyzed result was that the overall transpiration was greater under the agronomic treatments when compared to the control, and higher in the agroforestry treatments than monoculture. Of the agroforestry models, transpiration reached the maximum in the Rosa roxburghii + Ryegrass (344.98 mm) model and the minimum in Pitaya + Zanthoxylum planispinum var. Dintanensis (43.92 mm). Between the three regions, Bijie showed the highest average transpiration, with Shibing in the middle and Huajiang being the lowest. The results of the correlative analysis were: except for Pitaya + Zanthoxylum planispinum var. Dintanensis, the transpiration amounts and rates of the other planting models were significantly positively correlated with biomass (r= 0.964–0.971, p < 0.01). This positive association was also found in the case of vegetation interception and biomass (r = 0.830, p < 0.01).
As presented in Figure 3, the Pitaya + Zanthoxylum planispinum var. Dintanensis model had the largest amount of vegetation interception (66.43 mm), resulting from the mass biomass of Pitaya. The least vegetation interception was Pseudostellariae Radixo (20.16 mm), which was strongly associated with vegetation transpiration (r = 0.993, p < 0.01). In contrast to the other models, Pitaya + Zanthoxylum planispinum var. Dintanensis produced a significant negative relationship between vegetation interception and transpiration (r = −0.993, p < 0.01). This could be attributed to the low evaporation rate of the Pitaya, which generated less transpiration and whose large biomass brought greater vegetation interception. Apparently, vegetation interception varied with transpiration (with the Pitaya + ryegrass model excluded) (Figure 3). Meanwhile, the regression coefficient of vegetation interception (−0.1122) was less than that of transpiration (0.87), indicating a smaller change in vegetation interception compared with transpiration.
Transpiration and vegetation interception are contradictory units, increasing or decreasing simultaneously. Transpiration is considered to be an effective water consumption while vegetation interception is ineffective because it all evaporates. Karst areas are dominated by rain-fed agriculture. In the same area, biomass increases along with flourishing crops, which further results in high transpiration and vegetation interception. To enhance the efficiency of water resource utilization, dwarf dense planting and pruning are suggested ways to reduce biomass and lower transpiration and vegetation interception.

3.4. Storage, Transformation and Efficient Utilization of Water Resources

Precipitation is the total water resource in karst areas, which further transforms into surface water, underground water, soil water, vegetation interception, plant transpiration, and soil evaporation (Table 3). Through situ monitoring, we found that soil water was positively correlated with the available precipitation and soil evaporation, yet negatively associated with vegetation interception (p < 0.01); groundwater was observed to have a positive relationship with the available precipitation (p < 0.01). Water consumption caused by plant transpiration is a form of conversion after plants take in soil water or groundwater. It is an effective water consumption for plants. We found a negative relationship between plant transpiration and soil evaporation (p < 0.01). Vegetation interception and soil evaporation, not absorbed by plants, were regarded as invalid water, and a negative association was revealed between them (p < 0.01).
The conversion rates of rainfall to soil water, groundwater, transpiration, vegetation interception, and soil evaporation were 77.45% (42.07%–93.54%), 17.40% (0.99%–52.75%), 20.73% (7.86%–39.04%), 5.18% (1.96%–12.56%), and 24.81% (11.70%–43.94%). The highest conversion rate occurred in soil water and the lowest in vegetation interception. To realize the highly efficient use of water resources, we can perform agronomic measures to lower vegetation interception, control excessive plant transpiration, halt soil water evaporation, and increase soil water and groundwater storage. Thus, crops will have sufficient water to support their growth, alleviating spring drought and karst drought in the study areas and improving the WUE of crops.

4. Discussion

4.1. Available Precipitation and LET at Different Scales

It is still a worldwide challenge to study the water cycle in a water-air-land-plant system from a farmland scale to a watershed or regional scale, and even to a global scale [49]. In this study, Table 2 above presents the monitored temperature and precipitation at the watershed scale, and the LET and available precipitation calculated with the Koichiro Takahashi formula. These data represent the hydrological cycle at the watershed or regional scale. Precipitation at the watershed scale was equal to the sum of the available precipitation and LET, forming a closed system. Table 3 above presents the amount of precipitation transforming into soil water storage, groundwater, soil evaporation, plant transpiration, and vegetation interception, which reflects the hydrologic cycle at the farmland scale. At this scale, precipitation was not just the summation of surface water, soil water, groundwater, and plant water, thus forming an open system. Table 3 shows that by removing soil evaporation, plant transpiration, and vegetation interception, we obtained the average available precipitation at the farmland scale (Bijie 437.98 mm, Huajiang 255.56 mm, and Shibing 569.94 mm). Compared with Table 2, the available precipitation was relatively less, except for that in Huajiang which was a little larger.
The implication of these results is that data obtained by in-situ monitoring vary from model to model even in the same place and at the same time. LET is a way of water exchange between land and air [50], including water surface evaporation, soil evaporation, and plant transpiration [51]. Vegetation interception is all evaporated and hence was also included in LET. Accordingly, precipitation at the farmland scale goes into two types: available precipitation and LET. The latter is the second largest component of the water cycle, accounting for 50.69% of precipitation in this study and 44.4% in another [52]. The Current global evapotranspiration products are derived from a variety of sources, including models, remote sensing, and in situ observations. However, existing approaches contain extensive uncertainties. The LET amount obtained varied when calculated by different methods at the same scale or with the same method at different scales. Nevertheless, in almost all studies, it is positively correlated with temperature and precipitation [53]. From the perspective of improving WUE, LET needs slowing down, and at the farmland scale, agroforestry contributes to increasing vegetation coverage and lowering forest temperature [13].

4.2. The Water-Saving Function of Agronomic Treatments in Agroforestry

Configurations of agroforestry are a biological measure to save water and belong to a water-saving value-added industry [13,54]. It is under the category of water-saving agriculture, being able to enhance water retention [55]. Compared to row crops, agroforestry practices help reduce runoff losses from the watershed and promote soil water infiltration, whereby it increases soil water storage [13,29,56,57]. Different agroforestry configurations have varying capacities for water retention. In Dehra Dun, India, researchers monitored the surface runoff of agroforestry at an erosion plot (90 × 15 m), finding that the runoff in a maize-wheat + leucaenad model (209.3 mm) was more than that in a maize-wheat + eucalyptus model (141.8 mm) [58]. This has also been confirmed in other studies: agroforest of eucalyptus has shown a superior water-retention capacity to the agroforestry of leucaenad; there are gaps between the soil moisture contents under different agroforestry systems [59].
Agronomic treatments also contribute to water saving. Compared to traditional tillage, agronomic tillage improved water productivity and increased soil organic carbon and total soil nitrogen [60]. In India, Manohar et al. [61] practiced four types of mulching tillage: Green gram (Vigna radiatus), Black gram (Vigna mungo), Sun hemp (Crotalaria juncea), and Daincha (Sesbania aculeata). When a comparison was made between these experimental models and the control group (without legume green mulching), they found that mulching tillage showed larger water-holding capacity and richer soil moisture (Figure 4). Summing up, different configurations of agroforestry produce varying water-saving functions. Agronomic measures do manifest water-retention capacity to varying degrees. Therefore, a combination of the two will significantly enhance the water-retaining function of agroforestry in karst areas.

4.3. Standard Selection for WUE and Improvement of Crop WUE by Agroforestry

WUE is the only effective index to evaluate the efficient water use of crops [62]. Improving WUE is essential for the advancement of agricultural production [63]. There are multiple standards for WUE, including leaf WUE, yield WUE, and community WUE [62,64]. Leaf WUE indicates the physiological characteristics of the crops and is of biological significance. Yield WUE manifests the average significance, yet fails to show the dynamic water consumption law of crops. While community WUE reflects the dynamic characteristics of crop water consumption, there is no consensus on whether crop water consumption refers to transpiration or evapotranspiration [65]. In view of such understandings, the suggestion is to combine WUE standard selection with the actual needs of the research. In the case of our study, since we aimed to identify the dynamic water consumption law of agroforestry in the three study areas, the pruning and weighing method was adopted to test the dynamic water consumption of leaves, which employed the leaf WUE stand.
Luxury transpiration refers to the extra part of water consumption that exceeds the necessary amount for the physiological and metabolic requirements of crops, the transfer and transportation of nutrients, the production of photosynthetic substances, and the formation of yield [65]. Luxury transpiration tends to lower the WUE. However, when drought stress occurs, it can be slowed down, so that the WUE is once again improved [49]. In all the planting models in Bijie, Huajiang, and Shibing, the highest water consumption through transpiration was found in the Rosa roxburghii + Ryegrass model, and lowered successively in the Walnut + potato, Zanthoxylum planispinum var. Dintanensis + Chili, Osmanthus fragrans, Pseudostellariae Radixo, Pseudostellariae Radixo monoculture, and Pitaya + Zanthoxylum planispinum var. Dintanensis models. Yet a different law was found in WUE, which reached the bottom in the Rosa roxburghii + Ryegrass model, and then rose successively in the Walnut + Potato, Pseudostellariae Radixo monoculture, Zanthoxylum planispinum var. Dintanensis + Chili, Osmanthus fragrans + Pseudostellariae Radixo, and Pitaya + Zanthoxylum planispinum var. Dintanensis models. Of these models, Walnut + Potato, with the lowest WUE (0.892 kg t−1), transpired the most (342.070 mm). Conversely, Pitaya + Zanthoxylum planispinum var. Dintanensis transpired the least (44.021 mm) but reached the highest WUE (6.510 kg t−1) (Figure 5). WUE was negatively correlated with transpiration (p < 0.01). The results suggest that crop WUE can be improved by reducing crop transpiration using effective ways such as drought stress, pruning, and dwarf dense planting. These measures will effectively decrease luxury transpiration and thus enhance the crop WUE.

5. Conclusions

The unique hydrological cycle of the karst regions serves to be the basis for the efficient utilization of crop water resources. Agroforestry, a type of water-saving value-added industry, produces changing water-saving benefits with different configurations. Hence, varying configurations of agroforestry are in the agronomic water-saving category. To different degrees, agronomic treatments help to hold water, increase the conversion amount of effective water resources and weaken that of the ineffective ones. The combination of agroforestry and agronomic measures highlights the water-saving ability of crops. In this study, monitoring the farmland hydrological cycle generated the following results. (1) Precipitation was significantly positively related to the available precipitation and LET. The highest correlation coefficient was found with available precipitation, followed by evapotranspiration. (2) The soil water content under all agronomic measures was more than that of the control group while evaporation was less. This indicates that agronomic measures can halt soil evaporation, increase soil water content and promote efficient use of water resources. (3) Plant water consisted of transpiration consumption and vegetation interception. The latter fully evaporated and belonged to ineffective water consumption. When transpiration exceeded the minimum water consumption required for normal production, it was luxury transpiration. Transpiration, transpiration rate, and vegetation interception were positively associated with biomass. As a result, we can adopt dwarf-dense planting and pruning to reduce biomass to bring down luxury transpiration and improve the WUE. (4) In the cycle of precipitation transformation, most transformed into soil water; some transformed into groundwater, soil evaporation, and transpiration, and the least into vegetation interception. More water was transformed into soil water, which can satisfy the soil water absorption by crops and enhance water resource utilization. The conclusions of this study can provide a reference for other karst areas to develop water-saving value-added industries and improve the efficiency of water resource utilization.

Author Contributions

Conceptualization, Q.W. and J.X.; methodology, R.L.; software, J.X.; validation, K.X., R.L. and J.X.; formal analysis, Q.W.; investigation, Q.W.; resources, K.X.; data curation, Q.W.; writing—original draft preparation, Q.W.; writing—review and editing, Q.W.; visualization, J.X.; supervision, K.X.; project administration, K.X.; funding acquisition, K.X. All authors have read and agreed to the published version of the manuscript.

Funding

This study was supported by The China Overseas Expertise Introduction Program for Discipline Innovation (No. D17016), the Key Project of Science and Technology Program of Guizhou Province (No. 5411 2017 Qiankehe Pingtai Rencai), the Natural Science Foundation of Guizhou Province (No. 317 2022 QianKeHe JiChu -ZK), and the Science and Technology Support Plan of Guizhou Province (No. 462 2021 QianKeHe ZhiCheng).

Data Availability Statement

Data are contained within the article.

Conflicts of Interest

The authors declare no conflict of interest.

References

  1. Ford, D.C.; Williams, P.W. Karst Hydrogeology and Geomorphology; Wiley: Chichester, UK, 2007; p. 9. [Google Scholar] [CrossRef]
  2. Li, Y.; Liu, Z.; Liu, G.; Xiong, K.; Cai, L. Dynamic Variations in Soil Moisture in an Epikarst Fissure in the Karst Rocky Desertification Area. J. Hydrol. 2020, 591, 125587. [Google Scholar] [CrossRef]
  3. Qi, X.; Zhang, C.; Wang, K. Comparing Remote Sensing Methods for Monitoring Karst Rocky Desertification at Sub-pixel Scales in a Highly Heterogeneous Karst Region. Sci. Rep. 2019, 9, 13368. [Google Scholar] [CrossRef] [Green Version]
  4. Deng, X.; Xiong, K.; Yu, Y.; Zhang, S.; Kong, L.; Zhang, Y. A Review of Ecosystem Service Trade-Offs/Synergies: Enlightenment for the Optimization of Forest Ecosystem Functions in Karst Desertification Control. Forests 2023, 14, 88. [Google Scholar] [CrossRef]
  5. Zhao, L.; Hou, R. Human causes of soil loss in rural karst environments: A case study of Guizhou, China. Sci. Rep. 2019, 9, 3225. [Google Scholar] [CrossRef]
  6. Zhang, Y.; Tian, Y.; Li, Y.; Wang, D.; Tao, J.; Yang, Y.; Lin, J.; Zhang, Q.; Wu, L. Machine learning algorithm for estimating karst rocky desertification in a peak-cluster depression basin in southwest Guangxi, China. Sci. Rep. 2022, 12, 19121. [Google Scholar] [CrossRef]
  7. Zhou, H.; Xu, X.; Jiang, X.; Ding, B.; Wu, P.; Ding, F. Plant Functional Trait Responses to Dolomite and Limestone Karst Forests in Southwest China. Forests 2022, 13, 2187. [Google Scholar] [CrossRef]
  8. Qi, D.; Wieneke, X.; Xue, P.; DeSilva, W. Total nitrogen is the main soil property associated with soil fungal community in karst rocky desertification regions in southwest China. Sci. Rep. 2021, 11, 10809. [Google Scholar] [CrossRef]
  9. Jiang, M.; Lin, Y.; Chan, T.O.; Yao, Y.; Zheng, G.; Luo, S.; Zhang, L.; Liu, D. Geologic factors leadingly drawing the macroecological pattern of rocky desertification in southwest China. Sci. Rep. 2020, 10, 1440. [Google Scholar] [CrossRef] [Green Version]
  10. Wu, Z.; Zhu, D.; Xiong, K.; Wang, X. Dynamics of landscape ecological quality based on benefit evaluation coupled with the rocky desertification control in South China Karst. Ecol. Indic. 2022, 138, 108870. [Google Scholar] [CrossRef]
  11. Burrell, A.L.; Evans, J.P.; De Kauwe, M.G. Anthropogenic climate change has driven over 5 million km2 of drylands towards desertification. Nat. Commun. 2020, 11, 3853. [Google Scholar] [CrossRef]
  12. Huang, X.; Zhou, Y.; Wang, S.; Zhang, Z. Occurrence mechanism and prediction of rocky land degradation in karst mountainous basins with the aid of GIS technology, a study case in Houzhai River Basin in southwestern China. Environ. Earth Sci. 2019, 78, 217. [Google Scholar] [CrossRef]
  13. Wu, Q.; Liang, H.; Xiong, K.; Li, R. Eco-benefits coupling of agroforestry and soil and water conservation under KRD environment: Frontier theories and outlook. Agroforest Syst. 2019, 93, 1927–1938. [Google Scholar] [CrossRef]
  14. Wu, Q.; Liang, H.; Xiong, K.; Li, R. Efectiveness of monitoring methods for soil leakage loss in karst regions. Environ. Earth Sci. 2021, 80, 278. [Google Scholar] [CrossRef]
  15. Xiao, J.; Xiong, K. A review of agroforestry ecosystem services and its enlightenment on the ecosystem improvement of rocky desertification control. Sci. Total Environ. 2022, 852, 158538. [Google Scholar] [CrossRef]
  16. Bryan, B.A.; Gao, L.; Ye, Y.; Sun, X.; Connor, J.D.; Crossman, N.D.; Stafford-Smith, M.; Wu, J.; He, C.; Yu, D.; et al. China’s response to a national land-system sustainability emergency. Nature 2018, 559, 193–204. [Google Scholar] [CrossRef]
  17. Li, C.; Fu, B.; Wang, S.; Stringer, L.C.; Wang, Y.; Li, Z.; Liu, Y.; Zhou, W. Drivers and impacts of changes in China’s drylands. Nat. Rev. Earth Environ. 2021, 2, 858–873. [Google Scholar] [CrossRef]
  18. Tong, X.; Brandt, M.; Yue, Y.; Horion, A.S.; Wang, K.; Keersmaecker, W.D.; Tian, F.; Schurgers, G.; Xiao, X.; Luo, Y.; et al. Increased vegetation growth and carbon stock in China karst via ecological engineering. Nat. Sustain. 2018, 1, 44–50. [Google Scholar] [CrossRef]
  19. Zhao, M.; Zhang, J.; Velicogna, I.; Liang, C.; Li, Z. Ecological restoration impact on total terrestrial water storage. Nat. Sustain. 2021, 4, 56–62. [Google Scholar] [CrossRef]
  20. Pitty, A. Calcium Carbonate Content of Karst Water in relation to Flow-through Time. Nature 1968, 217, 939–940. [Google Scholar] [CrossRef]
  21. Jiang, Z.; Liu, H.; Wang, H.; Peng, J.; Meersmans, J.; Green, S.M.; Quine, T.A.; Wu, X.; Song, Z. Bedrock geochemistry influences vegetation growth by regulating the regolith water holding capacity. Nat. Commun. 2020, 11, 2392. [Google Scholar] [CrossRef]
  22. Leakey, R.R.B. A re-boot of tropical agriculture benefits food production, rural economies, health, social justice and the environment. Nat. Food 2020, 1, 260–265. [Google Scholar] [CrossRef]
  23. Grass, I.; Kubitza, C.; Krishna, V.V.; Corre, M.D.; Mußhoff, O.; Pütz, P.; Drescher, J.; Rembold, K.; Ariyanti, E.S.; Barnes, A.D.; et al. Trade-offs between multifunctionality and profit in tropical smallholder landscapes. Nat. Commun. 2020, 11, 1186. [Google Scholar] [CrossRef] [Green Version]
  24. Blaser, W.J.; Oppong, J.; Hart, S.P.; Landolt, J.; Yeboah, E.; Six, J. Climate-smart sustainable agriculture in low-to-intermediate shade agroforests. Nat. Sustain. 2018, 1, 234–239. [Google Scholar] [CrossRef]
  25. Syano, N.M.; Nyangito, M.M.; Wasonga, O.V.J.; Yeboah, L.E.; Six, J. Agroforestry practices and factors influencing their adoption by communities in the drylands of Eastern Kenya. Agroforest. Sys. 2022, 96, 1225–1235. [Google Scholar] [CrossRef]
  26. Doelman, J.C.; Stehfest, E. The risks of overstating the climate benefits of ecosystem restoration. Nature 2022, 609, E1–E3. [Google Scholar] [CrossRef]
  27. Wurz, A.; Tscharntke, T.; Martin, D.A.; Osen, K.; Rakotomalala, A.A.N.A.; Raveloaritiana, E.; Andrianisaina, F.; Dröge, S.; Fulgence, T.R. Win-win opportunities combining high yields with high multi-taxa biodiversity in tropical agroforestry. Nat. Commun. 2022, 13, 4127. [Google Scholar] [CrossRef]
  28. Zeppetello, L.R.V.; Cook-Patton, S.C.; Parsons, L.A.; Wolff, N.H.; Kroeger, T.; Battisti, D.S.; Bettles, J.; Spector, J.T.; Balakumar, A.; Masuda, Y.J. Consistent cooling benefits of silvopasture in the tropics. Nat. Commun. 2022, 13, 708. [Google Scholar] [CrossRef]
  29. Zhu, X.; Liu, W.; Chen, J.L.; Bruijnzeel, A.; Mao, Z.; Yang, X.; Cardinael, R.; Meng, F.R.; Sidle, R.; Seitz, S.; et al. Reductions in water, soil and nutrient losses and pesticide pollution in agroforestry practices: A review of evidence and processes. Plant Soil 2020, 453, 45–86. [Google Scholar] [CrossRef]
  30. Sari, R.R.; Rozendaal, D.M.A.; Saputra, D.D.; Hairiah, K.; Roshetko, J.M.; Noordwijk, M. Balancing litterfall and decomposition in cacao agroforestry systems. Plant Soil 2022, 473, 251–271. [Google Scholar] [CrossRef]
  31. Ling, Q.; Zhao, X.; Wu, P.; Gao, X.; Sun, W. Effect of the fodder species canola (Brassica napus L.) and daylily (Hemerocallis fulva L.) on soil physical properties and soil water content in a rainfed orchard on the semiarid Loess Plateau, China. Plant Soil 2020, 453, 209–228. [Google Scholar] [CrossRef]
  32. Hombegowda, H.C.; Köhler, M.; Röll, A.; Hölscher, D. Tree species and size influence soil water partitioning in coffee agroforestry. Agroforest. Syst. 2020, 94, 137–149. [Google Scholar] [CrossRef]
  33. Huo, G.; Zhao, X.; Gao, X.; Wang, S. Seasonal effects of intercropping on tree water use strategies in semiarid plantations: Evidence from natural and labelling stable isotopes. Plant Soil 2020, 453, 229–243. [Google Scholar] [CrossRef]
  34. Liu, H.; Tang, J.; Zhang, X.; Wang, R.; Zhu, B.; Li, N.; Liang, C.; Zhao, P. Seasonal variations of groundwater recharge in a small subtropical agroforestry watershed with horizontal sedimentary bedrock. J. Hydrol. 2021, 596, 125703. [Google Scholar] [CrossRef]
  35. Zhang, R.; Xu, X.; Liu, M.; Zhang, Y.; Xu, C.; Yi, R.; Luo, W. Comparing evapotranspiration characteristics and environmental controls for three agroforestry ecosystems in a subtropical humid karst area. J. Hydrol. 2018, 563, 1042–1050. [Google Scholar] [CrossRef]
  36. Villalobos, F.J.; Fereres, E. Evaporation Measurements beneath Corn, Cotton, and Sunflower Canopies. Agron. J. 1990, 82, 1153–1159. [Google Scholar] [CrossRef]
  37. Peng, J.; Li, G.; Wu, F. Analysis on the Changes of Utilizable Precipitation over Dongting Lake Region during the Past 100 Years. Ecol. Environ. Sci. 2017, 26, 104–110. (In Chinese) [Google Scholar] [CrossRef]
  38. Sun, Z.; Wang, S.; Liu, J.; Gu, J.; Gong, W. Driving Force Analysis of Runoff Attenuation in Tuwei River Basin. J. Nat. Resour. 2017, 32, 310–320. (In Chinese) [Google Scholar] [CrossRef]
  39. Wang, K.; Chen, H.; Zeng, F.; Yue, Y.; Zhang, W.; Fu, Z. Ecological Research Supports Eco-environmental Management and Poverty Alleviation in Karst Region of Southwest China. Bull. Chin. Acad. Sci. 2018, 33, 213–222. (In Chinese) [Google Scholar] [CrossRef]
  40. Zhang, C.; Di, Z.; Duan, Q.; Wei, G. Improved land evapotranspiration simulation of the community land model using a surrogate-based automatic parameter optimization method. Water 2020, 12, 943. [Google Scholar] [CrossRef] [Green Version]
  41. Liu, J.; Jia, B.; Xie, Z.; Shi, C. Ensemble Simulation of Land Evapotranspiration in China Based on a Multi-Forcing and Multi-Model Approach. Adv. Atmos. Sci. 2016, 33, 673–684. [Google Scholar] [CrossRef]
  42. He, G.; Zhao, Y.; Wang, J.; Gao, X.; He, F.; Li, H.; Zhai, J.; Wang, Q.; Zhu, Y. Attribution analysis based on Budyko hypothesis for land evapotranspiration change in the Loess Plateau, China. J. Arid Land 2019, 11, 939–953. [Google Scholar] [CrossRef] [Green Version]
  43. Lu, G.; Meng, P.; Ma, X. Study on the plant transpiration and system evapotranspiration within an agroforest system of forest belt-fruit tree crop. J. China Agric. Univ. 1996, 1, 103–109. (In Chinese) [Google Scholar]
  44. Shi, L.; Sheng, H.; Man, X.; Cai, T. A review of the calculation method of water consumption by tree transpiration in different scales. J. Nanjing For. Univ. (Nat. Sci. Ed.) 2016, 40, 149–156. (In Chinese) [Google Scholar] [CrossRef]
  45. Rong, R.; Sun, B.; Wu, Z.; Gao, Z.; Du, Z.; Teng, S. Study on above-ground biomass measurement of Caragana microphylla in shrub-encroached grassland. Acta Prataculturae Sin. 2023, 32, 36–47. (In Chinese) [Google Scholar] [CrossRef]
  46. Tong, C.; Zhang, L.; Wang, W.; Gauci, V.; Marrs, R.; Liu, B.; Jia, R.; Zeng, C. Contrasting nutrient stocks and litter decomposition in stands of native and invasive species in a sub-tropical estuarine marsh. Environ. Res. 2011, 111, 909–916. [Google Scholar] [CrossRef]
  47. Liu, B.G.; Tong, C.; Huang, J.F.; Tan, J.; Li, H. Estimation models of green and dead standing aboveground biomass of Cyperus malaccensis. Chin. J. Ecol. 2022, 41, 2163–2170. [Google Scholar] [CrossRef]
  48. Yang, C.; Yao, W.; Xiao, P.; Qin, D. Effects of vegetation cover structure on runoff and sediment yield and its regulation mechanism. J. Hydraul. Eng. 2019, 50, 1078–1085. (In Chinese) [Google Scholar] [CrossRef]
  49. Wu, Q. Occurrence and Transformation of ‘Five Water’ and High Efficient Utilization Model of Agroforestry in the Karst Rocky Desertification Environment; Guizhou Normal University: Guiyang, China, 2020. [Google Scholar]
  50. Chen, Y.; Wen, J.; Liu, R.; Lu, X.; Chen, Y. Study on the spatial-temporal distribution pattern of land surface evapotranspiration over the source region of the Yellow River. Plateau Mt. Meteorol. Res. 2021, 41, 35–42. [Google Scholar] [CrossRef]
  51. Yang, M.; Zhong, P.; Wang, M.; Shang, Y.; Cheng, C. Comparative study on the methods of estimating land surface evaporation in Dawenhe River basin. South North Water Transf. Water Sci. Technol. 2017, 15, 50–55. (In Chinese) [Google Scholar]
  52. Zhao, M.; Liu, Y.; Konings, A.G. Evapotranspiration frequently increases during droughts. Nat. Clim. Chang. 2022, 12, 1024–1030. [Google Scholar] [CrossRef]
  53. Pascolini-Campbell, M.; Reager, J.T.; Chandanpurkar, H.A.; Rodell, M. A 10 per cent increase in global land evapotranspiration from 2003 to 2019. Nature 2021, 593, 543–547. [Google Scholar] [CrossRef]
  54. Wu, Q.; Liang, H.; Xiong, K.; Li, R. Frontier theories and countermeasures for Integrated regulation of soil and water loss and mountainous agroforestry in rocky desertification environment. J. Soil Water Conserv. 2018, 32, 11. [Google Scholar] [CrossRef]
  55. Muthee, K.; Duguma, L.; Majale, C.; Mucheru-Muna, M.; Wainaina, P.; Minang, P. A quantitative appraisal of selected agroforestry studies in the Sub-Saharan Africa. Heliyon 2022, 8, e10670. [Google Scholar] [CrossRef]
  56. Sahin, H.; Anderson, S.H.; Udawatta, R.P. Water infiltration and soil water content in claypan soils influenced by agroforestry and grass buffers compared to row crop management. Agroforest. Syst. 2016, 90, 839–860. [Google Scholar] [CrossRef]
  57. Anderson, S.H.; Udawatta, R.P.; Seobi, T.; Garrett, H.E. Soil water content and infiltration in agroforestry buffer strips. Agroforest. Syst. 2009, 75, 5–16. [Google Scholar] [CrossRef]
  58. Narain, P.; Singh, R.K.; Sindhwal, N.S.; Joshie, P. Agroforestry for soil and water conservation in the western Himalayan Valley Region of India 1. Runoff, soil and nutrient losses. Agroforest. Syst. 1997, 39, 175–189. [Google Scholar] [CrossRef]
  59. Luo, D.; Xiong, K.; Wu, C.; Gu, X.; Wang, Z. Soil Moisture and Nutrient Changes of Agroforestry in Karst Plateau Mountain: A Monitoring Example. Agronomy 2023, 13, 94. [Google Scholar] [CrossRef]
  60. Chaki, A.K.; Gaydon, D.S.; Dalal, R.C.; Bellotti, W.D.; Gathala, M.K.; Hossain, A.; Menzies, N.W. Achieving the win–win: Targeted agronomy can increase both productivity and sustainability of the rice–wheat system. Agron. Sustain. Dev. 2022, 42, 113. [Google Scholar] [CrossRef]
  61. Manohar Reddy, R.; Ramkuma. Prospect and importance of green mulching on the soil status of tropical tasar plantation fields in India. Nat. Preced. 2011, 6388, 1–13. [Google Scholar] [CrossRef] [Green Version]
  62. Dong, B.; Liu, H.; Wang, Y.; Qiao, Y.; Zhang, M.; Yang, H.; Jin, L.; Liu, M. Physio-ecological regulating mechanisms for highly efficient water use of crops. Chin. J. Eco-Agric. 2018, 26, 1465–1475. (In Chinese) [Google Scholar] [CrossRef]
  63. Cui, Z.; Gao, Y.; Guo, L.; Wu, B.; Yan, B.; Wang, Y.; Liu, H.; Li, G.; Wang, Y.; Wang, H. Optimal Effects of Combined Application of Nitrate and Ammonium Nitrogen Fertilizers with a Ratio of 3:1 on Grain Yield and Water Use Efficiency of Maize Sowed in Ridge–Furrow Plastic Film Mulching in Northwest China. Agronomy 2022, 12, 2943. [Google Scholar] [CrossRef]
  64. Fang, Q.; Chen, Y.; Li, Q.; Yu, S.; Luo, Y.; Yu, Q.; Ou, Y. Effect of irrigation on water use efficiency of winter wheat. Trans. Chin. Soc. Agric. Eng. 2004, 20, 34–39. (In Chinese) [Google Scholar]
  65. Wang, Y.; Dong, B.; Qiao, Y.; Yang, H.; Jin, L.; Liu, J.; Liu, M. Experimental study on soil water threshold of luxury transpiration in winter wheat leaves during flowering and filling stage. Chin. J. Eco-Agric. 2019, 27, 1024–1032. [Google Scholar] [CrossRef]
Figure 1. Topographic map of the study area.
Forests 14 00453 g001
Figure 2. Soil water content under each treatment.
Forests 14 00453 g002aForests 14 00453 g002b
Figure 3. Plant water transpiration and vegetation interception under different measures.
Forests 14 00453 g003
Figure 4. Water-holding capacity and soil moisture content under various agronomic measures.
Forests 14 00453 g004
Figure 5. Transpiration and water use efficiency of crops under different planting models.
Forests 14 00453 g005
Table 1. Basic information of the sample plot in the study area.
Study AreaLand-Use Type (Model)Agronomic MeasureSoil TypeSlope (°)Plot Area (m2)Vegetation Coverage (%)Row Space (m)Planting Crops
BijieASWRYellow-brown earth4 m × 5 m95Rosa roxburghii: 2 m × 2 m,
Ryegrass:
sown
Rosa roxburghii: 6 years
Ryegrass: planted in March 2019
STRYellow-brown earth4 m × 5 m87
WRAYellow-brown earth4 m × 5 m85
CONYellow-brown earth4 m × 5 m85
BSWRYellow-brown earth4 m × 5 m81Walnut:
4 m × 4 m
Potato:
0.25 m × 0.6 m
Walnut: 6 years Potato: planted in December 2018
STRYellow-brown earth4 m × 5 m79
WRAYellow-brown earth4 m × 5 m80
CONYellow-brown earth4 m × 5 m85
HuajiangCSWRYellow earth4 m × 5 m96Zanthoxylum planispinum var. Dintanensis: 4 m × 4 m
Pitaya:
2 m × 2 m
Zanthoxylum planispinum var. Dintanensis: 6 years
Pitaya: 6 years
STRYellow earth4 m × 5 m96
WRAYellow earth4 m × 5 m87
CONYellow earth4 m × 5 m86
DSWRYellow earth4 m × 5 m86Zanthoxylum planispinum var. Dintanensis: 4 m × 4 m
Chili: 0.4 m × 0.6 m
Zanthoxylum planispinum var. Dintanensis: 6 years
Chili: planted in March 2018
STRYellow earth4 m × 5 m87
WRAYellow earth4 m × 5 m82
CONYellow earth4 m × 5 m87
ShibingESWRYellow earth4 m × 5 m75Osmanthus fragans: 4 m × 4 m
Pseudostellariae Radixo: sown between ridges with an inter-row space of 0.2 m
Osmanthus fragrans: 6 years
Pseudostellariae Radixo: planted in December 2018
STRYellow earth4 m × 5 m73
WRAYellow earth4 m × 5 m74
CONYellow earth4 m × 5 m65
FSWRYellow earth4 m × 5 m75Pseudostellariae Radixo: sown between ridges with an inter-row space of 0.2 mPseudostellariae Radixo: planted in December 2018
STRYellow earth4 m × 5 m71
WRAYellow earth4 m × 5 m74
CONYellow earths4 m × 5 m62
Table 2. Precipitation, available precipitation and LET distribution in study areas.
MonthsPrecipitation (mm)Available Precipitation (mm)LET (mm)
BijieHuajian ShibingBijieHuajiangShibingBijieHuajiangShibing
Apr.88.0033.50112.8028.410.6652.2459.5932.8460.56
May107.0031.20171.6039.390.55107.5667.6130.6564.04
Jun.196.60253.00243.80125.27127.93157.9971.33125.0785.81
Jul.304.00156.60216.60243.7344.13119.0160.27112.4797.59
Aug.286.0075.60258.20200.675.51154.6785.3370.09103.53
Total981.60549.901003.00637.47178.78591.47344.13371.12411.53
Table 3. Storage and transformation of water resources.
PlantMeasurePrecipitation (mm)Available Precipitation (mm)Soil Water Storage (mm)Underground Water (mm)Transpiration (mm)Vegetation Interception (mm)Soil Evaporation (mm)
ASWR981.6432.63412.95517.75383.250.9114.87
STR981.6449.58663.09273.09341.3445.43145.25
WRA981.6467.58866.3371.64333.1443.62137.26
CON981.6471.34823.73115.11322.2642.75145.25
BSWR981.6423.74493.78441.29325.2146.53186.12
STR981.6415.52677.3258.13319.2346.17200.68
WRA981.6426.43798.99137.45311.3245.16198.69
CON981.6417.05845.9492.37299.7343.3221.52
CSWR549.9306.75425.835544.8869.08129.19
STR549.9285.47433.2450.8544.1965.81154.43
WRA549.9305.91462.5721.5643.3265.78134.89
CON549.9264.78419.964.9443.365.06176.76
DSWR549.9231.27512.637.18185.8130.09102.73
STR549.9214.02514.45.46184.0230.04121.82
WRA549.9225.06503.9317.01177.1828.96118.7
CON549.9211.24503.1619170.2327.74140.69
ESWR1003660.1706.69271.8489.8524.47228.58
STR1003585.42798.18182.283.7922.62311.17
WRA1003605.85775.45204.4386.7223.13287.3
CON1003506.52799.49182.3578.8221.16396.5
FSWR1003627.82586.51396.3382.2820.16272.74
STR1003543.51677.45305.0783.6620.49355.34
WRA1003568.13858.7123.9883.0620.31331.5
CON1003462.16850.34132.9980.4719.67440.7
Disclaimer/Publisher’s Note: The statements, opinions and data contained in all publications are solely those of the individual author(s) and contributor(s) and not of MDPI and/or the editor(s). MDPI and/or the editor(s) disclaim responsibility for any injury to people or property resulting from any ideas, methods, instructions or products referred to in the content.

