Article

Infestation Phases and Impacts of Dryocoetes confusus in Subalpine Fir Forests of Southern British Columbia

by
Lorraine E. Maclauchlan
1,*,
Arthur J. Stock
2 and
Julie E. Brooks
3
1
B.C. Ministry of Forests, 441 Columbia Street, Kamloops, BC V2C 2T3, Canada
2
Independent Researcher, 515 Fourth Street, Nelson, BC V1L 2S4, Canada
3
Independent Researcher, 466 Central Avenue, Gibsons, BC V0N 1V1, Canada
*
Author to whom correspondence should be addressed.
Forests 2023, 14(2), 363; https://doi.org/10.3390/f14020363
Submission received: 31 December 2022 / Revised: 3 February 2023 / Accepted: 10 February 2023 / Published: 11 February 2023
(This article belongs to the Special Issue Forest Health: Forest Insect Population Dynamics)

Abstract

:
Subalpine fir mortality and stand decline are increasingly evident in British Columbia (B.C.). This long-term study confirmed Dryocoetes confusus to be the major disturbance agent in high-elevation subalpine forests, killing over two-thirds of subalpine fir in eleven one-hectare study plots. D. confusus infestations in mature stands can be described as early-, mid-, or late-phase. The transition from the early- through late-phase is characterized by a lowered stem density as high levels of D. confusus attack and remove the largest trees, while other mortality factors kill smaller trees. Initially, live subalpine fir density and D. confusus activity varied among plots. By a final assessment, very little difference was observed in live stems per hectare. Mortality from all factors ranged from 0.5% to 5% annually, reaching as high as 80% in-stand mortality with >6 times more dead than live volume. When subalpine fir density was reduced to <400 sph, the D. confusus attack rate declined. Cumulative mortality increased the average gap size in plots from 11 m2 to 18 m2. Our study also showed that D. confusus might be able to switch to a univoltine life cycle, taking advantage of warmer and longer growing seasons that, in part, could explain the rapid increase in mortality in stands.

1. Introduction

Subalpine fir, Abies lasiocarpa (Hook.) Nutt. (Pinales: Pinaceae), mortality has been increasing in British Columbia (B.C.) and throughout the Pacific Northwest in recent decades [1,2,3,4,5]. This continuous and increased mortality is sometimes referred to as subalpine fir decline [3,4,5] and was defined by Sinclair and Hudler [6] as a premature progressive loss of vigor and health due to both biotic and abiotic influences. The primary cause of subalpine fir decline is the western balsam bark beetle, Dryocoetes confusus Swaine (Coleoptera: Curculionidae: Scolytinae), which is considered the most destructive insect pest of subalpine fir in western North America [1,4,7,8,9,10,11]. Compared to other native tree-killing bark beetle species, such as the mountain pine beetle, Dendroctonus ponderosae Hopkins (Coleoptera: Curculionidae: Scolytinae) (MPB), D. confusus has not been exhaustively studied. This is largely because subalpine fir (often referred to as “balsam”) is not a species of high commercial importance in the United States [12], while in B.C. it has typically comprised an average of 9% of the total volume harvested annually since 2000 (R. Midgley, pers. comm.). However, as the salvage of MPB-killed pine from the 2000–2015 MPB outbreak concludes, harvest activity in B.C. is increasingly targeting non-pine forests, and there is a renewed interest and focus on the health and sustainability of subalpine fir forests [13]. During the height of MPB salvage harvesting in the B.C. southern interior, “balsam” made up only 6% of the total volume (m3) harvested compared to over 13% of the total volume (m3) harvested between 2015 and 2022 (R. Midgley, pers. comm.). By contrast, in northern B.C., the volume of “balsam” harvested between 2016 and 2022 ranged from 12% to 24% (avg. = 18.6%) of the total volume harvested (R. Midgley, pers. comm.). Until recently [1,2,3,4,5], there have been few studies that have quantified complex disturbance dynamics and impacts, such as those caused by D. confusus and other damage agents that are accelerating the decline of these sensitive and previously remote subalpine fir forests.
Subalpine fir ecosystems are extremely valuable due to their inherent hydrologic contribution [14], carbon sequestration [15,16], recreation opportunities, and habitat attributes. This species grows well at high elevations, from 600 to 2250 meters, throughout most of the B.C. interior [17,18,19]. In the mountains and plateaus of interior B.C., subalpine fir is often associated with interior spruce, Picea engelmannii x glauca Parry ex Engelm. (Pinales: Pinaceae) and is a significant component of the interior high-elevation forests from the Yukon Territory to Arizona. Cool summers, cold winters, and a deep snowpack are important in determining where subalpine fir will grow well [19]. Both spruce and subalpine fir are shade tolerant and able to persist in the understory of mature stands, taking advantage when disturbances create small gaps in the canopy [20]. This study was conducted in southern B.C., in the Engelmann spruce—subalpine fir biogeoclimatic zone (ESSF), where subalpine fir is most common, often in mixtures with spruce and smaller components of other tree species [17,21,22].
Canada is experiencing climate change at nearly twice the rate of the world’s average (Climate change adaptation in Canada (nrcan.gc.ca)) (accessed on 1 December 2022), with drought and heat-induced tree mortality accelerating in many forest ecosystems globally. It is well documented that temperatures at high elevations and in the northern hemisphere have risen faster than the global average [23,24,25]. Subalpine fir has a low tolerance to change, or extremes, in the summer heat and drought [26,27] and has consequently suffered increased climate-induced stress over the past few decades, with severe implications for tree health, resilience, and insect outbreaks. The radial growth of subalpine fir is declining and increasingly influenced by summer conditions in the previous year before growth, indicating shifting adaptive responses to higher summer temperatures and moisture deficits in B.C. over the past eight decades [27]. Dryocoetes confusus is likely adapting to this declining growth and increased susceptibility in trees [10], coupled with more favorable summer temperatures for flight and reproduction. The result is that subalpine fir mortality in recent decades has far exceeded the expected rate of natural mortality [2]. Increasing drought events are believed to be one of the underlying causes of forest mortality and decline in western North America, altering forest structure, composition, ecosystem function, and overall forest health [15,27,28,29].
Biotic and abiotic disturbances are the main drivers of natural forest succession, yet some, such as bark beetles [16,30], can cause excessive damage, even though they are integral to healthy and functioning ecosystems [31]. Bark beetle outbreaks can have long-lasting impacts on forest ecosystems, ranging from decreased biodiversity to a reduction in carbon storage or the disruption of timber supply, which can have cascading effects on regional and global economies [32]. British Columbia has experienced extensive, catastrophic escalations in tree mortality from bark beetles, most notably from the 2000–2015 MPB event that significantly altered forest landscapes [33,34,35,36,37,38]. Massive abiotic disturbances have also affected B.C., including drought and heat events in 1998 and 2017, which affected more than 10,035 and 119,000 hectares, respectively [39,40], and large wildfires, notably in 2017, 2018, and 2021 (Wildfire Averages—Province of British Columbia (gov.bc.ca)) (accessed on 1 December 2022) which impacted over 1.3 million hectares of forest.
Dryocoetes confusus causes significant cumulative mortality [2] over vast areas of high elevation and northern forests [4,5,7,8,9,11] with continuous pulses of low-level, spatially aggregated attack. This bark beetle becomes noticeable in stands aged 100 years or older [2] and presumably attacks younger trees that are susceptible. As stands age and grow, the clumped pattern of attack creates small-scale gaps, lowers the overall stand density, and can allow the release of understory seedlings [41]). Dryocoetes confusus attacks the largest diameter standing live trees in a stand, although the mean diameter of the trees attacked can vary widely among stands [10]. Recent windthrow can also be colonized, but this is a relatively rare resource for the beetle, and development seems to be more prolonged in downed trees compared to standing trees [42,43]. The relative scarcity of fresh windthrow as a host has most likely shaped the evolution of the beetles’ highly selective process of finding and colonizing live but slower growing [10,43] and often severely stressed host trees.
Dryocoetes confusus typically displays a two-year life cycle with new adults emerging from the trees in late June through July [12,42,44,45] and again later in the season from August to September, when a much smaller, secondary flight comprised these same parent beetles can occur [12,42,46,47,48,49]. Dryocoetes confusus is closely associated with the pathogenic fungus Grosmannia dryocoetidis (Ophiostomatales: Ophiostomataceae) [50], which is transmitted to the colonized trees, and this beetle–fungus complex can overcome the tree’s defenses. Adult beetles are active under the bark while snow remains on the ground, often weeks before subcortical temperatures trigger emergence and flight [42]. This initial attack on the trees, and the early season extension of galleries by overwintered females under the bark, produces frass and fine sawdust on tree boles outside entrance holes. The presence of long resin streams on the bole, without the presence of frass, indicates an unsuccessful attack by the beetle. The brood overwinters, once as larvae and again as new adults, before emerging in the third summer to repeat the cycle. Females sometimes lay two broods within the same host over a period of two summers. Dryocoetes confusus preferentially attack the slower-growing trees in a forest stand [10], likely due to reduced primary defenses [51] in these trees. As many subalpine fir forests experience further protracted periods of warm weather in spring and summer, D. confusus could potentially shorten its life history to one year, similar to that observed with the spruce beetle, Dendroctonus rufipennis Kirby (Coleoptera: Curculionidae: Scolytinae) [52,53,54].
Dryocoetes confusus likely plays a critical role in forest succession. Infestations show a degree of aggregation [5,41,55,56], which could depend on the occurrence pattern of susceptible trees in stands [10,57]. The distribution of susceptible hosts may affect natural regeneration and potential stand management strategies, such as salvage harvesting. Disturbance factors create growing spaces that are gradually re-occupied by regeneration. Historically, this continual production and occupancy of small gaps have been a slow process, fundamental in self-perpetuating climax old-growth forests where the general overstory canopy remains. With increasing biotic and abiotic stress being placed on these stands, this slow successional process may be changing and accelerating the impacts on forest values, stand productivity, and in-stand mortality.
This long-term study aims to describe and quantify the factors that drive subalpine fir mortality and the role of D. confusus in natural succession and in shaping mature subalpine fir forests in southern B.C. We wanted to test whether our initial designation of stands into an “outbreak phase” of D. confusus was reasonable. Knowing the attributes reflected in an early-, mid-, or late-phase stand could enable managers to have greater insight into future stand conditions with potential management options. We established one-hectare permanent sample plots in ESSF stands to study the attack progress and patterns of D. confusus and its influence on the mortality of subalpine fir and stand succession by elucidating:
  • Stand and tree attributes of early-, mid-, and late-phase stands impacted by D. confusus;
  • The progression of D. confusus attack and subalpine fir mortality in stands;
  • The spatial-temporal distribution of live subalpine fir, other tree species, and D. confusus attacked subalpine fir.
This long-term, multi-faceted study will provide a better understanding of how mortality from D. confusus and other factors shape subalpine fir forests. This study is unique in that it follows individual trees from their death (attack) to down and monitors insect development within the trees. It also elucidates the spatial parameters that result from a long-term disturbance in subalpine fir forests. Results from this study may provide a pathway to address future the management of these valuable but delicate ecosystems.

2. Methods

2.1. Plot Selection and Establishment

Eleven one-hectare permanent plots were established in southern B.C. (Table 1, Figure 1) from 1998 to 2012. Location selection was based on the following:
  • Dryocoetes confusus activity as mapped in a 1996, 1997, 1998, and 2011 aerial overview survey (AOS) data (Aerial Overview Survey Data Files—Province of British Columbia (gov.bc.ca); Aerial overview survey summary reports—Province of British Columbia (gov.bc.ca)) (accessed on 1 December 2022);
  • 70 mm photography of potential stands, carried out in 1997;
  • Ground confirmation of D. confusus occurrence;
  • The availability of ground access;
  • Undisturbed stands with no plans for imminent harvest;
  • A final rotary-wing reconnaissance flight to evaluate stand suitability.
All the plots were established in subalpine fir leading stands (>50% subalpine fir) in three ESSF subzones (Lloyd et al., 1990) (Table 1):
  • Six plots in the ESSFwc. The ESSFwc (wet, cold) rarely shows moisture deficits due to late snowmelt and frequent summer storms;
  • Three plots in the ESSFxc. The ESSFxc (very dry, cold) is the driest and highest-elevation forested ESSF subzone in the southern interior. Snowpack rarely exceeds 80–100 cm, and frost can occur throughout the summer;
  • Two plots in the ESSFmw. The ESSFmw (moist, warm) is the warmest ESSF subzone in the southern interior of British Columbia. The temperature regime is moderated by its proximity to the Pacific Ocean. This contributes to substantial winter precipitation and deep snowpack.
Selected stands were designated at the time of establishment as early-, mid-, or late-phases in the successional stand dynamics of subalpine fir-dominated forests and D. confusus (Table 1), as follows:
  • Early-phase: new or building populations of D. confusus, characterized by scattered trees with bright red foliage (recent attack) and a low number of dead grey trees or old snags. The stands are typically of a higher density, with a closed canopy and minimal evidence of windthrow;
  • Mid-phase: characterized by moderate to high levels of trees with bright red foliage (recent attack) and moderate levels of grey trees and snags;
  • Late-phase: characterized by a few recent attacks (trees with bright red foliage) and high numbers of grey trees and snags. Stands typically have lower-density open canopies, with evidence of windthrow or fall-down.
Square plots were established on a 100 m (m) north-axis and a 100 m west-axis. Global positioning system (GPS) coordinates were recorded at the northwest corner of each plot. All standing trees ≥1.3 m in height and ≥12.5 cm in diameter at breast height (dbh) were tagged with unique numbers and stem-mapped by establishing 20 m wide strips perpendicular to the plot baseline (x-axis) running north–south (y-axis). The distance from the x-axis was measured with an Eslon® fiberglass measuring tape. When perpendicular to a tree, the distance from the strip line was measured using a laser hypsometer, thus providing x- and y-axis coordinates for each tree. As each strip was completed, the x-axis measurements were corrected based on the distance of the strip line along the x-axis.

2.2. Tree Assessment

The condition and foliar color of tagged trees were described using seven numeric codes (Table 2). Tree codes from 1 to 6 were used for trees attacked by D. confusus, and code 7 was applied to trees killed by other agents (biotic or abiotic) or when the cause of death could not be determined. Trees that fell (e.g., windblown) post-establishment and were previously attacked by D. confusus were assigned tree code 10, and those not attacked by D. confusus were assigned tree code 11. For some statistical analyses and data summaries, the trees that were assigned codes 1–3 and 4–6 were grouped, reflecting recent or older attacks by D. confusus. Tree species, dbh (cm), status (live/dead), damage agents, or mortality causal agents, if any, were recorded for each tagged tree.
A randomly selected sub-sample of live trees was measured for their height and cored to determine their age. For data summaries in this report, all ages were corrected to reflect the tree age in 2020.
Periodic post-establishment assessments were conducted to monitor new insect infestations, changes in foliage and tree conditions, new windthrow, and life-stage development following D. confusus attacks. Ten plots were established from 1998 to 2002, and the Raft River plot was established in 2012 (Table 1). Therefore, the total number of subsequent stand assessments varied among plots. The first 6 plots that were established were re-assessed annually from their time of establishment until 2004, which provided 6 consecutive years of data for the Cherry Creek, Sicamous Creek, and Torrent Creek plots and 5 consecutive years of data for the Buck Mountain, Home Lake-1, and Home Lake-2 plots (Table 1). The final plot assessments were conducted in 2019–2020, except for the Home Lake-1 plot, which was completely harvested shortly after the 2013 assessment. The Martin Creek and Home Lake-2 plots were partially harvested, with 12% and 75% of trees harvested, respectively, prior to the 2019–2020 assessment. Therefore, the data calculations for the Martin Creek plot final assessment time were adjusted to reflect the decrease in the total number of trees per plot, while 2013 was used as the final assessment year for the Home Lake-2 plot. Some summaries and statistical analyses used the 2013 assessment data as the final assessment time for all the plots so that every plot could be included. Each table, figure, or analysis in the Results section is clearly marked as to which year was used as the final assessment time.
Trees that had evidence of current, old, or unsuccessful D. confusus attacks were examined under the bark to identify and verify diagnostic galleries of D. confusus and the life stages present. The life stages or signs present (nuptial chambers, larval galleries, exit holes) were described as new attack with eggs; small larvae (instars 1–2); large larvae (instars 3–4); pupae; new adults; or emergence holes (most beetles emerged). D. confusus galleries were described as having a full gallery system (nuptial chamber with numerous parent galleries), a nuptial chamber only, or a nuptial chamber with few or short parent galleries. The presence of secondary insects, such as Pissodes striatulus (Fabricius) (Coleoptera: Curculionidae), Pityokteines minutus (Swaine) (Coleoptera: Curculionidae: Scolytinae), and others [58] was also recorded. The number of years with life stages present in attacked trees was summarized using data collected from 2000 to 2004. Only trees that had a clear start date (initial attack year known) and the presence of new adults or emergence holes were used.

2.3. Volume Estimation

The volume of live, dead (killed by D. confusus and other causes), and down trees was calculated to determine volume losses within the 11 plots. Height-diameter equations were fit for subalpine fir and interior spruce using a modification of the Chapman-Richards growth function [59]:
H e i g h t = b 0 ( 1 e x p ( b 1 D B H ) ) b 2
where:
  • Height is tree height (m),
  • DBH is tree diameter at breast height (cm),
  • b0, b1, and b2 are regression coefficients,
  • e is the base of the natural logarithm (2.71828) or Euler’s number.
The R NLS function was used for equation fitting [60]. Heights were predicted for western redcedar, Thuja plicata Donn ex D. Don (Cupressales: Cupressaceae) and amabilis fir, Abies amabilis (Dougl.) Forbes (Pinales: Pinaceae) using the subalpine fir equation, while the interior spruce equation was used to predict heights for western hemlock, Tsuga heterophylla (Raf.) Sarg. (Pinales: Pinaceae) lodgepole pine, Pinus contorta var. latifolia Engelm. (Pinales: Pinaceae), and whitebark pine, Pinus albicaulis Engelm. (Pinales: Pinaceae).
Individual tree merchantable volumes were determined with the 2002 BEC-based Kozak taper function [61]. Merchantable volume used a 30-centimetre (cm) stump height and a minimum top diameter of 10 cm. Volume data were summarized and grouped to represent the remaining live volume in plots and volume killed by D. confusus and other damage agents.

2.4. Statistical Analysis

Summary and descriptive statistics of the tree and stand data, e.g., the basal area and dbh, were generated using Systat® 7.0 [62], various R packages [60], and Microsoft Excel.
The Kruskal–Wallis test was used to compare dbh between tree codes. The Wilcoxon Pairwise Rank Sum test for multiple comparisons was used to look for significant differences between the dbh x tree code. The paired samples Wilcoxon signed-rank test (a non-parametric alternative to a paired t-test) was used to compare dbh between times because Time 1 (plot establishment) and Time 2 (final assessment) dbh data sets do not have an equal n [63]. A t-test was used to compare changes in the volume of live green trees from the time of the first dbh measurement to the most recent measurement.
Non-parametric procedures were used where data indicated non-normal distributions or heterogeneous variance, and the data remained intransigent to commonly used transformations.

2.5. Temporal Patterns of Change in Stands

Temporal patterns of changes in D. confusus activity within the stands were described using an analysis of variance (ANOVA) for rates of tree condition change from green-crown new attack to snags. The percentage of available trees (healthy and >12.5 cm dbh) attacked each year was calculated for the six plots with at least six years of records. The arcsine-square root transformed annual percentage of available trees attacked was assessed using ANOVA [62,63].

2.6. Spatial Analyses

We used Voronoi tiles, empty space analysis, and cluster analysis to look at trends in spatial patterns and to provide some aspects of “reference conditions” [64,65] as they existed in the sample plots, which were “undisturbed” by known activities such as road building, harvesting, or fire within the last 100 years.
The R package Deldir [66] was used to construct Voronoi tiles for live trees (tree code 0) in each plot and estimate the area that was potentially available (APA) to these trees [67,68]. The Deldir function “lawSummary” [66] was used to develop a “reduced sample buffer” to mitigate the influence of trees outside the plot. The lawSummary function stripped away tiles in layers, as follows: layer 1 consisted of “boundary” tiles which had at least one vertex on the enclosing plot boundary layer 2 consisted of tiles, which were neighbors of tiles in layer 1, and layer 3 consisted of tiles, which were neighbors of tiles in layer 2. A 2-sample t-test with equal variances, p < 0.05, was used on log10 transformed data to compare the area potentially available (APA) per tree at the time of plot establishment to the APA per tree at the most recent subsequent plot assessment when all the plots were assessed (2013).
As Churchill et al. [65] noted, open space in forest canopies is difficult to quantify because it seldom occurs in clearly definable gaps. They considered that openings are a matrix in which individual trees or clumps of trees occur. We used the empty space distance function “distmap” in the R package spatstat [60,69] to derive the “empty space distance” in each plot. The function measures “point-to-nearest-event” distances: essentially a measure of the percentage of each plot that is greater than a specified radius from a tree or gap edge [65,70], in this case, from a pixel grid-overlay to a tree in the plot. We set the spatstat pixel grid of k × k =100 × 100 (ny, nx) for a unit square; therefore, the x and y steps were 1.00 m. Diggle [70] noted that for k x k grids, k needs to be “reasonably large”. There is no good statistical reason to limit the choice of k, and when k is reasonably large, changes in the k density do not, apparently, substantially change the results [70,71]. The “empty space distances” were calculated for tree code = 0 (live trees, all species). The resulting distances were sorted into bins in 2 m groupings arbitrarily set at 1, 3, 5, 7, 9, 11, and 15 m. Bins were open on the left side, i.e., bin (3, 5) represents a “point-to nearest tree distance” >3 m and ≤5 m. Time 1 was at plot establishment, and Time 2 was at the 2013 assessment.
A cluster analysis was used to examine the inter-tree distance elements of the stand structure [71,72,73,74]. Larson and Churchill [75] defined tree clumps as groups of trees with adjacent or interlocking crowns. This analysis considers that two trees were included in a cluster if their stems were within distance d of each other, and when d = 0, each point was in its own distinct cluster. The clusters expanded as d increased, and at any given value of d, the points were apportioned into a set of unique numerous “small” clusters until d became larger than the maximal pairwise distance, all trees were pairwise connected, and there was only one cluster. This critical inter-tree value of d was evident as a sharp transition, the “percolation threshold” [72]. Cluster characteristics of stands (percolation threshold and distribution of clump sizes over distance) were dependent on stems per hectare and the inter-tree distance scale, and as the number of trees reduced, the transition became more gradual [71,72,73,76]. The R-source code [60,73] was used for the cluster analysis. Distance measurements were from stem center to stem center, and no edge correction was employed [64,65,71,72]. The cluster analysis was for all standing trees (codes 0–7) at Time 2. The algorithm’s maximum scale was set to 10 m, and the measurement interval (d) was set at one meter to allow the definition of the critical inter-tree distance.

3. Results

3.1. Infestation Progress

All 11 plots were assessed in 2013. Prior to the 2019–2020 final assessment, Home Lake-1 was completely harvested, and 12% of the Martin Creek and 75% of the Home Lake-2 plots were harvested. Therefore, only eight plots were completely assessed in 2019–2020, plus the unlogged portion of the Martin Creek plot. Home Lake-2 was also assessed at this time (2020); however, there were not enough intact trees within the plot boundaries, and thus, the 2013 assessment for this plot is considered the final. Each plot was assessed between two (Raft River) and 10 times (Sicamous Creek, Torrent Creek, Cherry Creek) throughout the study period (Table 1). The progression and level of D. confusus-caused mortality in a stand was assigned an infestation phase when the sites were initially selected for plot establishment. This was challenging due to the variable stand conditions encountered among sites, such as the density, BEC, tree attributes, and mortality due to D. confusus and other causes. Therefore, two additional categories were added, and stands were categorized as early-phase (2 plots), early to mid-phase (2 plots), mid-phase (3 plots), mid-to late phase (2 plots), and late phase (2 plots) (Table 1). After the final assessment, these categories were re-evaluated using multiple parameters for each plot.
The average age (± S.E.) of subalpine fir in the 11 plots ranged from 89 ± 3 to 184 ± 5 (Avg. ± S.E.) years in the Martin Creek (early phase) and Spius Creek-1 (mid-phase) plots, respectively (Table 3). The tree ages varied widely, ranging from 67 to 284 years among subalpine fir and from 71 to 410 years among interior spruce, with spruce close in age to subalpine fir in five of the eight plots containing spruce, and older than the subalpine fir in three plots.
Of the 5451 live subalpine firs in the 11 plots at the establishment, only 2461 were live at the final assessment (54.9% mortality). At the establishment, there were 8714 live and dead subalpine fir combined in the 11 plots, ranging from 425 (Cherry Creek) to 1215 (Buck Mountain) subalpine fir stems per hectare (Table 3). At the establishment (Time 1), the percentage of dead subalpine fir per plot ranged from 16.9% in Spius Creek-2 (early phase) to 58.6% in Cherry Creek (late phase). By the final assessment (Time 2), subalpine fir mortality ranged from 40.4% in Spius Creek-2 to 80.2% in Scotch Creek (mid-to-late phase). There was a moderate effect (R2 = 0.67) of the percent of subalpine fir dead (all causes) and infestation phase at the establishment, but no effect was evident by the final assessment (R2 = 0.03). The largest increases in overall mortality occurred in the Raft River, Martin Creek, Home Lake-1, and Buck Mountain plots that were designated an early to mid-phase in the infestation cycle at the establishment (Table 1 and Table 3). However, by Time 2 (Table 3), both Home Lake plots had a similar in-stand mortality of 79%. The lowest overall increases in subalpine fir mortality from all causes were observed in the Torrent Creek, Cherry Creek, and Spius Creek-1 plots, which were designated a mid- to late-phase in the infestation cycle at the establishment (Table 1 and Table 3). Spruce was a minor component in eight of the 11 plots, totaling 1620 trees (15% of stems). At the establishment, 9% of the standing spruce was dead; by the final assessment, 27% was dead. The most common mortality factors of spruce were the spruce beetle, Dendroctonus rufipennis (Kirby), Armillaria root disease, Armillaria ostoyae (Romagn.) Herink (syn. A. solidipes Peck) (Agaricales: Physalacriaceae) and Tomentosus root disease (Onnia tomentosa (Fr.) P. Karst) (Hymenochaetales: Hymenochaetaceae).
Dryocoetes confusus was the predominant mortality factor in all plots, causing over 42% of the total tree mortality by Time 2, with other disturbances causing an additional 17% subalpine fir mortality, and only a third of subalpine fir was still alive. At plot establishment, mortality from D. confusus ranged from 11.5% in Spius Creek-2 (early phase) to 50% in Cherry Creek (late phase) (Table 4). The four plots with the lowest mortality from D. confusus at the establishment ranged from 11.5% to 14.5% and were designated as early or early to mid-phase (Raft River, Martin Creek, Buck Mountain, Spius Creek-2) (Table 4). By the final assessment, D. confusus-caused mortality ranged from 27.6% to 54.3%, with the highest levels seen in three late or mid-phase plots, at over 50% (Sicamous Creek, Cherry Creek, Home Lake-1). Four plots (Scotch Creek, Sicamous Creek, Torrent Creek, Cherry Creek) that were initially categorized as late- or mid- to late phase had an additional D. confusus attack of less than 20% between the initial and final assessments. However, other than the Torrent Creek plot, these plots saw that from 42% to over 50% D. confusus caused mortality by the final assessment. The two Spius Creek plots also had fewer than 20% additional D. confusus-caused mortality by the final assessment. However, they had fewer overall attacks than the other plots. Other plots experienced higher levels of attack over the duration of the study, as demonstrated by the annual rate of D. confusus-caused mortality (Table 4). Four of the early to mid-phase plots (Raft River, Martin Creek, Home Lake-1, and 2) had annual attack rates from 1.5% to 3.5% (Table 4).
The most common damage agents affecting subalpine fir other than D. confusus were:
  • Broken tops, affecting about 10% of subalpine fir;
  • Two-year cycle budworm, Choristoneura biennis Freeman (Lepidoptera: Tortricidae), which, in some years, damaged most of the subalpine fir and spruce in a plot;
  • Balsam bark weevil, P. striatulus, which affected about 2.6% of subalpine fir;
  • Low levels of various secondary bark beetles;
  • Pineus abietinus Underwood & Balch (Hemiptera; Adelgidae);
  • Decay and rot (including Armillaria root disease);
  • Windthrow, forking, and damage from other environmental factors, including frost, snow, ice, and lightning;
  • Mechanical scarring from other trees;
  • Localized animal damage caused by rodents feeding at the base of trees or scarring from bears.
P. striatulus was found in all plots, with the most infested trees found in the Buck Mountain (early-to-mid-phase) and Martin Creek (early-phase) plots, with 47 and 64 subalpine firs infested, respectively. Evidence of P. striatulus was found less frequently in plots designated as late or a mid-to-late phase in the infestation cycle, likely because the trees had been dead longer and the diagnostic galleries left by the weevil had been obscured [77] by woodborer activity and decay.
Figure 2 shows the percent of subalpine fir killed by D. confusus that fell (windthrow) or was still standing in each plot over the duration of the study. By the final assessment, there was a decline in the number of live trees in all plots, but the most dramatic declines were observed in some of the plots in the ESSFwc and ESSFxc. Most plots were static or saw a slight increase in D. confusus attacks from the early 2000s to 2013, and a noticeable decline from 2013 to 2019–2020, the exception being the Raft River and Martin Creek plots (both in the ESSFwc) that are geographically close (Figure 1) and were categorized as early an outbreak phase. Both plots were situated in the Thompson Rivers District, where there was an ongoing D. confusus population pulse at this time (Figure 3).
Figure 3 shows the number of hectares of current D. confusus (tree code 2) attacks recorded in the AOS [78] from 1998 to 2021 in the three Forest Districts where the plots were located. The trajectory of the outbreak captured by the AOS in the three districts mirrors that observed in most plots. There were two outbreak “pulses” (an increase in the area affected) (Figure 3) that occurred about 2004–2005 through 2007 and from 2014 to 2016 before a steady decline through to 2020 in all three districts. The hectares of the D. confusus attack were low and static from 1998 to 2002 in the Cascades (Spius Creek-1, Spius Creek-2) and Thompson Rivers Districts (Martin Creek) (Figure 2 and Figure 3), with these plots sustaining low to moderate attack levels, ranging from 9% to 22% (Figure 2). D. confusus attacks increased dramatically from 10% to 37% from 2000 to 2019 in the Martin Creek plot. AOS records show the second outbreak “pulse” peaking in 2016, with over 244 thousand hectares affected in the three districts and declining dramatically by 2021 to only 42.5 thousand hectares (Figure 3). Plots within the Okanagan Shuswap District (Scotch Creek, Sicamous Creek, Torrent Creek, Cherry Creek, Home Lake-1 and 2, Buck Mountain) had slightly higher levels of attack in 1998–2002, which gradually increased in the mid-2000s, before declining by the 2019–2020 assessment. Many trees that were attacked by D. confusus had fallen by this point, creating gaps. Three plots in the ESSFwc (late- or mid-to late-phase) and one in the ESSFxc (early to mid-phase) had an equal or greater number of subalpine fir down as those that remained standing by the end of the study.

3.2. Dryocoetes confusus Development

Dryocoetes confusus development in seven plots was monitored annually for up to six years to compare insect development and emergence to the foliar symptoms of every attacked tree. Four plots were in the ESSFwc (late-or mid-late phase), and three were in the ESSFxc (early- or early-to-mid phase). Beetles attacking trees in mid-late phase plots in the ESSFwc (wet, cold ecosystem) had shorter development times (2.03 ± 0.05 years) (Avg. ± S.E.) than those in the early-to-mid phase plots in the ESSFxc (very dry, cold ecosystem) (2.17 ± 0.03 years) (X2 (1, N = 645) = 8.3431, p = 0.039428). Slightly less than 20% of the assessed trees had brood present for just one year (overwintering only once prior to new beetles emerging) in all outbreak phase categories (Figure 4), suggesting that D. confusus may be able to switch to a one-year life cycle. Most sampled trees had brood present for two years (egg to adult) prior to emergence, at 52% and 61% of trees, respectively, in early-to-mid (ESSFxc) or mid-late (ESSFwc) phase plots. About 30% and 20% of trees in early-to-mid and mid-late phase plots had brood present for three years, while very few trees, primarily in mid-phase plots, had brood present for more than three years.
We often observed nuptial chambers only, containing one male and multiple females, but no egg galleries or brood during the annual sampling of trees. These beetles overwinter in the nuptial chambers and then begin excavating egg galleries and laying eggs the following spring as temperatures warm, allowing a prolonged developmental window for the brood.
The length of time that the attacked trees displayed foliar and bole attributes described by the six tree code categories is illustrated in Figure 5. Most code 1 trees (green foliage with nuptial chambers only, eggs, or small larvae present) changed to tree code 2 (bright red foliage) within one year, with very few trees retaining this foliage characteristic for more than a year (Figure 5). By year three, most trees had transitioned from tree code 2 to 3, and in year four, a substantial proportion was still considered tree code 3. The transition between tree codes 3 and 4 was more difficult to determine and was dependent on lighting conditions in the stand and the visibility of the tree crown. Most code 3 trees still contained brood, ranging from larvae to new adults. A small number of trees transitioned to tree code 4 by year three; however, the majority of tree code 4 trees were observed in years four through eight. A minimal brood was found in tree code 4 trees. There was a steady increase in tree code 5 trees after year six, and after year nine, tree code 6 trees dominated.
We compared the proportion of trees containing a D. confusus brood (tree codes 1–3) and the proportion of trees where most beetles had emerged (tree codes 4–5), labeled as new and old attacks, respectively, at plot establishment and final assessment (Figure 6). At the establishment, Scotch Creek, Cherry Creek, and Home Lake 1 and 2 plots had relatively high levels of new attack (≥10%), and Scotch Creek, Sicamous Creek, and Cherry Creek had high levels of old attack (≥30%), all in the mid-to late-phase. The Raft River, Home Lake-1 and 2, and Buck Mountain plots had moderate yet similar proportions of new and old attacks at the plot establishment (Figure 6) in early-to-mid phase plots. Sicamous Creek and Torrent Creek showed little change in the proportion of new to old attacks from the establishment to the final assessment. All plots had significantly more old attacks than new attacks at the final assessment, with the Raft River, Martin Creek, and Scotch Creek plots showing the highest levels of D. confusus populations in their trees at the final assessment.

3.3. Stand Decline and Impact

A strong relationship existed between subalpine fir density at the plot establishment and the total number of trees eventually killed by D. confusus (p < 0.01; R2 = 0.87) (Figure 7). The Martin Creek, Home Lake-1 and 2, and Buck Mountain plots, all early-to-mid phase in the outbreak cycle, had the highest subalpine fir density at plot establishment. The stems per hectare killed by D. confusus during the final assessment ranged from 150 to 585 sph (Avg. ± S.E. = 353.9 ± 51.3) with the highest stems per hectare killed in these same four plots. The density of live and dead subalpine fir combined in all plots ranged from 430 to 1217 sph (Avg. ± S.E. = 798.9 ± 85.6). The density of live subalpine fir at the final assessment ranged from 136 to 437 sph (Avg. ± S.E.= 260.7 ± 27.3) (Median = 248 sph) compared to 177–871 sph (Avg. ± S.E. = 525.7 ± 61.6) (Median = 428 sph) live subalpine fir at the establishment. There was far greater variability among plots in the density of live subalpine fir at the establishment than was observed at the final assessment. Mid-to-late phase status could be described by plots with <400 sph live subalpine fir and <600 sph all species, whereas early-to-mid phase status plots had >500 sph subalpine fir and >600 sph all species. By the final assessment, most plots were classified as mid-to-late phase and had very low-density live subalpine fir remaining.
The average dbh of live subalpine fir (all plots) was greater at the final assessment (Avg. ± S.E. = 26.3 ± 1.6 cm) than at the plot establishment (Avg. ± S.E. = 23.7 ± 1.1 cm) (t-test, t(7901) = 16.6972, p < 0.05), indicating the increased radial growth of trees not killed in this time interval. The average diameter of D. confusus-killed trees was significantly greater than the live trees and those killed by other factors at both plot establishment and the final assessment (p < 0.05). However, the average diameter of D. confusus-killed subalpine fir was not significantly different between the plot establishment (Avg. ± S.E. = 28.8 ± 1.7 cm) and final assessment (Avg. ± S.E. = 28.7 ± 1.8 cm) (t-test, p > 0.5), confirming that the largest trees were continually selected by D. confusus and as they were killed, the beetle had progressively smaller and fewer trees to attack. Figure 8 shows the diameter distribution (mean, median, range) of all subalpine fir killed by other factors (standing and down), those killed by D. confusus (standing and down), and those that were alive at final the assessment. Even though trees continued to grow over the time of this study, the trees killed by D. confusus were larger than the live trees and those killed by other factors at both plot establishment and at the final assessment.
For all plots combined, differences in the mean dbh existed between tree codes at the time of plot establishment and at the 2013 assessment (Kruskal–Wallis Test, p ≤ 0.05). Older dead trees killed by D. confusus (tree codes 3–6) were, on average, larger than residual healthy trees (Figure 8), indicating that larger trees were killed first. Windthrow trees infested with D. confusus (tree code 10) were larger than uninfected trees (tree code 11). Subalpine fir killed by other agents (tree code 7) were consistently smaller than D. confusus-killed trees.
The number of live subalpine fir per hectare declined in all plots over time while the number of D. confusus-killed trees increased. The percentage of trees that died from other causes (tree code 7) remained static at 10%–20%. The highest amount of windthrow occurred in the late-phase plots, with most of these fallen trees already dead due to D. confusus attacks. Based on these results, “outbreak phases” can be reasonably identified by general stand observations and subalpine fir mortality as a function of initial stems per hectare of trees over 12.5 cm dbh (Table 5).
Over the duration of the study, many subalpine firs were downed from the wind or snow loading of tree crowns. Most windthrows were already dead when they came down, but some live trees were also windthrown. As plot trees died and became less windfirm, gaps opened in the stand, and the amount of windthrow increased (Figure 9). Of the standing live and dead subalpine firs at plot establishment, 26.8% were down by the final assessment. Combining the subalpine fir in all plots, the average number of years from D. confusus attack to classification as a snag (tree code 6 = checking and bark peeling) was 12 years and 14 years until down. Subalpine fir killed by other factors took, on average, 13 years to fall, ranging from 7 years to over 14 years (Table 6). The average number of years from death to down (all plots combined) for D. confusus-killed trees compared to those killed by other causes was significantly different (t-test, p < 0.01). Combining downed subalpine firs from all plots, the average diameters (cm) of windthrow killed by D. confusus or by other causes were 26.5 ± 0.3 and 21.3 ± 0.3, respectively. Over the duration of this study, the annual rate of fall down ranged from 1% to 2.4% among the plots, similar to the 2.9% annual fall down rate recorded by DeLong et al. [79].
The volumes (m3) of live and dead trees were calculated to provide an estimate of production and loss within the plots (per hectare). From plot establishment to the final assessment, the total live volume of subalpine fir decreased in all plots except for Torrent Creek (Table 7), where there was a small increase in the volume of about 30 m3. The live subalpine fir volume at plot establishment ranged from a low of 141 m3 (Raft River) to a high of 205 m3 (Home Lake-1), and a final assessment from 58 m3 to 208 m3 at Home Lake-1 and Torrent Creek (Table 7). The volume of dead firs due to D. confusus in plots at the establishment ranged from about 30 m3 to over 200 m3. Live volume mortality during the study period, from all causes, ranged from 5.6 m3/ha (Spius Creek-1) to 146.9 m3/ha (Home Lake-1), with an average volume loss overall plot of 59.1 m3/ha. The volume of dead firs at the final assessment was highest in the Sicamous Creek plot (late-phase) and lowest in the Raft River plot (early to mid-phase) at approximately 410 m3 and 164 m3. At the establishment, there was already a significant dead volume (killed by D. confusus) in each plot, ranging from about 30 m3 to 240 m3, in the Raft River and Cherry Creek plots. The highest volume losses due to D. confusus, from the establishment to final assessment, were observed in the two Home Lake plots (236 m3 and 206 m3) (Table 7) and Buck Mountain plot (193 m3). The average annual volume loss, from the establishment to the final assessment from D. confusus, ranged from 4.1 m3 to 15.7 m3 in the Spius Creek-1 and Home Lake-1 plots. There was a strong correlation between the subalpine fir volume killed by D. confusus at plot establishment and the assigned outbreak phase of the plot (R2 = 0.7106; p < 0.01), with a much lower volume loss in early phase plots compared to late phase plots.
The live subalpine fir density in the two Spius Creek plots and Torrent Creek declined by less than 50% compared to an over 50% decline in all other plots. These three plots also had the lowest percentage of dead volume at the final assessment, ranging from 54% to 60%, indicating a strong influence of density and tree size in the successional processes (mortality) in stands.
When dead and live volumes of subalpine firs in the plots were compared at the final assessment, they ranged from 1.2 to 6.1 times more dead than the live volume (Table 7). Combining all plots, approximately 31% (>960 m3) of subalpine firs were already dead at plot establishment, and 73% were dead by the final assessment (3363 m3).

3.4. Spatial Analyses

For Voronoi tiles, across all plots, the mean percentage number of points (healthy trees, all species) that were retained after the application of a “reduced sample” edge correction was 58.3 ± 0.08 (n = 4102 of 7038) for Time 1 and 47.4 ± 0.6 (n = 2087 of 4401) for Time 2. These percentages were apparently lower than values derived by Kenkel et al. [80], which suggests that our approach was “conservative”. An analysis of the tile sizes was conducted on log10 transformed data (back-transformed data shown). The mean tile size (all live trees, all species) across all plots was significantly different between Time 1 (11.3 ± 0.01 m2) and Time 2 (18.3 ± 0.01 m2) (2-tailed sample t-test with equal variances, p < 0.05) (Figure 10 and Figure 11). Subalpine fir had a slightly larger APA (11.48 ± 0.01 m2) than spruce (10.85 ± 0.02 m2) at Time 1. However, there was no difference in APA between the subalpine fir (18.83 ± 0.02 m2) and spruce (17.81 ± 0.03 m2) trees at Time 2 (2-tailed sample t-tests with equal variances, p > 0.05).
Most of the “empty space” distances were small; an average of 71.3 ± 4.6% of all the distances was a ≤3 m radius at Time 1. This percentage decreased to 57.0 ± 3.8% by Time 2 as average opening sizes increased due to tree mortality (Table 8). Even so, there were few openings larger than a 5 m radius at either time. Across all 11 plots, there were no openings >13 m of radius at Time 1. There were 29 openings >11 m and ≤13 m in radius at Time 1, but 22 of these openings occurred on the Cherry Creek plot, which had the lowest stems per hectare of all the plots. Openings sometimes appeared as “polygons” but were often “sinuous” [71,74] (Figure 12). Critical inter-tree distance (the point at which tree arrangement rapidly transitions from many small clusters to a single large cluster [72]) for all standing trees ranged from 2 to 5 m for 10 plots (Raft River plot not included in this analysis). The approximate mean critical inter-tree distance was 3.7 ± 0.32 m.

4. Discussion and Conclusions

Dryocoetes confusus is integral to the successional processes in subalpine forests and has likely been the main disturbance agent for millennia. It is well adapted to its host and the harsh climatic conditions where both are found. Historically, succession in subalpine fir-dominated forests is a slow process not typically driven by stand replacement fires [55] but rather due to the patchy, intermittent mortality caused by D. confusus and other factors, which create small gaps and windthrow, thereby increasing the ground disturbance necessary for the promotion of new seedlings. This slow yet continuous turnover of mature subalpine fir maintains these forests in a gap-dynamic driven and functioning state. However, the accelerated rate of mortality observed in the past two decades is causing an imbalance in this delicate beetle-driven dynamic process. Our study represents just a small footprint within the vast area occupied by subalpine fir forests in B.C. However, we have shown significant mortality and disturbance occurring in these stands. If this is a correct reflection of even a portion of the landscape, then the successional progress, or decline, of these forests is becoming unbalanced.
The successional or outbreak phase of a mature subalpine fir stand can reasonably be estimated by considering stand density, tree mortality, recent D. confusus attacks, and stand deterioration (dead from other causes and windthrow). Dryocoetes confusus was the major disturbance in our study, causing over two-thirds of the total subalpine fir mortality observed. Other biotic and abiotic factors played a role in the general decline by killing subdominant trees in stands or possibly predisposing trees to attack by D. confusus. We found stand density to be a strong predisposing factor in the decline of subalpine fir, with smaller diameter stems dying from a combination of abiotic stressors and secondary biotic factors, including drought, Armillaria spp., and less aggressive bark beetles. Others [4,11] support this strong relationship between subalpine fir density, basal area (volume), and increasing D. confusus attacks and suggest that it may take more than 100 years to return these heavily impacted stands to pre-outbreak conditions. With amplified heat and moisture stress affecting subalpine fir ecosystems, the recovery time may be much longer, and a return to pre-outbreak conditions may not be possible. A higher stem density creates more below- and above-ground competition for water, nutrients, and growing space. As the carrying capacity of a stand is reached, commonly described as the basal area or volume, growth is reduced, and trees die [81]. This leads to senescence and a lowered capacity to defend from cortical invaders [10,16]. Our study confirms this successional strategy, with D. confusus activity being very high in early outbreak phase plots and then declining as the cumulative stem mortality creates significantly lower live densities and volumes, moving stands into mid-to-late outbreak phases. Dryocoetes confusus searches for and attacks the largest and presumably slowest-growing trees in a stand until the size and density of the remaining live hosts became sub-optimal. Even though there may be subalpine fir of an acceptable size (>20 cm) remaining in the stands when sph is reduced to below 400, the attacks decline. As the live component of subalpine fir declines, the remaining live trees may take advantage of this increased growing space by resuming radial growth and, in turn, become less susceptible to D. confusus attack. Dryocoetes confusus seems to have a wide and very finely tuned flight and search pattern for finding the most acceptable and vulnerable hosts. There was minimal change in the average size of live subalpine fir from the time of plot establishment to the final assessment due to selective thinning by D. confusus and other damage agents.
A common host-selection characteristic of tree-killing bark beetles is to select large-diameter trees that provide a more suitable habitat for attacking beetles and developing offspring. Additionally, it is generally accepted that weaker or stressed trees are more susceptible to bark beetle attacks due to reduced primary defenses [51,82]. D. confusus displayed this same preference in our study by infesting all the largest trees, which were presumably slower growing [10], until host size, density, and distribution were sub-optimal. Even though D. confusus is most active in older stands [2], there was no correlation between tree age and infestation phase, suggesting that D. confusus is ubiquitous in mature stands and other tree and stand parameters are more important in the beetles’ host selection.
In the early phase of infestation progression in the stands, we found evidence that D. confusus may be able to shorten its development time to one year. This may, in part, explain the rapid increase in attack rates observed in some plots. Bright [52] and Negrón and Popp [12] have also considered this possibility suggesting that extended warmer spring and summer temperatures may trigger earlier adult emergence or benefit accelerated development the year following oviposition. Our study revealed the presence of numerous nuptial chambers in attacked trees containing one male with multiple females but no brood galleries when sampling in late summer. This may be the jump-start needed to trigger a one-year life cycle.
Bark beetles and other pathogens create disturbances across diverse forest ecosystems resulting in a disruption to stand structure complexity, species composition, and even the function of these forested landscapes [83,84,85]. Our study suggests that D. confusus is altering subalpine fir landscapes in tandem with, and influenced by, the amplification of anthropogenic and climate disturbance. Horizontal and vertical structural heterogeneity influences various forest attributes (tree growth, plant species diversity, and insect and wildlife habitat), which, in turn, influences a forest’s resilience to disturbance [86,87,88,89]. The increasing mortality and windthrow have changed the area available (growing space) to trees over time, suggesting that “openings” were created in the overstory canopy, which, in turn, may contribute to gap structure and conditions that are suitable for regeneration [
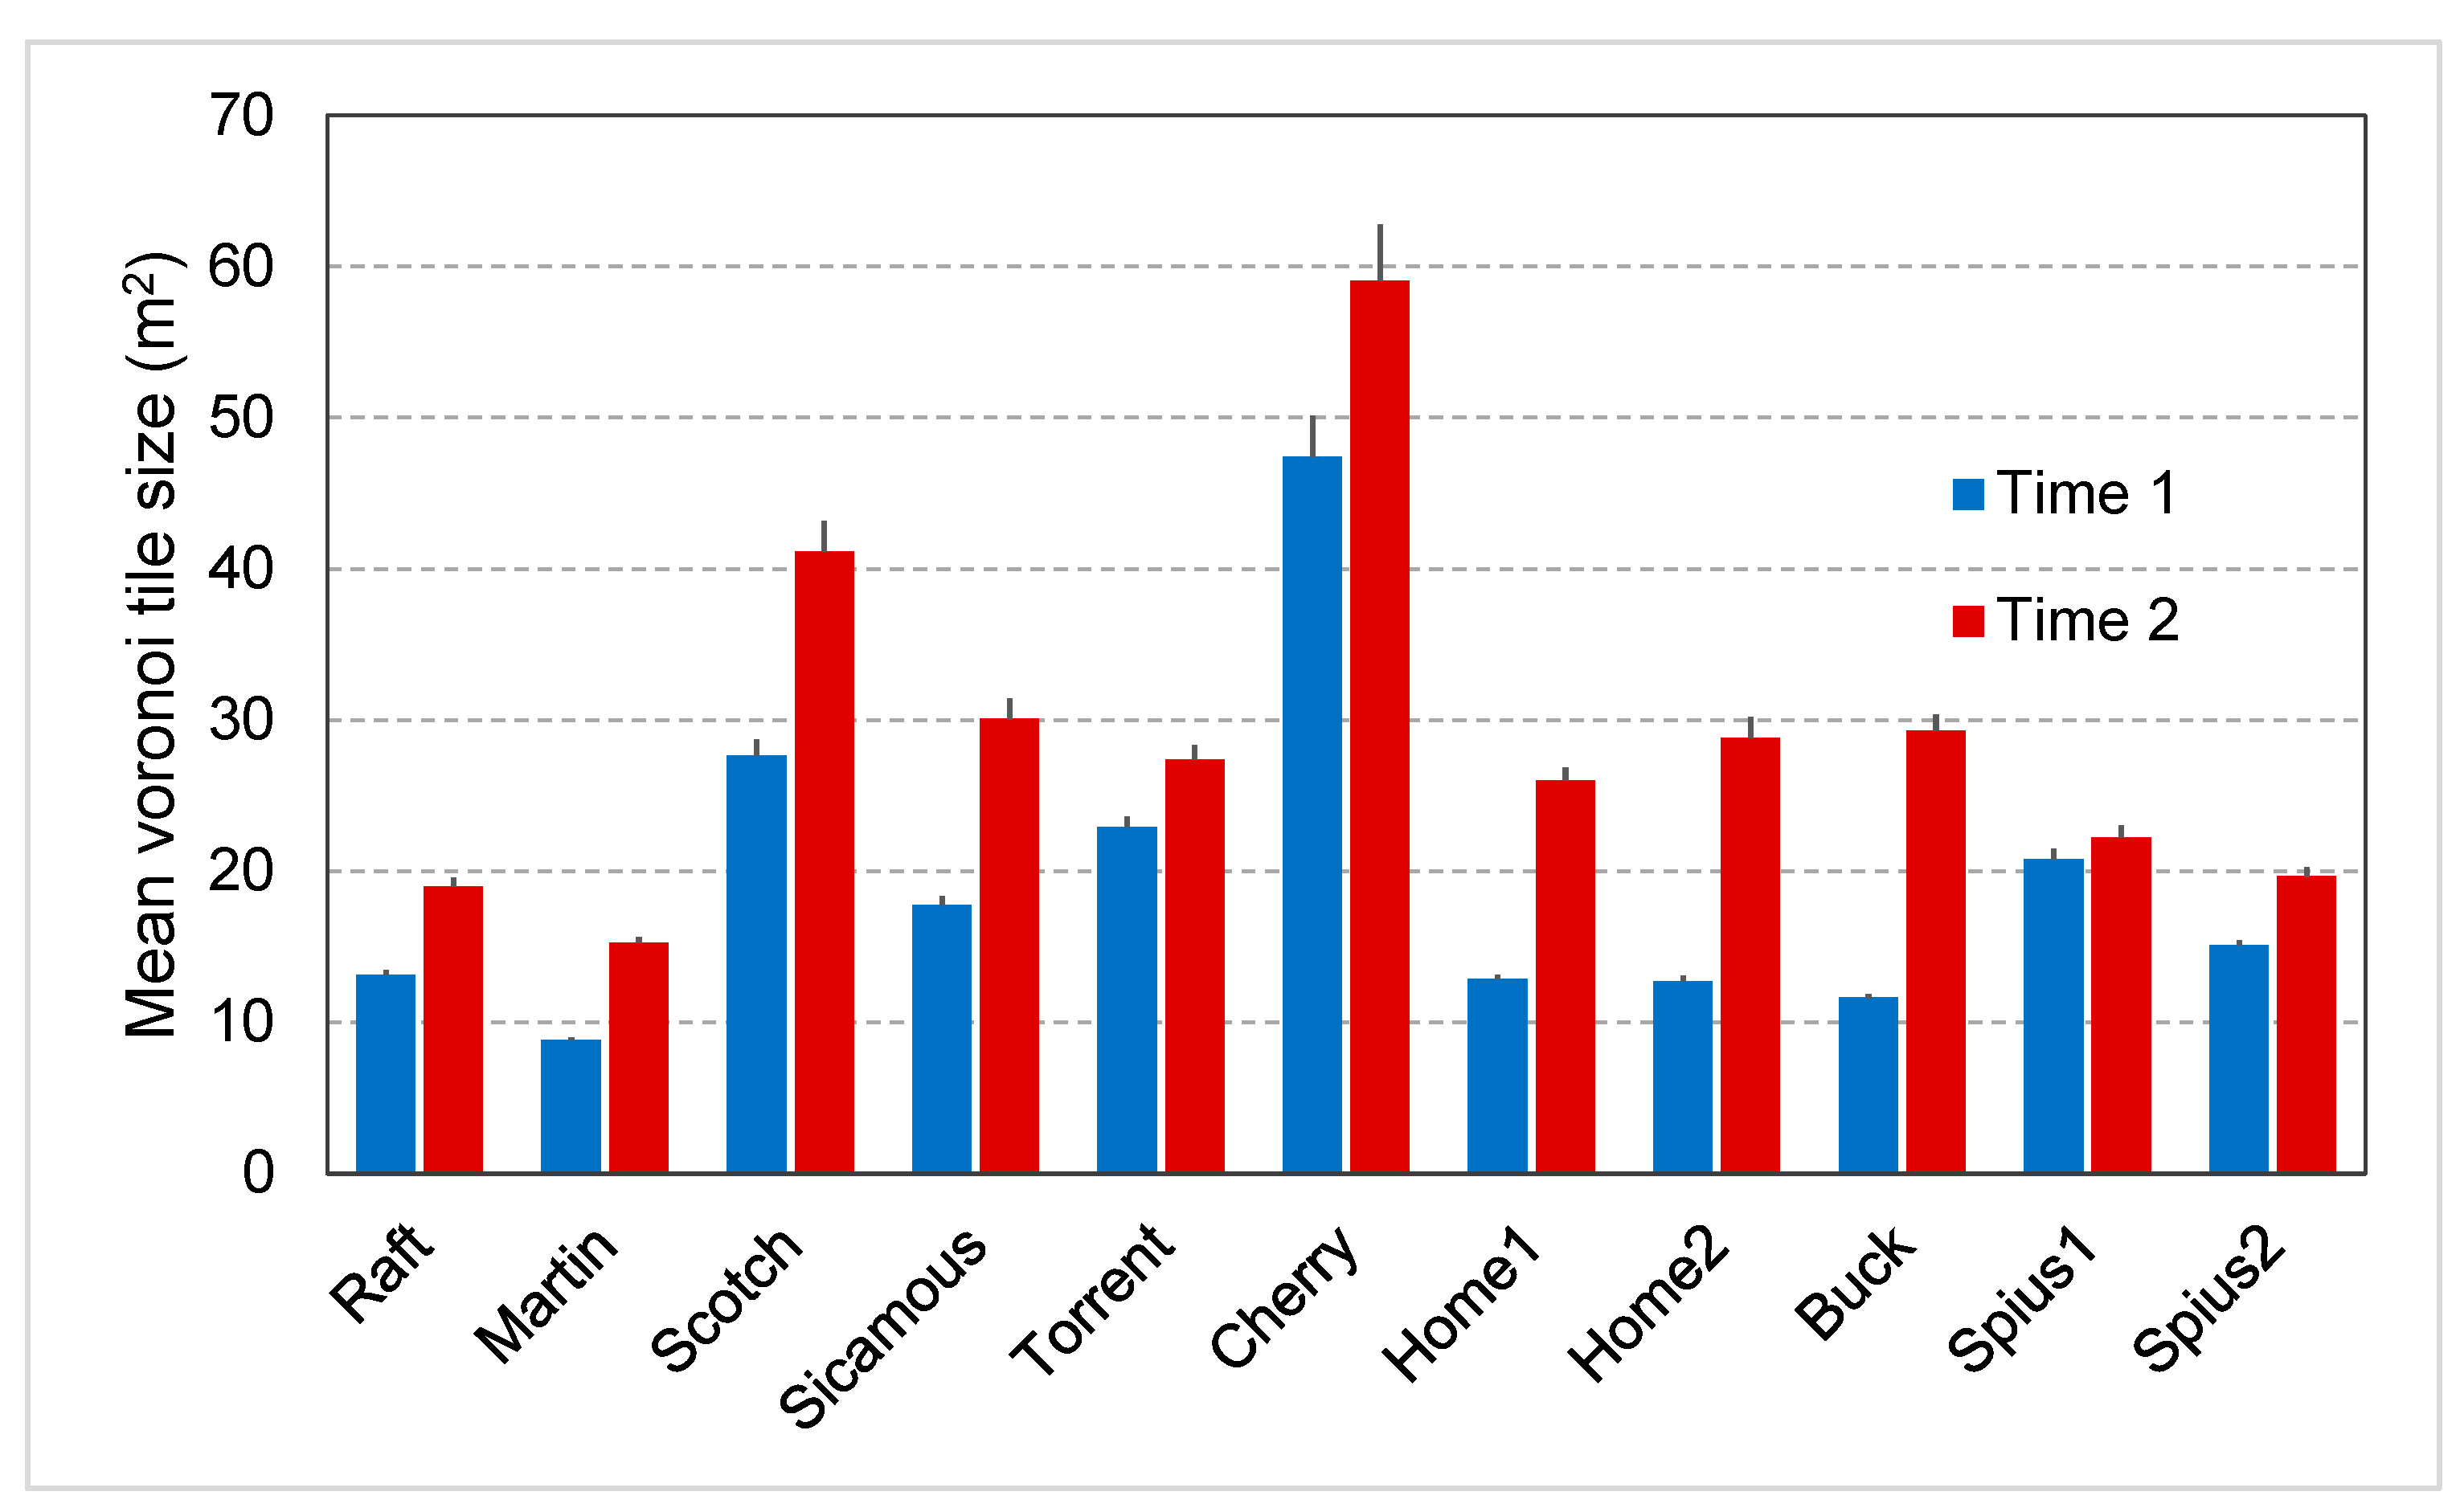
89]. Assuming that the crown diameter of a subalpine fir or spruce is about 4 m [90,91], the “occupied canopy area” would therefore be about 13 m2. The average area potentially available to a tree changed from 11 m2 at its establishment to 18 m2 by the final assessment, suggesting that canopy openings were more than large enough to support the release of understory trees and perhaps trees located on the “edges of gaps” [92]. Subalpine fir cannot compete successfully with commonly associated tree species (spruces, lodgepole pine, Douglas-fir, Pseudotsuga menziesii var. glauca, (Mirb.) Franco (Pinales: Pinaceae)) if light intensity exceeds 50% of the full shade [93].
In a cluster analysis of mixed conifer dry ponderosa pine forests, Larson and Churchill [73] found that at least 6% of clusters were single trees at inter-tree distances of ≥7 m. In a similar approach, Sanchez Meador et al. [94] found that trees were all members of the same patch when limiting inter-tree distance to an average of 12 m. Churchill et al. [64] and Abella and Denton [76] used an “average” crown diameter of 6 m (3 m radius) when assessing reference conditions for dry mixed conifer forests in the southwest USA. Mature subalpine fir and spruce both have long narrow, compact conical crowns and, in interior B.C., a crown radius of about 2 m [26,90,91,93]. In theory, an empty space distance with a radius of 3 m is big enough for a mature subalpine fir or spruce tree with a crown radius of 2 m but not big enough to accommodate two or more trees. Even so, in our study, there were few openings larger than a 5 m radius at either time and even though these gaps became sizable with increasing mortality, their shape could hinder future or rapid occupancy. Seedlings respond to the creation of canopy gaps, but recruitment into the overstory may not happen for a long time if they are too close to established overstory trees [73].
The ecological integrity and economic value of subalpine fir ecosystems are changing. Stands are transitioning rapidly from early-phase to late-phase outbreak status, with a high proportion of the subalpine fir component standing dead or down. In less than a decade, D. confusus-attacked trees have deteriorated in quality transitioning from live to various stages of decay, thereby reducing recoverable harvest volumes and leaving fewer options for rehabilitation. Dead-standing trees remain important for their hydrologic contribution [14], carbon sequestration [15], and numerous other ecological processes and use. Still, these too, may be compromised if the ratio of live-to-dead trees becomes unbalanced.
Although subalpine fir forests are susceptible to a range of disturbances, including fire [55,95,96], historically, stand-replacement fire intervals have been very long, so small gap dynamics appear to have been the main successional and ecological driver in these ecosystems until very recently. The current accelerated decline of subalpine firs in conjunction with drier and hotter summer conditions may change future fire dynamics by providing more continuous and connected areas of dead and down fuel for fires should fire-starts occur. Therefore, forest managers must take a landscape-level view of these valuable but vulnerable and declining forests and determine where, when, and how much intervention is necessary to protect and conserve ecological functions. Our study has provided a tool for classifying stands into early-, mid-, and late-phase in the outbreak progression of D. confusus. By applying this tool across susceptible landscapes, managers can better understand current losses and projected losses in the next decade. To maximize economic return, harvest and reforestation efforts should focus on early-phase stands. Conversely, the rehabilitation of late-phase stands, including harvest and prompt reforestation, may be of a higher priority. Further research is needed to determine whether D. confusus can shift to a one-year life cycle and model how accelerated development rates may affect stand-level population expansions in early-to-mid-phase outbreak scenarios. A conscious application of proactive strategies on the landscape is necessary to prolong the viability of high-elevation and northern subalpine fir forests.

Author Contributions

Conceptualization, methodology, investigation, writing—original draft preparation, L.E.M.; formal analysis, L.E.M. and A.J.S.; writing—review and editing, L.E.M., J.E.B. and A.J.S.; visualization, L.E.M.; funding acquisition, L.E.M. All authors have read and agreed to the published version of the manuscript.

Funding

This research was funded by the Forest Investment Account, Forest Innovation Investment Program (FIA/FII) (2001–2003), and the British Columbia Ministry of Forests, Forests Sciences Program.

Data Availability Statement

British Columbia Aerial Overview Data is available at: www.for.gov.bc.ca/ftp/HFP/external/!publish/Aerial_Overview/. All other data are the property of the B.C. Ministry of Forests.

Acknowledgments

We thank K. Buxton, J.C. Hodge, L.M. Wood, K. Krawchuck, B. Zimonick, K. Baleshta, R.M. Wijenberg, and many summer students for field assistance. We also thank Martin Watts, FORCOMP Forestry Consulting Ltd., for volume calculations; Ryan Midgley, Timber Pricing Branch for providing forest inventory data; Graydon Shevchenko for geospatial assistance; and three anonymous reviewers for their thoughtful reviews. We thank Rolf Turner for assistance with the R package “deldir”.

Conflicts of Interest

The authors declare no conflict of interest.

References

  1. Smith, J.M.; Paritsis, J.; Veblen, T.T.; Chapman, T.B. Permanent forest plots show accelerating tree mortality in subalpine forests of the Colorado Front Range from 1982 to 2013. For. Ecol. Manag. 2015, 341, 8–17. [Google Scholar] [CrossRef]
  2. Maclauchlan, L.E. Quantification of Dryocoetes confusus caused mortality in subalpine fir forests of southern British Columbia. For. Ecol. Manag. 2016, 359, 210–220. [Google Scholar] [CrossRef]
  3. Reich, R.M.; Lundquist, J.E.; Hughes, K. Host-environment mismatches associated with subalpine fir decline in Colorado. Can. J. For. Res. 2016, 27, 1177–1189. [Google Scholar] [CrossRef]
  4. Lalande, B.M.; Hughes, K.; Jacobi, W.R.; Tinkham, W.T.; Reich, R.; Stewart, J.E. Subalpine fir mortality in Colorado is associated with stand density, warming climates and interactions among fungal diseases and the western balsam bark beetle. For. Ecol. Manag. 2020, 466, 118–133. [Google Scholar] [CrossRef]
  5. Howe, M.; Peng, L.; Carroll, A. Landscape predictions of western balsam bark beetle activity implicate warm temperatures, a longer growing season, and drought in widespread irruptions across British Columbia. For. Ecol. Manag. 2022, 508, 16. [Google Scholar] [CrossRef]
  6. Sinclair, W.A.; Hudler, G.W. Tree declines: Four concepts of causality. J. Arboric. 1988, 14, 29–35. [Google Scholar] [CrossRef]
  7. Furniss, R.L.; Carolin, V.M. Western Forest Insects; Misc. Pub. No. 1339; USDA Forest Service: Washington, DC, USA, 1977; p. 654. [CrossRef]
  8. Stock, A.J. The Western Balsam Bark Beetle, Dryocoetes confusus Swaine: Impact and Semiochemical-Based Management. Ph.D. Thesis, Simon Fraser University, Burnaby, BC, Canada, 1991. [Google Scholar]
  9. Garbutt, R. Western balsam bark beetle. Forest Pest Leaflet 64; Canadian Forest Service, Pacific Forestry Centre: Victoria, BC, Canada, 1992; p. 4.
  10. Bleiker, K.P.; Lindgren, B.S.; Maclauchlan, L.E. Characteristics of subalpine fir susceptible to attack by western balsam bark beetle (Coleoptera: Scolytidae). Can. J. For. Res. 2003, 33, 1538–1543. [Google Scholar] [CrossRef]
  11. McMillin, J.D.; Allen, K.K.; Long, D.F.; Harris, J.L.; Negrón, J.F. Effects of western balsam bark beetle on spruce-fir forests of north-central Wyoming. West. J. Appl. For. 2003, 184, 259–266. [Google Scholar] [CrossRef]
  12. Negrón, J.E.; Popp, J.B. The flight periodicity, attack patterns, and life history of Dryocoetes confusus Swaine (Coleoptera: Curculionidae: Scolytinae), the western balsam bark beetle, in North Central Colorado. West N. Am. Nat. 2009, 69, 447–458. [Google Scholar] [CrossRef]
  13. Maclauchlan, L.E.; Boone, C.; Robert, J. Declining Forests and a Forgotten Bark Beetle. In BC Forest Professional Magazine, Fall 2022; Association of BC Forest Professionals: Vancouver, BC, Canada, 2022. [Google Scholar]
  14. Winkler, R.; Spittlehouse, D.; Boon, S. Streamflow response to clear-cut logging on British Columbia’s Okanagan Plateau. Ecohydrology 2017, 10, 1836. [Google Scholar] [CrossRef]
  15. Van Mantgem, P.J.; Stephenson, N.L.; Byrne, J.C.; Daniels, L.D.; Franklin, J.F.; Fulé, P.Z.; Harmon, M.E.; Larson, A.J.; Smith, J.M.; Taylor, A.H.; et al. Widespread increase of tree mortality rates in the western United States. Science 2009, 323, 521–524. [Google Scholar] [CrossRef]
  16. Anderegg, W.R.L.; Hicke, J.A.; Fisher, R.A.; Allen, C.D.; Aukema, J.; Bentz, B.; Hood, S.; Lichstein, J.W.; Macalady, A.K.; McDowell, N.; et al. Tree mortality from drought, insects, and their interactions in a changing climate. New Phytol. 2015, 208, 674–683. [Google Scholar] [CrossRef]
  17. Lloyd, D.; Angove, K.; Hope, G.; Thompson, C. A guide to site identification and interpretation for the Kamloops Forest Region. In BC Ministry of Forests Land Management Handbook 23 in 2 Parts; BC Ministry of Forests: Victoria, BC, Canada, 1990; p. 400. [Google Scholar]
  18. Meidinger, D.; Pojar, J. Ecosystems of British Columbia; Special Report Series No. 6; BC Ministry of Forests: Victoria, BC, Canada, 1991; p. 330. Available online: https://www.for.gov.bc.ca/hfd/pubs/docs/srs/srs06.htm (accessed on 1 December 2022).
  19. Parish, R.; Thomson, S. Tree Book: Learning to Recognize Trees of British Columbia; Natural Resources Canada, Canadian Forest Service, Pacific Forestry Centre: Victoria, BC, Canada; BC Ministry of Forests: Victoria, BC, Canada, 1994; p. 183.
  20. Klinka, K.; Worrall, J.J.; Skoda, L.; Varga, P. The Distribution and Synopsis of Ecological and Silvical Characteristics of Tree Species of British Columbia’s Forests; Canadian Cartographics Ltd.: Coquitlam, BC, Canada, 2000; p. 2. [Google Scholar] [CrossRef]
  21. Coupé, R.A.; Stewart, A.C.; Wikeem, B.M. Engelmann Spruce—Subalpine Fir Zone. In Ecosystems of British Columbia; Special Report Series 6; Meidinger, D.V., Pojar, J., Eds.; BC Ministry of Forests, Research Branch: Victoria, BC, Canada, 1991; pp. 223–236. [Google Scholar]
  22. DeLong, S.C.; Meidinger, D. Ecological variability of high elevation forests in central British Columbia. For. Chron. 2003, 79, 259–262. [Google Scholar] [CrossRef]
  23. Price, D.T.; Alfaro, R.I.; Brown, K.J.; Flannigan, M.D.; Fleming, R.A.; Hogg, E.H.; Girardin, M.P.; Lakusta, T.; Johnston, M.; McKenney, D.W.; et al. Anticipating the consequences of climate change for Canada’s boreal forest ecosystems. Environ. Rev. 2013, 21, 322–365. [Google Scholar] [CrossRef]
  24. Woods, A.J.; Coates, K.D.; Watts, M.; Foord, V.; Holtzman, E.I. Warning signals of adverse interactions between climate change and native stressors in British Columbia forests. Forests 2017, 8, 280. [Google Scholar] [CrossRef]
  25. Zhi, W.; Williams, K.H.; Carroll, R.W.; Brown, W.; Dong, W.; Kerins, D.; Li, L. Significant stream chemistry response to temperature variations in a high-elevation mountain watershed. Commun. Earth Environ. 2020, 1, 1–10. [Google Scholar] [CrossRef]
  26. Alexander, R.R. Ecology, silviculture, and management of the Engelmann spruce-subalpine fir type in the central and southern Rocky Mountains. In Agriculture Handbook 659; USDA Forest Service: Washington, DC, USA, 1987; p. 144. [Google Scholar]
  27. Griesbauer, H.; DeLong, S.C.; Rogers, B.; Foord, V. Growth sensitivity to climate varies with soil moisture regime in spruce–fir forests in central British Columbia. Trees 2021, 35, 649–669. [Google Scholar] [CrossRef]
  28. Peng, C.; Ma, Z.; Lei, X.; Zhu, Q.; Chen, H.; Wang, W.; Liu, S.; Li, W.; Fang, X.; Zhou, X. A drought-induced pervasive increase in tree mortality across Canada’s boreal forest. Nat. Clim. Change. 2011, 1, 467–471. [Google Scholar] [CrossRef]
  29. Williams, A.P.; Allen, C.D.; Macalady, A.K.; Griffin, D.; Woodhouse, C.A.; Meko, D.M.; Swetnam, T.W.; Rauscher, S.A.; Seager, R.; Grissino-Mayer, H.D.; et al. Temperature as a potent driver of regional forest drought stress and tree mortality. Nat. Clim. Change 2013, 3, 292–297. [Google Scholar] [CrossRef]
  30. Bentz, B.J.; Régnière, J.; Fettig, C.J.; Matthew, E.; Hayes, J.L.; Hicke, J.A.; Kelsey, R.G.; Negrón, J.F.; Seybold, S.J. Climate change and bark beetles of the western United States and Canada: Direct and indirect effects. BioScience 2010, 60, 602–613. [Google Scholar] [CrossRef]
  31. Safranyik, L.; Wilson, B. The Mountain Pine Beetle: A Synthesis of Biology, Management, and Impacts on Lodgepole Pine; Natural Resources Canada, Canadian Forest Service, Pacific Forestry Centre: Victoria, BC, Canada, 2006; p. 304.
  32. Hlásny, T.; Krokene, P.; Liebhold, A.; Montagné-Huck, C.; Müller, J.; Qin, H.; Raffa, K.; Schelhaas, M.-J.; Seidl, R.; Svoboda, M.; et al. Living with bark beetles: Impacts, outlook and management options. In From Science to Policy 8; European Forest Institute: Joensuu, Finland, 2019; p. 52. [Google Scholar] [CrossRef]
  33. Kurz, W.A.; Dymond, C.C.; Stinson, G.; Rampley, G.J.; Neilson, E.T.; Carroll, A.L.; Ebata, T.; Safranyik, L. Mountain pine beetle and forest carbon feedback to climate change. Nature 2008, 452, 987–990. [Google Scholar] [CrossRef] [PubMed]
  34. Safranyik, L.; Carroll, A.L.; Régnière, J.; Langor, D.W.; Riel, W.G.; Shore, T.L.; Peter, B.; Cooke, B.J.; Nealis, V.G.; Taylor, S.W. Potential for range expansion of mountain pine beetle into the boreal forest of North America. Can. Entomol. 2010, 142, 415–442. [Google Scholar] [CrossRef]
  35. Maclauchlan, L.E.; Brooks, J.E.; White, K.J. Impacts and susceptibility of young pine stands to the mountain pine beetle, Dendroctonus ponderosae, in British Columbia. J. Ecosys. Manage. 2015, 15, 1–18. [Google Scholar] [CrossRef]
  36. Maclauchlan, L.E.; Buxton, K. 2018 Overview of Forest Health Conditions in Southern British Columbia; Ministry of Forests, Range and Natural Resource Operations and Rural Development, Thopson Okanagan Region: Kamloops, BC, Canada, 2019; p. 73. Available online: https://www2.gov.bc.ca/assets/gov/environment/research–monitoring-and-reporting/monitoring/aerial-overview-survey-documents/2018_south_overview_report_web.pdf (accessed on 2 November 2022).
  37. Fettig, C.J.; Progar, R.A.; Paschke, J.; Sapio, F.J. Forest insects. In Disturbance and Sustainability in Forests of the Western United States; Robertson, G., Barrett, T., Eds.; Gen. Tech. Rep. PNW-GTR-992; USDA Forest Service, Pacific Northwest Research Station: Portland, OR, USA, 2021; pp. 81–121. [Google Scholar]
  38. Robbins, Z.J.; Xu, C.; Aukema, B.H.; Buotte, P.C.; Chitra-Tarak, R.; Fettig, C.J.; Goulden, M.L.; Goodsman, D.W.; Hall, A.D.; Koven, C.D.; et al. Warming increased bark beetle-induced tree mortality by 30% during an extreme drought in California. Global Change Biol. 2022, 28, 509–523. [Google Scholar] [CrossRef] [PubMed]
  39. Maclauchlan, L.E. 1999 Overview of Forest Health in the Kamloops Forest Region; Ministry of Forests: Kamloops, BC, Canada, 2000; p. 23.
  40. Westfall, J.M.; Ebata, T. 2018 Summary of Forest Health Conditions in British Columbia; BC Ministry of Forests, Lands and Natural Resource Operations: Victoria, BC, Canada, 2019; p. 95.
  41. Stock, A.J.; Borden, J.H.; Pratt, T.L. Containment and concentration of infestations of the western balsam bark beetle, Dryocoetes confusus (Coleoptera: Scolytidae), using the aggregation pheromone exo-brevicomin. Can. J. For. Res. 1994, 24, 483–492. [Google Scholar] [CrossRef]
  42. Maclauchlan, L.E.; Brooks, J.E. Western balsam bark beetle, Dryocoetes confusus Swaine (Coleoptera: Curculionidae: Scolytinae), in situ development and seasonal flight periodicity in southern British Columbia. J. Entomol. Soc. B. C. 2017, 114, 1–16. [Google Scholar]
  43. Maclauchlan, L.E.; Brooks, J.E. Comparison of two treatment regimes for managing western balsam bark beetle. J. Ecosys. Manage. 2021, 21, 1–11. [Google Scholar] [CrossRef]
  44. Mathers, W.G. The biology of Canadian bark beetles: The seasonal history of Dryocoetes confusus Sw. Can. Entomol. 1931, 63, 247–248. [Google Scholar] [CrossRef]
  45. Gaylord, M.L.; Williams, K.K.; Hofstetter, R.W.; McMillin, J.D.; DeGomez, T.E.; Wagner, M.R. Influence of temperature on spring flight initiation for southwestern ponderosa pine bark beetles (Coleoptera: Curculionidae, Scolytinae). Environ. Entomol. 2008, 37, 57–69. [Google Scholar] [CrossRef]
  46. Hansen, E.M. Western balsam bark beetle, Dryocoetes confusus Swaine, flight periodicity in northern Utah. Great Basin Naturalist. 1996, 56, 348–359. [Google Scholar]
  47. Gibson, K.; Kegley, S.; Oakes, B. Western Balsam Bark Beetle Activity and Flight Periodicity in the Northern Region; Rep. 97-3; USDA Forest Service, Cooperative Forestry and Forest Health Protection: Missoula, MT, USA, 1997; p. 5.
  48. McMillin, J.D.; Allen, K.K.; Long, D.F. Evaluation of Western Balsam Bark Beetle Flight Periodicity on the Bighorn National Forest, Wyoming; Tech. Rep. R2-65; USDA Forest Service Rocky Mountain Region: Golden, CO, USA, 2001; p. 19.
  49. Stock, A.J.; Pratt, T.L.; Borden, J.H. Seasonal flight pattern of the western balsam bark beetle, Dryocoetes confusus Swaine (Coleoptera: Curculionidae), in central British Columbia. J. Entomol. Soc. B. C. 2013, 110, 27–34. [Google Scholar]
  50. Molnar, A.C. Pathogenic fungi associated with a bark beetle on alpine fir. Can. J. Bot. 1965, 43, 39–43. [Google Scholar] [CrossRef]
  51. Mattson, W.; Haack, R.A. Role of drought in outbreaks of plant-eating insects. BioScience 1987, 37, 110–118. [Google Scholar] [CrossRef]
  52. Bright, D.E., Jr. Bark beetles of the genus Dryocoetes (Coleoptera: Scolytidae) in North America. Ann. Entomol. Soc. Am. 1963, 56, 103–115. [Google Scholar] [CrossRef]
  53. Hansen, E.M.; Bentz, B.J. Comparison of reproductive capacity among univoltine, semivoltine, and re-emerged parent spruce beetles. Can. Entomol. 2003, 135, 697–712. [Google Scholar] [CrossRef]
  54. Bleiker, K.P.; Willsey, T. Experimental evidence supporting an obligate adult diapause for spruce beetle (Coleoptera: Curculionidae) from British Columbia. Environ. Entomol. 2020, 49, 98–103. [Google Scholar] [CrossRef]
  55. Antos, J.A.; Parish, R. Structure and dynamics of a nearly steady-state subalpine forest in south-central British Columbia, Canada. Oecologia 2002, 130, 126–135. [Google Scholar] [CrossRef] [PubMed]
  56. Harvey, B.J.; Andrus, R.A.; Battaglia, M.A.; Negrón, J.F.; Orrego, A.; Veblen, T.T. Droughty times in mesic places: Factors associated with forest mortality vary by scale in a temperate subalpine region. Ecosphere 2021, 12, e03318. [Google Scholar] [CrossRef]
  57. Bleiker, K.P.; Lindgren, B.S.; Maclauchlan, L.E. Resistance of fast- and slow-growing subalpine fir to pheromone-induced attack by western balsam bark beetle (Coleoptera: Scolytinae). Agric. For. Entomol. 2005, 7, 237–244. [Google Scholar] [CrossRef]
  58. Maclauchlan, L.E.; Harder, L.; Borden, J.H.; Brooks, J.E. Impact of the western balsam bark beetle, Dryocoetes confusus Swaine (Coleoptera: Scolytidae), at the Sicamous Research site, and the potential for semiochemical based management in alternative silviculture systems. J. Entomol. Soc. B. C. 2003, 100, 27–41. [Google Scholar]
  59. Chapman, D.G. Statistical problems in population dynamics. In Proceedings of the Fourth Berkeley Symposium on Mathematical Statistics and Probability; Neyman, J., Ed.; University of California Press: Berkeley, CA, USA, 1961; Volume 4, pp. 153–186. [Google Scholar]
  60. R Core Team. R: A language and environment for statistical computing; R Foundation for Statistical Computing: Vienna, Austria, 2022; Available online: https://www.R-project.org/ (accessed on 1 December 2022).
  61. Kozak, A. My last words on taper equations. For. Chron. 2004, 80, 507–515. [Google Scholar] [CrossRef] [Green Version]
  62. Zar, J.H. Biostatistical Analysis, 2nd ed.; Prentice-Hall, Inc.: Englewood Cliffs, NJ, USA, 1984; p. 718. [Google Scholar]
  63. Churchill, D.J.; Larson, A.J.; Jeronimo, S.M.A.; Dalhgreen, M.C.; Franklin, J.F. The ICO Approach to Quantifying and Restoring Forest Spatial Pattern: Implementation Guide, Version 2.0.; Stewardship Forestry: Vashon, WA, USA, 2013; p. 68. [Google Scholar]
  64. Churchill, D.J.; Carnwath, G.C.; Larson, A.J.; Jeronimo, S.A. Historical Forest Structure, Composition, and Spatial Pattern in Dry Conifer Forests of the Western Blue Mountains, Oregon; Gen. Tech. Rep. PNW-GTR-956; USDA Forest Service, Pacific Northwest Research Station: Portland, OR, USA, 2017; p. 93. [CrossRef]
  65. Turner, R. _deldir: Delaunay Triangulation and Dirichlet (Voronoi) Tessellation. R package Ver. 1.0-6. 2021. Available online: https://CRAN.R-project.org/package=deldir (accessed on 1 December 2022).
  66. Brown, G.S. Point density in stems per acre. Forest Research Institute, New Zealand Forest Service. N. Z. For. Res. Notes 1965, 196, 11. [Google Scholar]
  67. Maclauchlan, L.E.; Borden, J.H. Spatial dynamics and impacts of Pissodes terminalis (Coleoptera: Curculionidae) in regenerating stands of lodgepole pine. For. Ecol. Manag. 1996, 82, 103–113. [Google Scholar] [CrossRef]
  68. Baddeley, A.; Rubak, E.; Turner, R. Spatial Point Patterns: Methodology and Applications with R; Chapman and Hall/CRC Press: London, UK, 2015. [Google Scholar]
  69. Statistics, version 7.0; SYSTAT® for Windows; SPSS Inc.: Chicago, IL, USA, 1997.
  70. Diggle, P.J. Statistical Analysis of Spatial Point Patterns; Oxford University Press: New York, NY, USA, 2003; p. 159. [Google Scholar]
  71. Lydersen, J.M.; North, M.P.; Knapp, E.E.; Collins, B.M. Quantifying spatial patterns of tree groups and gaps in mixed-conifer forests: Reference conditions and long-term changes following fire suppression and logging. For. Ecol. Manag. 2013, 304, 370–382. [Google Scholar] [CrossRef]
  72. Plotkin, J.B.; Chave, J.; Ashton, P.S. Cluster analysis of spatial patterns in Malaysian tree species. Am. Nat. 2002, 160, 629–644. [Google Scholar] [CrossRef]
  73. Larson, A.J.; Churchill, D.J. Spatial patterns of overstory trees in late successional conifer forests. Can. J. For. Res. 2008, 38, 2814–2825. [Google Scholar] [CrossRef]
  74. Larson, A.J.; Stover, K.C.; Keyes, C.R. Effects of restoration thinning on spatial heterogeneity in mixed conifer forest. Can. J. For. Res. 2012, 42, 1505–1517. [Google Scholar] [CrossRef]
  75. Larson, A.J.; Churchill, D.J. Tree spatial patterns in fire-frequent forests of western North America, including mechanisms of pattern formation and implications for designing fuel reduction and restoration treatments. For. Ecol. Manag. 2012, 267, 74–92. [Google Scholar] [CrossRef]
  76. Abella, S.R.; Denton, C.W. Spatial variation in reference conditions: Historical tree density and pattern on a Pinus ponderosa landscape. Can. J. For. Res. 2009, 39, 2391–2403. [Google Scholar] [CrossRef]
  77. Maclauchlan, L.E.; Brooks, J.E. The balsam bark weevil, Pissodes striatulus (Coleoptera: Curculionidae): Life history and occurrence in southern British Columbia. J. Entomol. Soc. B. C. 2020, 117, 3–19. [Google Scholar]
  78. DeLong, S.C.; Sutherland, G.D.; Daniels, L.D.; Heemskerk, B.H.; Storaunet, K.O. Temporal dynamics of snags and development of snag habitats in wet spruce–fir stands in east-central British Columbia. For. Ecol. Manag. 2008, 255, 3613–3620. [Google Scholar] [CrossRef]
  79. Government Province of B.C. Ministry of Forests. Aerial Overview Survey Data. 2022. Available online: https://www2.gov.bc.ca/gov/content/industry/forestry/managing-our-forest-resources/forest-health/aerial-overview-surveys/data-files (accessed on 23 September 2022).
  80. Kenkel, N.C.; Hoskins, J.A.; Hoskins, W.D. Edge effects in the use of area polygons to study competition. Ecology 1989, 70, 272–274. [Google Scholar] [CrossRef]
  81. Hyink, D.M.; Zedaker, S.M. Stand dynamics and the evaluation of forest decline. Tree Physiol. 1987, 3, 17–26. [Google Scholar] [CrossRef] [PubMed]
  82. Fettig, C.; Klepzig, K.; Billings, R.; Munson, S.; Nebeker, T.; Negrón, J.; Nowak, J. The effectiveness of vegetation management practices for prevention and control of bark beetle infestations in coniferous forests of the western and southern United States. For. Ecol. Manag. 2007, 238, 24–53. [Google Scholar] [CrossRef]
  83. Flower, C.E.; Gonzalez-Meler, M.A. Responses of temperate forest productivity to insect and pathogen disturbances. Ann. Rev. Plant Biol. 2015, 66, 547–569. [Google Scholar] [CrossRef]
  84. Seidl, R.; Spies, T.A.; Peterson, D.L.; Stephens, S.L.; Hicke, J.A. Searching for resilience: Addressing the impacts of changing disturbance regimes on forest ecosystem services. J. Appl. Ecol. 2016, 53, 120–129. [Google Scholar] [CrossRef] [PubMed]
  85. Rodman, K.C.; Andrus, R.A.; Carlson, A.R.; Carter, T.A.; Chapman, T.B.; Coop, J.D.; Fornwalt, P.J.; Gill, N.S.; Harvey, B.J.; Hoffman, A.E.; et al. Rocky Mountain forests are poised to recover following bark beetle outbreaks, but with altered composition. J. Ecol. 2022, 110, 2929–2949. [Google Scholar] [CrossRef]
  86. Lertzmen, K.P.; Krebs, C.J. Gap-phase structure of a subalpine old-growth forest. Can. J. For. Res. 1991, 21, 1730–1741. [Google Scholar] [CrossRef]
  87. Franklin, J.F.; Van Pelt, R. Spatial aspects of structural complexity in old-growth forests. J. For. 2004, 102, 22–28. [Google Scholar] [CrossRef]
  88. Boyden, S.; Binkley, D.; Shepperd, W. Spatial patterns in structure, regeneration and mortality of an old-growth ponderosa pine forest in the Colorado Front Range. For. Ecol. Manag. 2005, 219, 43–55. [Google Scholar] [CrossRef]
  89. Schneider, E.E.; Larson, A.J. Spatial aspects of structural complexity in Sitka spruce-western hemlock forests, including evaluation of a new canopy gap delineation method. Can. J. For. Res. 2017, 47, 1033–1044. [Google Scholar] [CrossRef]
  90. Purves, D.W.; Lichstein, J.W.; Pacala, S.W. Crown plasticity and competition for canopy space: A new spatially implicit model parameterized for 250 North American tree species. PLoS ONE 2007, 2, e870. [Google Scholar] [CrossRef]
  91. Thorpe, H.C.; Astrup, R.; Trowbridge, A.; Coates, K.D. Competition and tree crowns: A neighbourhood analysis of three boreal tree species. For. Ecol. Manag. 2010, 259, 1586–1596. [Google Scholar] [CrossRef]
  92. Canham, C.D.; LePage, P.T.; Coates, K.D. A neighbourhood analysis of canopy tree competition: Effects of shading versus crowding. Can. J. For. Res. 2004, 34, 778–787. [Google Scholar] [CrossRef]
  93. Alexander, R.R.; Shearer, R.C.; Shepperd, W.D. Silvical Characteristics of Subalpine Fir; Gen. Tech. Rep. RM-115; USDA Forest Service, Rocky Mountain Forest and Range Experimental Station: Fort Collins, CO, USA, 1984; p. 29. [CrossRef]
  94. Sánchez Meador, A.J.; Parysow, P.F.; Moore, M.M. A new method for delineating tree patches and assessing spatial reference conditions of ponderosa pine forests in northern Arizona. Restor. Ecol. 2011, 19, 490–499. [Google Scholar] [CrossRef]
  95. Parish, R.; Antos, J.A. Dynamics of an old-growth, fire-initiated, subalpine forest in southern interior British Columbia: Tree-ring reconstruction of 2 year cycle spruce budworm outbreaks. Can. J. For. Res. 2002, 38, 1947–1960. [Google Scholar] [CrossRef]
  96. Langs, L.E.; Petrone, R.M.; Pomeray, J.W. Subalpine forest water use behaviour and evapotranspiration during two hydrologically contrasting growing seasons in the Canadian Rockies. Hydrol. Proc. 2021, 35, e14158. [Google Scholar] [CrossRef]
Figure 1. Geographic location of 11 permanent sample plots in southern British Columbia. Inset shows the geographic area in B.C. of the detailed map. Plots are: 1 = Raft River; 2 = Martin Creek; 3 = Scotch Creek; 4 = Sicamous Creek; 5 = Torrent Creek; 6 = Cherry Creek; 7 = Home Lake-1; 8 = Home Lake-2; 9 = Buck Mountain; 10 = Spius Creek-1; and 11 = Spius Creek-2.
Forests 14 00363 g001
Figure 2. Status of subalpine fir over time in 11 plots showing the percentage of live subalpine firs, the percentage killed by D. confusus (WBBB-killed), the percentage killed from other damage agents (dead other), the percentage killed by D. confusus that had fallen (WBBB-down), and the percentage that fell while still alive or were killed by other damage agents (down).
Forests 14 00363 g002
Figure 3. Red bars are the annual hectares (1998–2021) affected by D. confusus in the three forest districts in the Thompson Okanagan Region: Cascades District (Spius Creek-1 and 2); Okanagan Shuswap District (Scotch Creek, Sicamous Creek, Torrent Creek, Cherry Creek, Home Lake-1 and 2, Buck Mountain); and Thompson Rivers District (Raft River, Martin Creek).
Forests 14 00363 g003
Figure 4. The percentage of D. confusus attacked subalpine fir, by phase (early-to-mid phase or mid-to-late) that contained live brood (eggs, larvae, pupae, adults) or beetle emergence after one year, two years, three years, or more than three years in seven plots.
Forests 14 00363 g004
Figure 5. The number of years D. confusus attacked subalpine fir (percent trees) took to transition from green foliage (tree code 1) through to foliage loss, checking, and bark peeling (tree code 6) is shown. The percent of attacked subalpine fir in all 11 plots is grouped by tree codes: 1 = green foliage; 2 = bright red foliage; 3 = dull red foliage; 4 = grey foliage and foliage loss; 5 = grey with fines (little or no foliage and fine branches); and 6 = snag (foliage and fine branches lost with checking and bark peeling).
Forests 14 00363 g005
Figure 6. Comparison of the percentage of D. confusus-attacked subalpine fir containing a brood (new attack) and those no longer containing a brood (old attack) at stand establishment and final assessment. Density at establishment is also shown. The new attack includes tree codes 1–3 and old attack includes tree codes 4–5.
Forests 14 00363 g006
Figure 7. Relationship of subalpine fir stems per hectare (sph) at establishment and total subalpine fir killed by D. confusus (sph) at the final assessment, for 11 plots in southern interior B.C..
Forests 14 00363 g007
Figure 8. Blue box plots show diameter at breast height (dbh) of subalpine fir dead from other causes (standing and down), killed by D. confusus (standing and down), and standing live trees showing mean (X), median (line), and range.
Forests 14 00363 g008
Figure 9. Cumulative downed subalpine fir recorded at each assessment time expressed as a percentage of the total live and dead subalpine firs at plot establishment.
Forests 14 00363 g009
Figure 10. Change in Voronoi tile area (m2, mean ± S.E.), as “area potentially available” to individual healthy trees (tree code = 0, all species) for the 11 one-hectare plots. Measured change is from time of plot establishment (Time 1) to most recent assessment (Time 2). The range of years between Times 1 and 2 was 7–15.
Forests 14 00363 g010
Figure 11. Voronoi tile plots of all live trees (all species) in the Buck Mountain plot at plot establishment (Buck Mountain Time 1) and the 2013 assessment (Buck Mountain Time 2).
Forests 14 00363 g011
Figure 12. “Empty space distance” maps for all live trees, all species, for the Buck Mountain plot. Time 1 (left) is the plot establishment (1999) and Time 2 (right) is the 2013 assessment. The side ribbons are in meters. Subalpine fir = +; spruce = X; dead trees = C (tree codes 1–7). Dead trees (C) are an overlay on the map and do not factor into the actual distance calculations.
Forests 14 00363 g012
Table 1. Geographic location, latitude, longitude, biogeoclimatic classification, elevation (meters), D. confusus infestation phase, year of establishment, and years of assessment for 11 one-hectare plots in southern interior British Columbia.
Plot No. and LocationLatitudeLongitudeBEC 1 UnitElevation (m)Infestation Phase 2Establishment and Assessments (Years) 3
1. Raft River51°52’57.62” N119°33’11.35” WESSFwc1503Early to mid-2012, 2019
2. Martin Creek51°44’15.43” N119°39’0.20” WESSFwc1675Early2000–2004, 2009, 2013, 2019 *
3. Scotch Creek51°9’58.52” N119°12’26.91” WESSFwc1575Mid- to late2002–2004, 2011, 2020
4. Sicamous Creek50°49’47.13” N118°49’51.19” WESSFwc1650Late1998–2004, 2009, 2013, 2019
5. Torrent Creek50°34’26.81” N118°34’9.97” WESSFwc1750Mid- to late1998–2004, 2008, 2013, 2019
6. Cherry Creek50°18’33.51” N118°29’8.74” WESSFwc1650Late1998–2004, 2009, 2013, 2019
7. Home Lake-150°4’0.28” N118°48’47.61” WESSFxc1800Mid-1999–2004, 2008, 2013 *
8. Home Lake-250°5’57.15” N118°46’52.55” WESSFxc1750Mid-1999–2004, 2008, 2013, 2020 *
9. Buck Mountain50°5’21.63” N118°52’55.69” WESSFxc1725Early to mid-1999–2004, 2009, 2013, 2020
10. Spius Creek-149°58’42.76” N121°10’35.36” WESSFmw1470Mid-2002–2004, 2008, 2013, 2019
11. Spius Creek-249°59’11.99” N121°8’39.54” WESSFmw1610Early2002–2004, 2008, 2013, 2019
1 Biogeoclimatic ecosystem zone and subzone classification: Engelmann spruce-subalpine fir zone. Subzones are wet-cold (wc), very dry-cold (xc), and moist-warm (mw). 2 Infestation phase = an estimate of the point in the D. confusus outbreak cycle at the time of plot establishment. 3 Three plots with * were fully or partially logged prior to the 2019–2020 assessment.
Table 2. Tree codes for describing subalpine fir trees are listed. Tree codes 1–6 and 10 indicate subalpine fir attacked and killed by D. confusus. Tree codes 7 and 11 indicate mortality due to other pests or unknown causes.
Tree CodeTree Code Description
0healthy, standing live tree
1green foliage with current D. confusus attack
2brick red foliage
3faded, dull red foliage
4grey with fine branches and a few red needles remaining on tree
5grey without fine branches, just larger branches still intact
6snag—losing bark, sapwood checking
7dead—other damage agent or unknown cause
10windthrow—previously attacked by D. confusus
11windthrow—no D. confusus attack prior to falling
Table 3. Average age (± standard error) (S.E.) of subalpine fir (Bl) and spruce (Sx) (corrected to 2020) in 11 plots; total number of subalpine fir and spruce (live and dead) at establishment (Time 1); and percent dead subalpine fir at Time 1 (plot establishment) and Time 2 (final assessment). The final assessment was conducted in 2019 and 2020 except for Home Lake-1 and 2 where the final assessment year was 2013. The Martin Creek plot was partially logged prior to the 2019–2020 assessment; therefore, Time 2 percentages were corrected to reflect fewer trees in this plot.
At Establishment% Bl Dead (All Causes)
Plot1st to Final Assessment (# Years)Year Cores CollectedNo. Cores (Bl)Avg. Age Bl (± S.E.)Bl Age RangeAvg. Age Sx (± S.E.) and (N)Bl (# Live & Dead)Bl & Sx (# Live & Dead)Time 1Time 2
1. Raft River7201225149 ± 1097–248273 ± 43 (5)57087024.960.0
2. Martin Creek1920014489 ± 374–16485 ± 4 (10)1161141725.071.0
3. Scotch Creek18200326114 ± 383–138115 ± 6 (8)66572450.580.2
4. Sicamous Creek21200121136 ± 798–201123 (1)73293050.178.4
5. Torrent Creek21201319126 ± 1167–243101 ± 2 (4)51459730.747.3
6. Cherry Creek21200128124 ± 571–209197 ± 45 (4)42549658.670.2
7. Home Lake-114200141148 ± 595–259 995120239.179.8
8. Home Lake-214200129127 ± 482–212155 ± 15 (9)1149131344.179.0
9. Buck Mountain21200132122 ± 388–164 1215131738.479.1
10. Spius Creek-117200242184 ± 5121–284179 ± 9 (13)61478539.748.1
11. Spius Creek-21720026180 ± 9153–211 67484116.940.4
Table 4. The percentage of subalpine fir (Bl) dead due to D. confusus or other causes at plot establishment and final assessment, and the annual rate of mortality from D. confusus alone and from all causes combined.
% Bl at Establishment% Bl at Final AssessmentAnnual Rate of Mortality (%)
Plot 1Dead Due to D. confususDead Other CausesLiveDead Due to D. confususDead Other CausesD. confususAll Causes
1. Raft River13.311.640.034.026.03.05.0
2. Martin Creek13.411.529.042.628.51.52.4
3. Scotch Creek27.223.219.842.138.10.81.7
4. Sicamous Creek33.316.821.652.026.40.91.3
5. Torrent Creek16.913.852.727.020.30.50.8
6. Cherry Creek50.08.829.854.316.00.20.5
7. Home Lake-1 120.918.220.253.926.02.42.9
8. Home Lake-2 122.821.221.348.630.63.52.2
9. Buck Mountain14.524.020.944.634.51.41.9
10. Spius Creek-128.011.751.933.115.00.30.5
11. Spius Creek-211.55.359.627.612.80.91.4
1 2013 was the final assessment year.
Table 5. The estimated percentage of live subalpine fir and stems per hectare (sph) of D. confusus-killed subalpine are listed for the three outbreak phases.
Phase% sph Live Bl% sph D. confusus-Killed
Early~80+%~10%
Mid~50%–70%~15%–30%
Late<50%>30%
Table 6. The average and median number of years from D. confusus attack to snag (tree code 6) in plots; the average number of years for trees killed by D. confusus and other factors to fall.
Attack to Snag# Years Dead to Down
(Avg. ± S.E.)
PlotN# Years
(Avg. ± S.E.)
MedianD. confususOther Factors
1. Raft River977-7
2. Martin Creek9812.7 ± 0.41314.1 ± 0.511.4 ± 1.1
3. Scotch Creek2210.2 ± 0.7914.2 ± 0.812.0 ± 0.9
4. Sicamous Creek5214.4 ± 0.51615.2 ± 0.913.2 ± 1.4
5. Torrent Creek6151513.8 ± 1.914.3 ± 1.6
6. Cherry Creek3113.3 ± 0.61416.3 ± 1.112.3 ± 2.2
7. Home Lake-1 19511.5 ± 0.21211.2 ± 0.47.0 ± 6.0
8. Home Lake-2 118212.4 ± 0.21312.8 ± 0.49.1 ± 1.6
9. Buck Mountain9910.4 ± 0.31115.1 ± 0.414.7 ± 0.6
10. Spius Creek-11616.5 ± 0.4175.0 ± 0.015
11. Spius Creek-21310.8 ± 0.81112.8 ± 0.89.3 ± 1.8
All plots combined62312.1 ± 0.11214.0 ± 0.212.8 ± 0.4 2
1 2013 was the final assessment year. 2 The average number of years from death to down (all plots combined) for D. confusus-killed trees and trees killed by other causes is significantly different (t-test, p < 0.01).
Table 7. An estimate of the merchantable volume of live subalpine fir, spruce, and other species in plots at the time of establishment (Time 1) and final assessment (Time 2). Additionally, an estimate of all dead volume (from all causes) in each plot, and volume killed by D. confusus at Time 1; between Time 1 and Time 2; and the average annual mortality (m3) from D. confusus between Time 1 and Time 2.
Merchantable Volume (m3)
LiveDeadD. confusus Killed
PlotSpeciesTime 1Time 2Cumulative (all Causes)At Time 1Time 1 to Time 2Avg. vol./Year
1. Raft RiverBl140.576.0163.829.583.810.5
1. Raft RiverSx115.8135.86.6
1. Raft Riverother31.442.70.3
2. Martin CreekBl159.481.7264.339.8169.58.5
2. Martin CreekSx56.870.616.3
3. Scotch CreekBl152.987.1376.394.5153.48.1
3. Scotch CreekSx38.154.530.5
3. Scotch Creekother0.10.70.6
4. Sicamous CreekBl179.9107.7410.6149.6175.68.0
4. Sicamous CreekSx95.1155.413.6
5. Torrent CreekBl177.8208.3272.395.196.44.4
5. Torrent CreekSx49.973.214.9
6. Cherry CreekBl169.8157.9377.8239.779.73.6
6. Cherry CreekSx62.091.218.0
7. Home Lake-1Bl205.058.1354.850.2235.815.7
7. Home Lake-1Sx136.9158.215.9
8. Home Lake-2Bl190.763.7344.874.5193.412.9
8. Home Lake-2Sx99.025.920.1
9. Buck MountainBl173.786.0379.961.2205.99.4
9. Buck MountainSx99.9111.334.6
10. Spius Creek-1Bl142.6137.0203.792.573.64.1
10. Spius Creek-1Sx93.2118.185.6
10. Spius Creek-1other0.40.83.4
11. Spius Creek-2Bl203.5182.1214.230.7133.97.4
11. Spius Creek-2Sx63.289.4136.6
11. Spius Creek-2other1.62.77.8
Table 8. Empty space radial distances measured for live healthy trees, all species, at time of plot establishment (Time 1) and at most recent assessment (Time 2) for the 11 plots combined. Bins open on the left side. Average bin size and frequency as % of total bin counts. The range of years between Times 1 and 2 was 7–15.
Bins (Meters)
Time(1,3](3,5](5,7](7,9](9,11](11,13](13,15]
171.3123.254.40.820.170.040
256.9831.279.12.150.380.090.03
Disclaimer/Publisher’s Note: The statements, opinions and data contained in all publications are solely those of the individual author(s) and contributor(s) and not of MDPI and/or the editor(s). MDPI and/or the editor(s) disclaim responsibility for any injury to people or property resulting from any ideas, methods, instructions or products referred to in the content.

