Article

Further Test of Pneumatic Method in Constructing Vulnerability Curves Using Six Tree Species with Contrasting Xylem Anatomy

1
South China Botanical Garden, Chinese Academy of Sciences, Guangzhou 510650, China
2
College of Forestry, Northwest A&F University, Yangling 712100, China
3
College of Life Sciences, Northwest A&F University, Yangling 712100, China
4
Qinling National Forest Ecosystem Research Station, Northwest A&F University, Yangling 712100, China
*
Author to whom correspondence should be addressed.
Forests 2023, 14(2), 293; https://doi.org/10.3390/f14020293
Submission received: 9 January 2023 / Revised: 29 January 2023 / Accepted: 31 January 2023 / Published: 2 February 2023
(This article belongs to the Special Issue Tree Water Physiology and Ecology - Xylem Structure and Function)

Abstract

:
The pneumatic method is a novel method determining vulnerability to embolism in plants, yet it remains unclear whether this method is suitable for all species with different xylem anatomy. In this study, using six tree species with contrasting xylem anatomy, including four vessel-bearing species (diffuse-porous wood and ring-porous wood) and two tracheid-bearing species (non-porous wood), we test the reliability of the pneumatic method by comparing to hydraulic methods and also considering turgor loss point and native embolism. Vessel length distribution and cut-open vessel volume were also evaluated using the silicone injection technique. Additionally, we also synthesized published data to find out the consistency between the pneumatic method and hydraulic methods. Results showed that there was a maximum 10-folds difference in mean vessel length and mean vessel diameter varying from 30 to 56 μm among species. The estimated open vessel volume ranges from 0.064 to 0.397 mL, with a maximum of 14% of the tube vacuum reservoir. For four vessel-bearing species, the pneumatic method showed good consistency with hydraulic methods, and this consistency was evidenced by turgor loss point and native embolism. For two tracheid-bearing species, the pneumatic method significantly overestimated vulnerability because of the bad consistencies with hydraulic methods and plant water relations. Data synthesis of 56 species also suggested that the pneumatic method can accurately measure the embolism vulnerability of vessel-bearing species but not for tracheid-bearing species. Our study provided further evidence that the pneumatic method is accurate for most vessel-bearing species and thus has the potential to be widely used in the plant hydraulics field. However, we proposed that the precise calculation of air discharge volume should take into account the volume of open vessels for species with wide and long vessels.

1. Introduction

In recent years, extreme events such as drought and heat waves have increased in the context of climate change, leading to the increase in tree mortality on a global scale and hence the decline of forest ecosystems [1,2]. One of the main triggers of tree death under drought is the catastrophic embolism in the xylem conduits [1,3]. Therefore, as a core functional trait, the embolism resistance of a tree plays a very important role in survival under drought [4]. This trait can be measured by constructing embolism vulnerability curves (VCs), which represent a relationship between embolism levels and water potential [5].
In the past decades, many kinds of methods have been developed to construct VCs [6]. They are different in the ways of embolism induction and measurements. The most frequently used methods for the construction of branch VCs include bench dehydration [7], air injection [8], and centrifuge [9,10,11,12,13]. Bench dehydration is the most classical method, which simulates the process of embolism caused by the natural dehydration of plants under drought stress. This method is accurate and generally considered a reference technique for the validation of other VCs methods [14]. However, this method is time-consuming and destructive, and improper operation in the determination of embolism could easily cause artifacts [15,16,17]. Alternatively, the air injection method induces embolism by positive pressure, which could save much time compared with the dehydration process. However, it was considered that too short excised stem segments could overestimate vulnerability [18], and artifacts could be introduced at the moment of pressure release [19]. The centrifuge is the most commonly used method because of the advantages of high throughput, especially for flow-centrifuge [11,12]. Although it is capable of constructing VCs of short-vesseled species and tracheid-bearing species [20], it has been proved that this method substantially overestimated long-vesseled species because of the presence of open vessels [20,21,22,23]. On the whole, in addition to improving and standardizing current methods, the field of plant hydraulics should also develop and take advantage of novel techniques [14].
For the above three methods, embolism degrees were usually evaluated by measuring the percent loss of maximum hydraulic conductivity (PLC). In fact, the water in the previous functional conduits was replaced by air when the embolism occurred, and the air volume would increase in proportion to the embolism degrees. Inspired by this fact, a new method was designed to estimate embolisms based on airflow measurements of branches, i.e., the pneumatic method [24]. Since the amount of air and water potential are monitored simultaneously and repeatedly on the same branch, this method allows us to construct one entire VCs by using only one branch, which makes this method less destructive than the bench dehydration method. In addition, since the measurement of air discharge at one time only takes less than one minute and can be automated, this method can measure multiple samples at the same time, which would save us lots of time and prevent some artifacts caused by manual operation [25].
High time resolution, fully automatic, low cost, portable, and simple data analysis represent the main advantages of the pneumatic method [25,26]. Interested in these advantages, some studies have already tested the reliability of this method on the level of branches [24,25,27,28,29,30], leaves [25,31], and roots [32]. Moreover, these studies reported inconsistent results. For example, a study on temperate trees found that the pneumatic method can correctly estimate all of their studied vessel-bearing species [28], but there is also a study that concluded that this method might not be suitable for some long-vesseled ring-porous species [27]. A study on tropical trees and lianas (with short to long vessels) found that the pneumatic method substantially overestimated the vulnerability of all species [29]. Since the numbers, diameters, and lengths of conduits directly determined the air volume of a branch, the inconsistent results may be explained by different xylem anatomy. Additionally, the presence of open vessels when a branch is cut off may also relate to the accuracy of the pneumatic method [29]. Therefore, further work is needed to verify whether this method is applicable to all species with different xylem architecture.
To validate the VCs, besides the direct comparison of different methods, it is also important to examine whether plant water relations are in line with the vulnerability predicted by VCs. Since previous studies have proved that stomata can close timely to protect the xylem from the runaway of embolism [33,34,35], and the water potential causing 90% stomatal closure was well in line with the leaf turgor loss point (TLP) [27,33], TLP was used for the reliability test of VCs. Additionally, since the xylem should diurnally operate within a range of water potential, the minimum value a plant experiences in the diurnal cycle of water potential, i.e., the midday xylem water potential and the corresponding native embolism are useful to validate VCs [22].
In this study, we selected six tree species with contrasting xylem anatomy considering the hydraulic methods as a reference, including four vessel-bearing species (diffuse-porous and ring-porous wood) and two tracheid-bearing species (non-porous wood). Firstly, we examined their differences in xylem anatomical traits related to vessel length and diameter based on the silicone injection technique and also estimated the cut-open vessel volume. Secondly, we compared VCs and the parameters obtained from hydraulic and pneumatic methods. In this step, data synthesis, combing published literature and our data, was also conducted to figure out the consistency between the hydraulic and pneumatic methods in a broad range of species. Additionally, we estimated leaf turgor loss point and midday native PLC of terminal branches and checked whether these parameters correspond well with plant vulnerability measured by two methods. The main objectives of our study were to: (1) evaluate if there is consistency between the hydraulic and pneumatic methods and if inconsistencies can be explained by contrasting xylem anatomies and (2) if the vulnerability traits estimated using these two methods are consistent with other hydraulic traits such as native embolism and turgor loss point.

2. Materials and Methods

2.1. Plant Material

Plant material was collected at the nursery and campus of Northwest A&F University (Yangling, China; 34°16′ N, 107°59′ E). Six tree species were chosen based on their contrasting xylem anatomy, i.e., four vessel-bearing species (two species with diffuse-porous wood (Populus spp. and Liriodendron chinense) and two species with ring-porous wood (Quercus variabilis and Robinia pseudoacacia)), and two tracheid-bearing species (with non-porous wood, Metasequoia glyptostroboides, and Ginkgo biloba). Populus spp. is a hybrid issued from I-101 (Populus alba) × 84K (P. alba × P. tremula var. glandulosa) and planted at the nursery of Northwest A&F University in 2017 (i.e., 4-year-old), and the other five species are mature trees. All experiments were performed from June to October 2020.

2.2. Conduit Length and Diameter

For four vessel-bearing species, the mean vessel length was measured using the silicone injection technique [36]. Briefly, five current-year or one-year-old branches per species were cut in the morning and recut under water into segments with 30–50 cm in length and about 6 mm in basal diameter, and then flushed with 10 mM degassed KCl under a pressure of 0.12 MPa for 30 min to remove the native embolism that may affect the injection of silicone. Silicone was freshly mixed from RTV 141 A and RTV 141 B (BLUESIL RTV14; Bluestar Silicones, Lyon, France) in the proportion 10:1. A fluorescent whitening agent, i.e., Uvitex (Ciba Uvitex OB; Ciba Specialty Chemicals, Tarrytown, NY, USA), was added to the mixture to make it visible under UV light. The silicone was injected at 0.12 MPa for 24 h before curing at room temperature for at least 48 h. Then, 25 μm transverse sections were made at a series of certain distances from the injection surface (x, cm) using a microtome (Leica RM2235, 81, Germany). Images were acquired using the Leica Application Suite (Version 6.0.0, Lumenera Corporation, Ottawa, ON, Canada) under UV light at 50× magnification by a microscope (Leica DM4000B, Germany) with a digital camera (Leica, DFC450, Germany). The acquired images were analyzed with WinCELL Pro 2012a (Regent Instruments Inc., Quebec City, QC, Canada) to quantify the number of injected vessels per unit area (N, n mm−2) and the lumen area of each injected vessel (A). Mean vessel length (Lmean) was determined using the slope of the linear regression between Ln(N) and x according to −2/slope. Diameter of injected vessels at x was calculated as 4 A π , and the averaged diameter of all injected vessels (Din, μm) was calculated. Mean diameter of all vessels (Dmean) was equal to Din at x = 0.2 cm, and vessel density (VD) was equal to the vessel numbers per unit area at x = 0.2 cm. Then, we established the relationship between Din and x to qualitatively describe whether longer vessels are wider vessels in our measured tree species.
For two tracheid-bearing species, five one-year-old branches per species were sampled. The tracheid length was measured by the wood maceration method [37]. Five stem segments with a diameter of about 6 mm and a length of about 1 cm were prepared. They were divided into two parts with a blade and put into a mixture (80% acetic acid and 30% hydrogen peroxide in 1:1). The mixture was placed in an oven at 60 °C for 48 h, and then one drop of the maceration solution was taken for photographing at 50× magnification under a microscope. WinCELL Pro 2012a was used for the determination of tracheid length. For tracheid diameter, 20 μm sections were cut and photographed. Mean tracheid diameter (Dmean) and density were analyzed by WinCELL Pro 2012a.

2.3. Volume Estimation of Open Vessels Reservoir

Because the tracheid is much shorter than the vessel, the volume of the open tracheid is negligible, and therefore the volume of open conduits was only measured on four vessel-bearing species. Since the silicone does not penetrate pit membranes between vessels [36], the silicone can only be injected into open vessels. Therefore, we can estimate the volume of open vessels via the algorithm involved in the silicone injection technique.
The number of injected vessels per unit area at x (N, n mm−2) would decay exponentially along the distance from the injection point; thus, N at the distance x can be calculated as:
N = N 0 exp k x
where N0 is the vessel number per unit area at the injection surface; here, it is taken as the count number at 0.2 cm; k is a constant, which is the slope of the linear regression between Ln(N) and x.
The difference of N at x1 and x2N) gives the number of open vessels per unit area that is shorter than or equal to x2:
Δ N = N 0 exp k x 1 exp k x 2
In order to improve the precision of estimation, we used the distance difference of 0.01 cm for diffuse-porous species (i.e., x2x1 = 0.01 cm) and 0.1 cm for ring-porous species (i.e., x2x1 = 0.1 cm).
The diameter of open vessels at the same injection point can be calculated from the former relationship between Din and x by taking x2 as x. Assuming the xylem at one injection point is assembled with vessels with an equal diameter of Din, and these vessels are regular cylinders through their entire lengths, then the open vessels volume of ΔN vessels (Vi, mL) can be calculated as:
V i = Δ N   π 0.5 D in 2 x 2 / 10 8
The total open vessel volume per unit xylem area of a branch (V, mL) is the summation of Vi from 0 to x:
V = V i
Finally, we estimate the volume of the open vessels reservoir of a branch by assuming this branch is with a diameter without bark of 6 mm (proximal end) and a pith diameter of 2 mm. This mode branch is similar to branches used for pneumatic measurements. Xylem area (Axylem) of the mode branch can be calculated at approximately 25 mm2. Then, the total open vessel volume of the branch can be obtained by multiple V by Axylem.

2.4. Vulnerability Curves via Hydraulic Methods

VCs of two diffuse-porous species and two tracheid species were constructed by a flow-centrifuge equipped with a 274 mm rotor (Model H2100R, Xiangyi Inc., Changsha, China). This centrifuge is an upgraded version of Cavitron [12] with a precious temperature control system. For each species, five branches longer than 1 m were collected before dawn to avoid artificial air-filled conduits caused by cutting branches under tension [15]. A stem segment with a diameter of 6–7 mm and a length of 274 mm was cut underwater. The segment was flushed with 10 mM KCL solution for 30 min to remove air in the conduits. The pressure used for flush was 130–200 kPa depending on tree species. Pre-experiment indicated that the time and pressure used for flush were appropriate to obtain maximum hydraulic conductivity (Kmax). Then, we put the branches into the centrifuge and stabilized them for about 10 min to reach a constant temperature of 25 °C. All later measurements were performed at this temperature. The rotational speed was firstly set at 1000 rpm (the corresponding xylem water potential, i.e., Ψx, is −0.083 MPa) to obtained Kmax, and then gradually increased and stabilized for 2 min. The measurements were repeated at each speed until the PLC reached 95%. PLC and Ψx was fitted using the sigmoid function (Equation (1)). Six branches were tested for each tree species.
PLC = 100 1 + exp S 25 Ψ x P 50
where Ψx is xylem water potential, P50 is the Ψx when the PLC is equal to 50%, and S (% PLC MPa−1) is the slope of the curve.
Since the maximum vessel lengths of Robinia pseudoacacia and Quercus variabilis are much larger than the rotor length, in order to avoid artificial centrifuge VCs caused by open vessels [20,21], their VCs were constructed by the bench dehydration method [7,22]. The detailed standard protocol of this method was described in https://prometheusprotocols.net/function/water-relations/xylem-vulnerability-curves/quantification-of-vulnerability-to-xylem-embolism-bench-dehydration/ (accessed on 8 June 2020). Briefly, branches with a total length about 2 m were collected before dawn after a heavy rain to obtain initial water potential as high as possible. Then, it was packed in a black plastic bag, humidified with wet paper towels, and sent to the laboratory within 30 min. The branch was dehydrated at room temperature. Before dehydration, current-year segments were marked for PLC measurements, and three leaves around the segment were wrapped in cling film and aluminum foil for water potential measurement. Before measuring the water potential, the whole branch was put into a black plastic bag for at least 1 h to equalize the pressure between stems and leaves. Water potential was measured with a pressure chamber (model 1505D; PMS Instruments Co., Corvallis, OR, USA). Several cuts along the length of the branch before the final cut were made underwater to eliminate potential cutting artifacts [15]. The PLC of the segment was measured with a low-pressure flow meter. Firstly, the hydraulic conductivity was measured at 3 kPa; then, the segment was flushed at 150 kPa to remove all air bubbles and measured again to obtain the PLC value. About 20 branches per species were measured, and PLC and xylem water potential were fitted with Equation (5).

2.5. Vulnerability Curves via Pneumatic Method

An automated pneumatic apparatus, i.e., Pneumatron, was made according to [25] (Figure S1). For each species, three branches with a length of 80–150 cm and a basal diameter of 7–10 mm were collected and connected to the Pneumatron with a clamp. Glue (Loctite 431) was applied to the connection to prevent air leakage. Measurements were then performed automatedly every 15 min. An absolute pressure of 35–40 kPa was applied to the vacuum reservoir (about 2.8 mL) at each measurement. The initial recorded pressure (Pi, kPa) and final pressure (Pf, kPa) after 15 s air discharge were used for the calculation of equivalent air discharge volume (AD, μL) at atmospheric pressure (Patm, 98.5 kPa at our study site) according to the ideal gas law:
AD = P f V r P i V r P atm 10 6 ,
where Vr is the volume of vacuum reservoir (L).
The minimum AD (ADmin) was obtained when the branch was fully hydrated, and the maximum AD (ADmax) was obtained when the AD increased very little as the dehydration progressed. The percentage of maximum air discharged (PAD, %) was calculated according to the following equation:
PAD = 100 AD AD min ) / ( AD max AD min
During the period of AD measurements, the xylem water potential was measured with a dew point water potential meter (HR-33T, Wescor Inc., Logan, UT, USA) at a time interval of 15 min to several hours, depending on the condition of dehydration. The relationship between PAD and xylem water potential was fitted using Equation (5).

2.6. Leaf Water Potential at Turgor Loss Point

Branches were collected in the evening, recut under water, and hydrated overnight. The pressure–volume curve of the leaf was constructed following Tyree and Hammel [38], and TLP was calculated. Five leaves were measured for each species.

2.7. Native Xylem Pressure and Embolism

We measured the midday water potential (Ψmd) and the corresponding native embolism during the summer drought at our site. Ψmd was measured at 13:00–14:00 h on three successive sunny days. After Ψmd measurements, native PLC at midday (NPLCmd) was also measured. Two hours prior to the measurements, three long branches exposed to sunlight of each species were selected, and three leaves per branch were wrapped with cling film and aluminum foil to balance the pressure between leaf and stem. Xylem water potential was measured in the field using a portable pressure chamber (1515D; PMS Instruments Co., Corvallis, OR, USA). Then, the branches were cut and brought to the laboratory in 30 min, and PLC was measured following the protocol of bench dehydration described above. The hydraulic safety margin was calculated as the difference between Ψmd and TLP.

2.8. Data Synthesis

In order to reveal the reliability of the pneumatic method compared with hydraulic methods in a large range of species, we synthesized our P50 data and published literature that reported the comparison between the pneumatic method and hydraulic methods. Values were averaged for the same species from the same literature. Datasets covered 56 tree species, including 48 vessel-bearing species and 8 tracheid-bearing species (Datasets S1).

2.9. Statistical Analyses

The differences in hydraulic parameters between hydraulic and pneumatic were tested by Student’s t-test. Specifically, Student’s t-test of two independent samples was used to test the differences in VCs parameters between the flow centrifugal method and the pneumatic method. One-sample t-test was used to test the difference between the bench dehydration method and the pneumatic method because only one single vulnerability curve was available for the bench dehydration method. The prediction of PLC was obtained by substituting native midday xylem water potential in the sigmoid function of VCs, and Student’s t-test was used to test whether there is a significant difference between predicted PLC and measured native PLC. p < 0.05 indicates significant differences in this study.

3. Results

3.1. Xylem Anatomy and the Volume of Open Vessels Reservoir

The six tree species showed contrasting xylem anatomical traits in terms of conduit size, including mean conduit length and diameter (Table 1). Lmean of two ring-porous species was much larger than two diffuse-porous species. Q. variabilis has the largest Lmean (38.08 ± 2.80 cm), which was ten times longer than that of L. chinensis (3.74 ± 0.24 cm). Similarly, the Dmean of two ring-porous species was around 50 μm, which was clearly larger than two diffuse-porous species (around 30 μm). Two tracheid-bearing species showed much different xylem anatomical traits from vessel-bearing species. Tracheid lengths of the two species were shorter than 2 mm, and the tracheid diameter was about half that of diffuse-porous species.
Tree species with contrasting wood types showed a clear difference in the volume of the open vessels reservoir (V) (Figure 1). V of ring-porous species is much greater than diffuse-porous species. Q. variabilis showed the maximum V (0.397 mL), which was six times greater than the minimum V (I-101 × 84K, 0.064 mL).

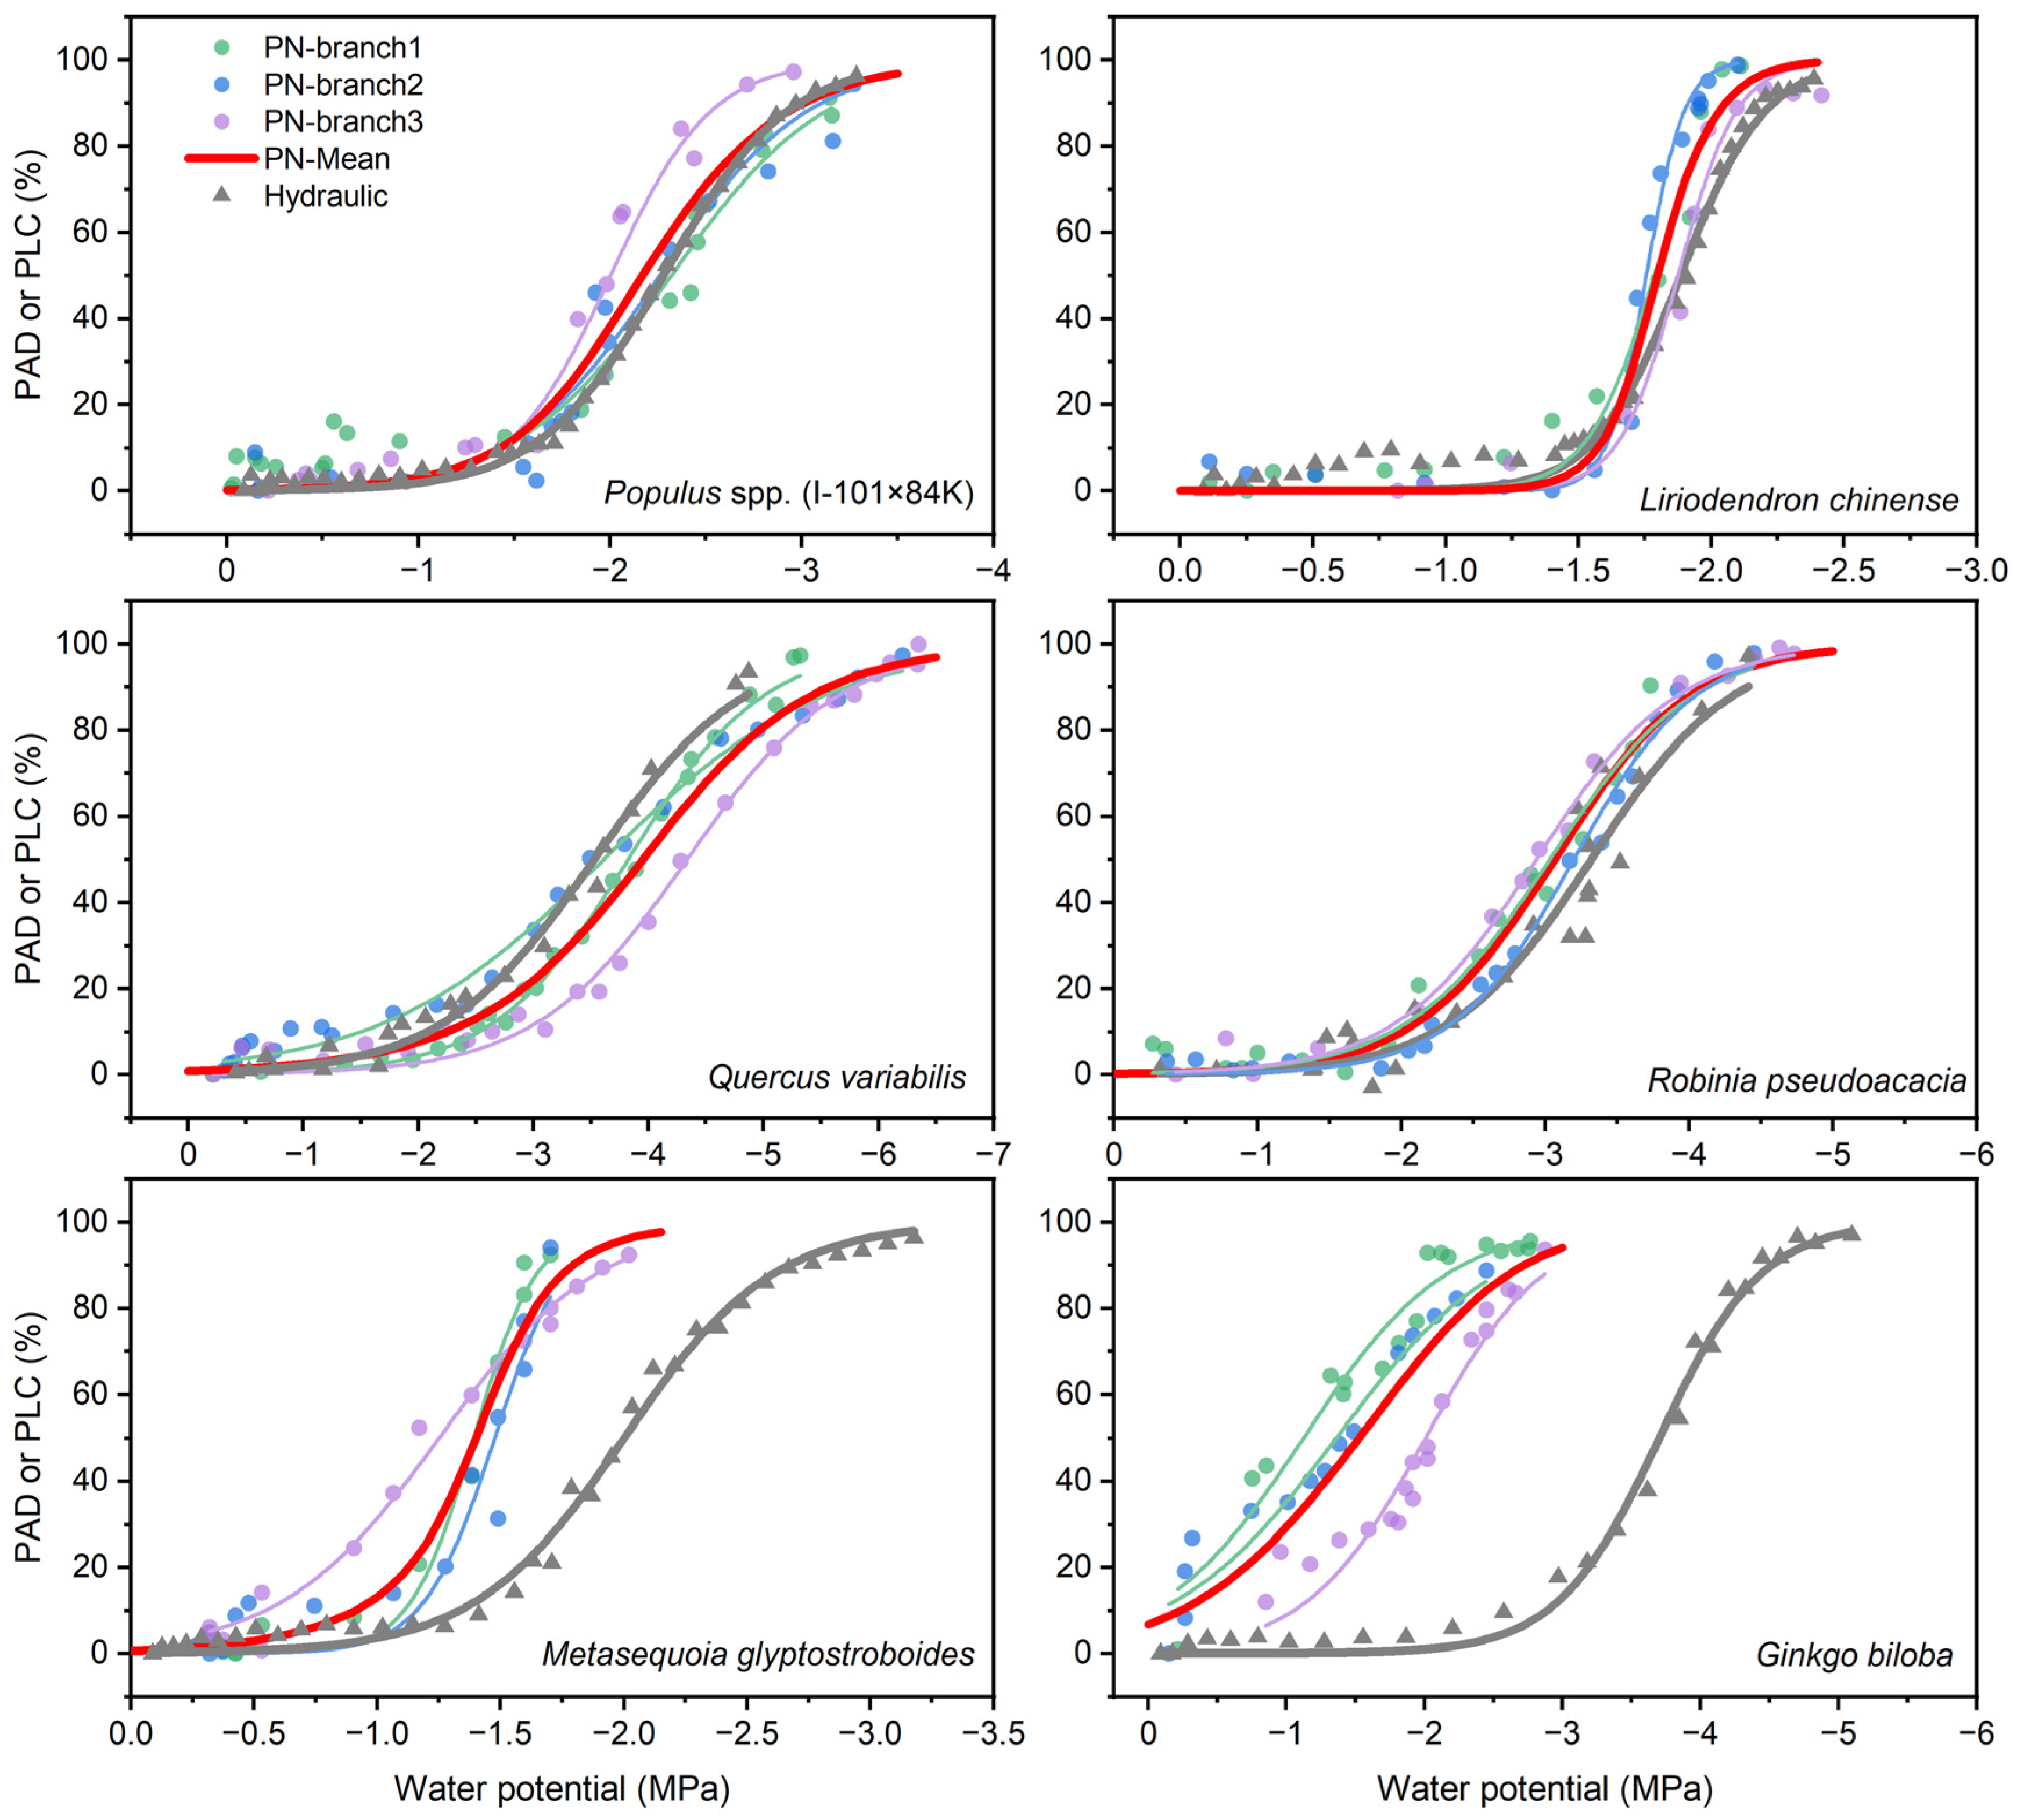
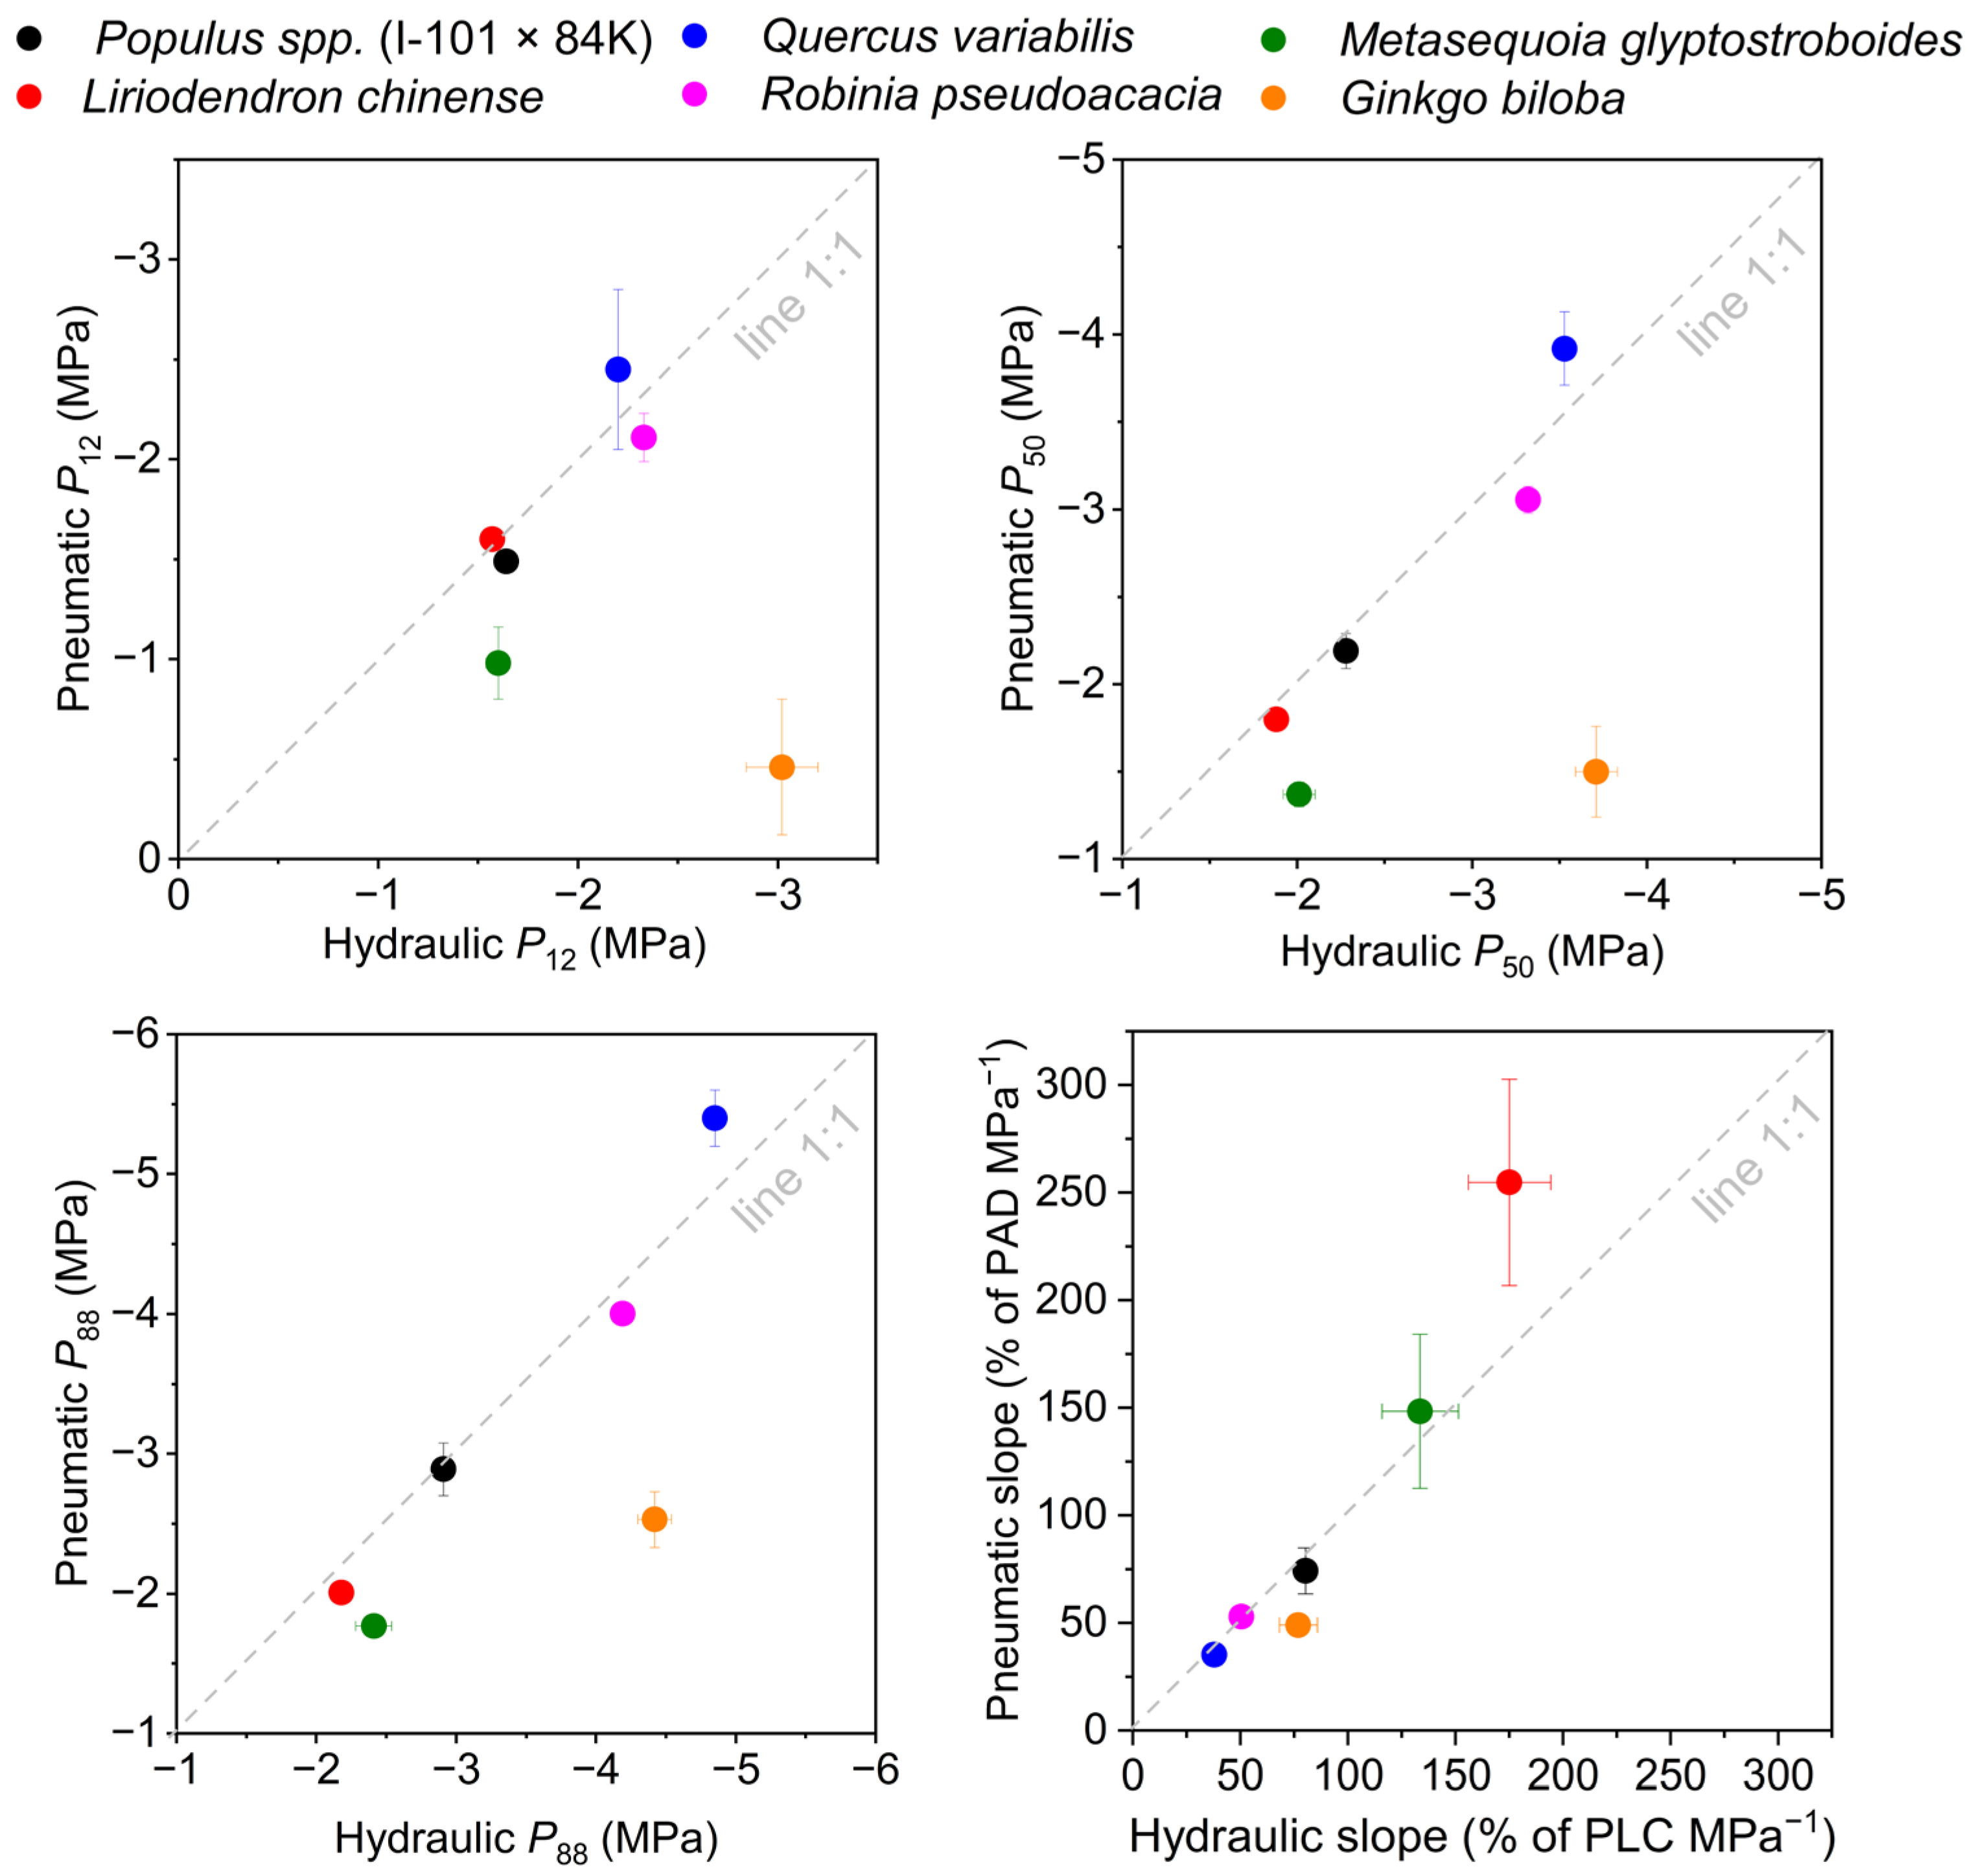
3.2. VCs Constructed by Pneumatic and Hydraulic Methods

Overall, the studied species presented a wide range of embolism resistance; for example, P50 of hydraulic methods ranges from −1.88 MPa to −3.71 ± 0.15 MPa for L. chinense and G. biloba, respectively (Table 2). VCs of the six tree species constructed by the two methods all showed sigmoidal patterns (Figure 2). Three replications of the pneumatic method for vessel-bearing species showed good consistency, while two tracheid-bearing species showed relatively larger variations, especially for G. biloba. VCs of four vessel-bearing tree species showed high consistency between the two methods, especially for two diffuse-porous tree species. By contrast, the VCs of two tracheid-bearing species were greatly divergent, especially for G. biloba.
The paired plots of hydraulic parameters between the two methods showed that P12, P50, and P88 were aligned on the 1:1 line only for the four vessel-bearing species (Figure 3). In addition, the slope of six species was aligned on the 1:1 line much better than P12, P50, and P88, indicating the high consistency of the VCs slope between the two methods. The results of Student’s t-tests showed that the significant differences in hydraulic parameters between the two methods only existed in two tracheid-bearing species, and no species showed a clear difference in the slope of VCs (Table 2). Synthesis of P50 data of 56 species measured by hydraulic and pneumatic methods showed that the pneumatic P50 of the majority of species was consistent with hydraulic P50. However, there are still a few vessel-bearing species, and most of the tracheid-bearing species deviated from the 1:1 line (Figure 4).

3.3. Reliability Test via Water Relations

The relationship between the TLP and P12 obtained with two methods showed that TLP and hydraulic P12 was well aligned on the 1:1 line; by contrast, TLP and pneumatic P12 were well aligned on the 1:1 line only for four vessel-bearing species, and two tracheid-bearing species deviated from 1:1 line, especially for G. biloba (Figure 5). The xylem water potential at midday of six tree species varied in a large range, from −0.99 MPa (for Liriodendron chinens) to −1.96 MPa (for I-101 × 84K). The hydraulic safety margins of most species were positive except for I-101 × 84K. As a result, I-101 × 84K suffered from the highest native PLC (>30%) but was consistent with the PLC predicted from the two methods. The PLCs of the rest five species were very low (<10%), but the pneumatic method predicted much higher PLCs than measured native PLCs for two tracheid-bearing species (Figure 6).

4. Discussion

4.1. The Reliability of Hydraulic Methods

In this study, we used the hydraulic methods as a reference to test the reliability of the pneumatic method; hence, we should first discuss the reliability of hydraulic methods. We selected hydraulic methods based on the wood type of species, i.e., centrifuge method for diffuse-porous species and tracheid-bearing species and bench dehydration method for ring-porous species. Previous studies have reached the consensus that the centrifuge method can accurately measure the vulnerability of short-vesseled species and tracheid-bearing species [6]. In fact, the classification of vessel length is relative, and in the case of the centrifuge method, the reference of classification is the rotor. The most commonly used rotor has a length of 28 cm (also in this study); thus, a centrifuge with this kind of rotor is theoretically suitable for species with a maximum vessel length shorter than 28 cm. However, even in the stem segment of short-vesseled species, there are still some vessels cut open at both ends, which may cause a small change in VCs’ shape [39]. In our study, the mean vessel lengths of two diffuse-porous species were all less than 5 cm, and most open vessels were enclosed within the length of 8 cm (Figure S3), which was much shorter than 28 cm. Therefore, this can explain the s-shaped curves found here. Nevertheless, it is worth reminding that the tension profile in a centrifuge is not uniform, with the highest tension existing in the rotor center, which could cause a slight underestimation of embolism vulnerability [40].
The bench dehydration method has long been considered the gold standard method for studying the embolism vulnerability of plants. However, this method could also be subjected to artifacts caused by improper operation [15] or unstable conductivity measurements [41]. For example, excising branches under tension may induce artificial embolism because of the suction of air [15,17], and rehydration procedures prior to hydraulic measurements may generate artificially low PLC values [16]. Moreover, this method may overestimate vulnerability compared with non-invasive methods techniques, such as micro-CT [42]. In this study, we strictly followed the procedure proposed by hydraulic experts to avoid the above potential artifacts, such as sampling long branches and releasing native tension gradually by excising the branch underwater consecutively. However, despite the fact that we obtained s-shaped VCs using this method, potential artifacts may also be present.
Nevertheless, the results of water relations provide us with strong evidence that we correctly measured embolism vulnerability via hydraulic methods (Figure 5 and Figure 6). The good consistency between hydraulic P12 and TLP suggests that the plant could timely close its stomata to prevent the decrease in xylem water potential and, thus, the onset of embolism. This is in line with the opinions proposed by numerous studies that xylem embolism never happened with opened stomata [33,34,43]. Additionally, the rate of embolism predicted from hydraulic methods was validated by in situ embolism measurements. Most plants operated within a safe water potential range; that is, the midday water potential was higher than P12. However, poplar experienced midday water potential near the onset points of embolism, thus causing a relatively higher rate of embolism. This may be caused by the higher vulnerability of poplar and the low water availability in its growth stand.

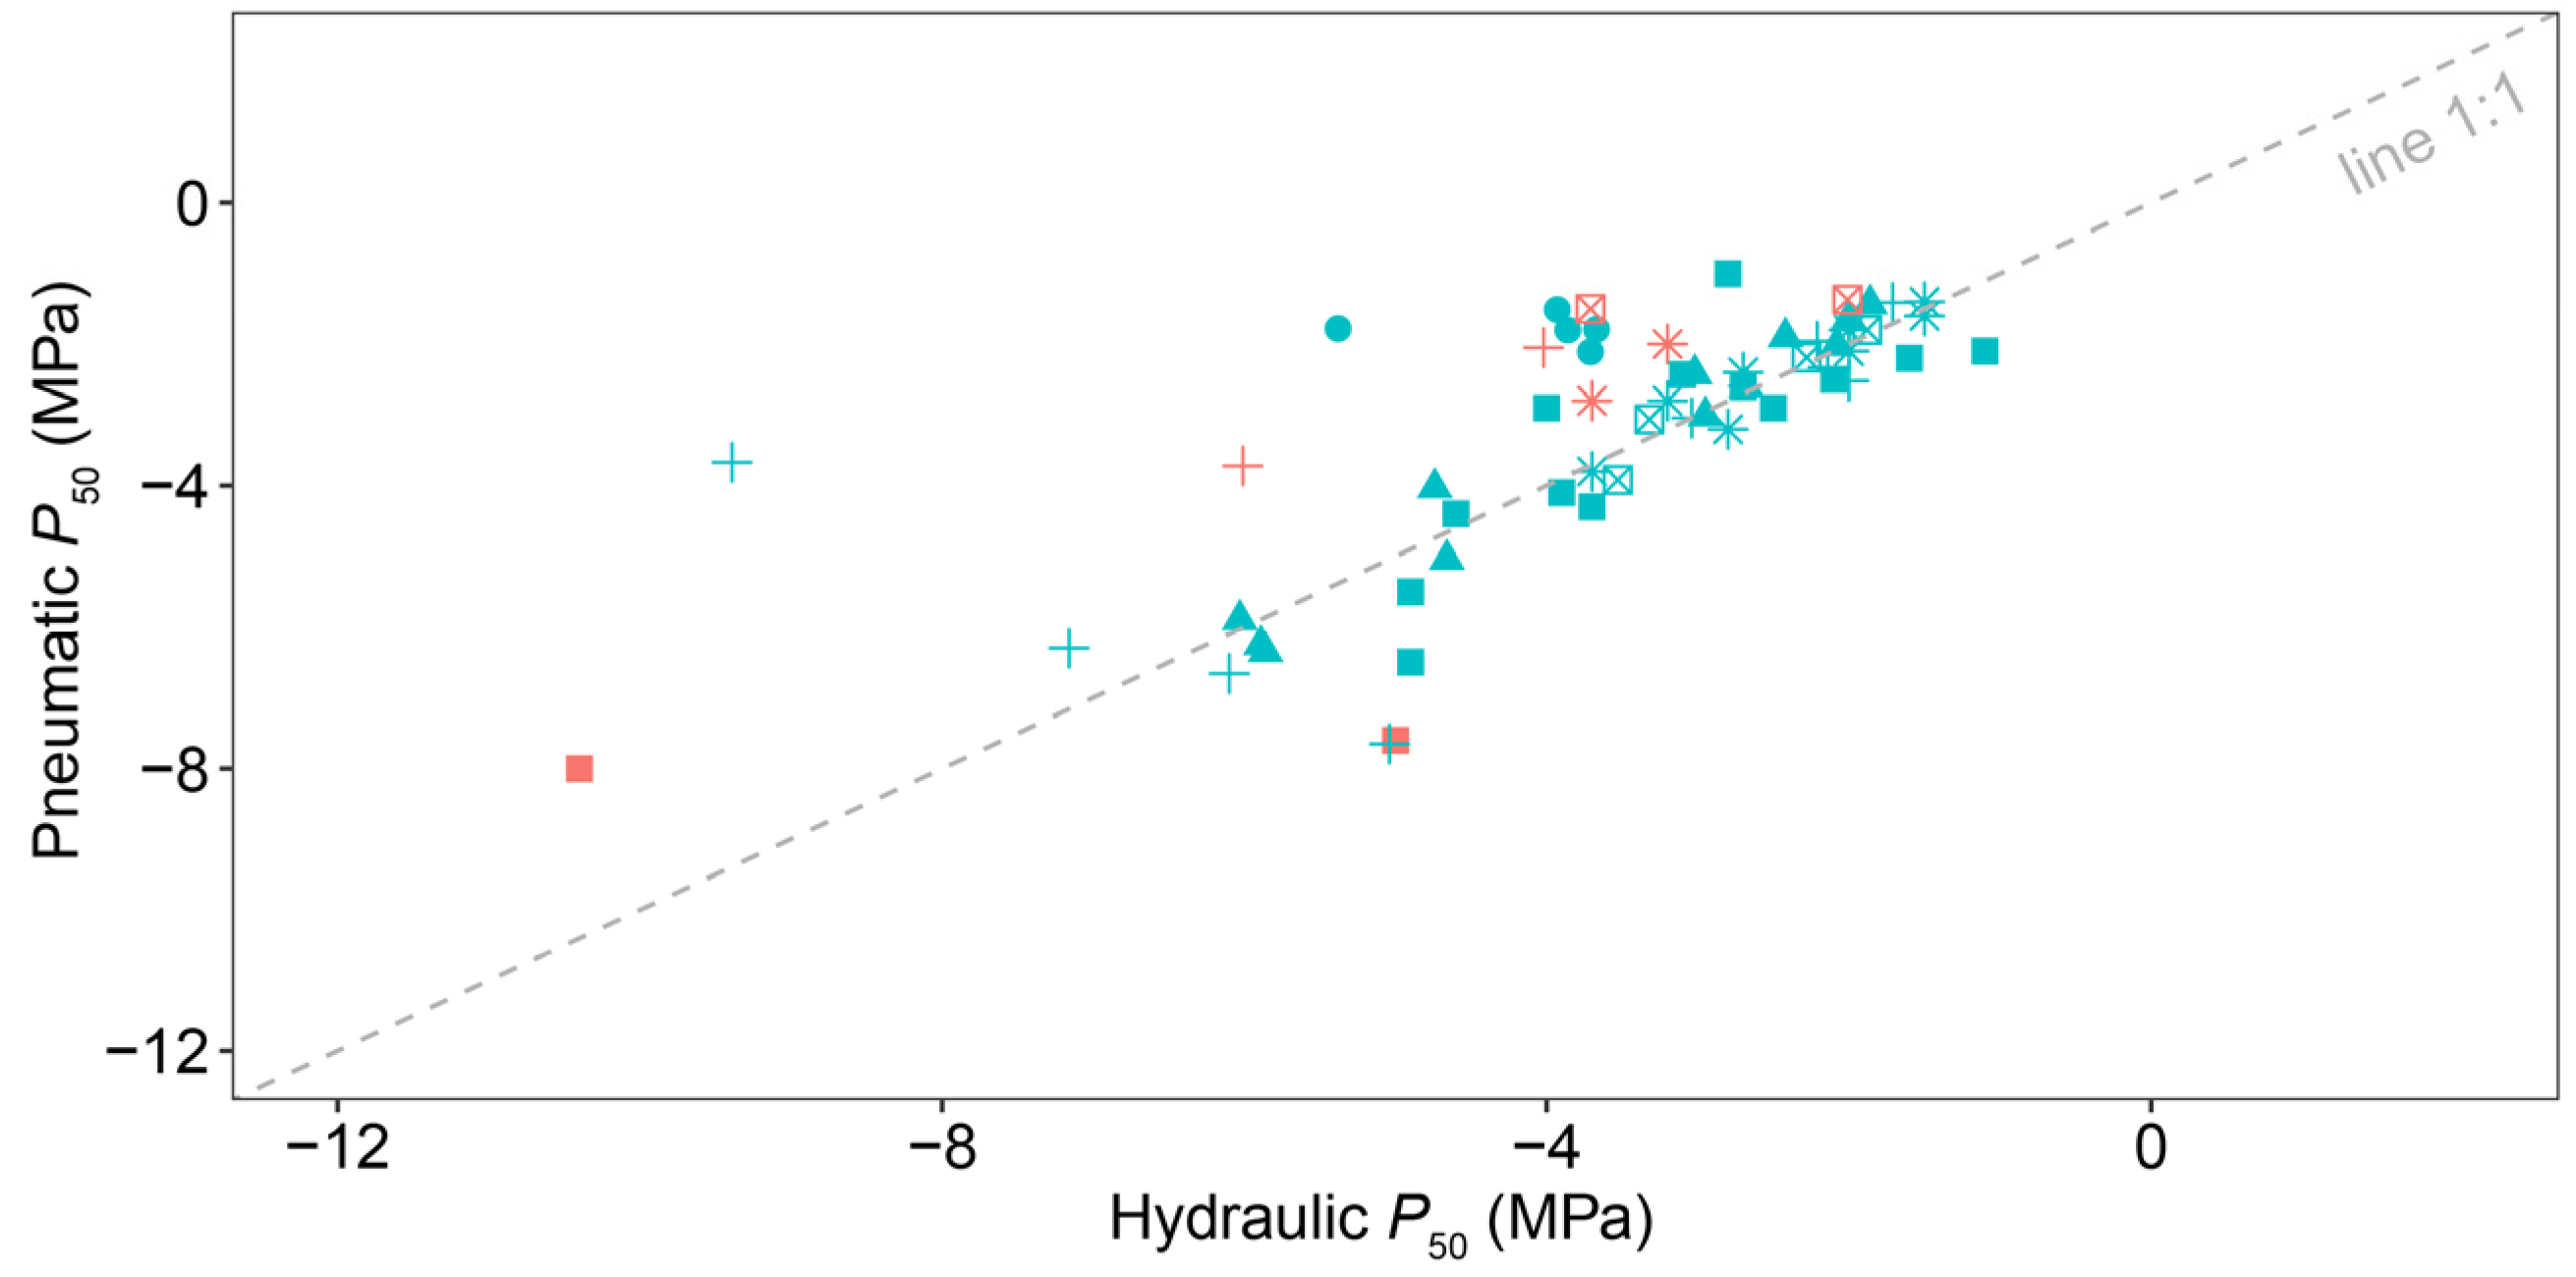
4.2. The Consistency between Pneumatic and Hydraulic Methods

From the discussion above, it is reasonable for us to examine the reliability of the pneumatic method via hydraulic methods. We observed good consistency between the pneumatic method and hydraulic methods for the four vessel-bearing species (Figure 3). Their VCs constructed by the two methods roughly overlapped (Figure 2), and no significant differences in hydraulic parameter was detected (Table 2). However, for two tracheid-bearing species, there was weak consistency between the two methods, suggesting that the pneumatic method may not be suitable for species with this wood type [27,28]. The results of turgor loss point and native embolism provided additional evidence for the reliability of VCs (Figure 5 and Figure 6). Good consistency between TLP and pneumatic P12 was only found in vessel-bearing species, and embolism degree predicted by the pneumatic method and native value have well coincided only for vessel-bearing species. Therefore, the pneumatic method may be more suitable for constructing VCs of vessel-bearing species because of its high accuracy, both in terms of diffuse-porous species and ring-porous species. Overall, the accuracy of the pneumatic method may not be correlated with wood anatomy in vessel-bearing species. The wood anatomy of vessel-bearing species, such as vessel length, diameter, and density, should be directly related to the cumulative air discharge volume (ADmax) rather than the pneumatic VCs. Similarly, some other anatomical differences, such as the different types of perforation plates or pit characteristics, may be related to the resistance of air diffusion.
The reliability of the pneumatic method concluded by our study is consistent with most of the published literature, which can be evidenced by the result of data synthesis (Figure 4). This finding indicates that the pneumatic method may represent an important contribution to the measurements of the hydraulic vulnerability of vessel-bearing species. However, some studies found that the pneumatic method cannot accurately construct VCs of some vessel-bearing species. One of the previous studies constructed r-shaped pneumatic VCs of two long-vesseled species (Laurus nobilis and Olea europaea) using manual pneumatic apparatus, and they attributed this to the uncertain air volume estimation caused by many tiny vessels in ring-porous wood [27]. In our study, many narrow vessels were also present in the ring-porous wood of Q. variabilis (Figure S2) but correct pneumatic VCs were obtained for this species. Perhaps there are some other mechanisms underlying the r-shaped pneumatic VCs of some ring-porous species. For example, it is not easy to measure minimum or maximum air discharge volume accurately by manual pneumatic apparatus [44]. Another study obtained s-shaped VCs of Olea europaea using the automated pneumatron and reported relatively reliable P50 [44]. However, although one of the recent studies reported s-shaped pneumatic VCs for five tropical tree or liana species with their maximum vessel length varying from 37.3 cm to over 141.0 cm, this method substantially overestimated the vulnerability of all five species [29]. They suspected this method was subjected to the problems of uncertainties in the air source. Since the air discharge time was 2.5 min in their study, the air coming from non-vascular spaces may interfere with the accurate measurement of vascular air volume. In our study, the air discharge time was 15 s. In such a short time, the air in non-vascular spaces may not diffuse into the reservoir because of a much greater air diffusion resistance of non-vascular tissue compared with hollow xylem conduits and porous pit membranes [24]. In a simulation of gas kinetics during pneumatic measurements, it has been proved that 91% of the extracted gas came from embolized intact conduits in 15 s [45]. Another study concluded that the pneumatic method might be sensitive to the duration of air discharge, and 16 s was a proper duration with the highest overall agreement between the pneumatic method and hydraulic methods [30]. Therefore, a short duration of air discharge should be encouraged to prevent air leakage of non-vascular tissue. Additionally, other uncertainties in the pneumatic measurements could also confuse the consistency between the pneumatic method and other methods, such as the criterion for pneumatic stopping time [46], which could have a significant effect on ADmax [47].
Previous studies together with ours have made the same conclusion that the pneumatic method was not capable of measuring the vulnerability of tracheid-bearing species. At present, the reasons for this are still under debate. Consistent with the previous study [28], we thought the resin might not be the reason because there is no resin canal in our two tracheid-bearing species. Additionally, the aspiration of torus-margo pit membranes under vacuum pressure was a possible explanation, which might lead to the underestimation of air discharge volume and thus the premature of ADmax [28]. However, the experimental evidence for this assumption was lacking because the pressure-inducing pit aspiration is hard to be examined. In our opinion, the air discharge volume may not be underestimated for tracheid-bearing species because we observed a high ADmax for our two tracheid-bearing species (Figure S4). Since the tracheids are narrow and much shorter than vessels (Table 1), the lumen of the conduit is unlikely to produce such high air volume, especially when the branches are not well dehydrated. Moreover, the needles of conifers may also be irrelevant because we obtain the wrong pneumatic VCs for a broad-leaved tracheid-bearing species, i.e., G. biloba. Overall, future studies of the pneumatic method should pay more attention to tracheid-bearing species to find out solutions for this problem.

4.3. The Impact of Open Vessels Volume

This study first estimated open vessel volume based on the silicone injection technique, and results showed that the open vessel volume of four vessel-bearing species was distinct (Figure 1). However, although the volume of two ring-porous species was much greater than diffuse-porous species because of the presence of wider and longer vessels (Figure S3), it did not affect the accuracy of the pneumatic method, suggesting that the pneumatic method was immune to the problem of open vessels. It may represent an improvement for the vulnerability estimation of long-vesseled species because high-throughput methods (i.e., centrifuge or air injection methods) have long been controversial in long-vesseled species [6].
The open vessels function as a part of a vacuum reservoir when there is a discharge of air. Actually, the calculation of the percentage of maximum air discharged (PAD, %) is irrelevant to the reservoir volume. However, since the quantification of air discharge volume is based on ideal gas law, the reservoir volume is crucial for precise measurements of air discharge volume [44]. A small air discharge volume can be measured more precisely if a small reservoir is used, but a big reservoir is needed when the plant material contains much air [25]. Our study showed that the open vessels take up the reservoir volume with a maximum value of 0.4 mL, about 14% of the tube reservoir volume. Therefore, maybe the open vessel volume should be taken into account to improve the precision when the pneumatic method is applied to species with long and wide vessels.

5. Conclusions

Our results highlighted that the pneumatic method can accurately measure the embolism resistance of vessel-bearing species with different xylem anatomy, but this method significantly overestimated the embolism resistance of tracheid-bearing species. There was good consistency between the pneumatic method and hydraulic methods for the vessel-bearing species, but not for the tracheid-bearing species. The data synthesis of previous studies and the results of turgor loss point and native embolism also provided strong evidences. Additionally, we proposed that the precise calculation of air discharge volume should take into account the volume of open vessels for species with wide and long vessels. The pneumatic method has the potential to be widely used in the plant hydraulics field because of its accuracy and automation, however, the unified protocols should be proposed in the future and further studies need to be done to figure out why this method is not suitable for the tracheid-bearing species.

Supplementary Materials

The following supporting information can be downloaded at: https://www.mdpi.com/article/10.3390/f14020293/s1, Figure S1: The “Pneumatron” used for pneumatic measurements in this study; Figure S2: Conduit diameter distribution of six tree species; Figure S3: The relationship between the number of injected vessels per unit area and the distance from the injection point, and the relationship between the vessel diameter of injected vessel and the distance from the injection point; Figure S4: Automated air discharged curves measured with the Pneumatron during dehydration; Datasets S1: The datasets of P50 measured by pneumatic and hydraulic methods.

Author Contributions

H.Z. assembled the Pneumatron, performed the study, and wrote the manuscript draft; Y.L. and S.L. performed the study; Z.J. conceived the study; J.C. designed the experiment and revised the manuscript. All authors have read and agreed to the published version of the manuscript.

Funding

This study was supported by the Natural Science Foundation of China (grant number 32271578) to J.C.

Data Availability Statement

The data set generated for the study area is available from the corresponding author upon reasonable request.

Acknowledgments

We particularly acknowledge Xin Huang and Bolong Ma for their kind help with data analyses.

Conflicts of Interest

The authors declare no conflict of interest.

References

  1. Choat, B.; Brodribb, T.J.; Brodersen, C.R.; Duursma, R.A.; Lopez, R.; Medlyn, B.E. Triggers of tree mortality under drought. Nature 2018, 558, 531–539. [Google Scholar] [CrossRef] [PubMed]
  2. Brodribb, T.J.; Powers, J.; Cochard, H.; Choat, B. Hanging by a thread? Forests and drought. Science 2020, 368, 261–266. [Google Scholar] [CrossRef] [PubMed]
  3. Rowland, L.; da Costa, A.C.; Galbraith, D.R.; Oliveira, R.S.; Binks, O.J.; Oliveira, A.A.; Pullen, A.M.; Doughty, C.E.; Metcalfe, D.B.; Vasconcelos, S.S.; et al. Death from drought in tropical forests is triggered by hydraulics not carbon starvation. Nature 2015, 528, 119–122. [Google Scholar] [CrossRef] [PubMed]
  4. McDowell, N.; Pockman, W.T.; Allen, C.D.; Breshears, D.D.; Cobb, N.; Kolb, T.; Plaut, J.; Sperry, J.; West, A.; Williams, D.G.; et al. Mechanisms of plant survival and mortality during drought: Why do some plants survive while others succumb to drought? New Phytol. 2008, 178, 719–739. [Google Scholar] [CrossRef]
  5. Tyree, M.T.; Zimmermann, M.H. Xylem Structure and the Ascent of Sap, 2nd ed.; Springer: Berlin/Heidelberg, Germany, 2002; pp. i–xiv, 1–283. [Google Scholar]
  6. Cochard, H.; Badel, E.; Herbette, S.; Delzon, S.; Choat, B.; Jansen, S. Methods for measuring plant vulnerability to cavitation: A critical review. J. Exp. Bot. 2013, 64, 4779–4791. [Google Scholar] [CrossRef]
  7. Sperry, J.S.; Donnelly, J.R.; Tyree, M.T. A method for measuring hydraulic conductivity and embolism in xylem. Plant Cell Environ. 1988, 11, 35–40. [Google Scholar] [CrossRef]
  8. Cochard, H.; Cruiziat, P.; Tyree, M.T. Use of Positive Pressures to Establish Vulnerability Curves-Further Support for the Air-Seeding Hypothesis and Implications for Pressure-Volume Analysis. Plant Physiol. 1992, 100, 205–209. [Google Scholar] [CrossRef]
  9. Pockman, W.T.; Sperry, J.S.; Oleary, J.W. Sustained and Significant Negative Water-Pressure in Xylem. Nature 1995, 378, 715–716. [Google Scholar] [CrossRef]
  10. Alder, N.N.; Pockman, W.T.; Sperry, J.S.; Nuismer, S. Use of centrifugal force in the study of xylem cavitation. J. Exp. Bot. 1997, 48, 665–674. [Google Scholar] [CrossRef]
  11. Cochard, H. A technique for measuring xylem hydraulic conductance under high negative pressures. Plant Cell Environ. 2002, 25, 815–819. [Google Scholar] [CrossRef] [Green Version]
  12. Cochard, H.; Damour, G.; Bodet, C.; Tharwat, I.; Poirier, M.; Améglio, T. Evaluation of a new centrifuge technique for rapid generation of xylem vulnerability curves. Physiol. Plant. 2005, 124, 410–418. [Google Scholar] [CrossRef]
  13. Li, Y.; Sperry, J.S.; Taneda, H.; Bush, S.E.; Hacke, U.G. Evaluation of centrifugal methods for measuring xylem cavitation in conifers, diffuse- and ring-porous angiosperms. New Phytol. 2008, 177, 558–568. [Google Scholar] [CrossRef] [PubMed]
  14. Jansen, S.; Schuldt, B.; Choat, B. Current controversies and challenges in applying plant hydraulic techniques. New Phytol. 2015, 205, 961–964. [Google Scholar] [CrossRef] [PubMed]
  15. Wheeler, J.K.; Huggett, B.A.; Tofte, A.N.; Rockwell, F.E.; Holbrook, N.M. Cutting xylem under tension or supersaturated with gas can generate PLC and the appearance of rapid recovery from embolism. Plant Cell Environ. 2013, 36, 1938–1949. [Google Scholar] [CrossRef] [PubMed]
  16. Trifilo, P.; Raimondo, F.; Lo Gullo, M.A.; Barbera, P.M.; Salleo, S.; Nardini, A. Relax and refill: Xylem rehydration prior to hydraulic measurements favours embolism repair in stems and generates artificially low PLC values. Plant Cell Environ. 2014, 37, 2491–2499. [Google Scholar] [CrossRef]
  17. Torres-Ruiz, J.M.; Jansen, S.; Choat, B.; McElrone, A.J.; Cochard, H.; Brodribb, T.J.; Badel, E.; Burlett, R.; Bouche, P.S.; Brodersen, C.R.; et al. Direct x-ray microtomography observation confirms the induction of embolism upon xylem cutting under tension. Plant Physiol. 2015, 167, 40–43. [Google Scholar] [CrossRef]
  18. Ennajeh, M.; Simoes, F.; Khemira, H.; Cochard, H. How reliable is the double-ended pressure sleeve technique for assessing xylem vulnerability to cavitation in woody angiosperms? Physiol. Plant. 2011, 142, 205–210. [Google Scholar] [CrossRef]
  19. Yin, P.; Cai, J. New possible mechanisms of embolism formation when measuring vulnerability curves by air injection in a pressure sleeve. Plant Cell Environ. 2018, 41, 1361–1368. [Google Scholar] [CrossRef]
  20. Cochard, H.; Herbette, S.; Barigah, T.; Badel, E.; Ennajeh, M.; Vilagrosa, A. Does sample length influence the shape of xylem embolism vulnerability curves? A test with the Cavitron spinning technique. Plant Cell Environ. 2010, 33, 1543–1552. [Google Scholar] [CrossRef]
  21. McElrone, A.J.; Brodersen, C.R.; Alsina, M.M.; Drayton, W.M.; Matthews, M.A.; Shackel, K.A.; Wada, H.; Zufferey, V.; Choat, B. Centrifuge technique consistently overestimates vulnerability to water stress-induced cavitation in grapevines as confirmed with high-resolution computed tomography. New Phytol. 2012, 196, 661–665. [Google Scholar] [CrossRef]
  22. Wang, R.; Zhang, L.; Zhang, S.; Cai, J.; Tyree, M.T. Water relations of Robinia pseudoacacia L.: Do vessels cavitate and refill diurnally or are R-shaped curves invalid in Robinia? Plant Cell Environ. 2014, 37, 2667–2678. [Google Scholar] [CrossRef]
  23. Zhao, H.; Jiang, Z.; Ma, J.; Cai, J. What causes the differences in cavitation resistance of two shrubs? Wood anatomical explanations and reliability testing of vulnerability curves. Physiol. Plant. 2020, 169, 156–168. [Google Scholar] [CrossRef]
  24. Pereira, L.; Bittencourt, P.R.L.; Oliveira, R.S.; Junior, M.B.M.; Barros, F.V.; Ribeiro, R.V.; Mazzafera, P. Plant pneumatics: Stem air flow is related to embolism-new perspectives on methods in plant hydraulics. New Phytol. 2016, 211, 357–370. [Google Scholar] [CrossRef]
  25. Pereira, L.; Bittencourt, P.R.L.; Pacheco, V.S.; Miranda, M.T.; Zhang, Y.; Oliveira, R.S.; Groenendijk, P.; Machado, E.C.; Tyree, M.T.; Jansen, S.; et al. The Pneumatron: An automated pneumatic apparatus for estimating xylem vulnerability to embolism at high temporal resolution. Plant Cell Environ. 2020, 43, 131–142. [Google Scholar] [CrossRef]
  26. Trabi, C.L.; Pereira, L.; Guan, X.; Miranda, M.T.; Bittencourt, P.R.L.; Oliveira, R.S.; Ribeiro, R.V.; Jansen, S. A User Manual to Measure Gas Diffusion Kinetics in Plants: Pneumatron Construction, Operation, and Data Analysis. Front. Plant Sci. 2021, 12, 633595. [Google Scholar] [CrossRef]
  27. Sergent, A.S.; Varela, S.A.; Barigah, T.S.; Badel, E.; Cochard, H.; Dalla-Salda, G.; Delzon, S.; Fernández, M.E.; Guillemot, J.; Gyenge, J.; et al. A comparison of five methods to assess embolism resistance in trees. For. Ecol. Manag. 2020, 468, 118175. [Google Scholar] [CrossRef]
  28. Zhang, Y.; Lamarque, L.J.; Torres-Ruiz, J.M.; Schuldt, B.; Karimi, Z.; Li, S.; Qin, D.W.; Bittencourt, P.; Burlett, R.; Cao, K.F.; et al. Testing the plant pneumatic method to estimate xylem embolism resistance in stems of temperate trees. Tree Physiol. 2018, 38, 1016–1025. [Google Scholar] [CrossRef]
  29. Chen, Y.-J.; Maenpuen, P.; Zhang, Y.-J.; Barai, K.; Katabuchi, M.; Gao, H.; Kaewkamol, S.; Tao, L.-B.; Zhang, J.-L. Quantifying vulnerability to embolism in tropical trees and lianas using five methods: Can discrepancies be explained by xylem structural traits? New Phytol. 2021, 229, 805–819. [Google Scholar] [CrossRef]
  30. Paligi, S.S.; Link, R.M.; Isasa, E.; Bittencourt, P.; Cabral, J.S.; Jansen, S.; Oliveira, R.S.; Pereira, L.; Schuldt, B. Accuracy of the pneumatic method for estimating xylem vulnerability to embolism in temperate diffuse-porous tree species. BioRxiv 2021. [Google Scholar] [CrossRef]
  31. Guan, X.; Pereira, L.; McAdam, S.A.M.; Cao, K.F.; Jansen, S. No gas source, no problem: Proximity to pre-existing embolism and segmentation affect embolism spreading in angiosperm xylem by gas diffusion. Plant Cell Environ. 2021, 44, 1329–1345. [Google Scholar] [CrossRef]
  32. Wu, M.; Zhang, Y.; Oya, T.; Marcati, C.R.; Pereira, L.; Jansen, S. Root xylem in three woody angiosperm species is not more vulnerable to embolism than stem xylem. Plant Soil 2020, 450, 479–495. [Google Scholar] [CrossRef]
  33. Martin-StPaul, N.; Delzon, S.; Cochard, H. Plant resistance to drought depends on timely stomatal closure. Ecol. Lett. 2017, 20, 1437–1447. [Google Scholar] [CrossRef] [PubMed]
  34. Hochberg, U.; Windt, C.W.; Ponomarenko, A.; Zhang, Y.-J.; Gersony, J.; Rockwell, F.E.; Holbrook, N.M. Stomatal Closure, Basal Leaf Embolism, and Shedding Protect the Hydraulic Integrity of Grape Stems. Plant Physiol. 2017, 174, 764–775. [Google Scholar] [CrossRef] [PubMed]
  35. Brodribb, T.J.; Holbrook, N.M. Stomatal closure during leaf dehydration, correlation with other leaf physiological traits. Plant Physiol. 2003, 132, 2166–2173. [Google Scholar] [CrossRef] [PubMed]
  36. Wheeler, J.K.; Sperry, J.S.; Hacke, U.G.; Hoang, N. Inter-vessel pitting and cavitation in woody Rosaceae and other vesselled plants: A basis for a safety versus efficiency trade-off in xylem transport. Plant Cell Environ. 2005, 28, 800–812. [Google Scholar] [CrossRef]
  37. Franklin, G.L. Preparation of thin sections of synthetic resins and wood-resin composites, and a new macerating method for wood. Nature 1945, 155, 51. [Google Scholar] [CrossRef]
  38. Tyree, M.T.; Hammel, H.T. The Measurement of the Turgor Pressure and the Water Relations of Plants by the Pressure-bomb Technique. J. Exp. Bot. 1972, 23, 267–282. [Google Scholar] [CrossRef]
  39. Lopez, R.; Nolf, M.; Duursma, R.A.; Badel, E.; Flavel, R.J.; Cochard, H.; Choat, B. Mitigating the open vessel artefact in centrifuge-based measurement of embolism resistance. Tree Physiol. 2019, 39, 143–155. [Google Scholar] [CrossRef]
  40. Cai, J.; Hacke, U.; Zhang, S.; Tyree, M.T. What happens when stems are embolized in a centrifuge? Testing the cavitron theory. Physiol. Plant. 2010, 140, 311–320. [Google Scholar] [CrossRef]
  41. De Baerdemaeker, N.J.F.; Arachchige, K.N.R.; Zinkernagel, J.; Van den Bulcke, J.; Van Acker, J.; Schenk, H.J.; Steppe, K. The stability enigma of hydraulic vulnerability curves: Addressing the link between hydraulic conductivity and drought-induced embolism. Tree Physiol. 2019, 39, 1646–1664. [Google Scholar] [CrossRef]
  42. Cochard, H.; Petit, G.; Torres-Ruiz, J.M.; Sylvain, D. XIM4 meeting report, Sept. 25-27 2019, Padua (Italy)The hydraulic community has taken a step forward towards non-invasive measurements. For. Ecol. Manag. 2019, 6, 118175. [Google Scholar]
  43. Cochard, H.; Breda, N.; Granier, A. Whole tree hydraulic conductance and water loss regulation in Quercus during drought: Evidence for stomatal control of embolism? Ann. For. Sci. 1996, 53, 197–206. [Google Scholar] [CrossRef]
  44. Pereira, L.; Bittencourt, P.R.L.; Rowland, L.; Brum, M.; Miranda, M.T.; Pacheco, V.S.; Oliveira, R.S.; Machado, E.C.; Jansen, S.; Ribeiro, R.V. Using the Pneumatic method to estimate embolism resistance in species with long vessels: A commentary on the article “A comparison of five methods to assess embolism resistance in trees”. For. Ecol. Manag. 2021, 479, 118547. [Google Scholar] [CrossRef]
  45. Yang, D.; Pereira, L.; Peng, G.; Ribeiro, R.V.; Kaack, L.; Jansen, S.; Tyree, M.T. A Unit Pipe Pneumatic model to simulate gas kinetics during measurements of embolism in excised angiosperm xylem. Tree Physiol. 2021, 43, 88–101. [Google Scholar] [CrossRef]
  46. Chen, Y.J.; Maenpuen, P.; Zhang, J.L.; Zhang, Y.J. Remaining uncertainties in the Pneumatic method. New Phytol. 2023, 237, 384–391. [Google Scholar] [CrossRef]
  47. Brum, M.; Pereira, L.; Ribeiro, R.V.; Jansen, S.; Bittencourt, P.R.L.; Oliveira, R.S.; Saleska, S.R. Reconciling discrepancies in measurements of vulnerability to xylem embolism with the pneumatic method: A comment on Chen et al. (2021) ‘Quantifying vulnerability to embolism in tropical trees and lianas using five methods: Can discrepancies be explained by xylem structural traits?’: A comment on Chen et al. (2021) ‘Quantifying vulnerability to embolism in tropical trees and lianas using five methods: Can discrepancies be explained by xylem structural traits?’. New Phytol. 2023, 237, 374–383. [Google Scholar] [CrossRef]
Figure 1. The estimated volume of cut-open vessels. (a,b) are the diagrams of open vessels for diffuse-porous and ring-porous tree species in this study, respectively. Blue and yellow represent intact and open vessels, respectively. (c) The estimated volume of open vessels reservoir is based on the silicone injection technique. For each species, the estimation was made based on the average value of diameter and numbers of injected vessels (n = 5 branches).
Forests 14 00293 g001
Figure 2. Vulnerability curves (VCs) of six tree species constructed by Pneumatic and hydraulic methods. PN-branch1, PN-branch2, and PN-branch3 represent three branches per species used for the construction of Pneumatic VCs. PN-mean represents plotted VCs using mean fitted values of three branches.
Forests 14 00293 g002
Figure 3. Comparison of method for the measurements of embolism resistance. Grey dashed line represents the 1:1 line. Vertical and horizontal bars represent standard error.
Forests 14 00293 g003
Figure 4. Synthesis of hydraulic or pneumatic P50 data of 56 species. Grey dashed line represents the 1:1 line. Red and cyan points represent tracheid-bearing and vessel-bearing species, respectively. Different symbols represent different data sources: ■ Pereira et al. (2016), ✴ Zhang et al. (2018), + Sergent et al. (2020), ▲ Paligi et al. (2021), ● Chen et al. (2021), ⊠ This study.
Forests 14 00293 g004
Figure 5. Relationship between the leaf water potential at turgor loss point (TLP) and P12 measured with the hydraulic and pneumatic methods. The grey dashed line represents the 1:1 line. Vertical and horizontal bars represent standard error.
Forests 14 00293 g005
Figure 6. The midday xylem water potential (Ψmd) and the native or predicted percentage loss of conductivity (PLC). * indicates significant difference between predicted PLC and native PLC (p < 0.05). Vertical bars represent standard error.
Forests 14 00293 g006
Table 1. The xylem anatomical traits of six species. Lmean, mean conduit length; Dmean, mean conduit diameter; VD, vessel density. Values are mean ± se (n = 5 branches). I-101 × 84K is a hybrid of poplar (Populus. spp.).
SpeciesWood TypeLmean (cm)Dmean (μm)VD (n mm−2)
Populus. spp. (I-101 × 84K)Diffuse-porous4.57 ± 0.4531.87 ± 1.22187 ± 13
Liriodendron chinenseDiffuse-porous3.74 ± 0.2430.04 ± 0.52351 ± 8
Quercus variabilisRing-porous38.08 ± 2.8047.86 ± 2.3890 ± 6
Robinia pseudoacaciaRing-porous15.59 ± 0.6556.09 ± 1.2745 ± 6
Metasequoia glyptostroboidesNon-porous0.15 ± 0.0113.61 ± 0.462260 ± 77
Ginkgo bilobaNon-porous0.19 ± 0.0116.23 ± 0.331585 ± 62
Table 2. Embolism resistance measured by hydraulic and pneumatic methods. * indicates significant difference between the two methods (p < 0.05, students’ t-test). Each point is mean ± se (n = 3~5 branches).
SpeciesMethodsP12 (MPa)P50 (MPa)P88 (MPa)Slope
(% of PLC MPa−1)
Populus. spp.
(I-101 × 84K)
Hydraulic−1.64 ± 0.06−2.28 ± 0.07−2.91 ± 0.0380.29 ± 4.72
Pneumatic−1.49 ± 0.01−2.19 ± 0.10−2.89 ± 0.1974.23 ± 10.69
Liriodendron chinenseHydraulic−1.57 ± 0.05−1.88 ± 0.03−2.18 ± 0.04175.04 ± 19.18
Pneumatic−1.60 ± 0.03−1.80 ± 0.04−2.01 ± 0.06254.80 ± 47.96
Quercus variabilisHydraulic−2.2−3.53−4.8537.77
Pneumatic−2.45 ± 0.4−3.92 ± 0.21−5.4 ± 0.2035.38 ± 4.85
Robinia pseudoacaciaHydraulic−2.33−3.32−4.1950.49
Pneumatic−2.11 ± 0.12−3.06 ± 0.08−4.00 ± 0.0453.09 ± 2.86
Metasequoia glyptostroboidesHydraulic−1.69 ± 0.06−2.01 ± 0.09−2.41 ± 0.13133.53 ± 17.78
Pneumatic−0.98 ± 0.18 *−1.37 ± 0.07 *−1.77 ± 0.07 *148.34 ± 35.76
Ginkgo bilobaHydraulic−3.02 ± 0.18−3.71 ± 0.12−4.42 ± 0.1276.90 ± 8.79
Pneumatic−0.46 ± 0.34 *−1.50 ± 0.26 *−2.53 ± 0.20 *49.18 ± 4.49
Disclaimer/Publisher’s Note: The statements, opinions and data contained in all publications are solely those of the individual author(s) and contributor(s) and not of MDPI and/or the editor(s). MDPI and/or the editor(s) disclaim responsibility for any injury to people or property resulting from any ideas, methods, instructions or products referred to in the content.

