Article

The Effect of Different Vegetation Restoration Types on Soil Quality in Mountainous Areas of Beijing

1
School of Soil and Water Conservation, Beijing Forestry University, Beijing 100083, China
2
Beijing Municipal Forestry and Parks Bureau, Beijing 100013, China
3
General Forestry Station of Beijing Municipality, Beijing 100029, China
*
Author to whom correspondence should be addressed.
Forests 2023, 14(12), 2374; https://doi.org/10.3390/f14122374
Submission received: 6 November 2023 / Revised: 29 November 2023 / Accepted: 2 December 2023 / Published: 5 December 2023
(This article belongs to the Special Issue Ecological Restoration and Soil Amelioration in Forest Ecosystem)

Abstract

:
Soil quality is a very important indicator used to assess ecosystem restoration states in terms of vegetation recovery and establishment. Evaluating the soil quality of different vegetation restoration types in mountainous areas of Beijing and identifying their influencing factors would provide a scientific basis and be helpful for vegetation restoration in the future. Six vegetation types (or communities), including Platycladus orientalis (L.) Franco pure forest (POP), Pinus tabulaeformis Carr. pure forest (PTP), Platycladus orientalisPinus tabulaeformis mixed forest (PPM), Platycladus orientalis coniferous and broadleaved mixed forest (POCB), Pinus tabulaeformis coniferous and broadleaved mixed forest (PTCB), deciduous broadleaved mixed forest (DBMF), and one area of non-afforested land (NF), with similar stand conditions were selected and fourteen factors of soil physical and chemical characteristics were measured and used to establish a total data set (TDS), while a minimum data set (MDS) was obtained by using the principal component analysis (PCA) and Pearson correlation analysis methods. Two scoring methods, linear (L) and non-linear (NL), were used to calculate the soil quality index (SQI), and the key factors influencing soil quality by vegetation were identified by a general linear model (GLM), PCA, and correlation analysis. The results showed that: (1) The screened MDS indicators which showed good relationships with the SQIs in the study areas were total nitrogen (TN), sand content, total potassium (TK), pH, and available water capacity (AWC). The SQI–NLM method has better applicability. (2) The contribution rates of vegetation to different soil factors accounted for 28.644% (TN), 21.398% (sand content), 24.551% (TK), 16.075% (pH), and 9.332% (AWC). (3) TN showed a positive relationship with all vegetation types; the content of TN in PTCB and DBMF was obviously larger than in the other types in the 0–10 cm layer; PPM, PTCB, and POCB affected the sand content, which showed negative correlativity; and DBMF showed positive correlativity with AWC. The mechanism of how different species affect TN, sand content, and AWC should be focused on and taken into consideration in further studies.

1. Introduction

Forest soils serve as the foundational substrates for supporting forest ecosystem sustainable development [1]. Soil quality was defined by the Soil Science Society of America as ‘the capacity of a specific kind of soil to function within natural or managed ecosystem boundaries, to sustain plant and animal productivity, maintain air and water quality and support human health and habitation’. As a comprehensive indicator, it demonstrates sensitivity to dynamic shifts in soil condition and management practices [2,3,4,5,6,7]; importantly, accurate and reliable soil quality assessment is the key to better understanding soil quality changes under different vegetation restoration types [8,9] and can reflect the effectiveness of vegetation restoration. Moreover, the nature of soil systems is very intricate and variable, particularly within the context of forest ecosystems, for which an authentic set of soil quality assessment methods remains unclear [9].
Soil quality assessment is an effective method to comprehensively obtain multiple items of soil information, reflect soil quality quantitatively, and guide land management [10,11,12]; its accuracy depends on the selection of indicators and scoring methods [13,14]. The soil quality index (SQI) is the commonest method used currently due to its computational simplicity and quantitative flexibility [15,16]. The total data set (TDS) and minimum data set (MDS), the two index selection methods for determining SQI, are widely used in soil quality assessment [16,17,18,19]. A total data set (TDS) containing rich soil indicators can make evaluation results more comprehensive and accurate, but too many indicators make the procedure not only time-consuming and laborious, but also lead to a large amount of redundant information in the total data set (TDS) [20,21]. Compared with the total data set (TDS) method, the MDS method can eliminate redundant information to screen the most representative indicators with less information loss [14,22]. And principal component analysis combined with correlation analysis is the most popular indicator screening method used for constructing minimal data sets (MDSs) [23,24,25]. Previous studies have shown that the effectiveness of the minimum data set (MDS) method for soil quality assessment has been well validated in cropland, forest lands, grassland, abandoned, and coastal areas [20,26,27], but it needs to be verified whether the MDS method can adequately replace the use of the TDS method for soil quality assessment. In terms of soil quality evaluation methods, linear and non-linear scoring methods are commonly used today [28,29]. Some studies found that there is a linear relationship between soil quality scores and the measured data of soil indicators, so the linear scoring method (L) was used to evaluate soil quality [23,30]. However, some studies found that there is no obvious linear relationship between soil quality scores and the measured data of soil indicators, so the non-linear scoring method (NL) was used [31,32]. In addition, SQI varies depending on the study area, soil function, and ecological restoration measures [33,34], and SQI is effective under specific environmental conditions, but few studies have focused on the comparison and selection of these methods prior to the use of SQI in a specific region [8,35,36]. In summary, the applicability of each method should be validated before evaluating soil quality.
Vegetation restoration can prevent soil degradation and improve the ecological environment effectively [37], as well as facilitate ecosystem restoration by promoting soil nutrient cycling and maintaining soil quality [38]. Studies have shown that unselective vegetation restoration can lead to soil quality degradation [39,40,41]; on the contrary, effective vegetation restoration can improve soil quality significantly [29]. How to ensure the improvement of land quality and at the same time take into account ecological services and economic value is a hot point in the context of large-scale vegetation restoration [27]. At present, the forestry and grassland program in China has shifted from a focus on quantity to a new stage of high-quality development that emphasizes both quantity and quality. Therefore, it is very urgent to find out which type of vegetation restoration is more efficient and to identify the dominant factors with respect to improving regional soil quality.
We hypothesized that the soil quality index (SQI) established by a non-linear minimum data set has better applicability than the linear minimum data set method and that selective vegetation restoration can significantly improve soil quality. In order to test this hypothesis, the main objectives of our study were: (1) to identify the most appropriate SQI evaluation method; (2) to identify the main influencing factors affecting soil quality; and (3) to investigate which soil indicators are influenced by vegetation restoration types to improve soil quality and to propose efficient vegetation restoration strategies and provide a practical and theoretical basis for vegetation restoration and land management in the mountainous areas of Beijing.

2. Materials and Methods
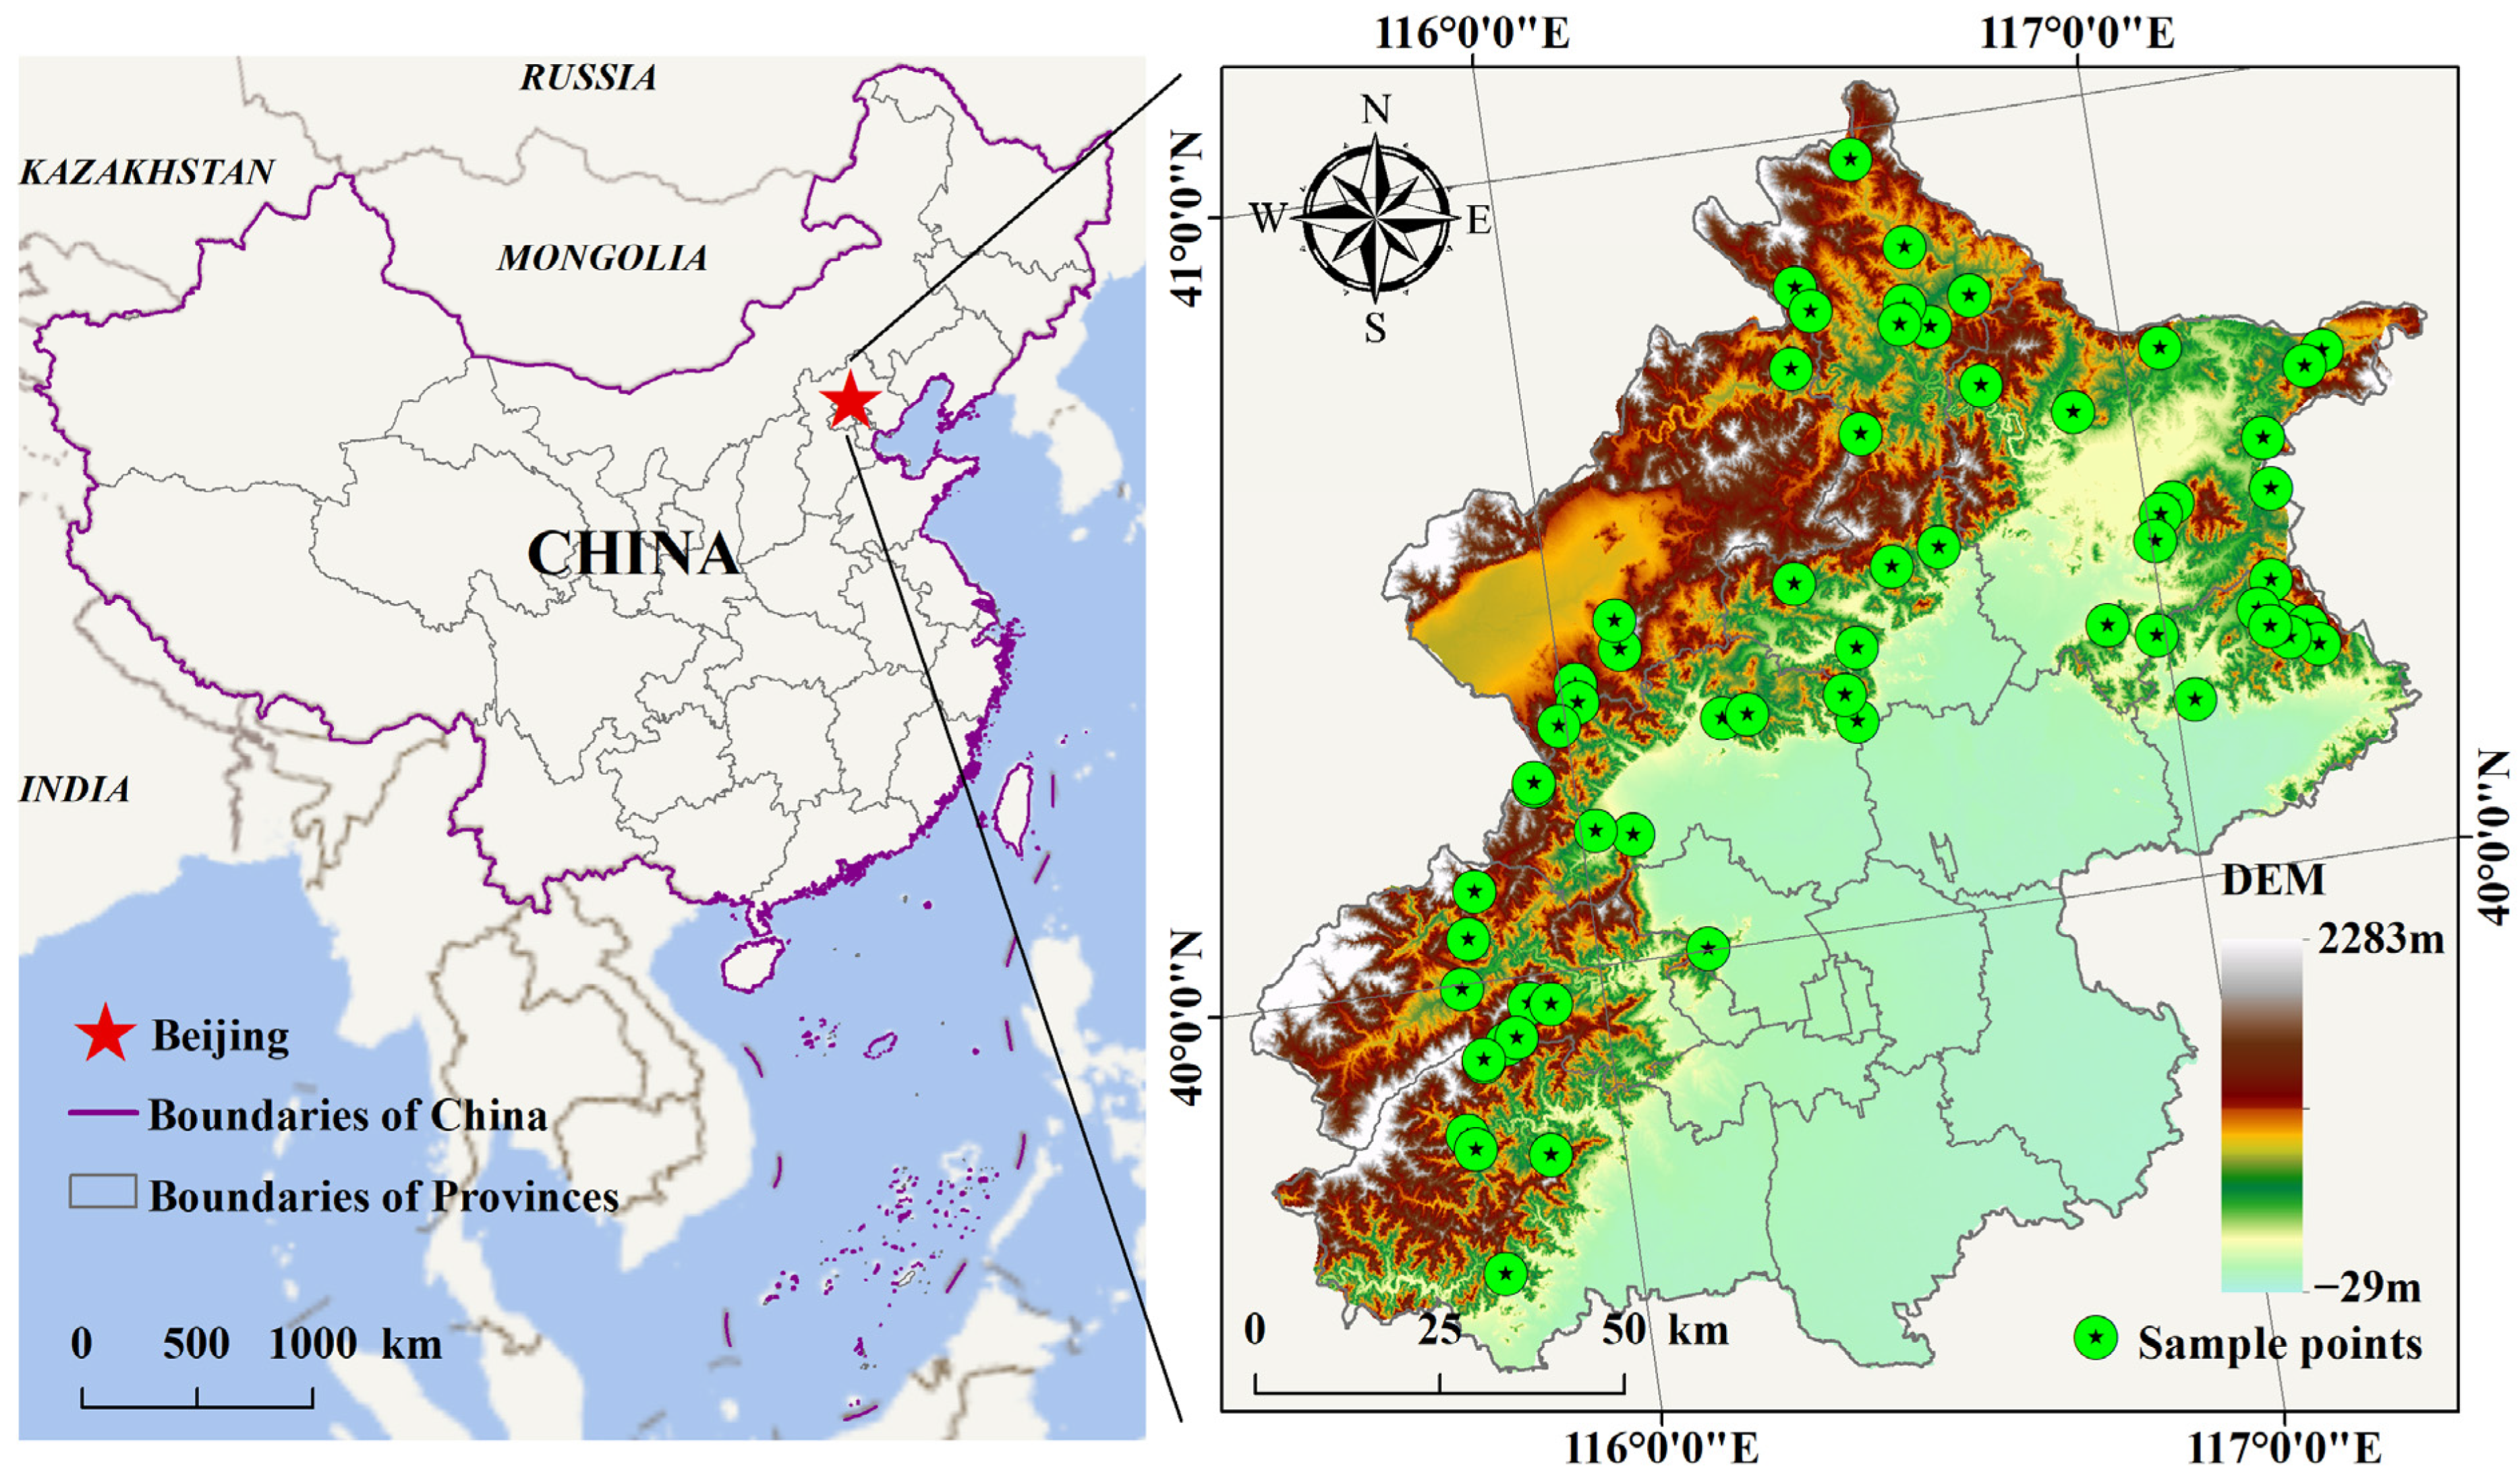
2.1. Study Sites

The study sites are located in the mountainous area of Beijing, mainly in the western, northern, and eastern parts of the city (Figure 1). The mountainous region covers 10,400 km2, accounting for about 62% of Beijing’s total area, and is an important ecological barrier for the Beijing Municipality and the North China Plain. The climate type in the study area belongs to a typical warm temperate semi-humid continental monsoon climate. The average annual precipitation is 585 mm, ranging from 370 to 720 mm; and the average annual temperature is 10–12 °C, with daily temperatures ranging from −18 to 40 °C. The land-use types are dominated by woodland and barren grassland, and the soil types from low altitude to high altitude are mountain brown soil, mountain brown loam, and mountain meadow soil. The forest coverage exceeds 90%, predominantly consisting of plantation forests. The main forest types include deciduous broad-leaved forests dominated by Tilia, Quercus, Betula, and Populus, etc., deciduous coniferous forests dominated by Larix principis-rupprechtii Mayr., evergreen coniferous forests dominated by Platycladus orientalis and Pinus tabulaeformis, etc., and mixed coniferous and broad-leaved forests dominated by Quercus, Betula, Platycladus Spach, and Pinus, and others.

2.2. Field Investigation and Soil Sampling

In July to August 2021, based on the forest resources Type II survey data, and according to the principle of typicality and representativeness, we selected six different vegetation restoration types as research objects in the study area, which are Platycladus orientalis pure forest (POP), Pinus tabulaeformis pure forest (PTP), Platycladus orientalisPinus tabulaeformis mixed forest (PPM), Platycladus orientalis coniferous and broad-leaved mixed forest (POCB), Pinus tabulaeformis coniferous and broad-leaved mixed forest (PTCB), and deciduous broad-leaved mixed forest (DBMF). These vegetation types are all plantation forests with low anthropogenic disturbances, and all of them are middle-aged (30 years) forests. We chose the non-afforested land (NF), which has relatively the same standing conditions, as the control considering the inability to determine the background value of the soil condition in the study area. Sixty-five standard sample plots with an area of 20 m × 20 m and with basically the same soil type and stand conditions were finally selected. The basic information of the sample plots is shown in Table 1.
In accordance with the Technical Procedures for Forest Soil Survey [42], three sampling points were laid out in a diagonal direction within each standard sample plot, with a sampling profile depth of 30 cm, totaling 195 soil profiles. Samples were taken in layers (0–10 cm, 10–20 cm, and 20–30 cm) using a ring knife, and each layer was repeated three times for soil physical property test samples. For each sampling point, 1.0 kg of soil sample was collected from each stratum, which was mixed, dried naturally, ground, and sieved, and then sealed and stored as a soil chemical property test sample, totaling 585 samples.

2.3. Laboratory Analysis

The pH was determined using the potentiometric method (water–soil ratio 2.5:1); the soil bulk density (BD) was measured using the ring knife method; the available water content of soil (AWC) was equal to the difference between the field water-holding capacity and wilting coefficient, and the soil moisture characteristic curve was determined using the centrifuge method (pressures of 10, 20, 40, 60, 80, 100, 200, 400, 600, 800, 1000 kPa); the field water-holding capacity was taken as the soil volumetric water content corresponding to 33 kPa, and the wilting coefficient was taken as the soil volumetric water content at 1500 kPa [43]. The soil organic matter, total nitrogen, available nitrogen, total phosphorus, available phosphorus, total potassium, available potassium, and cation exchange capacity were measured using the method described by Bao [44]. Soil texture (sand, silt, and clay) was determined according to the United States Department of Agriculture (USDA) Soil Particle Classification System using a laser particle size analyzer.

2.4. Soil Quality Assessment

The steps for calculating of SQI are as follows [28,29]: (1) Select soil indicators for the total data set and minimum data set; (2) Normalize the selected soil indicators (0 to 1) using linear and non-linear functions, and normalize the scores of soil indicators; (3) Calculate integrated SQI values.

2.4.1. Total Data Set (TDS) and Minimum Data Set (MDS)

Considering the frequency and representativeness of soil indicators selected in previous studies [45,46] and the actual experimental conditions, the 14 soil indicators measured were used as TDS. Meanwhile, the results of KMO sampling and Bartlett’s sphericity test showed that the KMO value was 0.705 > 0.6, and the value of concomitant probability of the sphericity test was 0, which was considered to be significant, which indicated that the principal component analysis (PCA) could be carried out based on the selected indicators. The PCA method was used to screen the MDS. Based on the results of PCA, the principal components with eigenvalues ≥ 1 were selected. Then, according to the size of the factor loadings, the highest factor loadings within 10% of each principal component were selected as high-loading indicators [47]. If there was only one high-loading indicator in a principal component, that indicator was selected into the MDS. If there were multiple high-loading indicators, Pearson correlation analysis was used to identify soil indicators [29]. If these indicators showed no correlation, all indicators were saved in the MDS, otherwise only the indicator with the highest loadings was selected for the MDS [48].

2.4.2. Soil Quality Scoring Method

After the TDS and MDS indicators were determined, linear and non-linear scoring methods were used to standardize each soil indicator to a value of 0–1 [28,29]. According to the sensitivity of soil productivity and quality, soil indicators can be categorized into “the more is better” and “the less is better”. If soil indicators are positively correlated with soil quality, a “the more is better” scoring method is used (Equation (1)). On the contrary, a “the less is better” scoring method (Equation (2)) is used. The linear scoring function is as follows (Equations (1) and (2)):
S L = X X m i n X m a x X m i n
S L = X m a x X X m a x X m i n
where SL is the linear score of each soil indicator in the range of 0–1, X is the measured value, Xmax is the maximum value, and Xmin is the minimum value [29,48]. The non-linear scoring function is as follows (Equation (3)):
S N L = a 1 + ( X / X m ) b
where SNL is the non-linear score of each soil indicator within the range of 0–1, X is the measured value, and Xm is the mean value of the soil indicator. a is the maximum value (in this paper, a = 1), b is the slope of the equation, and the type of “the more is better” is −2.5, and the type of “the less is better” is 2.5.

2.4.3. Weights of Soil Indicator and SQI

In this study, the PCA method was used to calculate the weight value of each soil indicator. The weight is equal to the ratio of the variance of the common factor of each indicator to the sum of the variance of the common factors of all indicators [26]. The soil quality index (SQI) value for each vegetation restoration type was calculated according to Equation (4):
S Q I = i = 1 n W i × S i
where Si is SL or SNL, n represents the number of soil indicators, and Wi represents the indicator weight value [28]. A higher SQI indicates a higher soil quality.

2.5. Laboratory Analysis

The experimental data were organized using Excel 2019. Before statistical analysis, all data were tested for normal distribution and the homogeneity of variance test to meet the assumptions of statistical analysis. The one-way analysis of variance (ANOVA) and least significant difference (LSD) methods (p < 0.05) were used to test the effects of different vegetation restoration types on the soil quality index. Pearson correlation analysis was used to calculate the correlation between soil indicators, SQI, respectively. The above analyses were performed using SPSS 19.0 for data processing and Matlab 2015a for general linear modeling (GLM). Origin 2021 was used for graphing, and ArcGIS 10.6 was used for mapping the study area.

3. Results

3.1. Evaluation of Soil Quality

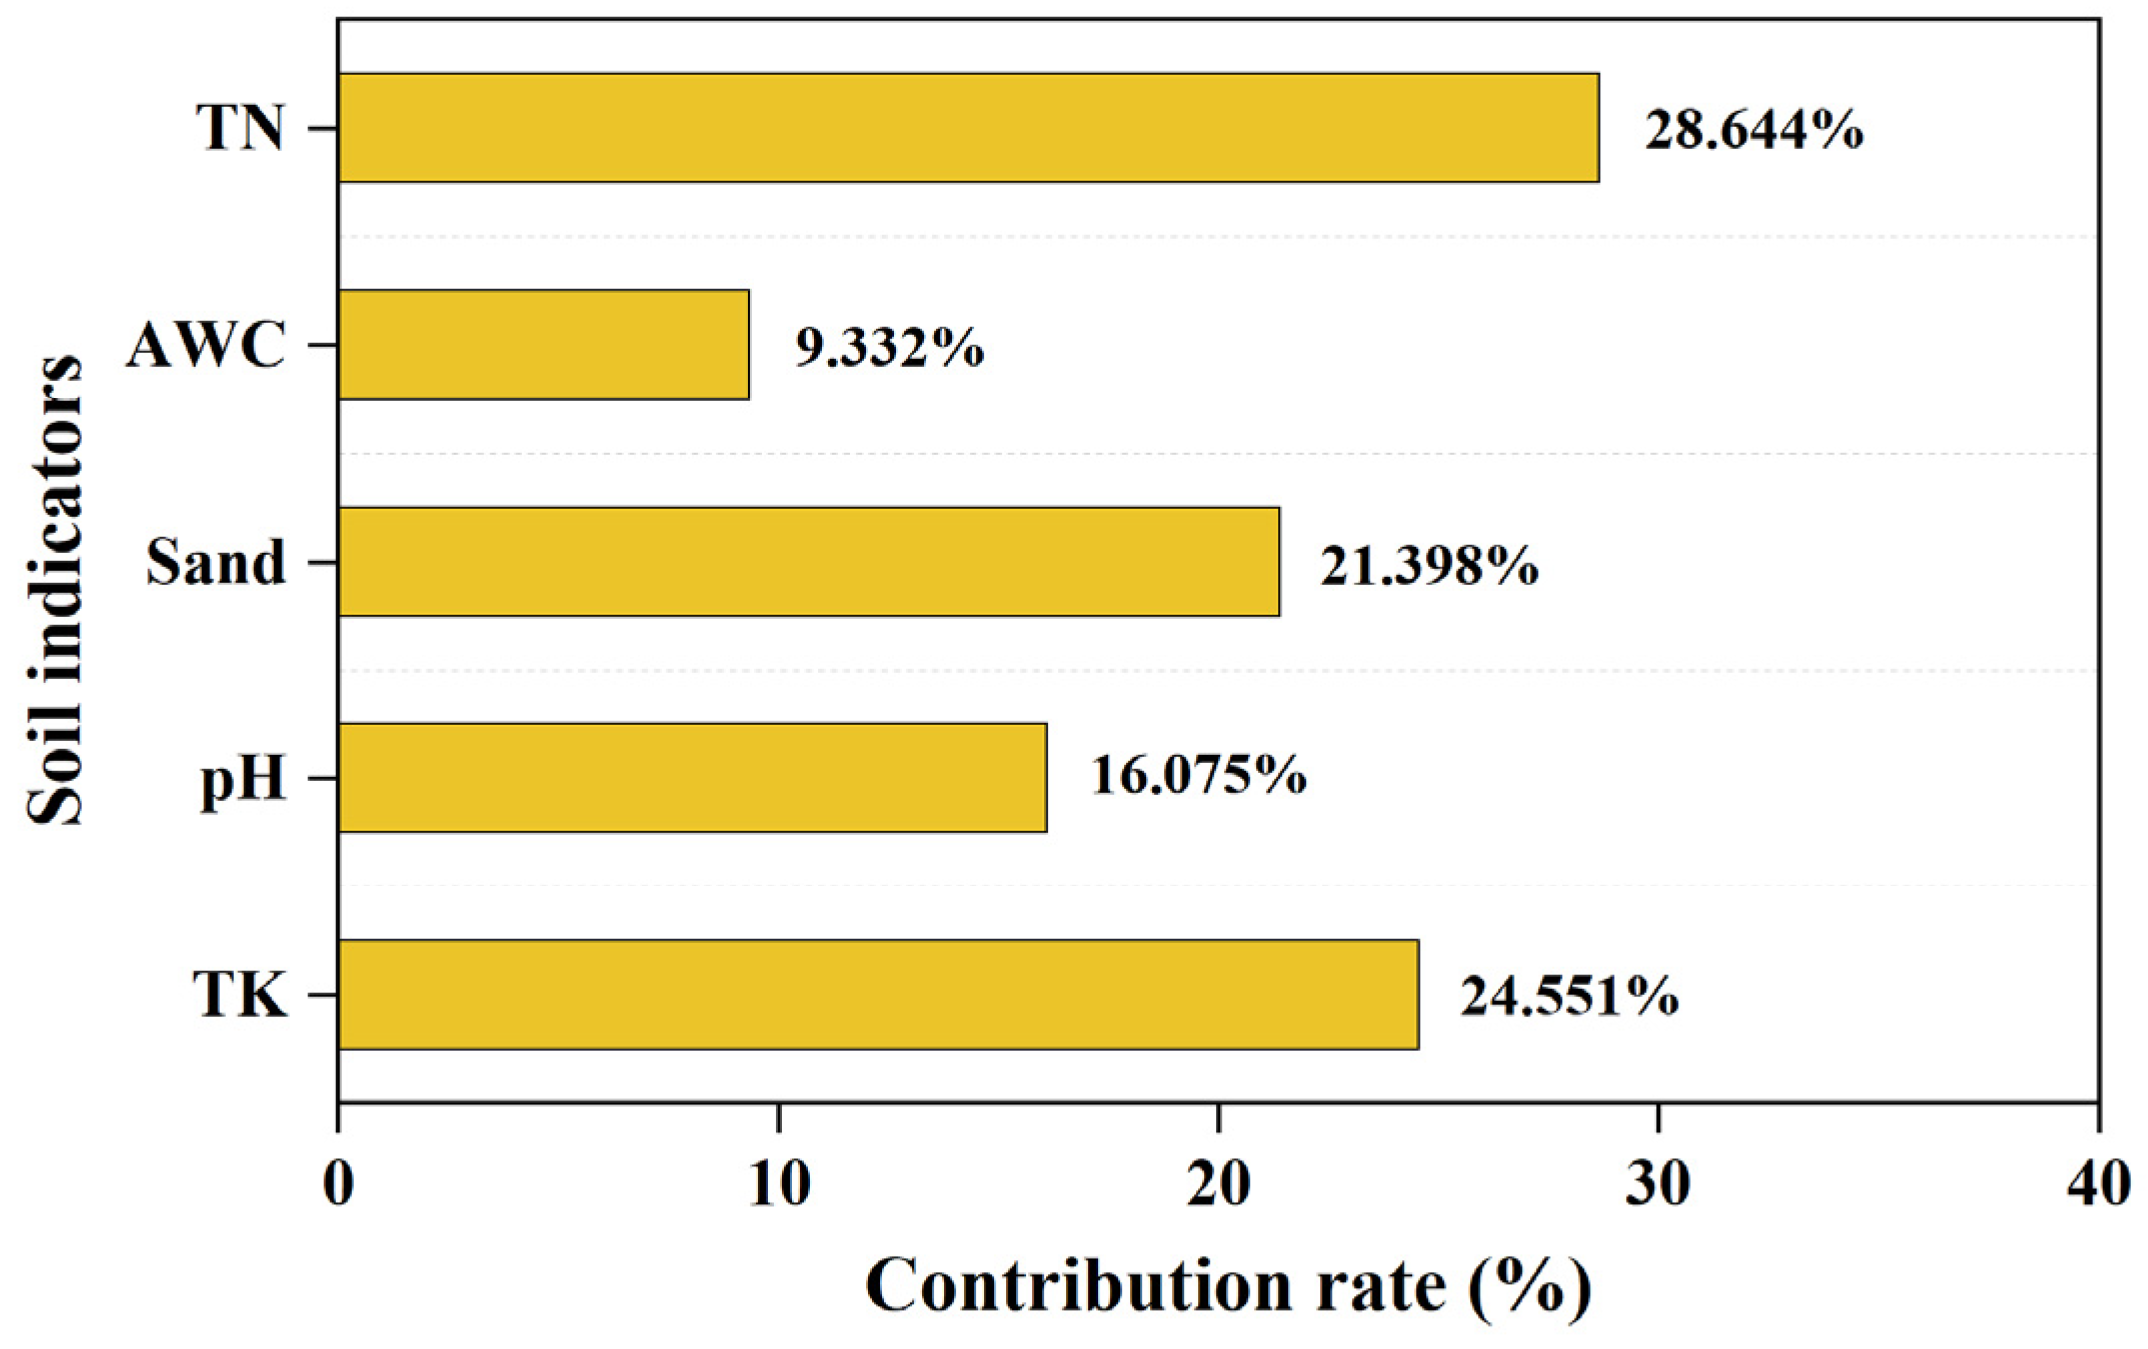
3.1.1. Selection of Soil Indicators for the MDS

The coefficient value of variation (CV) reflects the variation level of soil indicators under different vegetation restoration types. As shown in Table 2, the coefficient value of variation (CV) of AP was ≥100%, indicating that the AP of the soil in forested land represents strong spatial heterogeneity in the mountainous areas of Beijing; the CV values of the remaining soil indicators were between 10% and 100%, which were at a medium level of variability. In general, the physical and chemical properties of soils in the study area belonged to the medium level of variability.
By means of principal component analysis, the eigenvalue, the value of variance and cumulative variance contribution ratio of each principal component, and the common factor variance of each index were obtained as shown in Table 3. Following the criterion of eigenvalues ≥ 1, the cumulative variance contribution ratio for the selected five principal components was determined as 78.07%. The soil indicator with the highest loading value in PC1 was TN, and the indicators within 10% of it were SOM and AN, but the correlation between these two indicators and the TN was relatively high (Figure 2, R = 0.922, 0.886, respectively, p < 0.01), so only TN was chosen to enter the MDS. There was only one high factor loading indicator for Sand in PC2, so sand was selected for MDS. Similarly, there was only one high factor loading indicator for TK and pH in PC3 and PC4, respectively, so TK and pH were also selected for MDS.
The indicator with the highest loading value in PC5 was AWC, and its indicator within 10% was TP, which was significantly negatively correlated with AWC (R = −0.191, p < 0.05). Considering that AWC has a close relationship with the vegetation recovery, and it is an intrinsic attribute of the soil, reflecting the soil’s capability to supply water for plants, AWC was selected into the MDS. In summary, five soil indicators of TN, sand, TK, pH, and AWC were finally selected into the MDS for SQI calculation.

3.1.2. Total Data Set (TDS) and Minimum Data Set (MDS)

The linear and non-linear scoring methods were used to convert the soil indicators of TDS and MDS into scores. The types of score curves, linear and non-linear equation parameters, and weights of the selected indicators are shown in Table 4. The values of SQI were calculated by adding the normalized indicator values of TDS and MDS with their weighted products, and the SQI was calculated as follows:
SQI–LT or SQI–NLT = SOM × 0.082 + TN × 0.086 + TP × 0.056 + TK × 0.073 + AN × 0.082 + AP × 0.077 + AK × 0.079 + pH × 0.060 + CEC × 0.070 + BD × 0.078 + AWC × 0.067 + Sand × 0.064 + Silt × 0.039 + Clay × 0.087.
SQI–LM or SQI–NLM = TN × 0.21 + TK × 0.19 + pH × 0.17 + AWC × 0.20 + Sand × 0.23.
The values of SQI obtained from the linear and non-linear scoring methods based on TDS and MDS are shown in Table 5, and the range of SQI values calculated for SQI–LT, SQI–LM, SQI–NLT, and SQI–NLM were 0.141–0.669, 0.112–0.599, 0.201–0.0.681, and 0.216–0.674.
From Figure 3, we can see that the SQI calculated using MDS was highly correlated with the TDS method, with R2 values ranging from 0.700 to 0.758, indicating that MDS can adequately represent TDS for evaluating soil quality. The correlation coefficient of SQI values calculated using the non-linear scoring method (R = 0.871) was higher than that of the linear scoring method (R = 0.837) (Table 6), and the CV value of SQIs for the non-linear scoring method was higher (Table 5). Therefore, SQI–NLM method has better applicability for evaluating soil quality in the mountainous areas of Beijing.

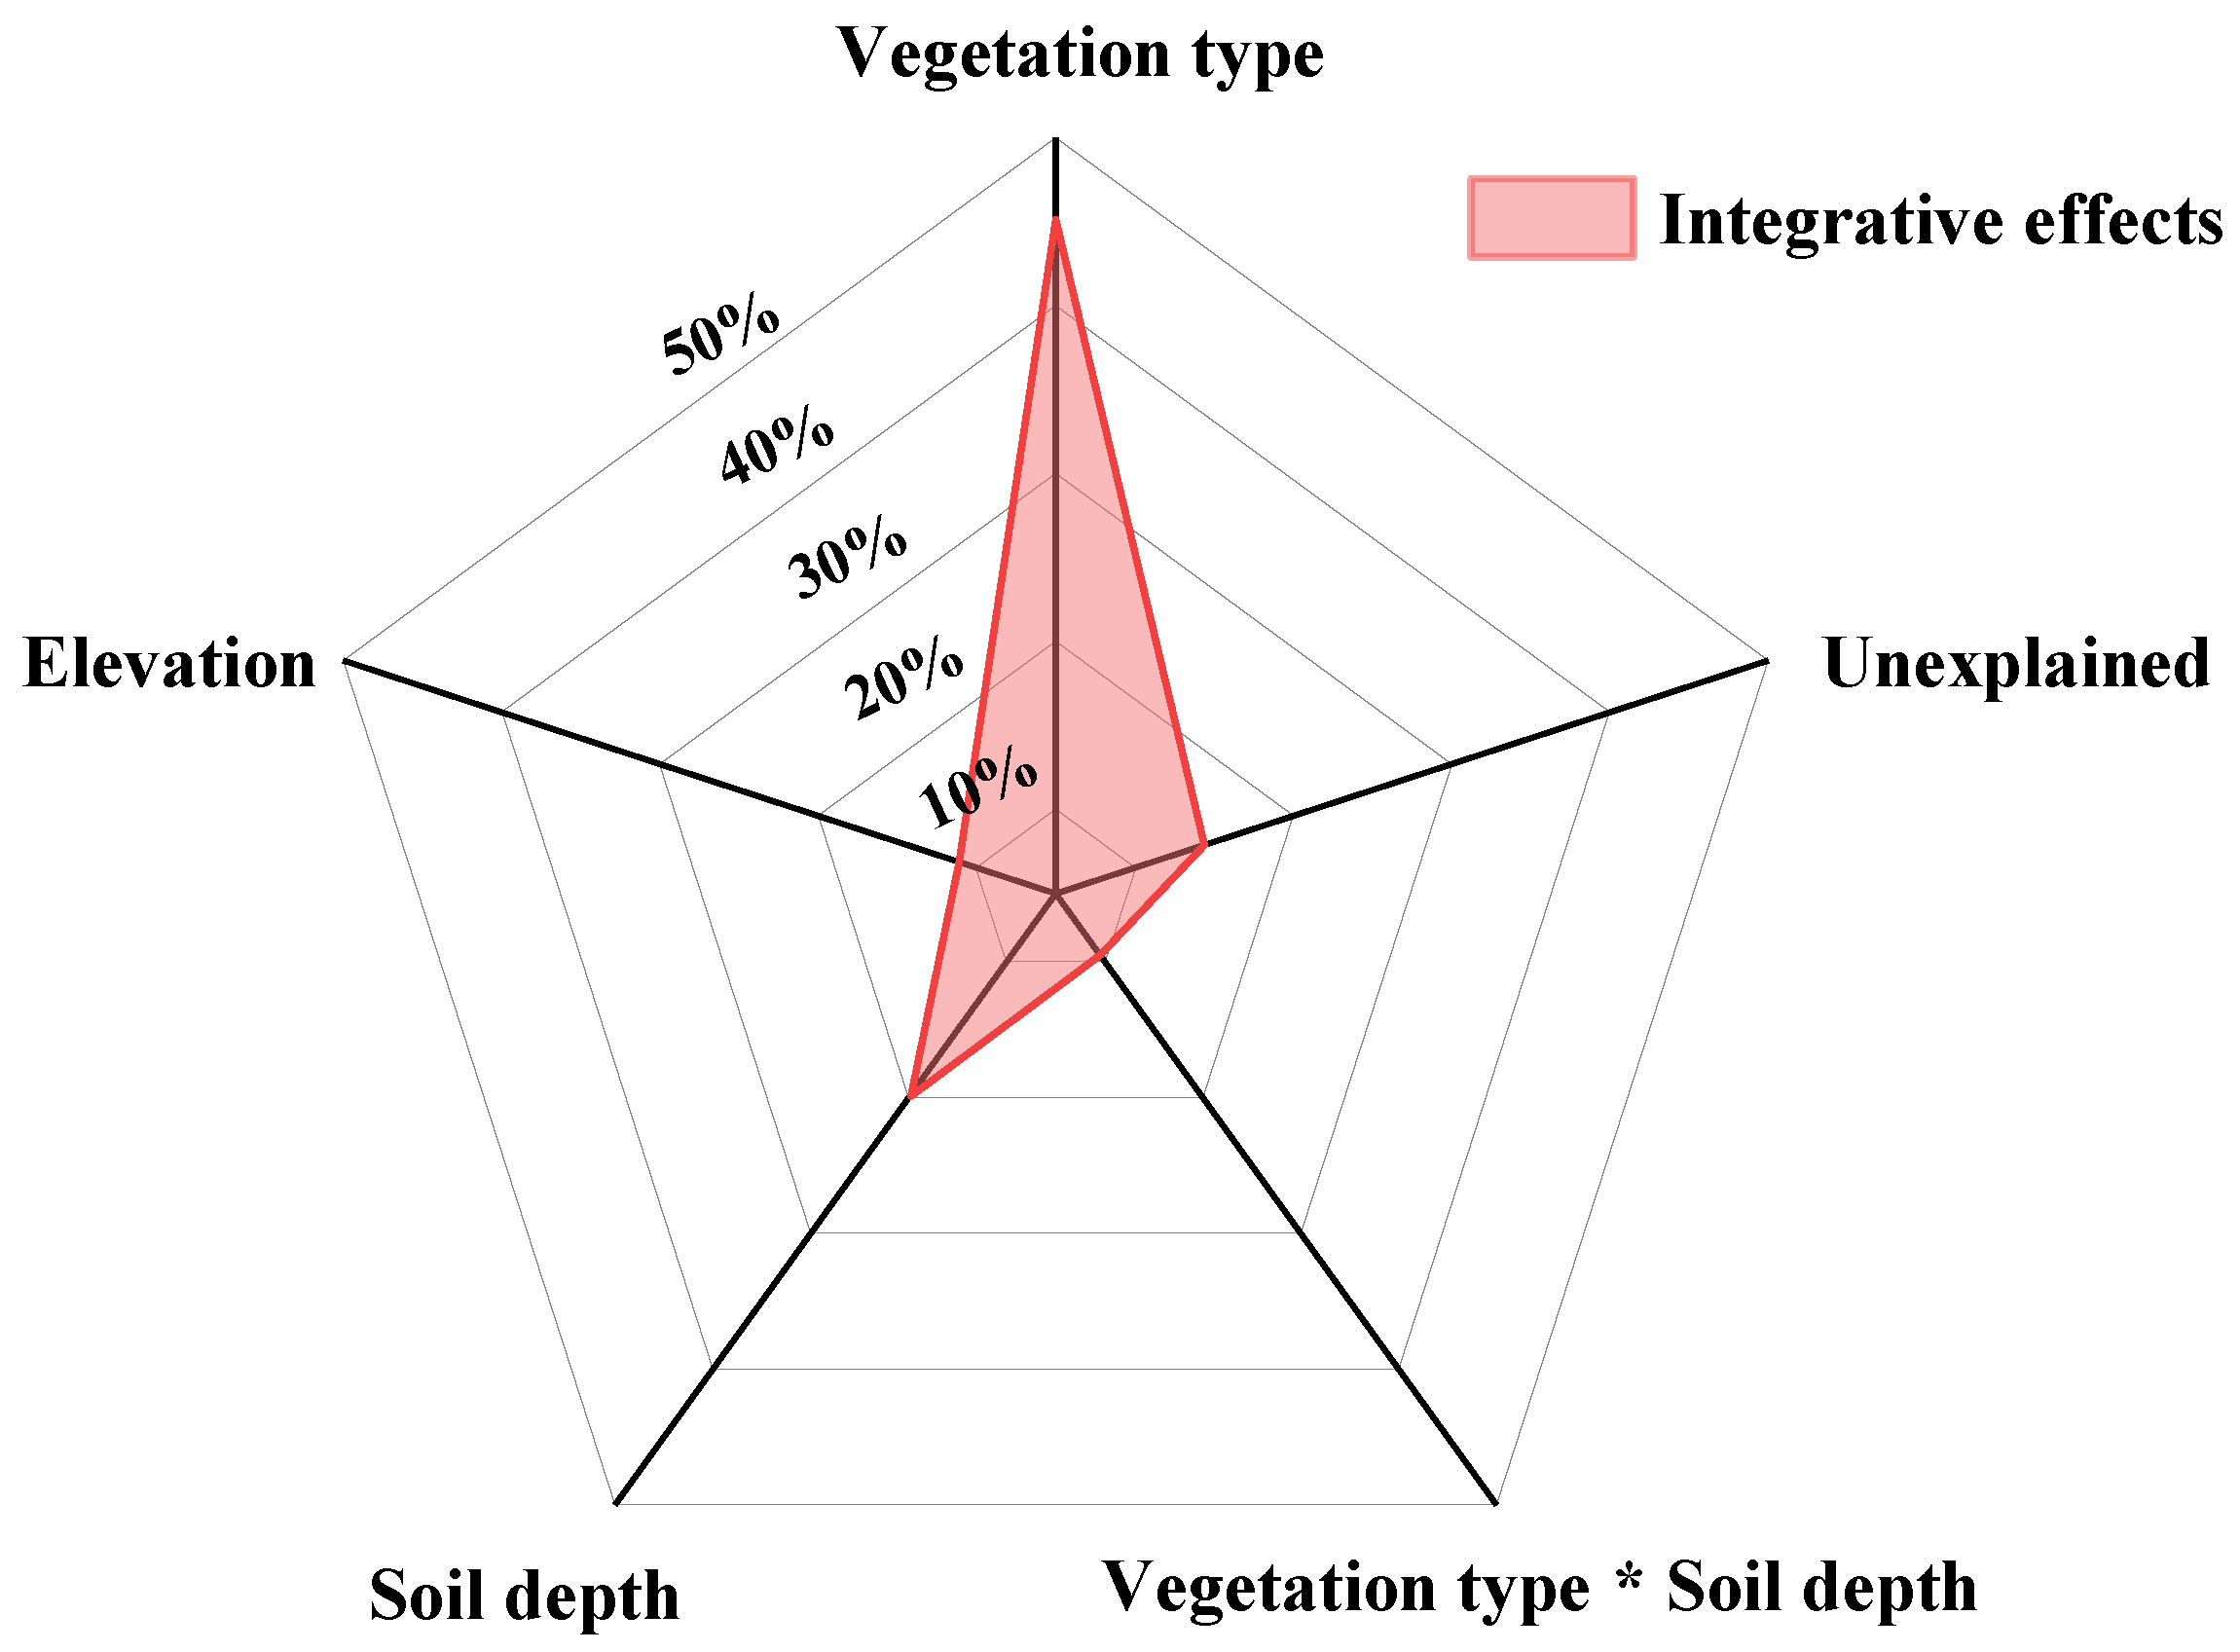
3.2. Effect of Vegetation on Soil Quality

The results of the GLM model showed that vegetation type, soil depth, interaction between vegetation type and soil depth, and elevation explained 85.24% (R2 = 85.24%) of the total variation in SQI (Figure 4).
Among all the influencing factors, three environmental variables (vegetation type, soil depth, and elevation) explain the most of the variation in SQI, the vegetation type explaining the highest percentage of variation in SQI (45.09%), followed by soil depth (19.51%), elevation (11.10%), and the interaction between vegetation type and soil depth (9.54%). This indicates that vegetation restoration is the dominant factor influencing soil quality.
The results of SQI–NLM showed that DBMF (0.54) > POCB (0.49) > PTP (0.48) > PTCB (0.45) > PPM (0.44) > POP (0.42) > NF (0.33) (Figure 5a). The SQI of DBMF was significantly higher than that of NF and the other vegetation types (p < 0.05). The SQI of NF was the lowest that was significantly lower than afforested land (p < 0.05). This indicates that artificial vegetation restoration significantly improved the soil quality.
The value of SQI at soil depths of 0–10 cm, 10–20 cm, and 20–30 cm was 0.50, 0.47, and 0.43, respectively (Figure 5b). The highest soil quality was found at 0–10 cm in the surface soil, and the soil quality tended to decrease significantly with deeper soil depth (p < 0.05).
Based on the results of PCA, the value of the contribution ratio of vegetation restoration types to the five soil indicators (Figure 6) accounts for 28.644% (TN), 21.398% (sand content), 24.551% (TK), 16.075% (pH), and 9.332% (AWC). In order to quantify which soil indicator is specifically affected by which vegetation types, the value of the difference (the result of subtraction) between the soil indicators of afforested land and those of non-afforested land was first taken to eliminate the influence of the background value of forested land conditions; second, a correlation analysis of the SQI of different vegetation types with the differences of the above soil indicators was performed. The results showed (Table 7) that POP and PTP mainly affected TN, and their soil quality was positively correlated with TN; PPM, POCB, and PTCB mainly affected TN and sand, and their soil quality was positively correlated with TN but negatively correlated with sand; DBMF mainly affected TN and AWC, and its soil quality was positively correlated with TN and AWC.

4. Discussion

4.1. Soil Quality Indices and Evaluation Methods

The significant positive correlations and regression coefficients between the four SQI methods (SQI–LT, SQI–NLT, SQI–LM, SQI–NLM) (Table 6 and Figure 3) indicate the applicability and reliability of the soil quality index (SQI) for evaluating soil quality. Among them, MDS is an effective method for selecting soil quality indicators in the process of evaluating soil quality with fewer repetitive data, higher accuracy and faster speed [16,28]. Five key soil indicators, TN, sand, TK, pH, and AWC, were finally selected for SQI calculation. Previous studies have demonstrated that SOM and TN are potential indicators of soil quality [47,49]. However, in this study, compared to SOM, TN had slightly higher loading values and a contribution ratio to SQI which has been found in other studies [27,28]. TK, as an important indicator of plant nutrient limitation, is a major influencing factor in vegetation growth and recovery. It is an important soil parameter for measuring soil fertility levels [50]. Soil pH reflects the soil buffering capacity and fertility level [46]. AWC is the soil moisture that can be absorbed and utilized by plants, which is closely related to vegetation recovery, is an intrinsic property of soil, and an important indicator for evaluating soil productivity [51]. Raiesi [29] showed that there is a significant correlation between soil texture and soil quality, as well as an effect on soil nutrients. Sand content is an important indicator of soil structure and was the only soil texture parameter used in constructing the MDS in this study. Among the different soil quality assessment methods, the SQI based on the non-linear scoring model was more sensitive and better than the SQI based on the linear scoring model due to which it has a higher CV value (Table 5). This result is consistent with the findings of Bi et al. [31] and Li et al. [32]. Through the comparison and validation of the indicators, the R2 value of linear regression (Figure 3) and the correlation results (Table 6) indicated that MDS can replace TDS for the evaluation of soil quality, and reconfirmed that the non-linear scoring model is better than the linear scoring model. SQI–NLM demonstrates better applicability in evaluating the effects of different vegetation restoration types on soil quality in the mountainous areas of Beijing.

4.2. Effect of Vegetation Restoration on Soil Quality

Forest soil is the result of the combined effects of topography and geomorphology, climate, organisms, soil matrices, and anthropogenic activities, and changes with vegetation succession [52]. The total explanatory rate of the variables related to the type of vegetation restoration on soil quality reached 54.63% (Figure 4), indicating that the type of vegetation is the most important influencing factor on the soil quality, and the same results have been reported in previous studies [53]. The sequence of SQI for different vegetation restoration types were DBMF > POCB > PTP > PTCB > PPM > POP > NF (Figure 5a). Similar conclusions were obtained that soil quality varied according to the type of vegetation restoration in previous studies [54,55,56]. Several studies have shown that soil properties and soil quality can be significantly improved after vegetation restoration [57,58,59,60]. Different vegetation restoration types may lead to changes in soil properties by altering factors such as plant diversity and vegetation cover during succession [61]. The results of this paper showed that soil bulk density and sand content tended to decrease while the soil nutrient contents of SOM, TN, TK, AN, and AK tended to increase in forested land after vegetation restoration compared to non-afforested land (Tables S1 and S2), which is consistent with the results of several previous studies, suggesting that vegetation restoration can have a positive effect on soil parameters [40,55,62]. Soil quality is closely related to major soil properties (e.g., TN, TK, sand, etc., which constitute the MDS (Figure 6), which supports Wan et al.’s [63] hypothesis that factors changing soil properties are responsible for the combination of changes in soil quality. SQI decreased with soil depth because of greater root penetration in the surface soil after vegetation restoration, while litter decomposition, nutrients released by plant roots, and root secretions were the initial elements to enter the soil surface [53].
Different vegetation restoration types can improve soil quality by influencing soil properties, but the indicators of the soil properties varied with vegetation restoration types. However, TN is a common soil indicator affected by all vegetation restoration types, which is related to the fact that vegetation restoration can improve soil parameters such as soil TN [40,55,62]. The soil quality of coniferous pure forest was only affected by TN, which may be related to the species characteristics; coniferous forests are mostly exophytic mycorrhizal species which can exacerbate N limitation of microbial processes and affect soil N cycling processes by reducing microbial mineralization capacity [64]. In this study, the TN value of PTP was greater than the POP; mixed coniferous forests and mixed coniferous and broad-leaved forests affect the sand content in addition to TN. Soil texture is closely related to the formation of soil physicochemical properties, especially affecting soil structure, soil pore condition, soil moisture, and fertilizer retention [65]. Compared with coniferous pure forests, coniferous or mixed coniferous and broad-leaved forests are rich in vegetation diversity, which have more litter and complex root networks and could loosen the soil faster and improve soil texture. In this study, we found that deciduous broad-leaved mixed forests had the highest SQI value (0.54) in terms of affecting TN and AWC, which was attributed to the fact that the input of litter from broad-leaved forests is greater than that from forests dominated by coniferous species. In forest ecosystems, the accumulation of nutrients, such as C, N, and K, in soils is mainly influenced by the litter and the type and amount of root systems [66]. The litter and root systems of broad-leaved species with a higher nitrogen content can promote the formation and stability of soil aggregates [67], and the formation and stability of aggregates can significantly improve the physical properties of soil, such as lowering the soil bulk density and increasing the soil water storage function and porosity. At the same time, the improvement of soil physical properties increases the stability of the soil carbon and nitrogen pools of broad-leaved forests, coupled with the fast rate of nutrient return from broad-leaved forests, which is of great significance to improve soil fertility by increasing soil nutrients [21]. Cremer et al. [68] also found that broad-leaved-species-dominated forests had higher soil nitrogen accumulation and carbon sequestration, resulting in a higher soil quality than conifer species–dominated forests. We noticed that different vegetation types mainly affect TN, sand, and AWC, which provides a new idea for vegetation restoration in other mountainous regions.

5. Conclusions

This study evaluated the effects of different vegetation restoration types on soil quality in the mountainous region of Beijing. The results showed the following: (1) The MDS was constructed including TN, sand, TK, pH, and AWC, and the SQI–NLM had a better applicability in evaluating the soil quality of different vegetation restoration types in the mountainous areas of Beijing. (2) Vegetation restoration improved soil quality in mountainous areas significantly. Vegetation type was the most important influencing factor in regional soil quality (45.09%) and DBMF had the highest SQI value, while the SQI values of different vegetation restoration types were ranked as DBMF > POCB > PTP > PTCB > PPM > POP > NF. (3) Different vegetation restoration types increase SQI by affecting soil indicators. TN was positively correlated with all of the vegetation types; PPM, PTCB, and POCB were negatively correlated with the effect of sand content, while DBMF was positively correlated with AWC. The selection of suitable vegetation species is the key to improving regional soil quality, and the mechanisms of different vegetation effects on TN, sand, and AWC should be paid attention to and considered in further research. The results of this study have important guiding significance for vegetation restoration and land management in the mountainous areas of Beijing.

Supplementary Materials

The following supporting information can be downloaded at: https://www.mdpi.com/article/10.3390/f14122374/s1, Table S1: Changes in soil physical indicators at 0–10 cm, 10–20 cm, and 20–30 cm soil depth under different vegetation types. Table S2: Changes in soil chemical indicators at 0–10 cm, 10–20 cm and 20–30 cm soil depth under different vegetation types.

Author Contributions

Conceptualization, S.Q.; methodology, P.L.; software, P.L.; validation, P.L.; formal analysis, P.L.; investigation, P.L., L.Z., D.Z., Y.Z., Y.T., J.L. (Jinlin Lai), R.L., J.H., J.L. (Jinsheng Lu) and X.W.; resources, P.L., L.Z., D.Z., Y.Z., Y.T., J.L. (Jinlin Lai), R.L., J.H., J.L. (Jinsheng Lu) and X.W.; data curation, P.L., L.Z., D.Z., Y.Z., Y.T., J.L. (Jinlin Lai), R.L., J.H., J.L. (Jinsheng Lu) and X.W.; writing—original draft preparation, P.L.; writing—review and editing, S.Q.; visualization, P.L.; supervision, S.Q.; project administration, S.Q.; funding acquisition, S.Q. All authors have read and agreed to the published version of the manuscript.

Funding

This research was funded by the sandification combating program for areas in the vicinity of Beijing and Tianjin, grant number 2020-SYZ-01-17JC05.

Data Availability Statement

Data sharing is not applicable because the data need to be subsequently analyzed with other data.

Acknowledgments

The authors are thankful to the Beijing Municipal Forestry and Parks Bureau for providing forestry engineering design data.

Conflicts of Interest

The authors declare no conflict of interest.

References

  1. Feng, G.; Ai, X.R.; Zang, R.G.; Ding, Y. Soil characteristics under different community types in the subtropical evergreen and deciduous broad-leaved mixed forest in southwest Hubei. J. Nat. Resour. 2016, 31, 1173–1184. [Google Scholar]
  2. Wander, M.M.; Walter, G.L.; Nissen, T.M.; Bollero, G.A.; Andrews, S.S.; Cavanaugh-Grant, D.A. Soil quality. Agron. J. 2002, 94, 23–32. [Google Scholar]
  3. Mazzon, M.; Cavani, L.; Ciavatta, C.; Campanelli, G.; Burgio, G.; Marzadori, C. Conventional versus organic management: Application of simple and complex indexes to assess soil quality. Agric. Ecosyst. Environ. 2021, 322, 107673. [Google Scholar] [CrossRef]
  4. Rathore, A.P.; Chaudhary, D.R.; Jha, B. Assessing the effects of Salicornia brachiata Roxb. growth on coastal saline soil quality over temporal and spatial scales. Appl. Soil Ecol. 2022, 169, 104196. [Google Scholar] [CrossRef]
  5. Chaer, G.M.; Myrold, D.D.; Bottomley, P.J. A soil quality index based on the equilibrium between soil organic matter and biochemical properties of undisturbed coniferous forest soils of the Pacific Northwest. Soil Biol. Biochem. 2009, 41, 822–830. [Google Scholar] [CrossRef]
  6. Adebo, B.O.; Aweto, A.O.; Ogedengbe, K. Assessment of soil quality under different agricultural land use systems: A case study of the ibadan farm settlement. Int. J. Plant Soil Sci. 2020, 32, 89–104. [Google Scholar] [CrossRef]
  7. Raiesi, F.; Beheshti, A. Evaluating forest soil quality after deforestation and loss of ecosystem services using network analysis and factor analysis techniques. Catena 2022, 208, 105778. [Google Scholar] [CrossRef]
  8. Guo, L.L.; Sun, Z.G.; Zhu, O.Y.; Han, D.R.; Li, F.D. A comparison of soil quality evaluation methods for Fluvisol along the lower Yellow River. Catena 2017, 152, 135–143. [Google Scholar] [CrossRef]
  9. Obade, V.P.; Lal, R. A standardized soil quality index for diverse field conditions. Sci. Total Environ. 2016, 541, 424–434. [Google Scholar] [CrossRef]
  10. Chen, S.; Jin, Z.; Zhang, J.; Yang, S. Soil quality assessment in different dammed-valley farmlands in the hilly-gully mountain areas of the Northern Loess Plateau, China. J. Arid Land 2021, 13, 777–789. [Google Scholar] [CrossRef]
  11. Yuan, P.L.; Wang, J.P.; Li, C.F.; Xiao, Q.Q.; Liu, Q.J.; Sun, Z.C.; Wang, J.H.; Cao, C.G. Soil quality indicators of integrated rice-crayfish farming in the Jianghan Plain, China using a minimum data set. Soil Tillage Res. 2020, 204, 104732. [Google Scholar] [CrossRef]
  12. Nakajima, T.; Lal, R.; Jiang, S. Soil quality index of a crosby silt loam in central Ohio. Soil Tillage Res. 2015, 146, 323–328. [Google Scholar] [CrossRef]
  13. Armenise, E.; Redmile-Gordon, M.A.; Stellacci, A.M.; Ciccarese, A.; Rubino, P. Developing a soil quality index to compare soil fitness for agricultural use under different managements in the Mediterranean environment. Soil Tillage Res. 2013, 130, 91–98. [Google Scholar] [CrossRef]
  14. Wang, D.W.; Bai, J.H.; Wang, W.; Zhang, G.L.; Cui, B.S.; Liu, X.H.; Li, X.W. Comprehensive assessment of soil quality for different wetlands in a Chinese delta. Land Degrad. Dev. 2018, 29, 3783–3795. [Google Scholar] [CrossRef]
  15. Karaca, S.; Dengiz, O.; Demirağ Turan, İ.; Özkan, B.; Dedeoğlu, M.; Gülser, F.; Ay, A. An assessment of pasture soils quality based on multi-indicator weighting approaches in semi-arid ecosystem. Ecol. Indic. 2021, 121, 107001. [Google Scholar] [CrossRef]
  16. Yu, P.J.; Han, D.L.; Liu, S.W.; Wen, X.; Huang, Y.X.; Jia, H.T. Soil quality assessment under different land uses in an alpine grassland. Catena 2018, 171, 280–287. [Google Scholar] [CrossRef]
  17. Abd-Elwahed, M.S. Effect of long-term wastewater irrigation on the quality of alluvial soil for agricultural sustainability. Ann. Agric. Sci. 2019, 64, 151–160. [Google Scholar] [CrossRef]
  18. Jahany, M.; Rezapour, S. Assessment of the quality indices of soils irrigated with treated wastewater in a calcareous semi-arid environment. Ecol. Indic. 2020, 109, 105800. [Google Scholar] [CrossRef]
  19. Zeraatpisheh, M.; Bakhshandeh, E.; Hosseini, M.; Alavi, S.M. Assessing the effects of deforestation and intensive agriculture on the soil quality through digital soil mapping. Geoderma 2020, 363, 114139. [Google Scholar] [CrossRef]
  20. Wu, C.; Liu, G.; Huang, C.; Liu, Q. Soil quality assessment in Yellow River Delta: Establishing a minimum data set and fuzzy logic model. Geoderma 2019, 334, 82–89. [Google Scholar] [CrossRef]
  21. Shao, G.; Ai, J.; Sun, Q.; Hou, L.; Dong, Y. Soil quality assessment under different forest types in the Mount Tai, central Eastern China. Ecol. Indic. 2020, 115, 106439. [Google Scholar] [CrossRef]
  22. Nabiollahi, K.; Taghizadeh-Mehrjardi, R.; Kerry, R.; Moradian, S. Assessment of soil quality indices for salt-affected agricultural land in Kurdistan Province, Iran. Ecol. Indic. 2017, 83, 482–494. [Google Scholar] [CrossRef]
  23. Swanepoel, P.A.; Preez, C.C.; Botha, P.R.; Snyman, H.A.; Habig, J. Soil quality characteristics of kikuyu-ryegrass pastures in South Africa. Geoderma 2014, 232–234, 589–599. [Google Scholar] [CrossRef]
  24. Zuber, S.M.; Behnke, G.D.; Nafziger, E.D.; Villamil, M.B. Multivariate assessment of soil quality indicators for crop rotation and tillage in Illinois. Soil Tillage Res. 2017, 174, 147–155. [Google Scholar] [CrossRef]
  25. Paul, G.C.; Saha, S.; Ghosh, K.G. Assessing the soil quality of bansloi river basin, eastern india using soil-quality indices (sqis) and random forest machine learning technique. Ecol. Indic. 2020, 118, 106804. [Google Scholar] [CrossRef]
  26. Rahmanipour, F.; Marzaioli, R.; Bahrami, H.A.; Fereidouni, Z.; Bandarabadi, S.R. Assessment of soil quality indices in agricultural lands of Qazvin Province, Iran. Ecol. Indic. 2014, 40, 19–26. [Google Scholar] [CrossRef]
  27. Zhang, H.S.; Yu, Y.; Zha, T.G.; Rodrigo-Comino, J. Assessing previous land-vegetation productivity relationships on mountainous areas hosting coming Winter Olympics Games in 2022. Sci. Total Environ. 2021, 788, 147870. [Google Scholar] [CrossRef]
  28. Andrews, S.S.; Karlen, D.L.; Mitchell, J.P. A comparison of soil quality indexing methods for vegetable production systems in Northern California. Agric. Ecosyst. Environ. 2002, 90, 25–45. [Google Scholar] [CrossRef]
  29. Raiesi, F. A minimum data set and soil quality index to quantify the effect of land use conversion on soil quality and degradation in native rangelands of upland arid and semiarid regions. Ecol. Indic. 2017, 75, 307–320. [Google Scholar] [CrossRef]
  30. Liu, Z.J.; Zhou, W.; Shen, J.B.; Li, S.T.; He, P.; Liang, G.Q. Soil quality assessment of Albic soils with different productivities for eastern China. Soil Tillage Res. 2014, 140, 74–81. [Google Scholar] [CrossRef]
  31. Bi, C.J.; Chen, Z.L.; Wang, J.; Zhou, D. Quantitative assessment of soil health under different planting patterns and soil types. Pedosphere 2013, 23, 194–204. [Google Scholar] [CrossRef]
  32. Li, Q.X.; Jia, Z.Q.; Liu, T.; Feng, L.L.; He, L.X.Z. Effects of different plantation types on soil properties after vegetation restoration in an alpine sandy land on the Tibetan plateau, China. J. Arid Land 2017, 9, 200–209. [Google Scholar] [CrossRef]
  33. de Lima, A.C.R.; Hoogmoed, W.; Brussaard, L. Soil quality assessment in rice production systems: Establishing a minimum data set. J. Environ. Qual. 2008, 37, 623–630. [Google Scholar] [CrossRef]
  34. Zhang, W.S.; Li, X.X.; Huang, W.J.; Li, J.H.; Ren, W.P.; Gao, Z.L. Comprehensive assessment methodology of soil quality under different land use conditions. Trans. Chin. Soc. Agric. Eng. 2010, 26, 311–318. [Google Scholar]
  35. Qi, Y.; Darilek, J.L.; Huang, B.; Zhao, Y.; Sun, W.; Gu, Z. Evaluating soil quality indices in an agricultural region of Jiangsu Province, China. Geoderma 2009, 149, 325–334. [Google Scholar] [CrossRef]
  36. Askari, M.S.; Holden, N.M. Indices for quantitative evaluation of soil quality under grassland management. Geoderma 2014, 230–231, 131–142. [Google Scholar] [CrossRef]
  37. Wang, W.; Sardans, J.; Zeng, C.; Zhong, C.; Li, Y.; Peñuelas, J. Responses of soil nutrient concentrations and stoichiometry to different human land uses in a subtropical tidal wetland. Geoderma 2014, 232, 459–470. [Google Scholar] [CrossRef]
  38. Li, C.Z.; Zhao, L.H.; Sun, P.S.; Zhao, F.Z.; Kang, D.; Yang, G.H.; Han, X.H.; Feng, Y.Z.; Ren, G.X. Deep soil C, N, and P stocks and stoichiometry in response to land use patterns in the Loess Hilly Region of China. PLoS ONE 2016, 11, e0159075. [Google Scholar] [CrossRef]
  39. Yu, P.J.; Li, Q.; Jia, H.T.; Li, G.D.; Zheng, W.; Shen, X.J.; Diabate, B.; Zhou, D.W. Effect of cultivation on dynamics of organic and inorganic carbon stocks in Songnenplain. Agron. J. 2014, 106, 1574–1582. [Google Scholar] [CrossRef]
  40. Hall, R.L.; Cammeraat, L.H.; Keesstra, S.D.; Zorn, M. Impact of secondary vegetation succession on soil quality in a humid Mediterranean landscape. Catena 2017, 149, 836–843. [Google Scholar] [CrossRef]
  41. Abdalla, M.; Hastings, A.; Chadwick, D.R.; Jones, D.L.; Evans, C.D.; Jones, M.B.; Rees, R.M.; Smith, P. Critical review of the impacts of grazing intensity on soil organic carbon storage and other soil quality indicators in extensively managed grasslands. Agric. Ecosyst. Environ. 2018, 253, 62–81. [Google Scholar] [CrossRef]
  42. LY/T 2250-2014; Technical Regulations for Forest Soil Survey. China National Forestry and Grassland Administration. Standards Press of China: Beijing, China, 2014.
  43. Shao, M.A.; Wang, Q.A.; Huang, M.B. Soil Physics; Higher Education Press: Beijing, China, 2006. [Google Scholar]
  44. Bao, S.D. Soil and Agricultural Chemistry Analysis, 3rd ed.; China Agriculture Press: Beijing, China, 2000. [Google Scholar]
  45. Shen, Y.F.; Li, J.; Cheng, F.F.; Cheng, R.M.; Xiao, W.F.; Wu, L.C.; Zeng, L.X. Correlations between forest soil quality and aboveground vegetation characteristics in Hunan Province, China. Front. Plant Sci. 2022, 13, 1009109. [Google Scholar] [CrossRef]
  46. Li, X.; Zhang, W.J.; Wu, L.; Ren, Y.; Zhang, J.D.; Xu, M.G. Advance in indicator screening and methodologies of soil quality evaluation. Sci. Agric. Sin. 2021, 54, 3043–3056. [Google Scholar]
  47. Andrews, S.S.; Carroll, C.R. Designing a soil quality assessment tool for sustainable agroecosystem management. Ecol. Appl. 2001, 11, 1573–1585. [Google Scholar] [CrossRef]
  48. Yu, P.J.; Liu, S.W.; Zhang, L.; Li, Q.; Zhou, D.W. Selecting the minimum data set and quantitative soil quality indexing of alkaline soils under different land uses in northeastern China. Sci. Total Environ. 2018, 616–617, 564–571. [Google Scholar] [CrossRef] [PubMed]
  49. Karlen, D.L.; Hurley, E.G.; Andrews, S.S.; Cambardella, C.A.; Meek, D.W.; Duffy, M.D.; Mallarino, A.P. Crop Rotation Effects on Soil Quality at Three Northern Corn/Soybean Belt Locations. Agron. J. 2006, 98, 484–495. [Google Scholar] [CrossRef]
  50. Bai, Z.G.; Wan, G.J. Study on watershed erosion rate and its environmental effects in Guizhou Karst region. J. Soil Water Conserv. 1998, 4, 1–7. [Google Scholar]
  51. Li, S.H.; Niu, Z.; Lu, P.; Wang, C.Y.; Feng, X.Y. Red soil available water capacity statistical model based on principal component analysis. Trans. Chin. Soc. Agric. Eng. 2007, 23, 92–94. [Google Scholar]
  52. Ma, T.S.; Deng, X.W.; Chen, L.; Xiang, W.H. The soil properties and their effects on plant diversity in different degrees of rocky desertification. Sci. Total Environ. 2020, 736, 139667. [Google Scholar] [CrossRef]
  53. Zhang, Y.H.; Xu, X.L.; Li, Z.W.; Liu, M.X.; Xu, C.H.; Zhang, R.F.; Luo, W. Effects of vegetation restoration on soil quality in degraded karst landscapes of southwest China. Sci. Total Environ. 2019, 650, 2657–2665. [Google Scholar] [CrossRef]
  54. Li, R.R.; Kan, S.S.; Zhu, M.K.; Chen, J.; Ai, X.Y.; Chen, Z.Q.; Zhang, J.J.; Ai, Y.W. Effect of different vegetation restoration types on fundamental parameters, structural characteristics and the soil quality index of artificial soil. Soil Tillage Res. 2018, 184, 11–23. [Google Scholar] [CrossRef]
  55. Nadal-Romero, E.; Cammeraat, E.; Perez-Cardiel, E.; Lasanta, T. Effects of secondary succession and afforestation practices on soil properties after cropland abandonment in humid Mediterranean mountain areas. Agric. Ecosyst. Environ. 2016, 228, 91–100. [Google Scholar] [CrossRef]
  56. Peng, S.L.; Chen, A.Q.; Fang, H.D.; Wu, J.L.; Liu, G.C. Effects of vegetation restoration types on soil quality in Yuanmou dry-hot valley, China. Soil Sci. Plant Nutr. 2013, 59, 347–360. [Google Scholar] [CrossRef]
  57. Lyu, D.; Liu, Q.M.; Xie, T.; Yang, Y.H. Impacts of Different Types of Vegetation Restoration on the Physicochemical Properties of Sandy Soil. Forests 2023, 14, 1740. [Google Scholar] [CrossRef]
  58. Yu, P.J.; Liu, J.L.; Tang, H.Y.; Sun, X.Z.; Liu, S.W.; Tang, X.G.; Ding, Z.; Ma, M.G.; Ci, E. Establishing a soil quality index to evaluate soil quality after afforestation in a karst region of Southwest China. Catena 2023, 230, 107237. [Google Scholar] [CrossRef]
  59. Zhang, Y.H.; Xu, X.L.; Li, Z.W.; Xu, C.H.; Luo, W. Improvements in soil quality with vegetationsuccession in subtropical China karst. Sci. Total Environ. 2021, 775, 145876. [Google Scholar] [CrossRef]
  60. Wen, H.; Ni, S.M.; Wang, J.G.; Cai, C.F. Changes of soil quality induced by different vegetation restoration in the collapsing gully erosion areas of southern China. Int. Soil Water Conserv. Res. 2021, 9, 195–206. [Google Scholar] [CrossRef]
  61. Deng, L.; Kim, D.G.; Peng, C.H.; Shangguan, Z.P. Controls ofsoil and aggregate associated organic carbon variations following natural vegetation restoration on the loess plateau in China. Land Degrad. Dev. 2018, 29, 3974–3984. [Google Scholar] [CrossRef]
  62. Zhu, P.Z.; Zhang, G.H.; Wang, H.X.; Zhang, B.J.; Wang, X. Land surface roughness affected by vegetation restoration age and types on the Loess Plateau of China. Geoderma 2020, 366, 114240. [Google Scholar] [CrossRef]
  63. Wan, R.P.; Luo, D.Y.; Liu, J.Y.; Zhang, Y.; Xiang, Y.Q.; Yan, W.; Xie, Y.J.; Mi, J.X.; Zhang, F.; Wan, X.Q.; et al. Superior improvement on soil quality by Pennisetum sinese vegetation restoration in the dry-hot valley region, SW China. Sci. Total Environ. 2023, 878, 163185. [Google Scholar] [CrossRef] [PubMed]
  64. Orwin, K.H.; Kirschbaum, M.U.; St John, M.G.; Dickie, I.A. Organic nutrient uptake by mycorrhizal fungi enhances ecosystem carbon storage: A model-based assessment. Ecol. Lett. 2011, 14, 493–502. [Google Scholar] [CrossRef] [PubMed]
  65. Liao, K.H.; Xu, S.H.; Wu, J.C.; Zhu, Q. Spatial estimation of surface soil texture using remote sensing data. Soil Sci. Plant Nutr. 2013, 59, 488–500. [Google Scholar] [CrossRef]
  66. Morrison, I.K.; Foster, N.W. Fifteen-year change in forest floor organic and element content and cycling at the Turkey Lakes watershed. Ecosystems 2001, 4, 545–554. [Google Scholar] [CrossRef]
  67. Chen, C.F.; Liu, W.J.; Jiang, X.J.; Wu, J.E. Effects of rubber-based agroforestry systems on soil aggregation and associated soil organic carbon: Implications for land use. Geoderma 2017, 299, 13–24. [Google Scholar] [CrossRef]
  68. Cremer, M.; Kern, V.N.; Prietzel, J. Soil organic carbon and nitrogen stocks under pure and mixed stands of European beech, Douglas fir and Norway spruce. For. Ecol. Manag. 2016, 367, 30–40. [Google Scholar] [CrossRef]
Figure 1. Location of study sites in mountainous areas of Beijing.
Forests 14 02374 g001
Figure 2. Correlation coefficient matrix of physical and chemical properties of soils. * indicates p < 0.05. ** indicates p < 0.01.
Forests 14 02374 g002
Figure 3. Relationships between soil quality indexes calculated using the TDS, MDS, and linear scoring (a) and non-linear scoring methods (b).
Forests 14 02374 g003
Figure 4. Results obtained from the general linear model (GLM), showing the integrative effects of vegetation type, soil depth, the interaction between vegetation type and soil depth, and the elevation of the study area on the soil quality index (SQI). * indicates interactions.
Forests 14 02374 g004
Figure 5. Comparison of soil quality between different vegetation types under 0–30 cm (a) and different soil depths (b). Note: Lowercase letters indicate significant differences in soil quality across vegetation types and soil depths (one-way ANOVA, p < 0.05).
Forests 14 02374 g005
Figure 6. Overall effect of vegetation restoration type on five soil indicators.
Forests 14 02374 g006
Table 1. Basic information of sample plots.
Vegetation TypeElevation
(m)
Slope
Gradient
(°)
Slope PositionSlope AspectAverage Vegetation
Density
(Trees/ha2)
Dominant SpeciesMixing RatioSoil Depth
(cm)
POP295–44017–25Middle slopes, Lower slopesSunny slopes1025Platycladus orientalis40–50
PTP319–43516–26Lower slopesSunny slopes, semi–sunny slopes1050Pinus tabulaeformis40–60
PPM273–39319–26Lower slopesSunny slopes, semi–sunny slopes1050Platycladus orientalis, Pinus tabulaeformis6:440–60
POCB300–42519–24Middle slopes, Lower slopesSunny slopes975Platycladus orientalis, Prunus sibirica L., Cotinus coggygria Scop.5:3:240–60
PTCB297–43217–26Lower slopesSunny slopes1035Pinus tabulaeformis, Quercus acutissima, Prunus sibirica L.5:3:240–70
DBMF283–39018–25Lower slopesSunny slopes925Quercus acutissima, Ulmus pumila L., Prunus sibirica L.4:3:350–80
NF308–41417–23Middle slopes, Lower slopesSunny slopesCarex spp., Chrysanthemum chanetii H. Lév., Artemisia stechmanniana Besser, Potentilla freyniana Bornm.40–50
Table 2. Characteristic values of soil indicators from 0 to 30 cm.
Soil IndicatorsMinimumMaximumMeanSDCV/%
SOM (g/kg)3.674152.43945.25530.28466.919
TN (g/kg)0.2627.2912.3581.37758.394
TP (g/kg)0.0631.0450.4910.17134.864
TK (g/kg)0.67788.82725.53316.07862.971
AN (mg/kg)18.900402.772160.19184.02352.452
AP (mg/kg)0.06530.5372.9964.490149.856
AK (mg/kg)0.505680.000178.685118.43066.278
pH5.3659.0907.4740.96412.894
CEC (mmol/kg)134.000227.000173.46918.05710.409
BD (g/cm3)1.0501.3701.2600.14211.243
AWC (%)10.00063.00028.53111.69240.982
Sand (%)29.90054.60044.1055.33312.092
Silt (%)26.20043.30036.1883.62410.014
Clay (%)14.50031.00019.7102.79814.196
Note: SOM: soil organic matter; TN: total nitrogen; TP: total phosphorus; TK: total potassium; AN: available nitrogen; AP: available phosphorus; AK: available potassium; CEC: cation exchange capacity; BD: bulk density; AWC: available water capacity; Sand: sand content; Silt: silt content; Clay: clay content. SD: standard deviation; CV: coefficient of variation.
Table 3. Principal component analysis of soil quality indicators.
Soil IndicatorsPC1PC2PC3PC4PC5COM
SOM0.896−0.090−0.2580.0260.1250.894
TN0.907−0.036−0.339−0.0180.0400.941
TP0.450−0.345−0.0370.2050.4990.613
TK0.0740.0430.6670.6380.0120.860
AN0.8760.013−0.2790.209−0.0520.892
AP0.466−0.1250.589−0.1430.2410.658
AK0.661−0.1990.5140.125−0.0200.756
pH0.170−0.046−0.3420.709−0.4370.841
CEC0.4900.3320.235−0.124−0.0870.429
BD0.559−0.414−0.012−0.454−0.1130.703
AWC−0.4880.344−0.1620.2230.5490.735
Sand0.3240.9170.047−0.081−0.0220.955
Silt0.2090.7620.203−0.130−0.3460.801
Clay0.2950.785−0.1760.0400.3400.852
Eigenvalues4.312.631.591.331.08
Variance (%)30.7918.7511.359.497.69
Cumulative variance (%)30.7949.5460.8970.3878.07
Note: PC1, PC2, PC3, PC4, and PC5 indicates the first principal component, second principal component, third principal component, fourth principal component, and fifth principal component; COM indicates communalities. Bold indicates high load indicators.
Table 4. Values of indicator weights for each data set (parameters of non-linear and linear equations, the weights for the soil indicators in the total data set and minimum data set).
Soil
Indicators
LinearNon-LinearWeights
XmaxXminMeanSlopeTotal Data SetMinimum Data Set
SOM152.443.6745.25−2.50.082
TN7.290.262.36−2.50.0860.21
TP1.040.060.49−2.50.056
TK88.830.6825.53−2.50.0730.19
AN402.7718.90160.19−2.50.082
AP30.540.073.00−2.50.077
AK680.000.51178.69−2.50.079
pH9.095.377.47−2.50.0600.17
CEC227.00134.00173.47−2.50.070
BD1.371.151.262.50.078
AWC63.0010.0028.53−2.50.0670.20
Sand54.6029.9044.102.50.0640.23
Silt43.3026.2036.19−2.50.039
Clay31.0014.5019.71−2.50.087
BD and sand belong to the “less is better” scoring curve, while SOM, TN, TP, TK, AN, AP, AK, pH, CEC, AWC, silt, and clay belong to the “more is better” scoring curve.
Table 5. Descriptive statistics for each data set of soil quality evaluation.
MinimumMaximumMeanCV/%
SQI–LT0.1410.6690.35916.760
SQI–LM0.1120.5990.35026.490
SQI–NLT0.2010.6810.45321.270
SQI–NLM0.2160.6740.46428.080
Table 6. Correlation of different SQIs under two scoring methods.
SQI–NLTSQI–NLMSQI–LTSQI–LM
SQI–NLT1
SQI–NLM0.871 **1
SQI–LT0.901 **0.870 **1
SQI–LM0.702 **0.908 **0.837 **1
** indicates p < 0.01.
Table 7. Effect of vegetation type on soil indicators and correlation relationships.
Vegetation TypesSoil IndicatorsCorrelation Coefficient/RSignificance
POPTN0.650p < 0.01
PTPTN0.489p < 0.05
PPMTN0.861p < 0.01
Sand−0.681p < 0.05
POCBTN0.691p < 0.01
Sand−0.509p < 0.05
PTCBTN0.802p < 0.01
Sand−0.683p < 0.01
DBMFTN0.770p < 0.01
AWC0.433p < 0.05
Disclaimer/Publisher’s Note: The statements, opinions and data contained in all publications are solely those of the individual author(s) and contributor(s) and not of MDPI and/or the editor(s). MDPI and/or the editor(s) disclaim responsibility for any injury to people or property resulting from any ideas, methods, instructions or products referred to in the content.

