Article

Inverted Soil Mounding as a Restoration Approach of Seismic Lines in Boreal Peatlands: Implications on Plant and Arthropod Abundance and Diversity

Natural Resources Canada—Canadian Forest Service, Northern Forestry Centre, Edmonton, AB T6H 3S5, Canada
*
Author to whom correspondence should be addressed.
Forests 2023, 14(11), 2123; https://doi.org/10.3390/f14112123
Submission received: 21 September 2023 / Revised: 17 October 2023 / Accepted: 23 October 2023 / Published: 25 October 2023

Abstract

:
In northern Alberta, Canada, much of treed boreal peatlands are fragmented by seismic lines—linear disturbances where trees and shrubs are cleared for the exploration of fossil fuel reserves. Seismic lines have been shown to have slow tree regeneration, likely due to the loss of microtopography during the creation of seismic lines. Inverted soil mounding is one of the treatments commonly applied in Alberta to restore seismic lines and mitigate the use of these corridors by wildlife and humans. We assessed the effects of mounding on understory plants and arthropod assemblages three years after treatment application. We sampled five mounded and five untreated seismic lines and their adjacent treed fens (reference fens). Compared to reference fens, mounded seismic lines showed on average lower bryophyte (6.5% vs. 98.1%) and total understory cover (47.2% vs. 149.8%), ground-dwelling spider abundance (226.0 vs. 383 individuals), richness (87.2 vs. 106.4 species) and diversity (19.0 vs. 24.6 species), rove beetle abundance (35.2 vs. 84.8 individuals), and ant richness (9.0 vs. 12.9 species). In contrast, rove beetle and ground beetle richness (39.0 and 14.5 species, respectively) and diversity (16.8 and 7.8 species, respectively) were higher on mounded seismic lines compared to reference fens (richness: 18.0 and 7.5 species, respectively; diversity: 7.0 and 3.8 species, respectively). This is one of the first studies to assess arthropod responses to restoration efforts in the context of oil and gas disturbances in North America, and our results highlight the need to incorporate multiple taxa when examining the impact of such treatments.

1. Introduction

Peatlands are home to unique species assemblages and play an important role in global carbon storage [1]. However, much of peatlands globally are degraded by human disturbance, and peatland recovery can be slow [2,3]. For example, in northern Alberta, Canada, peatlands are heavily fragmented by linear disturbances, many of which are seismic lines that are corridors where vegetation is cleared (mostly trees and shrubs) to allow access for machinery and personnel for exploration of fossil fuel reserves. Seismic lines are of particular concern as they have been shown to have slow tree regeneration, especially in treed peatlands [3,4]. This has been attributed to the loss of microtopography during their construction [5], as the hummock–hollow topography, typical of peatlands, is flattened by machinery on the lines. Hummocks provide an elevated microhabitat for woody plants to escape flooding in peatlands; thus, the loss of micro-topography leads to a loss of suitable habitat for tree growth [6]. Since the ubiquitous presence of seismic lines negatively impacts the threatened woodland caribou (Rangifer tarandus caribou (Gmelin, 1788)) [7] via habitat loss and predation [8,9,10], widespread efforts to restore seismic lines are underway within the province [11].
Inverted soil mounding is one of the treatments commonly applied in Alberta with the objective of improving tree regeneration on seismic lines and mitigating the use of such corridors by wildlife and humans. This treatment involves excavating the soil and inverting the substrate to create a mound that is placed on the adjacent ground, leaving behind a pit [12,13]. It is a silvicultural technique used by the forest industry to establish suitable conditions for tree growth by creating a drier elevated microhabitat and reducing competing vegetation [11,14]. While studies have found that mounded seismic lines have higher tree regeneration [12], other studies have also shown inverted mounding alters peat properties [15], reduces understory cover [16,17], and significantly increases heterogeneity in microtopography compared to adjacent reference fens [18]. However, additional research is needed to further explore the impact of mounding treatments on overall ecosystem properties and biodiversity, especially as the loss in vegetative cover can affect habitat quality (i.e., biophysical conditions) for peatland fauna.
In this study, we assess the impact of inverted mounding on both arthropod and vegetation assemblages in treed fens of northeastern Alberta. In contrast to assessments of single taxa, assessments of multiple taxa are more valuable as they provide a broader understanding of biodiversity responses to treatment applications, which in turn can better inform restoration outcomes. While vegetation responses to peatland restoration efforts are commonly assessed [12,17,19], arthropod responses are rarely evaluated; however, see [20,21]. Arthropods are useful bioindicators as they are abundant, highly diverse, and responsive to disturbances [22,23]. They also play an integral role in the food web and are important pollinators. Arthropod assemblages are influenced by vegetation cover, micro-topography, soil moisture (water level), and peat quality [21,23,24]. In particular, arthropods benefit from the structure and micro-climate created by understory plants [24]. For example, bryophytes modulate moisture and temperature fluxes and provide refugia from predators [25]. Web-weaving spiders also rely on plants to support their webs. Heterogeneous micro-topography also benefits arthropods as their microhabitat preference can vary seasonally [26]. For example, certain ground beetle species prefer Sphagnum lawns during the summer. However, these Sphagnum moss lawns can freeze over the winter and are usually flooded by snowmelt in the spring; thus, these ground beetle species will usually hibernate in the higher hummocks [26].
Our objective was to determine how plant and ground-dwelling spider, rove beetle, ground beetle, and ant responses differ between mounded seismic lines, untreated seismic lines, and the adjacent reference fens in treed moderate-rich fens in northeastern Alberta. Specifically, we compared treated and untreated seismic lines, where woody vegetation had been previously cleared, and the adjacent reference fen, where tree cover remained intact. While the restoration goal of soil mounding along seismic lines in peatlands is to improve growing conditions for planted seedlings and facilitate the return of forest cover, documenting the short-term biodiversity response is important to understand treatment effects and to provide baseline information that can be used to assess overall restoration success from an ecological context.
As inverted mounding buries the understory and soil layers where most ground-dwelling arthropods occur, we hypothesize that altered habitat conditions will impact local populations and, therefore, lead to a lower abundance of ground-dwelling arthropods on mounded seismic lines compared to either the untreated lines or the reference fens. We also expect arthropod abundance to be lower on untreated seismic lines than in the reference fens due to the shallow water table resulting from peat compaction [27,28]. However, we expect arthropod abundance on untreated seismic lines to be greater than on mounded seismic lines, as studies in forestry have shown site preparation treatments after harvesting can lead to further declines in arthropod abundance, compared to tree removal alone [29]. We expect the ingress of open-habitat species colonizing the newly disturbed sites will lead to increased richness and diversity across all taxa on both untreated and mounded seismic lines. In addition, arthropod assemblages are influenced by plant communities [22,23]; thus, we also expect arthropod assemblages to differ among treated, untreated, and reference conditions, as plant communities are altered by mounding [16,17]. Previous studies have shown mounding reduces bryophyte and total understory cover [16,17] at the top of the created mounds; thus, we expect mounded seismic lines to have lower bryophyte and understory cover compared to reference fens.

2. Materials and Methods
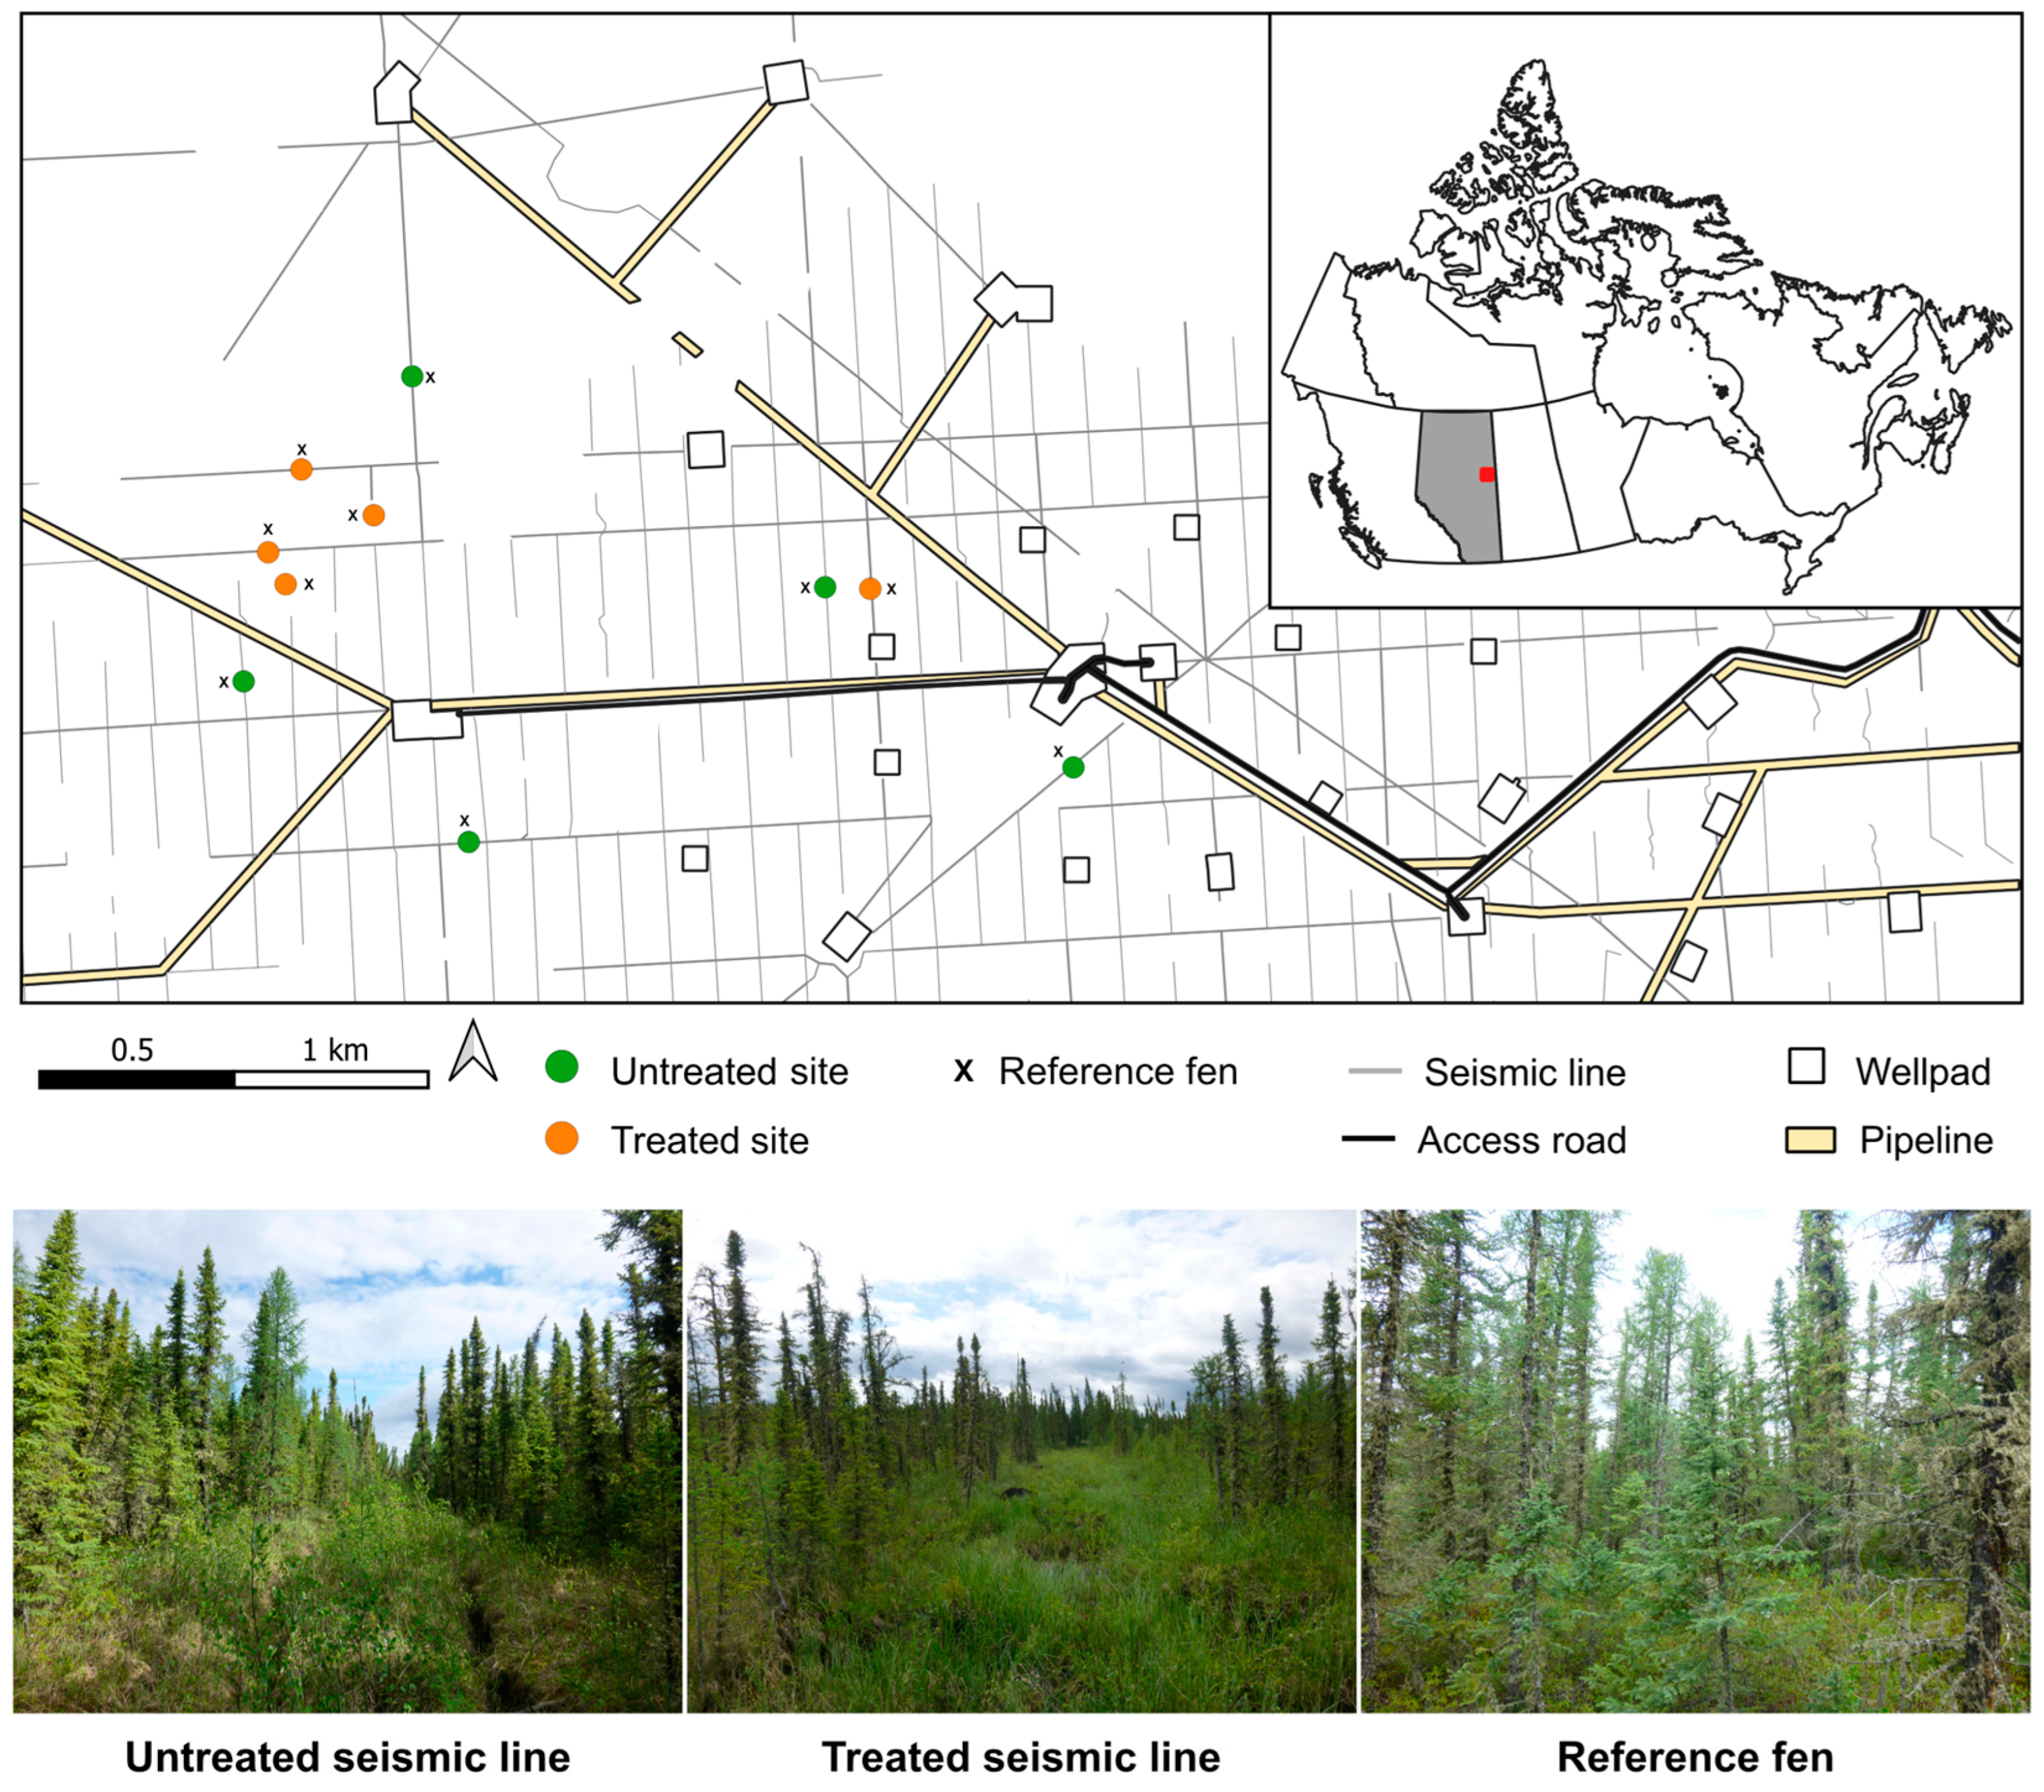
2.1. Study Area

This study was conducted on moderate-rich fens within the Canadian Natural Resources Ltd. (CNRL) Kirby South in-situ steam-assisted gravity drainage (SAGD) Plant in the Athabasca oil sands (55°22′37.2″ N, 111°10′3″ W; Figure 1), approximately 45 km south of Conklin, Alberta. The overstory in the study area is dominated by black spruce (Picea mariana (Miller) Britton, Sterns & Poggenburgh) and tamarack (Larix laricina (DuRoi) K. Koch). Three-leaved false Solomon’s seal (Maianthemum trifolium (Linnaeus) Sloboda), peat mosses (Sphagnum spp. Linnaeus), and sedges (Carex spp. Linnaeus) dominate the understory layer. Seismic lines in the study area were constructed in 1998–2001. Inverted mounding was applied to a subset of these lines in 2015, three years prior to data collection in May–August 2018. Mound height at construction was targeted to be 80 cm [12], and in 2018, based on our measurements, it was, on average, (±SD) 34.4 ± 5.16 cm. Mounds were constructed every 3 m in a 1–2 checkered pattern along the whole width of treated seismic lines [12]. Black spruce seedlings were also planted on the mounds of most treated lines; see Filicetti et al. [12] for additional information on planting.

2.2. Data Collection

We selected ten sites disturbed by a seismic line: five untreated seismic lines (“Untreated”) and five mounded seismic lines (“Mounded”). Each site included its adjacent reference fens (“Reference”). At each site, we placed two 50 m long transects parallel to each other, one along the seismic line and one 50 m into the adjacent fen (“Reference”). We established a sampling point every 10 m along the transects, for a total of five sampling points at each transect and ten sampling points at each site.

2.2.1. Understory Vegetation

At each sampling point, we sampled understory vegetation in 1 × 1 m quadrats over a 10-day period in mid-July 2018. On untreated seismic lines and in the reference fens, we used one quadrat at each sampling point. On mounded seismic lines, we selected the closest mound along the transect and used two quadrats, one at the top of an inverted mound (“Top”) and one at the level ground adjacent to the mound (“Ground”). This allowed us to capture the vegetation from both microhabitats, as growing conditions are expected to differ greatly between the two. Within each quadrat, we visually estimated the cover by understory species (lichen, non-vascular plants, forbs, graminoids, and species ≤ 1.5 m tall) to the nearest 1%. We identified plants to the species level in the field, with some exceptions (most non-vascular and lichens) in which identifications were made at the genus level. Only vascular plants were included in the diversity and multivariate analyses. Nomenclature is based on the Database of Vascular Plants of Canada (VASCAN) [30] for vascular plants and the Integrated Taxonomic Information System (ITIS) [31] for non-vascular plants.

2.2.2. Ground-Dwelling Arthropods

At each sampling point, we installed a pitfall trap. In mounded areas, traps were installed at the top of the mound. Traps consisted of 1 L plastic containers (11 cm diameter) dug into the peat with the rim leveled at the ground surface [32]. We used propylene glycol (ca. 200 mL) as a preservative, and we suspended a corrugated 20 × 20 cm square plastic roof with wire over the traps to reduce rain and falling debris into the container. Traps were installed on 23–24 May 2018 and were serviced every three weeks until 5–6 September 2018. Samples were returned to the laboratory where spiders (Araneae), ground beetles (Carabidae), rove beetles (Staphylinidae), and ants (Formicidae) were sorted and identified to the species level. Spider nomenclature followed the World Spider Catalog [33], ground beetle nomenclature followed Lindroth [34], rove beetle nomenclature followed Newton et al. [35] and Bousquet et al. [36], and ant nomenclature followed Bolton [37], Ellison et al. [38], and Glasier et al. [39]. Voucher specimens are deposited in the Arthropod Collection at the Northern Forestry Centre (Natural Resources Canada, Canadian Forest Service) in Edmonton, Alberta.

2.3. Data Analyses

Response variables for understory vegetation were percent cover by functional group (bryophyte cover, forb cover, graminoid cover, shrub cover (includes tree species ≤ 1.5 m tall)), total understory cover (sum of the cover of all growth forms, including lichen cover), vascular species richness, vascular plant diversity (exponent of Shannon’s diversity) [40,41], and vascular plant community composition. Response variables for each arthropod taxa (ground-dwelling spiders, ground beetles, rove beetles, and ants) were abundance, species richness, diversity, and community composition. Response variables from each vegetation group and arthropod taxa were analyzed separately. For all analyses, the sole predictor variable was treatment (i.e., for plants, mounded (with plots at the “Top” and “Ground” position), untreated and reference; for arthropods, mounded (Top), untreated, and reference). Due to an outlier collection of the rove beetle Lordithon fungicola Campbell (i.e., a much greater catch on one mounded seismic line compared to all other sites), we removed the species prior to all analyses. All analyses were performed in R version 4.1.1 [42] using dedicated packages, which are provided below.

2.3.1. Richness, Diversity, and Abundance

Understory vegetation. To assess the effect of treatment on vegetation percent cover and diversity, we used General Linear Mixed-Effects Models (GLMMs) to account for spatial correlation and included a variance structure to account for heterogenous variances when needed. Models were fit using data at the quadrat level, with transect nested in site as the random effect. We fit the models using the nlme package version 3.1-152 [43]. If treatment was significant (α = 0.05), we performed post hoc multiple comparisons using the emmeans package version 1.7.0 [44].
Ground-dwelling arthropods. To account for differences in sampling effort due to trap disturbance, we estimated richness and diversity by treatment using coverage-based rarefaction [45] with pitfall samples pooled within the treatment level for the entire collection period. This technique uses a similar sampling effort (instead of a minimum number of individuals) to compare estimates among treatment levels. The analysis returns a 95% confidence interval for the estimation, which we used to assess significant differences between treatments, indicated by non-overlapping intervals. Due to the colonial nature of ants, we used incidence data (instead of abundance) for the rarefaction. We performed coverage-based rarefaction using the iNEXT version 2.0.20 package [46]. To assess arthropod abundance, we used standardized catches (number of individuals/trapping days × 102 days) to account for uneven trapping effort due to trap disturbance, with catches pooled by transect for each taxon independently. Catches were then fit using a GLMM in a similar fashion as described above for plants, using transect nested in site as a random effect and variance structures when required. Likewise, post hoc multiple comparisons were performed in such instances where the treatment effect was significant.

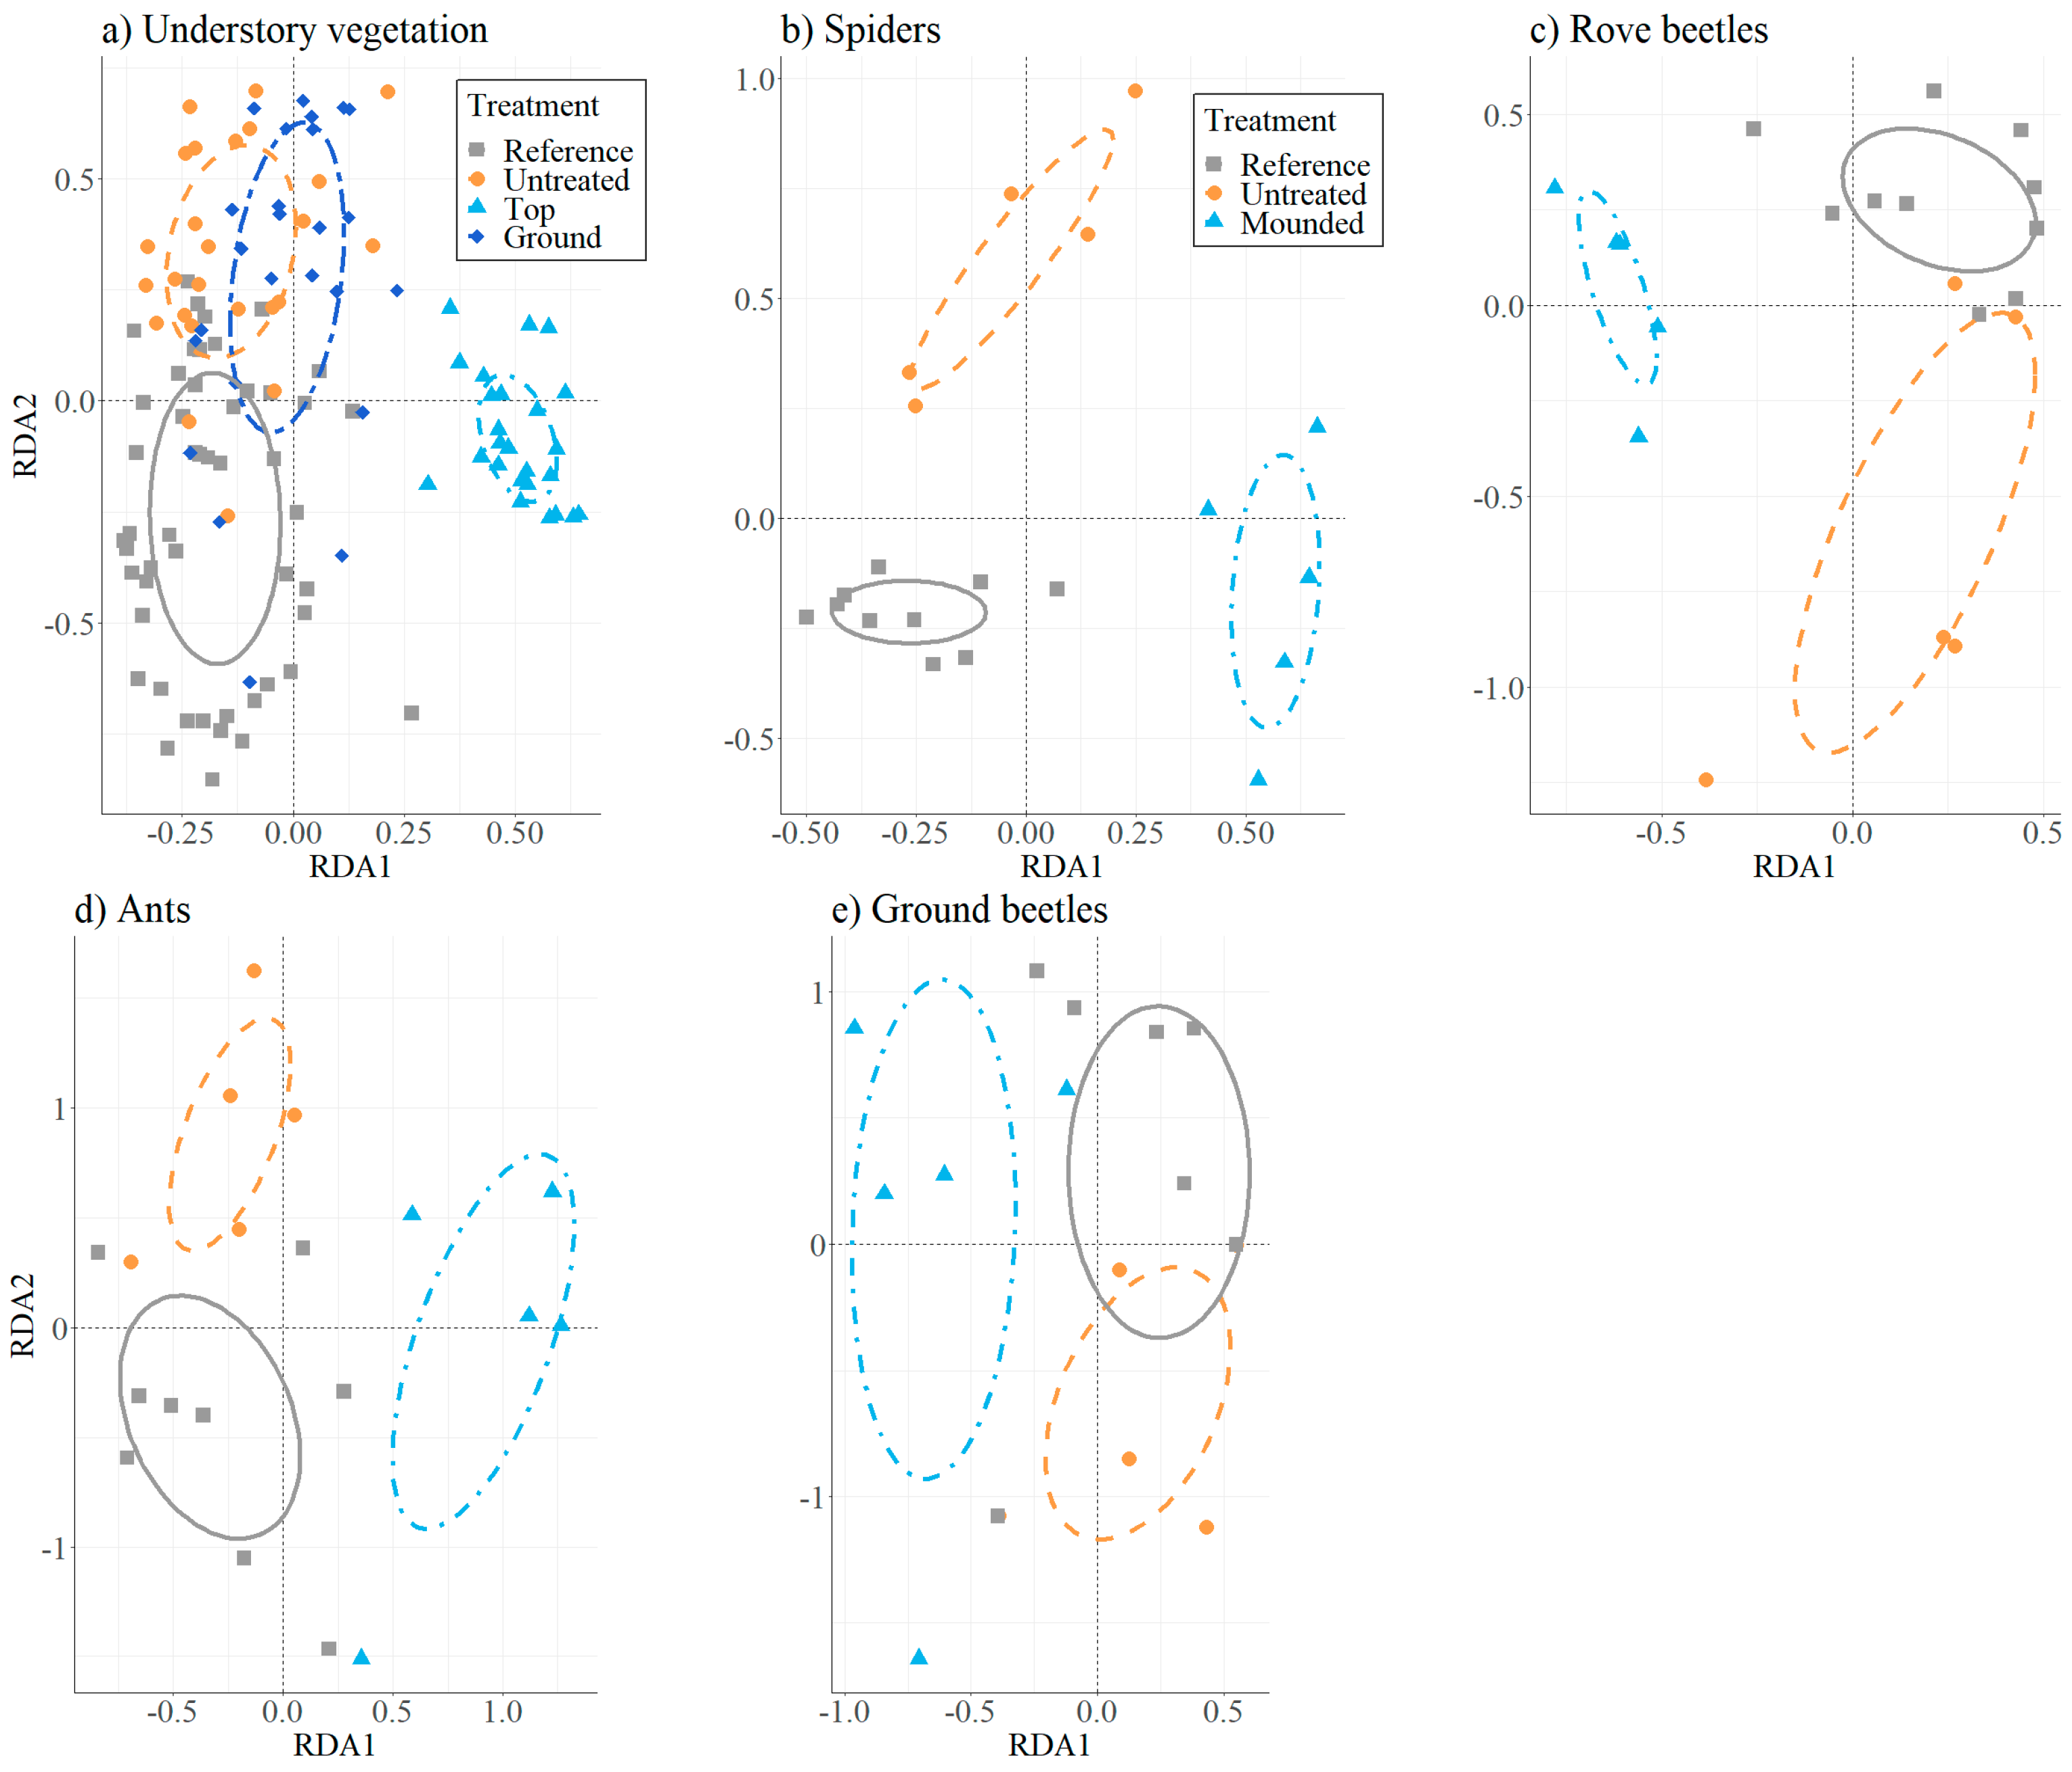
2.3.2. Species Composition and Indicator Species

We used redundancy analysis (RDA) [47,48] to evaluate the treatment effect on plant and arthropod species composition. Prior to analyses, singletons and doubletons (arthropod species represented by one or two individuals), or uniques and duplicates (plant species that occurred once or twice across all plots), were removed from the datasets, and resulting matrices were Hellinger-transformed [49] to improve model performance. As for the rarefaction above, we fit the RDA model for ants using incidence data. The significance of RDAs and of treatment effect were tested with Monte Carlo permutation tests (number of permutations = 999). Restricted permutations were applied to the arthropod analyses to account for the spatial dependency of the sampling design. However, we were unable to incorporate restricted permutations into the vegetation analysis due to the unbalanced sampling design for vegetation (by introducing the mound top and ground substrates). We fit the RDA models using the vegan package version 2.5-7 [50] and post hoc multiple comparisons using the multiconstrained function from the BiodiversityR package version 2.14-4 [51]. Indicator species of each treatment for both vegetation and arthropods were identified using the indicspecies package version 1.7.11 [52,53]. For the indicator species analysis, arthropod species with less than 10 individuals and plant species with less than 3 occurrences were removed prior to analysis. The abundance data were used for the ant indicator species analysis. We considered strong indicators as those species with a significant indicator value greater than 0.6.

3. Results

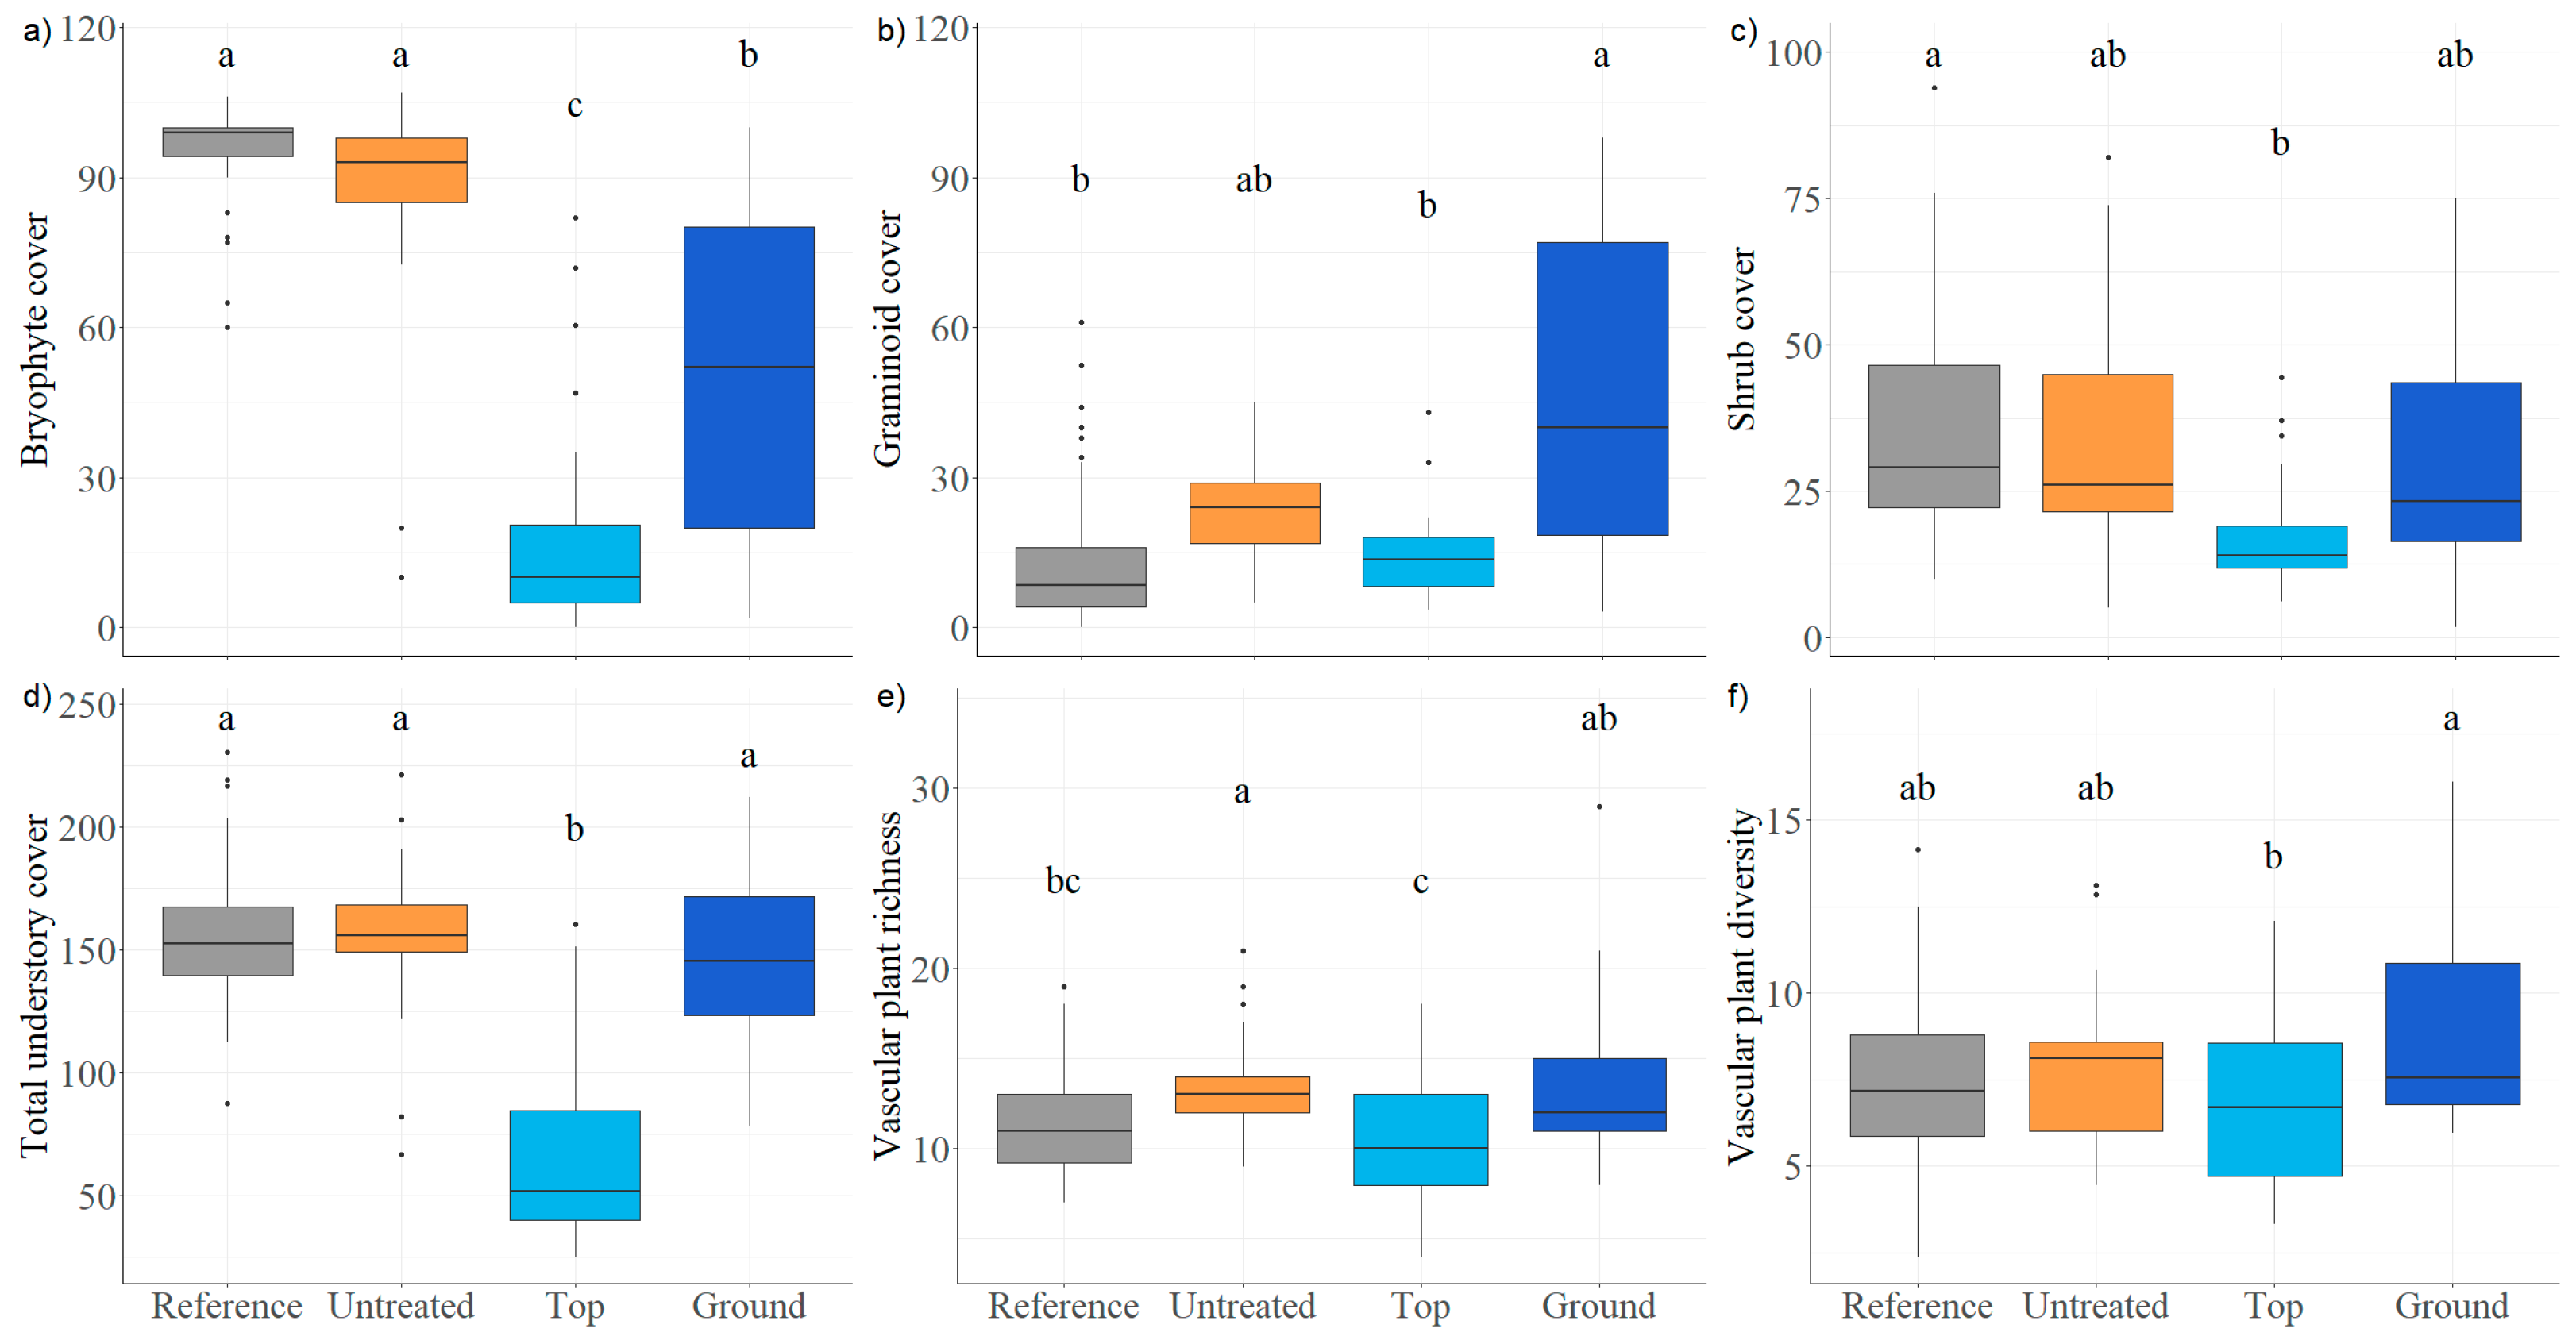
3.1. Understory Vegetation

We detected significant differences in bryophyte cover among habitats (6.5% ± 1.10%; F3,12 = 1947.2, p < 0.001; Figure 2a, Table S1). Within mounded seismic lines, the ground adjacent to the mounds had a significantly higher bryophyte cover (estimated marginal mean ± standard error: 60.3% ± 5.17%) compared to the top of the mounds (6.5% ± 1.10%). As a result of the disturbance introduced by mounding, bryophyte cover on both the top and ground positions of mounded areas was significantly lower than on untreated seismic lines (95.2% ± 1.72%) and reference fens (98.1% ± 0.49%). Bryophyte cover did not differ between untreated seismic lines and reference fens. Forb cover did not differ among habitats (Table S1). We detected differences in graminoid cover among habitat conditions (F3,12 = 6.2, p = 0.009; Figure 2b, Table S1). The ground position had significantly higher graminoid cover (40.9% ± 6.65%) than both the top position and the reference fens (13.9% ± 6.65% and 13.0% ± 4.69%, respectively), but did not differ from untreated seismic lines (23.9% ± 6.23%). Graminoid cover did not differ between reference fens, untreated seismic lines, and the top of the mounds. We observed a significant effect of habitat conditions on shrub cover (F3,12 = 5.8, I = 0.011; Figure 2c, Table S1), with cover in reference fens (31.6% ± 2.77%) significantly higher than the top position of mounds (15.8% ± 2.93%) only, as it did not differ from the ground position and untreated seismic lines. Shrub cover also did not differ between the top position, the ground position, and untreated seismic lines. Total understory cover also differed among habitats (F3,12 = 118.6, p < 0.001; Figure 2d, Table S1). Expectedly, due to the age (three years post-treatment) and nature of application (i.e., inverted mounding), total understory plant cover was significantly lower at the mound tops (47.2% ± 4.87%) than in the three other habitats (reference fen: 149.8% ± 3.19%; untreated seismic line: 157.1% ± 5.55%; and ground of mounded seismic line: 147.4% ± 7.57%), but did not differ between the reference fens, untreated lines, and the ground position.
We detected differences in vascular plant richness and diversity among the four habitats (richness: F3,12 = 25.3, p < 0.001; diversity: F3,12 = 4.3, p = 0.027; Figure 2, Table S1). For mounded seismic lines, the ground position had significantly higher vascular plant richness (13.1 ± 0.79) and diversity (8.4 ± 0.43) than the top position (richness: 9.5 ± 0.79; diversity: 6.2 ± 0.43), likely due to treatment application. Vascular plant richness was significantly higher on untreated lines (13.8 ± 0.68) than on the top position and in reference fens (9.5 ± 0.79 and 11.3 ± 0.64, respectively) but did not differ from the ground position (Figure 2e, Table S1). Vascular plant richness and diversity in the reference fens (diversity = 7.4 ± 0.26) did not differ from either the ground or the top positions. Vascular plant diversity on untreated lines (7.4 ± 0.33) also did not differ from both positions of mounded lines (Figure 2f, Table S1).
Vascular plant composition was significantly different between all four habitats (Figure 3a, Table 1). Indicator species for reference fens included M. trifolium, cloudberry (Rubus chamaemorus Linnaeus), and ericaceous shrubs, such as Labrador tea (Rhododendron groenlandicum (Oeder) Kron & Judd) and leatherleaf (Chamaedaphne calyculata (Linnaeus) Moench) (Table 2). Indicator species for untreated seismic lines included fen species, such as bog buckbean (Menyanthes trifoliata Linnaeus.), bog birch (Betula pumila Linnaeus), creeping sedge (Carex chordorrhiza Linnaeus f.), and tea-leaved willow (Salix planifolia Pursh). Disturbance-associated species, e.g., small-flowered lousewort (Pedicularis parviflora Smith) and Bebb’s willow (Salix bebbiana Sargent), were also indicator species for untreated seismic lines. Tree seedlings, e.g., trembling aspen (Populus tremuloides Michaux) and P. mariana, were indicator species for the top of the mounds. Disturbance-associated species, typically found in upland stands, e.g., fireweed (Chamaenerion angustifolium (Linnaeus)) and rough bentgrass (Agrostis scabra Willdenow), were also indicator species for mound tops. Indicator species for the ground of mounded seismic lines were hygrophilic species, such as marsh cinquefoil (Comarum palustre Linnaeus), and fen-associated species, such as bog willow (Salix pedicellaris Pursh), boreal bog sedge (Carex magellanica Lamarck), and sparse-flowered sedge (Carex tenuiflora Wahlenberg).

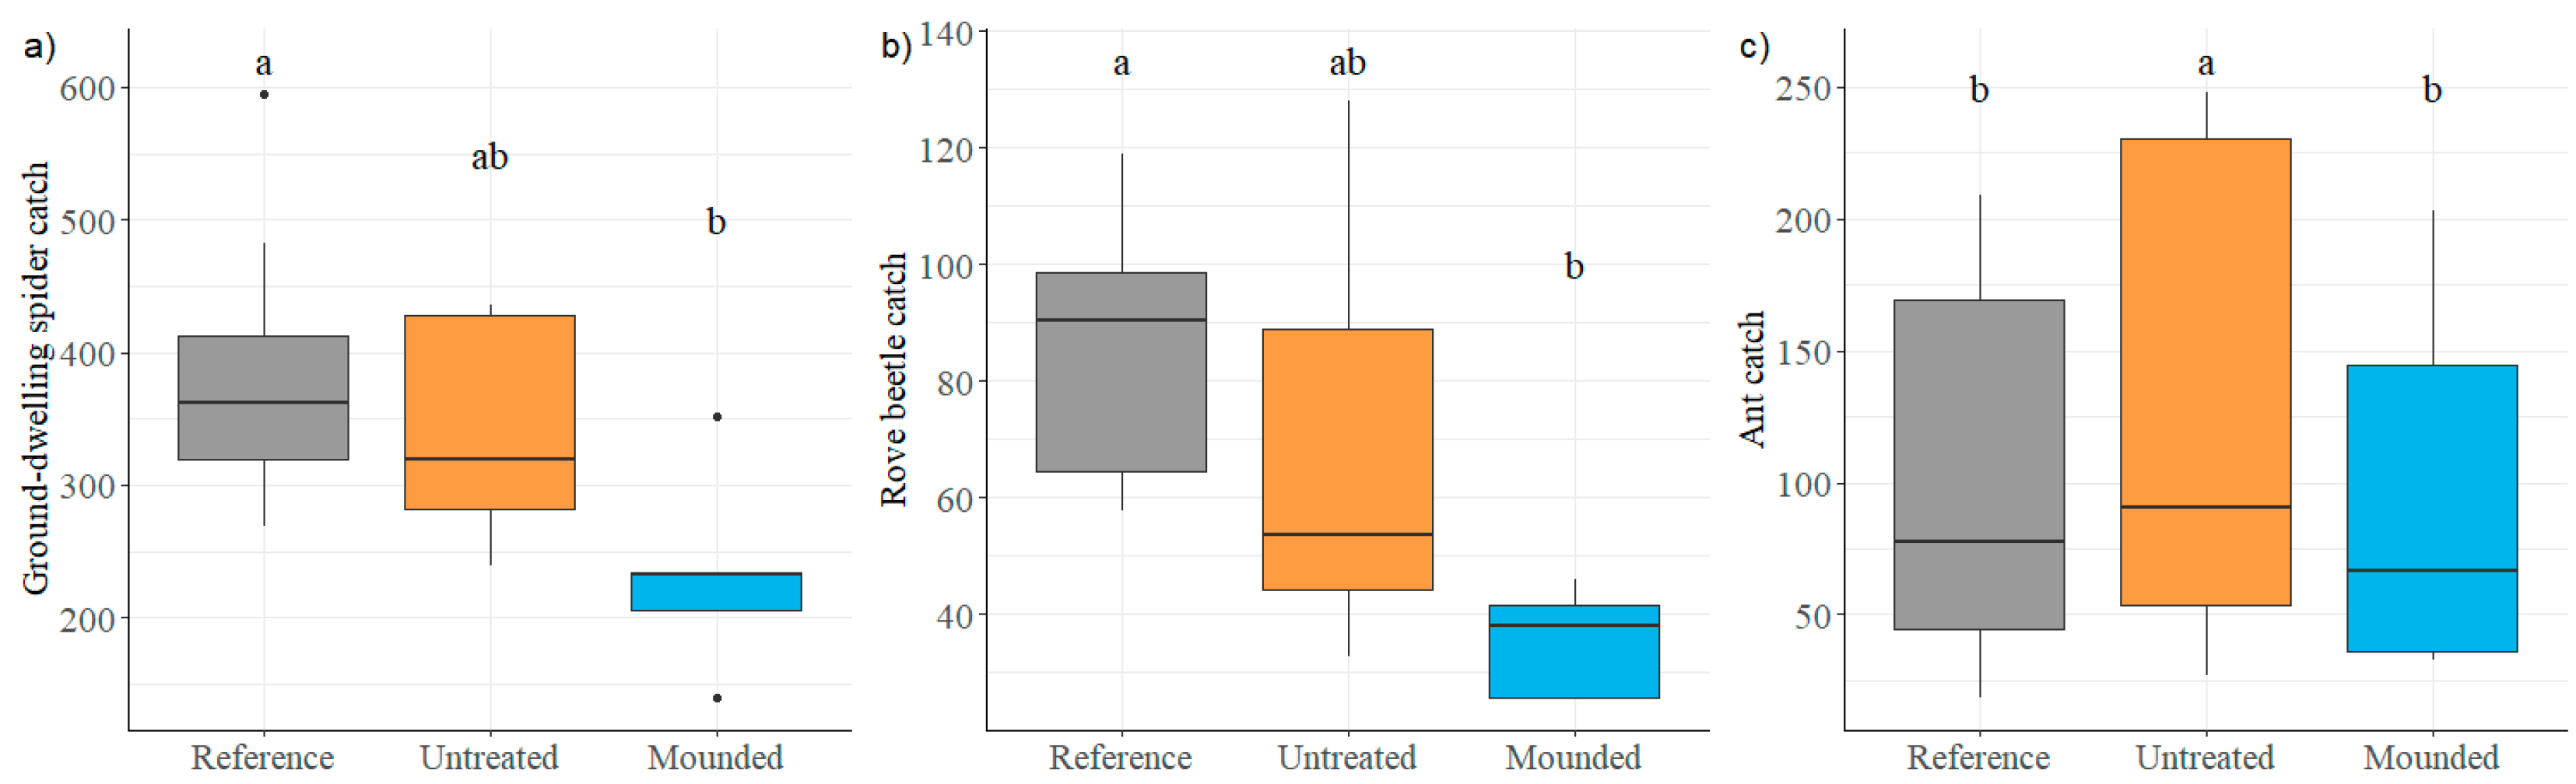
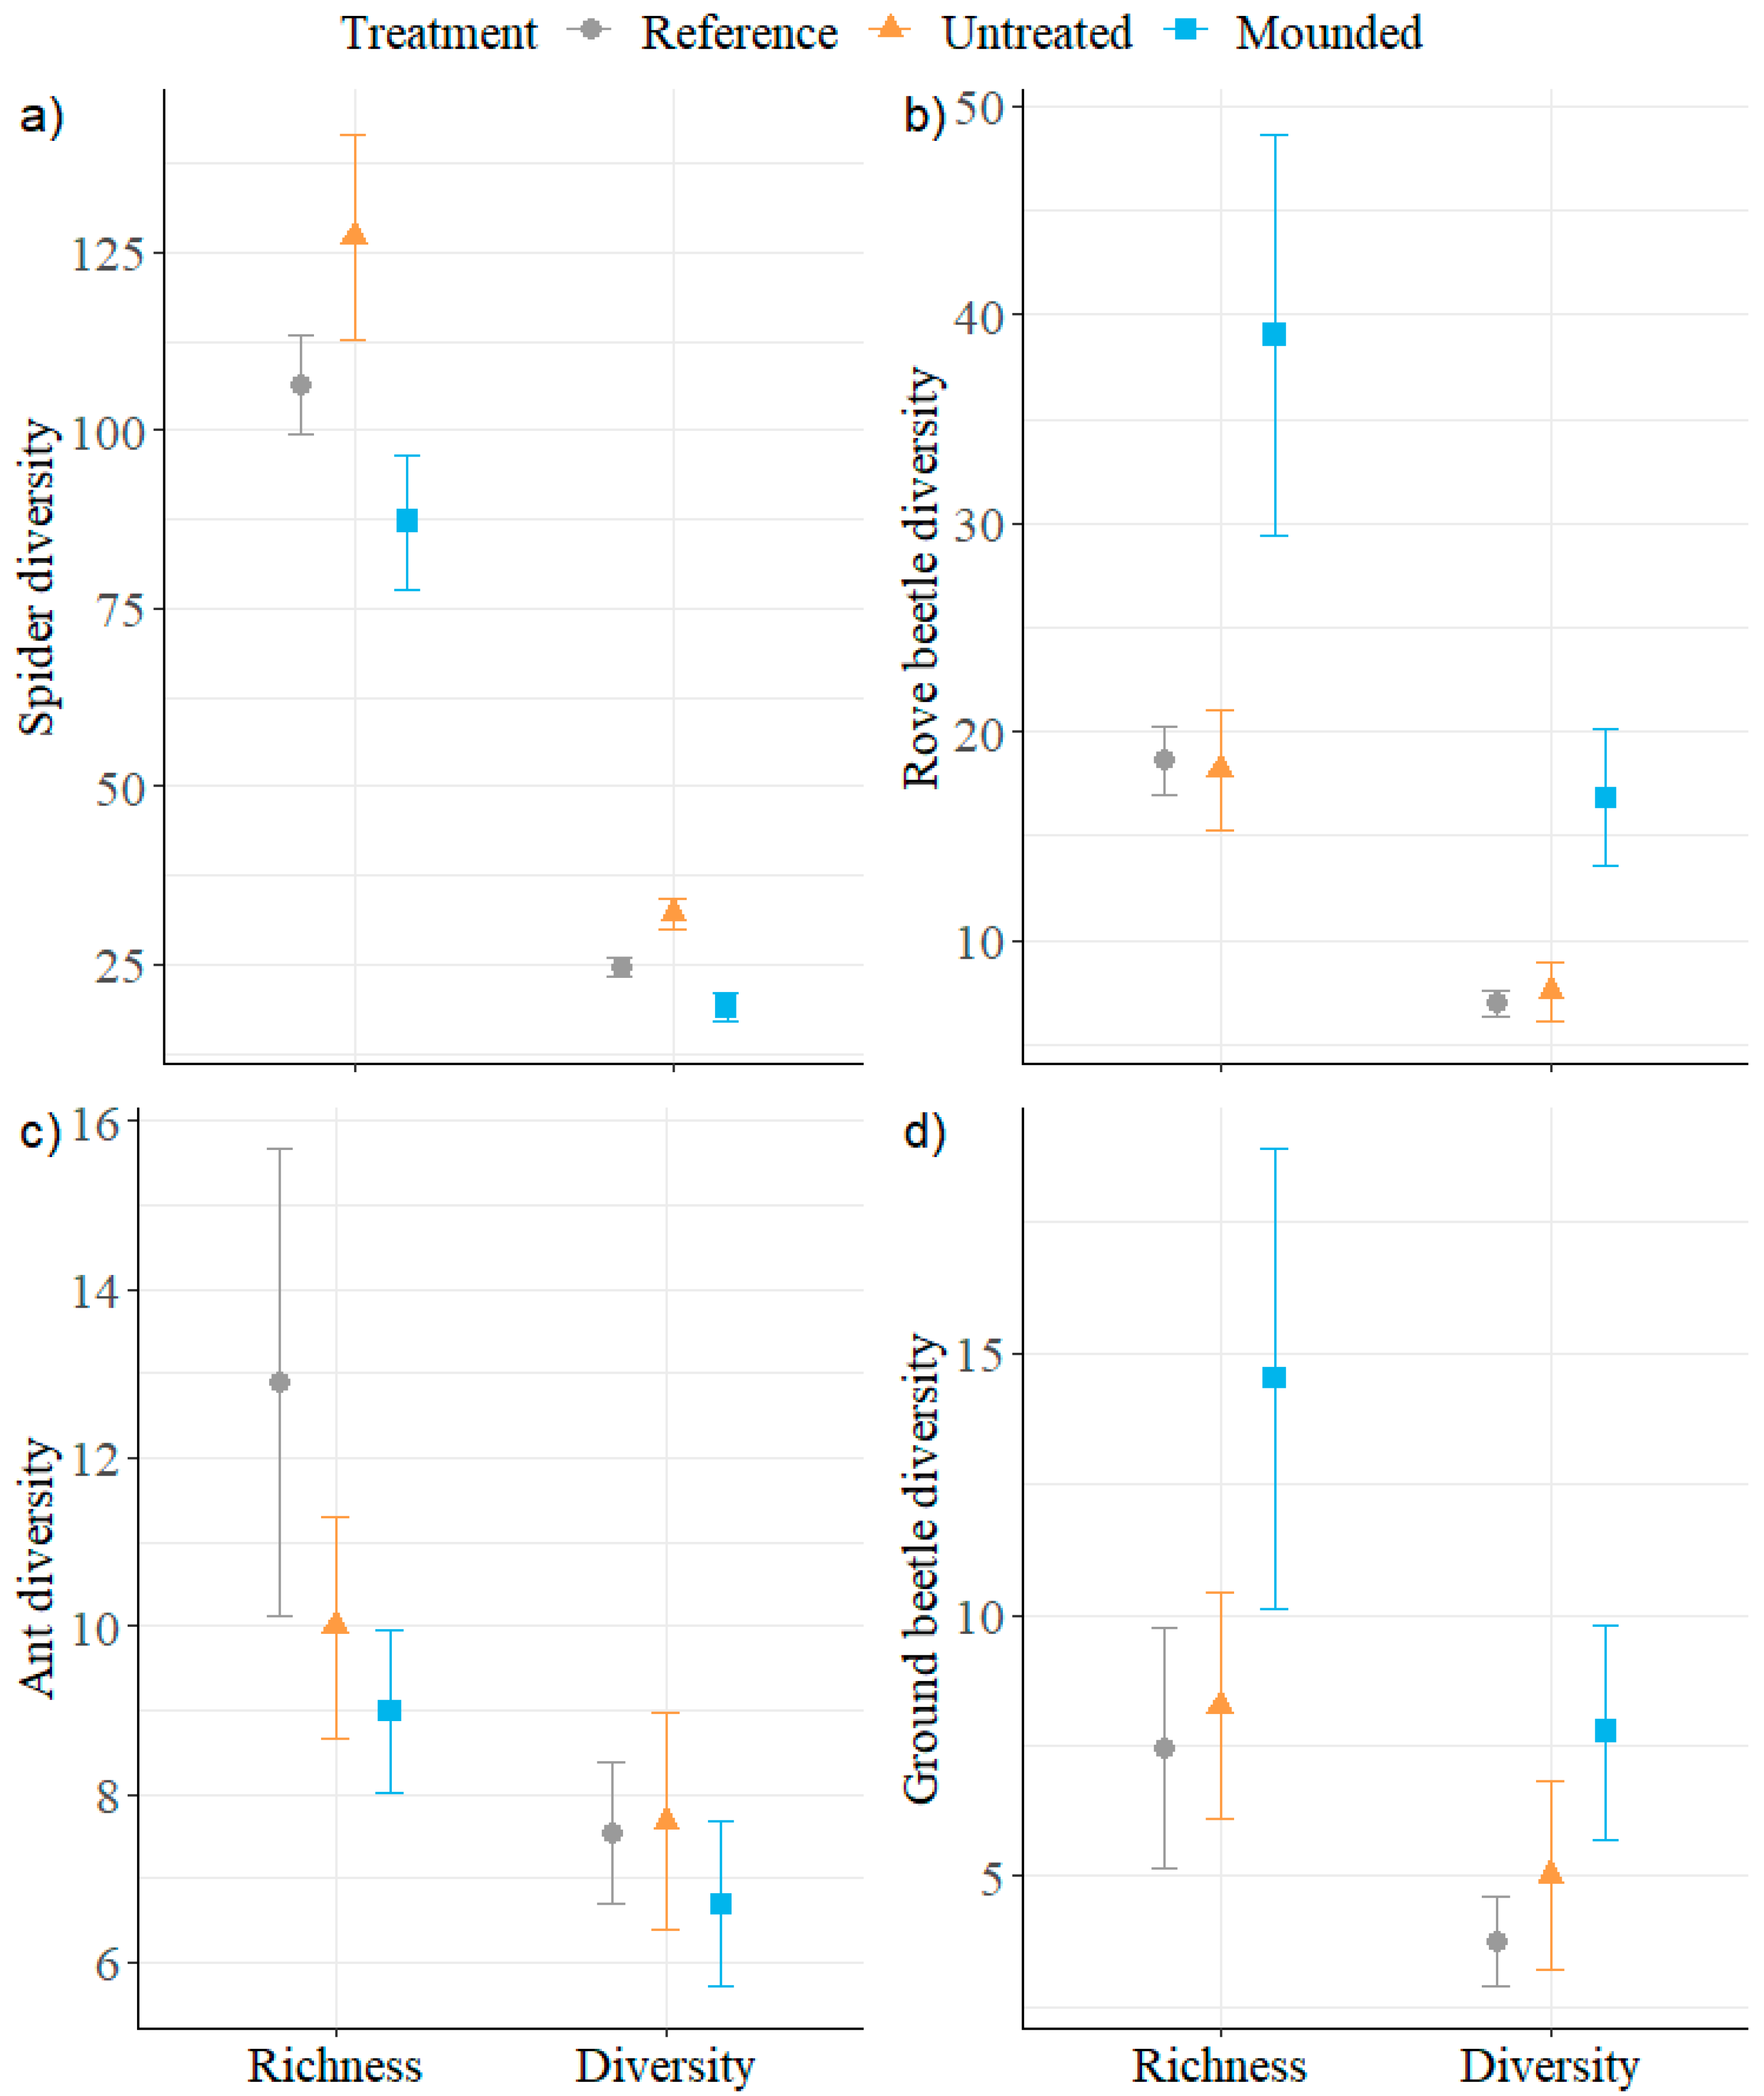
3.2. Ground-Dwelling Arthropods

We collected a total of 217 species among the three taxonomic groups sampled (ground-dwelling spiders: 144 species and 6314 individuals; rove beetles: 42 species and 1379 individuals; ants: 12 species and 1978 individuals; and ground beetles: 19 species and 162 individuals). Six spider species accounted for more than 50% of the total spiders (Pardosa moesta Banks, 18.8%; Piratula insularis (Emerton), 14.4%; Pardosa hyperborea (Keyserling), 10.2%; Gnaphosa microps Holm, 5.7%; Diplocentria bidentata (Emerton), 4.2%; and Antistea brunnea (Emerton), 3.3%). Four rove beetle taxa and four ant species accounted for more than 65% and 80% of the total rove beetles and ants, respectively (rove beetles: Reichenbachia spp. Leach, 35.1%; Quedius frigidus Smetana, 13.1%; Quedius labroderensis Smetana, 10.4%; and Ischnosoma splendidum (Gravenhorst), 8.3%; ants: Formica neorufibarbis Emery, 29.3%; Myrmica lobifrons Pergande, 26.9%; Myrmica alaskensis Wheeler, 17.4%; and Myrmica fracticornis Forel, 8.9%). Four ground beetle species accounted for almost 80% of the total ground beetles (Pterostichus punctatissimus (Randall), 35.2%; Agonum gratiosum (Mannerheim), 17.9%; Platynus mannreheimii (Dejean), 16%; and Pterostichus adstrictus Eschscholtz, 9.9%).
Ground-dwelling spider and rove beetle catches were significantly lower on mounded seismic lines than in reference fens (spiders: F2,8 = 6.1, p = 0.025; rove beetles: F2,8 = 20.4, p < 0.001; Figure 4a,b, Table S1). The average spider catch on mounded seismic lines was 226.0 ± 40.00 individuals, while reference fens had an average of 383.0 ± 28.70 individuals. The average rove beetle catch on mounded seismic lines was 35.3 ± 4.16 individuals, and in reference fens, it was 84.8 ± 6.71 individuals. Spider and rove beetle catches on untreated seismic lines did not significantly differ from either the reference fen or mounded seismic lines. Ant catches in seismic lines (140.3 ± 26.8) were higher (marginally significant) than both mounded seismic lines and reference fens (85.9 ± 26.8 and 101.9 ± 25, respectively), while no significant difference was observed between mounded seismic lines and reference fens F2,8 = 4.7, p < 0.045; Figure 4c, Table S1). Ground beetle catches did not differ between habitats; however, they were too low, making it a challenge to find evidence of any patterns (Table S1).
Mounded seismic lines had significantly lower ground-dwelling spider richness and diversity (estimated value ± 95% confidence interval: richness: 87.2 ± 9.46; diversity: 19.0 ± 1.84) than both untreated seismic lines and reference fens (based on no overlap between 95% confidence intervals in Figure 4a). Untreated seismic lines had significantly higher ground-dwelling spider richness and diversity (richness: 127.1 ± 14.39; diversity: 32.0 ± 2.19) than reference fens (richness: 106.4 ± 6.84; diversity: 24.6 ± 1.33; Figure 5a). Mounded seismic lines had significantly higher rove beetle richness and diversity (richness: 39.0 ± 9.58; diversity: 16.8 ± 3.26) than both reference fens (richness: 18.6 ± 1.60; diversity: 7.0 ± 0.63) and untreated seismic lines (richness: 18.2 ± 2.86; diversity: 7.5 ± 1.37; Figure 5b). Rove beetle richness and diversity did not differ between reference fens and untreated seismic lines. Ant richness was lower on mounded seismic lines (9.0 ± 0.96) than in reference fens (12.9 ± 2.78), and it did not differ on untreated seismic lines (10.0 ± 1.32) compared to either reference fens or mounded seismic lines (Figure 5c). Ant diversity did not differ between treatments (reference fen: 7.5 ± 0.83; untreated seismic line: 7.7 ± 1.29; and mounded seismic line: 6.7 ± 0.98). Ground beetle richness and diversity were significantly higher on mounded seismic lines (richness: 14.5 ± 4.38; diversity: 7.8 ± 2.05) than in reference fens (richness: 7.5 ± 2.31; diversity: 3.8 ± 0.88; Figure 5d) but did not differ on untreated seismic lines (richness: 8.3 ± 2.14; diversity: 5.0 ± 1.80) compared to either mounded seismic lines or reference fens.
Mounded seismic lines had significantly different arthropod composition—across all taxa—from reference fens (Figure 3b–d, Table 1). Ground-dwelling spider, rove beetle, and ant composition also differed between untreated and mounded seismic lines. Ground beetle composition did not differ between untreated and mounded seismic lines. Reference fens and untreated seismic lines did not differ in arthropod composition.
Indicator species for reference fens included forest-associated species, such as the sheet-web spiders (Linyphiidae) D. bidentata, Agyneta olivacea (Emerton), Carorita limnaea (Crosby & Bishop), and the tangle-web spider (Theridiidae) Theonoe stridula Crosby. The sheet-web Cheniseo sphagnicultor Bishop & Crosby, Oedothorax trilobatus (Banks), and the jumping spider (Salticidae) Neon nelli Peckham & Peckham were indicator species for untreated seismic lines (Table 2). Wolf-spiders (Lycosidae) associated with open, disturbed sites, e.g., Arctosa raptor Kulczyński, Pardosa fuscula (Thorell), and Pardosa xerampelina (Keyserling), were indicator species for mounded seismic lines. The rove beetles Q. frigidus and Reichenbachia spp. were indicator species for reference fens (Table 2). Dinothenarus pleuralis (LeConte) was the only rove beetle indicator species for untreated lines, while Philonthus flavibasis Casey and Olophrum consimile (Gyllenhal) were associated with mounded seismic lines. Ant indicator species for untreated seismic lines were Myrmica lobifrons Peragnde and Formicoxenus quebecensis Francoeur, while F. neorufibarbis and Formica dakotensis Emery were associated with mounded seismic lines (Table 2). For ground beetles, only mounded seismic lines had indicator species, which were A. gratiosum and P. adstrictus (Table 2).

4. Discussion

While the effects of inverted soil mounding on understory vegetation [16,17,19] and tree establishment [12,54,55] have been studied to some extent, particularly in the context of oil and gas footprint mitigation, this is the first study that addresses the effects on ground-dwelling arthropods, thus contributing to broader knowledge about biodiversity responses to approaches that aim to restore such footprints. Inverted soil mounding altered vegetation and arthropod communities, with understory plants, ground-dwelling spiders, and rove beetles exhibiting the strongest response. As hypothesized, mounding affected vegetation cover (the top of the mounds had lower bryophyte cover, shrub cover, and total understory cover compared to reference fens). In addition, mounded seismic lines had lower spider and rove beetle catches and higher rove beetle and ground beetle diversity relative to reference fens. However, in contrast to our expectations, mounded seismic lines also had lower spider diversity and ant richness than reference fens. On untreated seismic lines, vascular plant richness, spider diversity, and ant catches were higher compared to reference fens. This is one of the first studies to assess arthropod responses to restoration efforts in the context of oil and gas disturbances in North America, and our results highlight the need to incorporate multiple taxa when examining the impact of treatments that aim to mitigate the industrial footprint.
It is well documented that seismic line construction compresses the ground, particularly in peatlands, which results in a shallower water table compared to the adjacent wetland [18,27,28]. Thus, inverted soil mounding in peatlands is commonly applied with the specific objective of raising the substrate above the shallow water table to improve growing conditions for tree regeneration. In this study, tree seedlings (considering only natural regeneration for this analysis) were indicator species for the tops of the mounds, suggesting that treated areas may be promoting natural tree regeneration over the three years since mound construction in our study area. While the presence of P. mariana is partly due to the planting treatment applied to the mounded seismic lines, the presence of P. tremuloides, an unexpected species in peatlands and known colonizer of disturbed sites, may have important implications on species composition as sites recover from treatment application. Inverted mounding, however, comes at a significant cost in the short term to overall understory abundance, as understory woody cover, bryophyte, and total understory cover were significantly reduced on the tops of the mounds. The loss of bryophyte cover is of particular concern as bryophytes are primarily responsible for hummock development and peat accumulation, which is the main form of carbon storage in treed peatlands [1]. In addition, the loss of vegetation cover can negatively impact the wildlife dependent on the understory vegetation for food and habitat. For example, the loss in vegetation cover may be contributing to the observed loss in arthropod catches. The loss of vegetation cover is likely due to the burial of viable propagules with the inverted mounding. Recovery of the vegetation cover may be limited by the altered micro-climatic conditions found at the top of the artificial mounds. Overall, the vegetation results align with those of Echiverri et al. [16,17], in which mounded seismic lines had reduced understory cover relative to reference fens, while untreated seismic lines reflected some recovery with little to no difference in understory abundance and diversity between untreated seismic lines and reference fens.
Like the vegetation response, rove beetle and ground-dwelling spider catches were also lower on mounded seismic lines compared to reference fens. The reduction in arthropod catches could be partly due to the disturbance created by the treatment application and to the loss in vegetative cover, as understory vegetation provides ground-dwelling arthropods with structural support, suitable microclimate conditions, refugia from predators, and a source of prey [24,56,57]. Since bryophytes and understory vascular plants modulate ground temperature and moisture fluxes, the reduced vegetation cover on mounded seismic lines also increases the risk of desiccation for ground-dwelling arthropods. Smaller, less mobile arthropods are particularly vulnerable to the drier and warmer conditions on the mounds. For example, most of the indicator species of mounded seismic lines were larger wolf spiders, who run actively after their prey. The abundance of species in the spider families Linyphiidae and Theridiidae (smaller web-weaving spiders that rely on vegetation to support their webs) was much lower in treated areas compared to reference fens. Similarly, linyphiid dominance in uncut control stands and wolf spiders becoming dominant in harvested stands (P. moesta) have also been observed [58].
It is possible that the observed effects in our study are temporary, and in ten to fifteen years, arthropod abundance may recover (as observed in upland forests), though it may depend on vegetation recovery. For example, in upland stands, lower rove beetle catches one to two years after harvesting have been shown, but 11 and 16 years after harvest, catches were already comparable to unharvested control stands. It may also be the case that arthropod recovery post-mounding may take a long time as studies on upland stands have also found that post-harvest site preparation leads to lower beetle and spider catches or distinct assemblages as compared to harvested sites without site preparation, likely due to the increased soil disturbance [56,57,59].
Mounded seismic lines had significantly higher rove beetle richness and diversity compared to the adjacent reference fens. In a study exploring the effects of wildfires on rove beetle assemblages on seismic lines, rove beetle richness was also found to be higher on seismic lines compared to the adjacent fen in both burned and unburned sites [60]. Interestingly, studies in upland stands have also found higher rove beetle richness immediately after tree harvesting [61,62]. The increase in richness following these disturbances is likely due to the ingress of open-habitat species and the persistence of some closed-canopy species, as there may be a lag in species responses to the loss of trees [59,62].
In contrast to rove beetles, mounded seismic lines had lower ground-dwelling spider richness and diversity and ant richness compared to reference fens. Lower spider diversity on mounded seismic lines may be due to the loss of vegetation cover, as this reduces habitat complexity and availability for both spiders and their prey [24]. The difference in diversity responses between taxa may be due to rove beetles having more variety in feeding habits between species (i.e., feeding guilds that benefit from the disturbance can compensate for the loss in feeding guilds that were reduced by disturbance) compared to spiders, which are mostly predators. Lower ant richness on mounded seismic lines may be due to the loss of species sensitive to the soil disturbance associated with mounding, which may disrupt nesting sites, or the loss of species sensitive to the reduced vegetation cover and the associated micro-climate changes [63,64].
Despite the open-habitat characteristics of the linear disturbance resulting from the construction of the seismic lines in the study area, our results show some signs of ecosystem recovery on the untreated seismic lines; there were few differences in vegetation cover, arthropod catches, and arthropod diversity between untreated seismic lines and reference fens. Since soil disturbance was mitigated during the creation of the seismic lines under frozen conditions about 18 years prior to the assessments in this study, viable plant propagules and plant debris would have been left on the seismic lines. This may have allowed for the relatively rapid re-establishment of plants and arthropods, such that after the initial disturbance, plant and arthropod abundance were similar between untreated seismic lines and reference fens. While limited differences in vegetation abundance and diversity of untreated seismic lines and reference fens have been observed in similar research [17], ground-dwelling spider and ground beetle catches do not differ between 15 and 20-year-old seismic lines and reference fens [65]. The higher spider diversity and plant richness on untreated seismic lines compared to reference fens is likely due to the coexistence of both open-habitat and species from the adjacent peatland on the untreated seismic lines. Spiders from the adjacent fen may be utilizing the opening on the untreated seismic line to access additional prey. Vegetation recovery on untreated seismic lines may also allow for an increase in web-weaving spider diversity, as the microclimatic conditions associated with vegetation cover could allow for the ingress of forest specialist arthropods [57]. Pinzon et al. [65] also found higher spider richness on seismic lines than in the adjacent fen.
Despite differences in site type (upland vs. wetlands), arthropod indicator species from our study align with those of harvested stands [58,60,62]. For example, D. bidentata, Cybaeopsis euopla (Bishop & Crosby), Sciastes truncatus (Emerton), and A. olivacea were indicator spiders for the reference fen treatment in our study; these species have also been identified as indicator or dominant species for unharvested or mature upland stands [58,60,66]. In contrast, two wolf spider species were indicators for mounded seismic lines: P. fuscula (also found on untreated seismic lines but at much lower catch and frequency) and P. xerampelina (only found on mounded sites); previous studies have shown these species to be associated with recently harvested or burned upland stands [58,60,67]. A similar pattern emerges with the beetles, where Q. frigidus (rove beetle) is an indicator species for uncut upland stands [62] and is also an indicator species for reference fens in our study. The rove beetle D. pleuralis and the ground beetle P. adstrictus have been associated with recently harvested stands (1–3 years post-harvest) [60,62] and are indicator species for mounded seismic lines. Though arthropods and their response to anthropogenic disturbances are well studied in upland forest stands, few studies have examined their response to disturbances and restoration efforts in treed peatlands in North America, especially in moderate-rich fens [61], but see [65]. Here, we show that both ground-dwelling spiders and rove beetles are useful taxa as bioindicators as they respond strongly to disturbances in peatlands. However, additional research on arthropod response to disturbances in other types of peatlands (e.g., treed and un-treed bogs) is needed to improve our understanding of arthropod ecology in these unique ecosystems.

5. Conclusions

Although inverted soil mounding is applied to facilitate tree regeneration in peatlands and, therefore, is a treatment that aims to restore peatland areas that have been disturbed by the construction of linear features (mostly in the form of seismic lines), it is nonetheless a disturbance with ecological impacts that need to be assessed. Our study revealed important short-term responses (i.e., three years post-treatment) of plant and ground-dwelling arthropod assemblages to the treatment application. Further, our results provide a broader evaluation of the ecological impacts of soil mounding and show how these responses can differ among taxa.
Given that soil mounding is a relatively recent restoration approach, no long-term data are currently available to assess treatment effectiveness. However, information on the short-term responses is necessary to track the trajectory of biodiversity recovery to identify potential unintended consequences of this treatment and to provide insight into how treatments can be modified for more holistic ecological restoration success. Moreover, additional long-term research is necessary to continue monitoring responses to seismic line restoration.
Though arthropods and their response to anthropogenic disturbances are well studied in upland forest stands, few studies have examined their response to disturbances and restoration efforts in treed peatlands in North America, especially in moderate-rich fens [61], but see [65]. Here, we show that both ground-dwelling spiders and rove beetles are useful taxa as bioindicators as they respond strongly and differently to disturbances in peatlands. However, additional research on arthropod response to disturbances in other types of peatlands (e.g., treed and un-treed bogs) is needed to improve our understanding of arthropod ecology in these unique ecosystems.

Supplementary Materials

The following supporting information can be downloaded at https://www.mdpi.com/article/10.3390/f14112123/s1. Table S1: Results of the General Linear Mixed-Effects Models for understory percent cover and diversity and ground-dwelling arthropod catches as affected by mounding treatment. Values in bold type indicate significance (α = 0.05).

Author Contributions

Conceptualization, J.P.; methodology and data collection, J.P. and A.D.; formal analysis, L.E. and J.P.; writing—original draft preparation, L.E.; writing—review and editing, L.E., J.P. and A.D.; supervision, J.P and A.D. All authors have read and agreed to the published version of the manuscript.

Funding

This research received no external funding. This work was supported by Natural Resources Canada (NRCan) through the Office of Energy Research and Development (OERD) Energy Innovation Program (project CFS-19-113) and the Canadian Forest Service (CFS) Cumulative Effects Program.

Data Availability Statement

Data presented in this study are available from the Dryad Digital Repository available at https://doi.org/10.5061/dryad.crjdfn3b7.

Acknowledgments

We would like to thank Julia Linke and the Regional Industry Caribou Collaboration (RICC) group for providing critical information used for the selection of sites in the study area. We are also grateful for the support in the field provided by Kale Bromley from Canadian Natural Resources Limited (CNRL), who facilitated access to the study area, and Matthew Langor, who assisted with the data collection as a summer student. We are thankful to Matthew Langor and Shawn Abraham, who assisted with sample processing. We also want to thank James Glasier for the identification of the ants and Linhao Wu for the identification of the carabid and rove beetles.

Conflicts of Interest

The authors declare no conflict of interest.

References

  1. Rydin, H.; Jeglum, J.K. The Biology of Peatlands, 2nd ed.; Oxford University Press: Oxford, UK, 2013; p. 432. [Google Scholar]
  2. Turetsky, M.R.; St. Louis, V.L. Disturbance in Boreal Peatlands. In Boreal Peatland Ecosystems; Wieder, R.K., Vitt, D.H., Eds.; Springer: Berlin/Heidelberg, Germany, 2006; pp. 359–379. [Google Scholar]
  3. van Rensen, C.K.; Nielsen, S.E.; White, B.; Vinge, T.; Lieffers, V.J. Natural regeneration of forest vegetation on legacy seismic lines in boreal habitats in Alberta’s oil sands region. Biol. Conserv. 2015, 184, 127–135. [Google Scholar] [CrossRef]
  4. Lee, P.; Boutin, S. Persistence and developmental transition of wide seismic lines in the western Boreal Plains of Canada. J. Environ. Manag. 2006, 78, 240–250. [Google Scholar] [CrossRef] [PubMed]
  5. Stevenson, C.J.; Filicetti, A.T.; Nielsen, S.E. High precision altimeter demonstrates simplification and depression of microtopography on seismic lines in treed peatlands. Forests 2019, 10, 295. [Google Scholar] [CrossRef]
  6. Filicetti, A.T.; Nielsen, S.E. Tree regeneration on industrial linear disturbances in treed peatlands is hastened by wildfire and delayed by loss of microtopography. Can. J. For. Res. 2020, 50, 936–945. [Google Scholar] [CrossRef]
  7. Government of Canada. Species at Risk Act: An Act Respecting the Protection of Wildlife Species at Risk in Canada; Canada Gazette Part III: Ottawa, ON, Canada, 2002; Volume 25, pp. 1–104. [Google Scholar]
  8. Wasser, S.K.; Keim, J.L.; Taper, M.L.; Lele, S.R. The influences of wolf predation, habitat loss, and human activity on caribou and moose in the Alberta oil sands. Front. Ecol. Environ. 2011, 9, 546–551. [Google Scholar] [CrossRef]
  9. Nagy-Reis, M.; Dickie, M.; Calvert, A.M.; Hebblewhite, M.; Hervieux, D.; Seip, D.R.; Gilbert, S.L.; Venter, O.; DeMars, C.; Boutin, S.; et al. Habitat loss accelerates for the endangered woodland caribou in western Canada. Conserv. Sci. Pract. 2021, 3, e437. [Google Scholar] [CrossRef]
  10. Latham, A.D.M.; Latham, M.C.; Boyce, M.S.; Boutin, S. Movement responses by wolves to industrial linear features and their effect on woodland caribou in northeastern Alberta. Ecol. Appl. 2011, 21, 2854–2865. [Google Scholar] [CrossRef]
  11. Pyper, M.P.; Nishi, J.; McNeil, L. Linear Feature Restoration in Caribou Habitat: A Summary of Current Practices and a Roadmap for Future Programs; FUSE Consulting Ltd.: Edmonton, AB, Canada, 2014. [Google Scholar]
  12. Filicetti, A.T.; Cody, M.; Nielsen, S.E. Caribou conservation: Restoring trees on seismic lines in Alberta, Canada. Forests 2019, 10, 185. [Google Scholar] [CrossRef]
  13. Londo, A.J.; Mroz, G.D. Bucket Mounding as a Mechanical Site Preparation Technique in Wetlands. North. J. Appl. For. 2001, 18, 7–13. [Google Scholar] [CrossRef]
  14. Sutton, R.F. Mounding site preparation: A review of European and North American experience. New For. 1993, 7, 151–192. [Google Scholar] [CrossRef]
  15. Kleinke, K.; Davidson, S.J.; Schmidt, M.; Xu, B.; Strack, M. How mounds are made matters: Seismic line restoration techniques affect peat physical and chemical properties throughout the peat profile. Can. J. For. Res. 2022, 52, 963–976. [Google Scholar] [CrossRef]
  16. Echiverri, L.F.I.; Macdonald, S.E.; Nielsen, S.E. Disturbing to restore? Effects of mounding on understory communities on seismic lines in treed peatlands. Can. J. For. Res. 2020, 50, 1340–1351. [Google Scholar] [CrossRef]
  17. Echiverri, L.F.I.; Macdonald, S.E.; Nielsen, S.E. Mounding treatments set back bryophyte recovery on linear disturbances in treed peatlands. Restor. Ecol. 2023, 31, e13813. [Google Scholar] [CrossRef]
  18. Pinzon, J.; Dabros, A.; Hoffman, P. Soil mounding as a restoration approach of seismic lines in boreal peatlands: Implications on microtopography. Restor. Ecol. 2022, e13835. [Google Scholar] [CrossRef]
  19. Caners, R.T.; Crisfield, V.; Lieffers, V.J. Habitat heterogeneity stimulates regeneration of bryophytes and vascular plants on disturbed minerotrophic peatlands. Can. J. For. Res. 2019, 49, 281–295. [Google Scholar] [CrossRef]
  20. Görn, S.; Fischer, K. Measuring the efficiency of fen restoration on carabid beetles and vascular plants: A case study from north-eastern Germany. Restor. Ecol. 2015, 23, 413–420. [Google Scholar] [CrossRef]
  21. Hoffmann, H.; Kleeberg, A.; Görn, S.; Fischer, K. Riverine fen restoration provides secondary habitat for endangered and stenotopic rove beetles (Coleoptera: Staphylinidae). Insect Conserv. Divers. 2018, 11, 194–203. [Google Scholar] [CrossRef]
  22. Haase, H.; Balkenhol, B. Spiders (Araneae) as subtle indicators for successional stages in peat bogs. Wetl. Ecol. Manag. 2015, 23, 453–466. [Google Scholar] [CrossRef]
  23. Lehmitz, R.; Haase, H.; Otte, V.; Russell, D. Bioindication in peatlands by means of multi-taxa indicators (Oribatida, Araneae, Carabidae, Vegetation). Ecol. Indic. 2020, 109, 105837. [Google Scholar] [CrossRef]
  24. Štokmane, M.; Spuņģis, V. The influence of vegetation structure on spider species richness, diversity and community organization in the Apšuciems calcareous fen, Latvia. Anim. Biodivers. Conserv. 2016, 39, 16. [Google Scholar] [CrossRef]
  25. Glime, J.M.; Lissner, J. Arthropods: Spiders. In Bryophyte Ecology; Glime, J.M., Ed.; Michigan Technological University and the International Association of Bryologists: E-book; Bryological Interaction: Houghton, MI, USA, 2017; Volume 2, pp. 7-4-2–7-4-31. [Google Scholar]
  26. Främbs, H. The importance of habitat structure and food supply for carabid beetles (Coleoptera, Carabidae) in peat bogs. Mem. Entomol. Soc. Can. 1994, 126, 145–159. [Google Scholar] [CrossRef]
  27. Davidson, S.J.; Goud, E.M.; Franklin, C.; Nielsen, S.E.; Strack, M. Seismic line disturbance alters soil physical and chemical properties across boreal forest and peatland soils. Front. Earth Sci. 2020, 8, 281. [Google Scholar] [CrossRef]
  28. Braverman, M.; Quinton, W.L. Hydrological impacts of seismic lines in the wetland-dominated zone of thawing, discontinuous permafrost, Northwest Territories, Canada. Hydrol. Process. 2016, 30, 2617–2627. [Google Scholar] [CrossRef]
  29. Siira-Pietkainen, A.S.; Haimi, J.; Siitonen, J. Short-term responses of soil macroarthropod community to clear felling and alternative forest regeneration methods. For. Ecol. Manag. 2003, 172, 339–353. [Google Scholar] [CrossRef]
  30. Brouillet, L.; Desmet, P.; Coursol, F.; Meades, S.J.; Favreau, M.; Anions, M.; Bélisle, P.; Gendreau, C.; Shorthouse, D. VASCAN: The Database of Vascular Plants of Canada. Available online: http://data.canadensys.net/vascan/ (accessed on 19 July 2021).
  31. Integrated Taxonomic Information System. Available online: http://www.itis.gov (accessed on 6 September 2022).
  32. Spence, J.R.; Niemelä, J.K. Sampling carabid assemblages with pitfall traps—The madness and the method. Can. Entomol. 1994, 126, 881–894. [Google Scholar] [CrossRef]
  33. World Spider Catalog, Version 23.5, Natural History Museum Bern. Available online: http://wsc.nmbe.ch (accessed on 6 September 2022).
  34. Lindroth, C.H. The Ground-Beetles (Carabidae, Excl. Cicindelinae) of Canada and Alaska; Opuscula Entomologica. Supplementum 1961–1969; Entomologiska Sällskapet: Lund, Sweden, 1963. [Google Scholar]
  35. Newton, A.F.; Thayer, M.K.; Ashe, J.S.; Chandler, D.S. Family 22. Staphylinidae Latreille, 1802. In American Beetles: Archostemata, Myxophaga, Adephaga, Polyphaga: Staphyliniformia; CRC Press: Boca Raton, FL, USA, 2001; Volume 1, pp. 272–418. [Google Scholar]
  36. Bousquet, Y.; Bouchard, P.; Davies, A.E.; Sikes, D.S. Checklist of Beetles (Coleoptera) of Canada and Alaska. ZooKeys 2013, 360, 1–44. [Google Scholar] [CrossRef]
  37. Bolton, B. A New General Catalogue of the Ants of the World; Harvard University Press: Cambridge, UK, 1995. [Google Scholar]
  38. Ellison, A.M.; Gotelli, N.J.; Farnswoth, E.J.; Alpert, G. A Field Guide to the Ants of New England; Yale University Press: New Haven, CT, USA, 2012; p. 388. [Google Scholar]
  39. Glasier, J.R.N.; Acorn, J.H.; Nielsen, S.; Proctor, H.C. Ants (Hymenoptera: Formicidae) of Alberta: A key to species based primarily on the worker caste. Can. J. Arthropod Identif. 2013, 22, 1–104. [Google Scholar] [CrossRef]
  40. Chao, A.; Chiu, C.-H.; Jost, L. Unifying species diversity, phylogenetic diversity, functional Diversity, and related similarity and differentiation measures through Hill numbers. Annu. Rev. Ecol. Evol. Syst. 2014, 45, 297–324. [Google Scholar] [CrossRef]
  41. Jost, L. Partitioning diversity into independent Alpha and Beta components. Ecology 2007, 88, 2427–2439. [Google Scholar] [CrossRef]
  42. R Core Team. R: A Language and Environment for Statistical Computing, 4.1.1; R Foundation for Statistical Computing: Vienna, Austria, 2021. [Google Scholar]
  43. Pinheiro, J.; Bates, D.; DebRoy, S.; Sarkar, D.; Team, R.C. nlme: Linear and Nonlinear Mixed Effects Models, 3.1-152; R Core Team: Vienna, Austria, 2021. [Google Scholar]
  44. Lenth, R. emmeans: Estimated Marginal Means, Aka Least-Squares Means, 1.7.0; R Core Team: Vienna, Austria, 2021. [Google Scholar]
  45. Chao, A.; Jost, L. Coverage-based rarefaction and extrapolation: Standardizing samples by completeness rather than size. Ecology 2012, 93, 2533–2547. [Google Scholar] [CrossRef]
  46. Hsieh, T.C.; Ma, K.H.; Chao, A. iNEXT: iNterpolation and EXTrapolation for Species Diversity, 2.0.20; R Core Team: Vienna, Austria, 2020. [Google Scholar]
  47. Legendre, P.; Legendre, L. Numerical Ecology, 3rd ed.; Elsevier: Amsterdam, The Netherlands, 2012; Volume 24, p. 1006. [Google Scholar]
  48. Rao, C.R. The use and interpretation of principal component analysis in applied research. Sankhyā Indian J. Stat. Ser. A 1964, 26, 329–358. [Google Scholar]
  49. Legendre, P.; Gallagher, E.D. Ecologically meaningful transformations for ordination of species data. Oecologia 2001, 129, 271–280. [Google Scholar] [CrossRef] [PubMed]
  50. Oksanen, J.; Blanchet, F.G.; Friendly, M.; Kindt, R.; Legendre, P.; McGlinn, D.; Minchin, P.R.; O’Hara, B.; Simpson, G.L.; Solymos, P.; et al. vegan: Community Ecology package, 2.5-7; R Core Team: Vienna, Austria, 2020. [Google Scholar]
  51. Kindt, R.; Coe, R. Tree Diversity Analysis: A Manual and Software for Common Statistical Methods for Ecological and Biodiversity Studies; World Agroforestry Centre (ICRAF): Nairobi, Kenya, 2005. [Google Scholar]
  52. De Cáceres, M.; Legendre, P. Associations between species and groups of sites: Indices and statistical inference. Ecology 2009, 90, 3566–3574. [Google Scholar] [CrossRef] [PubMed]
  53. Dufrêne, M.; Legendre, P. Species assemblages and indicator species: The need for a flexible asymmetrical approach. Ecol. Monogr. 1997, 67, 345–366. [Google Scholar] [CrossRef]
  54. Takyi, S.K.; Hillman, G.R. Growth of Coniferous Seedlings on a Drained and Mounded Peatland in Central Alberta. North. J. Appl. For. 2000, 17, 71–79. [Google Scholar] [CrossRef]
  55. Lieffers, V.J.; Caners, R.T.; Ge, H. Re-establishment of hummock topography promotes tree regeneration on highly disturbed moderate-rich fens. J. Environ. Manag. 2017, 197, 258–264. [Google Scholar] [CrossRef]
  56. Klimaszewski, J.; Bernier-Cardou, M.; Germain, C. The effects of forestry practices on the abundance of arthropods (Acarina, Araneae, Collembola, Coleoptera and Diptera). Belg. J. Entomol. 2003, 5, 103–116. [Google Scholar]
  57. Pearce, J.L.; Venier, L.A. The use of ground beetles (Coleoptera: Carabidae) and spiders (Araneae) as bioindicators of sustainable forest management: A review. Ecol. Indic. 2006, 6, 780–793. [Google Scholar] [CrossRef]
  58. Pinzon, J.; Spence, J.R.; Langor, D.W.; Shorthouse, D.P. Ten-year responses of ground-dwelling spiders to retention harvest in the boreal forest. Ecol. Appl. 2016, 26, 2579–2597. [Google Scholar] [CrossRef]
  59. Venier, L.A.; Work, T.T.; Klimaszewski, J.; Morris, D.M.; Bowden, J.J.; Kwiaton, M.M.; Webster, K.; Hazlett, P. Ground-dwelling arthropod response to fire and clearcutting in Jack Pine: Implications for ecosystem management. Can. J. For. Res. 2017, 47, 1614–1631. [Google Scholar] [CrossRef]
  60. Wu, L.; Pinzon, J. Response of rove-beetle (Staphylinidae) assemblages to the cumulative effect of wildfire and linear footprint in boreal treed peatlands. Ecol. Evol. 2022, 12, e9564. [Google Scholar] [CrossRef] [PubMed]
  61. Lee, S.-I.; Langor, D.W.; Spence, J.R.; Pinzon, J.; Pohl, G.R.; Hartley, D.J.; Work, T.T.; Wu, L. Rapid recovery of boreal rove beetle (Staphylinidae) assemblages 16 years after variable retention harvest. Ecography 2023, 2023, e06347. [Google Scholar] [CrossRef]
  62. Pohl, G.R.; Langor, D.W.; Spence, J.R. Rove beetles and ground beetles (Coleoptera: Staphylinidae, Carabidae) as indicators of harvest and regeneration practices in western Canadian foothills forests. Biol. Conserv. 2007, 137, 294–307. [Google Scholar] [CrossRef]
  63. Andersen, A.N. Responses of ant communities to disturbance: Five principles for understanding the disturbance dynamics of a globally dominant faunal group. J. Anim. Ecol. 2019, 88, 350–362. [Google Scholar] [CrossRef]
  64. Philpott, S.M.; Perfecto, I.; Ambrecht, I.; Parr, C.L. Ant Diversity and Function in Disturbed and Changing Habitats. In Ant Ecology; Oxford University Press: New York, NY, USA, 2010; pp. 137–156. [Google Scholar]
  65. Pinzon, J.; Dabros, A.; Riva, F.; Glasier, J.R.N. Short-term effects of wildfire in boreal peatlands: Does fire mitigate the linear footprint of oil and gas exploration? Ecol. Appl. 2021, 31, e02281. [Google Scholar] [CrossRef] [PubMed]
  66. Pearce, J.L.; Venier, L.A.; Eccles, G.; Pedlar, J.; McKenney, D. Influence of habitat and microhabitat on epigeal spider (Araneae) assemblages in four stand types. Biodivers. Conserv. 2004, 13, 1305–1334. [Google Scholar] [CrossRef]
  67. Buddle, C.M.; Langor, D.W.; Pohl, G.R.; Spence, J.R. Arthropod responses to harvesting and wildfire: Implications for emulation of natural disturbance in forest management. Biol. Conserv. 2006, 128, 346–357. [Google Scholar] [CrossRef]
Figure 1. Study area showing the location of untreated (green circles) and treated (orange circles) seismic lines within the area of the Canadian Natural Resources Ltd. (CNRL, Calgary, AB, Canada) Kirby South in situ SAGD Plant. At each location, two 50 m long transects were installed parallel to each other, one along the seismic line and one 50 m into the adjacent fen (marked with X on the map). Inset map of Canada highlights the province of Alberta and the location of the study area as a red square). Images of untreated and treated lines, and reference fen are provided for reference (pictures by J.P.).
Forests 14 02123 g001
Figure 2. Boxplots of percent cover of (a) bryophytes, (b) graminoids, (c) shrubs and (d) total understory, and (e) species richness and (f) diversity (exponential of Shannon’s) by treatment (reference fens, untreated seismic lines, and the top and ground positions of mounded seismic lines). Significant differences between treatments (p < 0.05), based on pairwise comparisons of estimated marginal means, are indicated by different letters. The median is represented by the horizontal line within the boxplot; lower and upper hinges represent the 25th and 75th percentiles, respectively; whiskers are the lowest and highest values within 1.5 times the interquartile range (IQR); dots outside the box and whiskers are outliers (values greater than or less than 1.5 × IQR).
Forests 14 02123 g002
Figure 3. Assemblage composition (RDA ordination) of (a) understory vegetation, (b) ground−dwelling spiders, (c) rove beetles, (d) ants, and (e) ground beetles for each treatment (reference fens, untreated seismic lines, and mounded seismic lines). Ellipses are 95% confidence intervals around group centroids, and points represent sites (symbolized by treatment: square symbols represent reference fens, circles represent untreated seismic lines, triangles represent mounded seismic lines or top of the mounded seismic lines for vegetation ordination, and crosses represent the ground position of mounded seismic lines).
Forests 14 02123 g003
Figure 4. Boxplots of catches of (a) ground-dwelling spiders, (b) rove beetles, and (c) ants by treatment (reference fens, untreated seismic lines, and mounded seismic lines). Different letters indicate significant (p < 0.05) differences between treatments based on pairwise comparisons of estimated marginal means. For the statistics used to create the boxplot, see legend of Figure 2.
Forests 14 02123 g004
Figure 5. Estimated species richness and diversity (exponential of Shannon’s) of (a) ground-dwelling spiders, (b) rove beetles, (c) ants, and (d) ground beetles for each treatment (reference fens, untreated seismic lines, and mounded seismic lines), based on coverage-based rarefaction. Error bars represent 95% confidence intervals. Differences between treatments are assessed by visual inspection.
Forests 14 02123 g005
Table 1. Results of redundancy analysis (RDA) for understory plant, ground-dwelling spider, rove beetle, ant, and ground beetle assemblages as a response to the application of inverted soil mounding along seismic lines in relation to untreated lines and the adjacent peatland. p values in boldface indicate a significant effect (α = 0.05).
Response Variable Variance ExplainedTreatment
Adj. R2RDA 1RDA 2Fp ValueContrastp Value
Understory plants0.170.130.059.50.001
Reference–untreated0.001
Reference–top0.001
Reference–ground0.001
Untreated–top0.001
Untreated–ground0.015
Top–ground0.001
Ground-dwelling spiders0.20.240.053.40.001
Reference–untreated0.100
Reference–mounded0.001
Untreated–mounded0.023
Rove beetles0.190.230.043.20.001
Reference–untreated0.390
Reference–mounded0.001
Untreated–mounded0.029
Ants0.160.20.052.80.001
Reference–untreated0.446
Reference–mounded0.001
Untreated–mounded0.013
Ground beetles0.090.160.021.90.026
Reference–untreated0.816
Reference–mounded0.014
Untreated–mounded0.100
Table 2. Significant indicator species of understory vegetation, ground-dwelling spiders, ground and rove beetles and ants in reference fens, untreated seismic lines, and mounded seismic lines (for understory vegetation in treated areas, ‘Mounded (Top)’ refers to the top of the mounds, and ‘Mounded (Ground)’ refers to the level ground adjacent to the artificial mounds). Note: indicator value is the square root of the product of specificity (the probability of a site belonging to a habitat based on the presence of the indicator species) and fidelity (the probability of encountering the indicator species in sites belonging to a habitat) [52,53]. Species and values in boldface indicate strong indicators (indicator value > 0.6).
TreatmentSpeciesSpecificityFidelityIndicator Valuep Value
Understory vegetation
ReferenceRhododendron groenlandicum0.750.640.690.001
Vaccinium oxycoccos0.460.920.650.001
Maianthemum trifolium0.350.960.580.004
Chamaedaphne calyculata0.800.300.490.002
Rubus chamaemorus0.820.280.480.007
Vaccinium vitis-idaea0.540.420.480.005
UntreatedAndromeda polifolia0.490.800.620.001
Menyanthes trifoliata0.620.520.570.002
Betula pumila0.390.800.560.037
Carex chordorrhiza0.370.720.520.026
Drosera rotundifolia0.450.520.480.016
Pedicularis parviflora0.720.240.420.005
Salix planifolia0.650.200.360.024
Salix bebbiana0.720.160.340.045
MoundedPicea mariana (understory)0.731.000.860.001
(Top)Populus tremuloides (understory)0.940.760.850.001
Chamaenerion angustifolium0.670.400.520.003
Salix spp.1.000.200.450.001
Agrostis scabra0.900.200.420.005
Equisetum palustre0.650.200.360.041
Vaccinium myrtilloides0.650.200.360.021
Mounded Carex aquatilis0.460.920.650.004
(Ground)Comarum palustre0.470.880.640.002
Salix pedicellaris0.430.880.610.006
Carex magellanica0.650.520.580.003
Carex tenuiflora0.410.560.480.049
Carex diandra0.590.320.430.048
Galium trifidum0.650.240.400.045
Rubus pubescens0.780.200.400.001
Carex utriculata0.90.120.330.034
Ground-dwelling spiders
ReferenceDiplocentria bidentata0.700.860.770.001
Pardosa hyperborea0.630.920.760.001
Piratula insularis0.481.000.700.001
Walckenaeria tricornis0.550.620.580.032
Ozyptila sincera canadensis0.660.500.570.004
Cybaeopsis euopla0.560.560.560.016
Sciastes truncatus0.750.420.560.005
Theonoe stridula0.560.560.560.019
Agyneta olivacea0.580.540.560.015
Diplocentria rectangulata0.740.400.540.008
Vermontia thoracica0.820.280.480.012
Carorita limnaea0.640.320.450.045
Walckenaeria atrotibialis0.700.260.430.045
UntreatedOedothorax trilobatus0.750.600.670.001
Xysticus britcheri0.760.560.650.001
Ceratinella ornatula alaskana0.750.440.580.002
Neon nelli0.610.400.500.004
Cheniseo sphagnicultor0.760.320.490.003
Scotinella pugnata0.750.280.460.046
MoundedPardosa fuscula0.780.680.730.001
Pardosa xerampelina0.950.440.650.001
Arctosa raptor0.570.640.600.011
Dolomedes striatus0.510.560.530.031
Piratula cantralli0.600.440.520.014
Cicurina arcuata0.710.240.410.014
Aphileta misera0.820.200.410.013
Rove beetles
ReferenceReichenbachia spp.0.540.840.670.002
Quedius frigidus0.540.720.620.012
UntreatedDinothenarus pleuralis0.770.280.470.006
MoundedPhilonthus flavibasis0.680.500.580.003
Olophrum consimile0.750.210.400.017
Ants
UntreatedMyrmica lobifrons0.630.760.690.005
Formicoxenus quebecensis0.890.200.420.012
MoundedFormica neorufibarbis0.520.960.710.001
Formica dakotensis0.980.200.440.004
Ground beetles
MoundedAgonum gratiosum0.740.440.570.001
Pterostichus adstrictus0.940.240.480.001
Disclaimer/Publisher’s Note: The statements, opinions and data contained in all publications are solely those of the individual author(s) and contributor(s) and not of MDPI and/or the editor(s). MDPI and/or the editor(s) disclaim responsibility for any injury to people or property resulting from any ideas, methods, instructions or products referred to in the content.

