Article

Impact of Hydrocarbon Emissions from Oil and Gas Deposits on δ13C Variability in Pine Tree Rings from the Tatarstan Republic

1
Laboratory of Biogeochemistry Ecosystems, Institute of Ecology and Geography, Siberian Federal University, Svobodny 79, Krasnoyarsk 660041, Russia
2
Department of Forest Dynamics, Swiss Federal Institute for Forest, Snow and Landscape Research WSL, Zürcherstrasse 111, CH-8903 Birmensdorf, Switzerland
3
Institute of Geology and Petroleum Technologies, Kazan Federal University, Kremlyovskaya Str. 18, Kazan 420008, Russia
4
Institute of Ecology and Environmental Management, Kazan Federal University, Kremlyovskaya Str. 18, Kazan 420008, Russia
*
Author to whom correspondence should be addressed.
Forests 2023, 14(10), 2093; https://doi.org/10.3390/f14102093
Submission received: 8 August 2023 / Revised: 9 October 2023 / Accepted: 16 October 2023 / Published: 18 October 2023
(This article belongs to the Special Issue Response of Tree Rings to Climate Change and Climate Extremes)

Abstract

:
Human-caused anthropogenic greenhouse emissions impact the climate globally. In this pilot study, we aim to reveal the influence of hydrocarbon emissions on pine forests by applying a stable carbon isotope analysis in pine tree rings (δ13Cptrw). Our study was conducted in an industrial giant oil field reservoir (UVRT) and natural reserve (Raifa) sites, the Tatarstan Republic, Russia. Our results show a decreasing δ13Cptrw at the UVRT site in 1943, when oil extraction started, and in 1970, when it reached maximum production. We found that the δ13Cptrw from UVRT indicates developing unfavourable drier conditions and a suppressed tree growth caused by both human-induced oil and deposit infrastructures and natural processes compared to the undisturbed Raifa site. A 5-year running correlation analysis showed a significant difference between the sites in 1965 over the period of 1930 to 2021. The δ13Cptrw values from Raifa are more negative compared to UVRT, which can be explained by a higher forest sensitivity to human-induced impacts. From an eco-physiological point of view, the decreasing of intercellular (ci)-to-ambient (ca) CO2 concentration ratios at the leaf level and the increasing of intrinsic water-use efficiency (iWUE) along with a decreasing of tree-ring widths at the UVRT site (1970–2021) indicate the development of drought conditions.

1. Introduction

The accelerated development of energy resources around the world has significantly increased forest changes associated with oil and gas activities, leading to both carbon dioxide and methane emissions. The impacts of these anthropogenic indirect greenhouse gases (GHGs) play a significant role on forest ecosystems at the regional and global scales [1]. GHGs attributed up to 65% to human activities [2], including hydrocarbon emissions from the oil and gas infrastructures [3], causing a global average air temperature increase of 1.4 °C [4]. Moreover, the extraction and refining of oil produces about 48% of hydrocarbons and 44% of carbon monoxide [5], which can significantly impact the environment. In the case of accidents or during intensive oil and gas deposit developments, the toxic contamination of soil can lead to the reduction of air exchange in the soil, hindering the water flow into the soil compared to clean natural soils. Water shortage in the soil can lead to soil fertility and the reduction of microbial activity impacting the forest ecosystem negatively. Additionally, local oil and gas production delivers up to 90% of hydrocarbons, which contribute to global GHG emissions [6]. Due to the intensive development of oil and gas depositions, oil and oil products refine the problem of their emissions locally and globally, impacting the environment and humans’ health.
Recent climate change and drought-induced tree mortality affects forest ecosystems worldwide [7]. It is well known that forest soils and permafrost are an important sink for atmospheric methane emissions, where a GHG contributes roughly 20% to global warming [8,9]. Soil microorganisms remove about 30 million tons of GHGs from the atmosphere annually, which is 6–10% of its annual flow [10]. Living and dead trees have the potential to be CH4 sources or sinks or both [9]. Different tree species have different effects on the activity of CH4 oxidation in the soil—the highest is noted under P. cembra L. (27.68 mg kg−1) in Europe, in Larix sibirica Led. (7.98 mg kg−1) and P. sylvestris L. (4.96 mg kg−1), and the lowest in spruce (4.62 mg kg−1) forests [10].
The carbon atoms fixed in tree-ring widths originate from the atmospheric carbon dioxide to which the tree’s canopy is exposed [9]. During photosynthesis, several fractionation steps take place: first, when CO2 from the atmosphere (ca) diffuses into the leaf (needle) intercellular spaces (ci) and second, during CO2 fixation by the enzyme Rubisco [11]. The opening and closure of the stomata (gs) determines the water control. Under warm and dry conditions, trees respond to limited water resources by reducing stomatal conductance (gs), resulting in a decreasing CO2 uptake and biomass production, in a reduced intercellular CO2 concentration (ci). Changes in the assimilation rate of the needles will therefore influence the intercellular CO2 concentration (ci) through changes in the rate at which the CO2 is utilized to form sugars, and an increase or decrease in stomatal conductance will affect the rate at which this internal CO2 (ci) can be replenished. Trees discriminate more strongly against 13C under conditions of high (ci), when stomata are relatively wide open, or when photosynthesis is low [11]. Under an increasing CO2 concentration, the water vapor exchange between the needles and the ambient air (ca) is reduced and stomatal conductance decreases [12,13,14]. The carbon isotopic ratio (13C/12C or δ13C) in tree rings reflects signals of water availability and air humidity as a result of the climate impact on photosynthesis. Atmospheric CO2 is well-mixed, but the sub-canopy air space can become depleted in 13C due to inputs from soil and plant interactions. Tree growth is influenced by many factors such as solar irradiance, ambient air temperature, precipitation, air humidity, soil and ground water and nutrient availability. The heavier stable carbon isotope (13C) in tree rings is modulated by environmental parameters like temperature and moisture regime changes due to fractionation processes during CO2 uptake as well as those related to land management and disturbances like insects [7,11,12,14,15,16]. Photosynthetic limitations of intrinsic water use efficiency (iWUE) can be an indicator of oil refinery in the case of an increase, which corresponds with NOx pollution [17] and moisture changes, reducing climate sensitivity [18]. If trees uptake a significant amount of hydrocarbon emitted from gas and oil deposits, then we suggest that the tree-ring δ13C should also receive more negative values.
Data on hydrocarbon (HC) production are available for the study area; however, it is not possible to estimate how much hydrocarbons are released from gas and oil deposits into the air, surface water, groundwater, and soil. The HC emissions most likely occurred from the subsurface prior to oil and gas deposit developments. This had a relatively constant flow, for hundreds of thousands and even millions of years, which could change only in the case of events like earthquakes [19]. However, after the beginning of field developments, the equilibrium established during a long geological time was broken which could have led to an increase in the flow of hydrocarbons both from natural fractures and faults and due to losses during production and transportation. In the first stage of extraction, oil is extracted through natural processes. As a result, it is replaced by water. If the pressure in the reservoir does not allow oil to come to the surface, then special pumps are used to extract it. Later, secondary methods are used to extract oil. This is carried out by introducing liquids and gases into oil-bearing formations to provide the necessary amount of energy to extract oil from the earth’s bowels [20]. At this stage of production, the natural state of the reservoirs is disturbed and a significant emission of hydrocarbons into the air, water and soil is possible. When using the hydraulic fracturing method, HC emissions can be very large, comparable to other global sources of greenhouse gases [21]. A large increase in U.S. methane emissions over the past decade was inferred from satellite data and surface observations [22,23].
In the Romashkinskoye UVRT field, the hydraulic fracturing method was not used, but there could also have been noticeable HC emissions during production. Methods for assessing hidden HC emissions during oil field developments were not developed. Usually, only accidents in which a large volume of HC is released into the soil or water are evaluated.
In this study, we hypothesized that during oil and gas deposit developments and active oil production, additional emissions of hydrocarbons can be emitted into the atmosphere, which can be recorded in trees growing close to the oil and gas deposit site.
To test this hypothesis, we developed new tree-ring δ13C in pine wood chronologies from the oil and gas deposits (UVRTs) and for the natural reserve Raifa (Raifa) site to reveal the impact of the Romashkinskoye oil and gas deposit site on pine forests.

2. Materials and Methods

2.1. Study Sites

The study sites are located in the Republic of Tatarstan, within 54–55° N and 49–52° E, the Russian Federation. We investigated two sites: UVRT—the oil and gas deposit infrastructure (UVRT) site near the Romashkinskoye deposit industrial site—and Raifa—a natural reserve site, which is located 250 km away from UVRT (Figure 1a). The territory is located on the southern border of the taiga natural zone in the Volga–Vyatka high-plain complex of dark coniferous broad-leaved forests [22].
The Romashkinskoye UVRT oil and gas deposit site is located 54° N, 52° E, which is 15 km away from the Almetyevsk city in the northwestern part of the Bugulma plateau, confined to the South Tatar (Almetyevsk) arch at 200–210 m asl (Figure 1a). Geological oil reserves are 5 billion tons, while proved and recoverable reserves are3 billion tons. Exploratory drilling started in 1943 [19,20], while in 1948, a thick Devonian formation was discovered. Intensive developments and exploitations started in 1953. At present, the Romashkinskoye field is one of the largest oil fields in the world. More than 400 deposits have been identified. The main ones, in terms of size are the oil deposits of the Devonian terrigenous complex in the Kynovsko-Pashy sediments, which is about 70% of the explored reserves. In terms of reserve replenishments, commercial oil reserves are growing, although cumulative production is also growing and already exceeds previously approved reserves. The depletion of sediments of the Pashinsky horizon of the Romashkinskoye field is regularly estimated to be more than 85%. It was announced that residual oil reserves are concentrated in undeveloped low-permeability reservoirs. Then, petrophysical works, hydrodynamic studies and seismic exploration are carried out, and the reserves are replenished. The composition of the Kynovsko-Pashy sediments indicates that anomalous zones of light oil from the Zhivet complex flowed into the wells. The Zhivetsky complex is represented by sandstones, siltstones and clays with thin interlayers of marls and limestones and is divided into the Afoninsky and Starooskolsky horizons [19,21].
The relief of the study site is characterised as a flat with small hills and a dry forest dominated by pine (P. sylvestris L.) (Figure 1b). The herbage is dominated by ground reedgrass, sedges and various steppe plant species. The soils are dry sod-podzol soils on sandy and sandy loam sediments.
The Raifa natural reserve site 55° N, 49° E (Figure 1a) is represented by pine trees as the main dominant species (P. sylvestris L.) (Figure 1c), with rare spruces and birches (green-moss pine forest). Pine trees (P. sylvestris L.) can reach up to 150 years. The forest stand encounters single species of Betula pendula Roth., P. fennica (Regel) Kom. The understory is sparse, represented by Euonymus verrucosus Scop., Tillia cordata Mill. Dominants of the herbaceous layer are Calamagrostis epigejos (L.) Roth and Convallaria majalis L. The soil is soddy-podzolic on sandy and sandy loam deposits of the third floodplain terrace of the Volga River [22].

2.2. Local Weather Station Observations

The climate of the region is continental with cold winters and warm summers. According to the local Kazan weather station (55° N, 49° E), the average annual temperature is 5.2 °C. The January average temperature reached −10.4 °C, and the July average temperature was 20.8 °C for the period from 1970 to 2021. The average snow depth in the winter reached up to 40 cm. The sum of precipitation was 584 mm per year. Maximum precipitation fell in July with up to 70 mm and the minimum was recorded in March with up to 33 mm, according to the average monthly data from the Russian Research Institute of Hydrometeorological Information—World Data Center [23]—for the period from 1970 to 2021.

2.3. Sampling

Tree-core sampling from four dominant pine trees (P. sylvestris L.) was carried out in July 2022 at each study location (UVRT and Raifa), respectively. Pine tree cores were collected at a height of 1.3 m at the breast height on the south and north sides of the tree from visually healthy, without a double crown and not-damaged, living P. sylvestris L. trees using the Pressler increment borer (Figure 1b,c) according to the standard methodology [25]. All tree cores were packaged in a metal foil and placed in a hard tube for transportation to a stable isotope laboratory.
Soil samples were collected from February–March 2023 using a soil drill borer. The depth of sampling ranged from 1.0 to 1.5 m [25]. Soil samples were placed in a glass container immediately after extraction from the pits, filled with a salt solution and hermetically sealed.

2.4. Tree-Ring Width and Stable Isotope Analyses

Tree-ring cores were prepared for both tree-ring widths (TRWs) [25] and stable carbon isotope analyses [15]. Wood cores were marked with a needle for calendar dating.
The TRWs were measured for the UVRT site for the period from 1925 to 2022 and for Raifa for the period from 1887 to 2021 using Lintab-6 with the TSAPWin software package (Version 6.02, USA) [26]. The quality of the cross-dating chronologies was accessed by using the Cofecha software (Version 4.70a, Germany) [27,28]. Only the common period (1930–2021) for both study sites was used. After that, each annual tree ring was split using a sharp BA-170P NT blade under a Leica M50 microscope (Leica, Berlin, Germany).
For the stable carbon isotope analysis, each annual tree-ring sample for each year separately was packed ca. 200 µg into a tin capsule. All measurements for each sample were repeated three times. International Atomic Energy Agency (IAEA) standards were used as a reference sample for the control: USGS-40 and IAEA-CH-7 with known carbon isotopic ratios.
Stable carbon isotope measurements in wood samples were performed for each tree and each year separately using a Delta V Plus isotope mass spectrometer (Thermo Fisher Scientific, Bremen, Germany) via a Flash HT Plus in the constant flow mode at the Kazan Federal University, the Russian Federation. The tree-ring δ13C in wood chronologies was corrected according to the δ13C atmospheric CO2 for both study sites.
The δ13C CO2 and δ13C CH4 in the soil samples were analysed for both sites using Delta V Plus (Thermo Fisher Scientific, Germany, Bremen, SN08893D). Gas samples were separated and prepared using a TRACE 1310 gas chromatography-mass spectrometer (ThermoFisher Scientific, Bremen, Germany, 713101387) coupled with an ISQ quadrupole mass detector (Thermo Fisher Scientific, Bremen, Germany) connected to the isotope mass spectrometer via a GC Isolink interface unit. The gas sample was injected automatically by means of the TriPlus RSH autosampler (CTC Analytica AG, Zwingen, Switzerland) from a vial with gas with a gas-tight syringe and was introduced into the chromatograph evaporator. The syringe was purged with pure helium before sampling. The volume of the injected sample varied from 0.1 mL to 2.5 mL, depending on the content of the target gases in the sample. Two chromatographic columns were used for the complete separation of methane, carbon dioxide and air group gases (which interfere with the determination of the carbon isotopic ratio due to their interference with nitrogen oxides). The results were processed using the “Isodat” data processing program (Version 3.0.94.12, Germany) [29].
The stable carbon isotopic ratio (13C/12C) is typically expressed in a delta notation (δ13C) (Equation (1)), which is the relative deviation of the ratio in the organic sample (R sample) from that of an internationally accepted standard (Rstandard), Vienna Pee Dee Belemnite (VPDB).
δsample = (Rsample − Rstandard − 1) ∗ 1000

2.5. CO2 and Greenhouse Gas Emissions (GHGs)

The correction of the raw tree-ring δ13C was necessary because the combustion of fossil fuels and biomass and land-use changes have resulted in a decrease in δ13C of the atmospheric CO2 over the last 150 years. Changes in the isotopic ratio of atmospheric CO2 are directly reflected in the isotopic ratios of the products of photosynthesis. Calculating the differences for each year to the pre-industrial value (1850) for δ13C of the atmospheric CO2 obtained from ice cores and direct atmospheric measurements at the Mauna Loa Observatory, Hawaii [24]; https://gml.noaa.gov/ccgg/trends/ (accessed on 22 March 2023), we subtracted these differences from the raw isotope series for the δ13C values for each year. Because isotope fractionation is additive, this completely removes the trend due to a decreasing atmospheric δ13C from fossil fuel emissions and land-use changes.
Local data from the oil extraction and cumulative oil production from the oil and gas UVRT site are available for the period from 1943 to 2021 [19] for comparison with our newly developed δ13Cptrw from the UVRT and natural reserve Raifa sites. Global oil and gas emission data from Russia and globally [6] were used for a regression analysis with δ13Cptrw from both the UVRT and Raifa sites.

2.6. Relation to Intrinsic Water-Use Efficiency (iWUE)

The calculation of intrinsic water-use efficiency (iWUE) was based on Equations (2) and (3) and is described in detail by Saurer and Voelker [30,31].
iWUE = (ca − ci)/1.6
ci = CO2 ∗ ((δ13Catm − δ13Cplant − 4.4)/(27 − 4.4))
where ca is the ambient CO2 concentration, ci is the intercellular CO2 concentration and 1.6 is the ratio of the water diffusivities and CO2 in the air. Diffusion through the stomata is described as (a = 4.4‰) and b is the discrimination associated with carboxylation (b = 27‰) [13,31].
The δ13Cplant is the uncorrected tree-ring δ13C measurement in pine wood relative to the δ13Catm atmospheric CO2. The δ13Catm data is available from https://www.esrl.noaa.gov/gmd/outreach/isotopes/c13tellsus.html (accessed on 22 March 2023).

2.7. Statistical Analyses

The statistical analysis was performed in the STATISTICA Ultimate Academic 13 RUS/EN Rus for Windows). The mean, minimum and maximum values, the standard deviation (SD) and the Pearson correlation coefficients were calculated for stable carbon isotope chronologies from both study sites. A 5-year running correlation analysis was performed between δ13Cptrw from the UVRT and Raifa sites to reveal a breakpoint and differences between the natural reserve Raifa and gas and oil deposit UVRT sites. Stable carbon isotope chronologies for both study sites were detrended using a time series forecasting analysis with the “no trend” function. A multiple regression analysis was performed between local and global gas and oil emissions versus δ13Cptrw. The dependent variable was associated with δ13Cptrw, while the independent variables were local and global oil gas emissions. Bivariant regression plots were computed. A Pearson correlation matrix was computed and a correlation analysis between the non-detrended and the detrended tree-ring δ13Cptrw from both study sites (UVRT and Raifa) with the climatic parameters from the local Kazan weather station was performed. The monthly averaged temperature (t) and precipitation (p) data from September of the previous year (t, p_9) to August of the current year (p, p_8), the annual air temperature and precipitation data (p_1_12; p_1_12), averaged spring–summer (t,p_4567) and summer (t,p_678), were used for calculations.
To reduce the impact of trends, we used detrended stable isotope chronologies. The level of statistical significance is expressed as a p-value ≤ 0.05.
The iWUE data were smoothed by an 11-year Hamming window [32] to reveal low-frequency variations and to compare long-term trends between the study sites.

2.8. Spatial Climate Patterns

Spatial correlation gridded maps were computed within the gridded net 0.5 × 0.5° within the coordinates 50–60° N, 40–55° E between June–August. Evapotranspiration, differences between the maximal and minimal air temperatures (Tmax-min), precipitation and cloud fractions are available at the KNMI Climate Explorer website (https://climexp.knmi.nl/) (accessed on 29 March 2023) as well as the detrended tree-ring δ13Cptrw from the UVRT site for the period 1980–2020. The level of significance is a p-value of ≤0.05.

3. Results

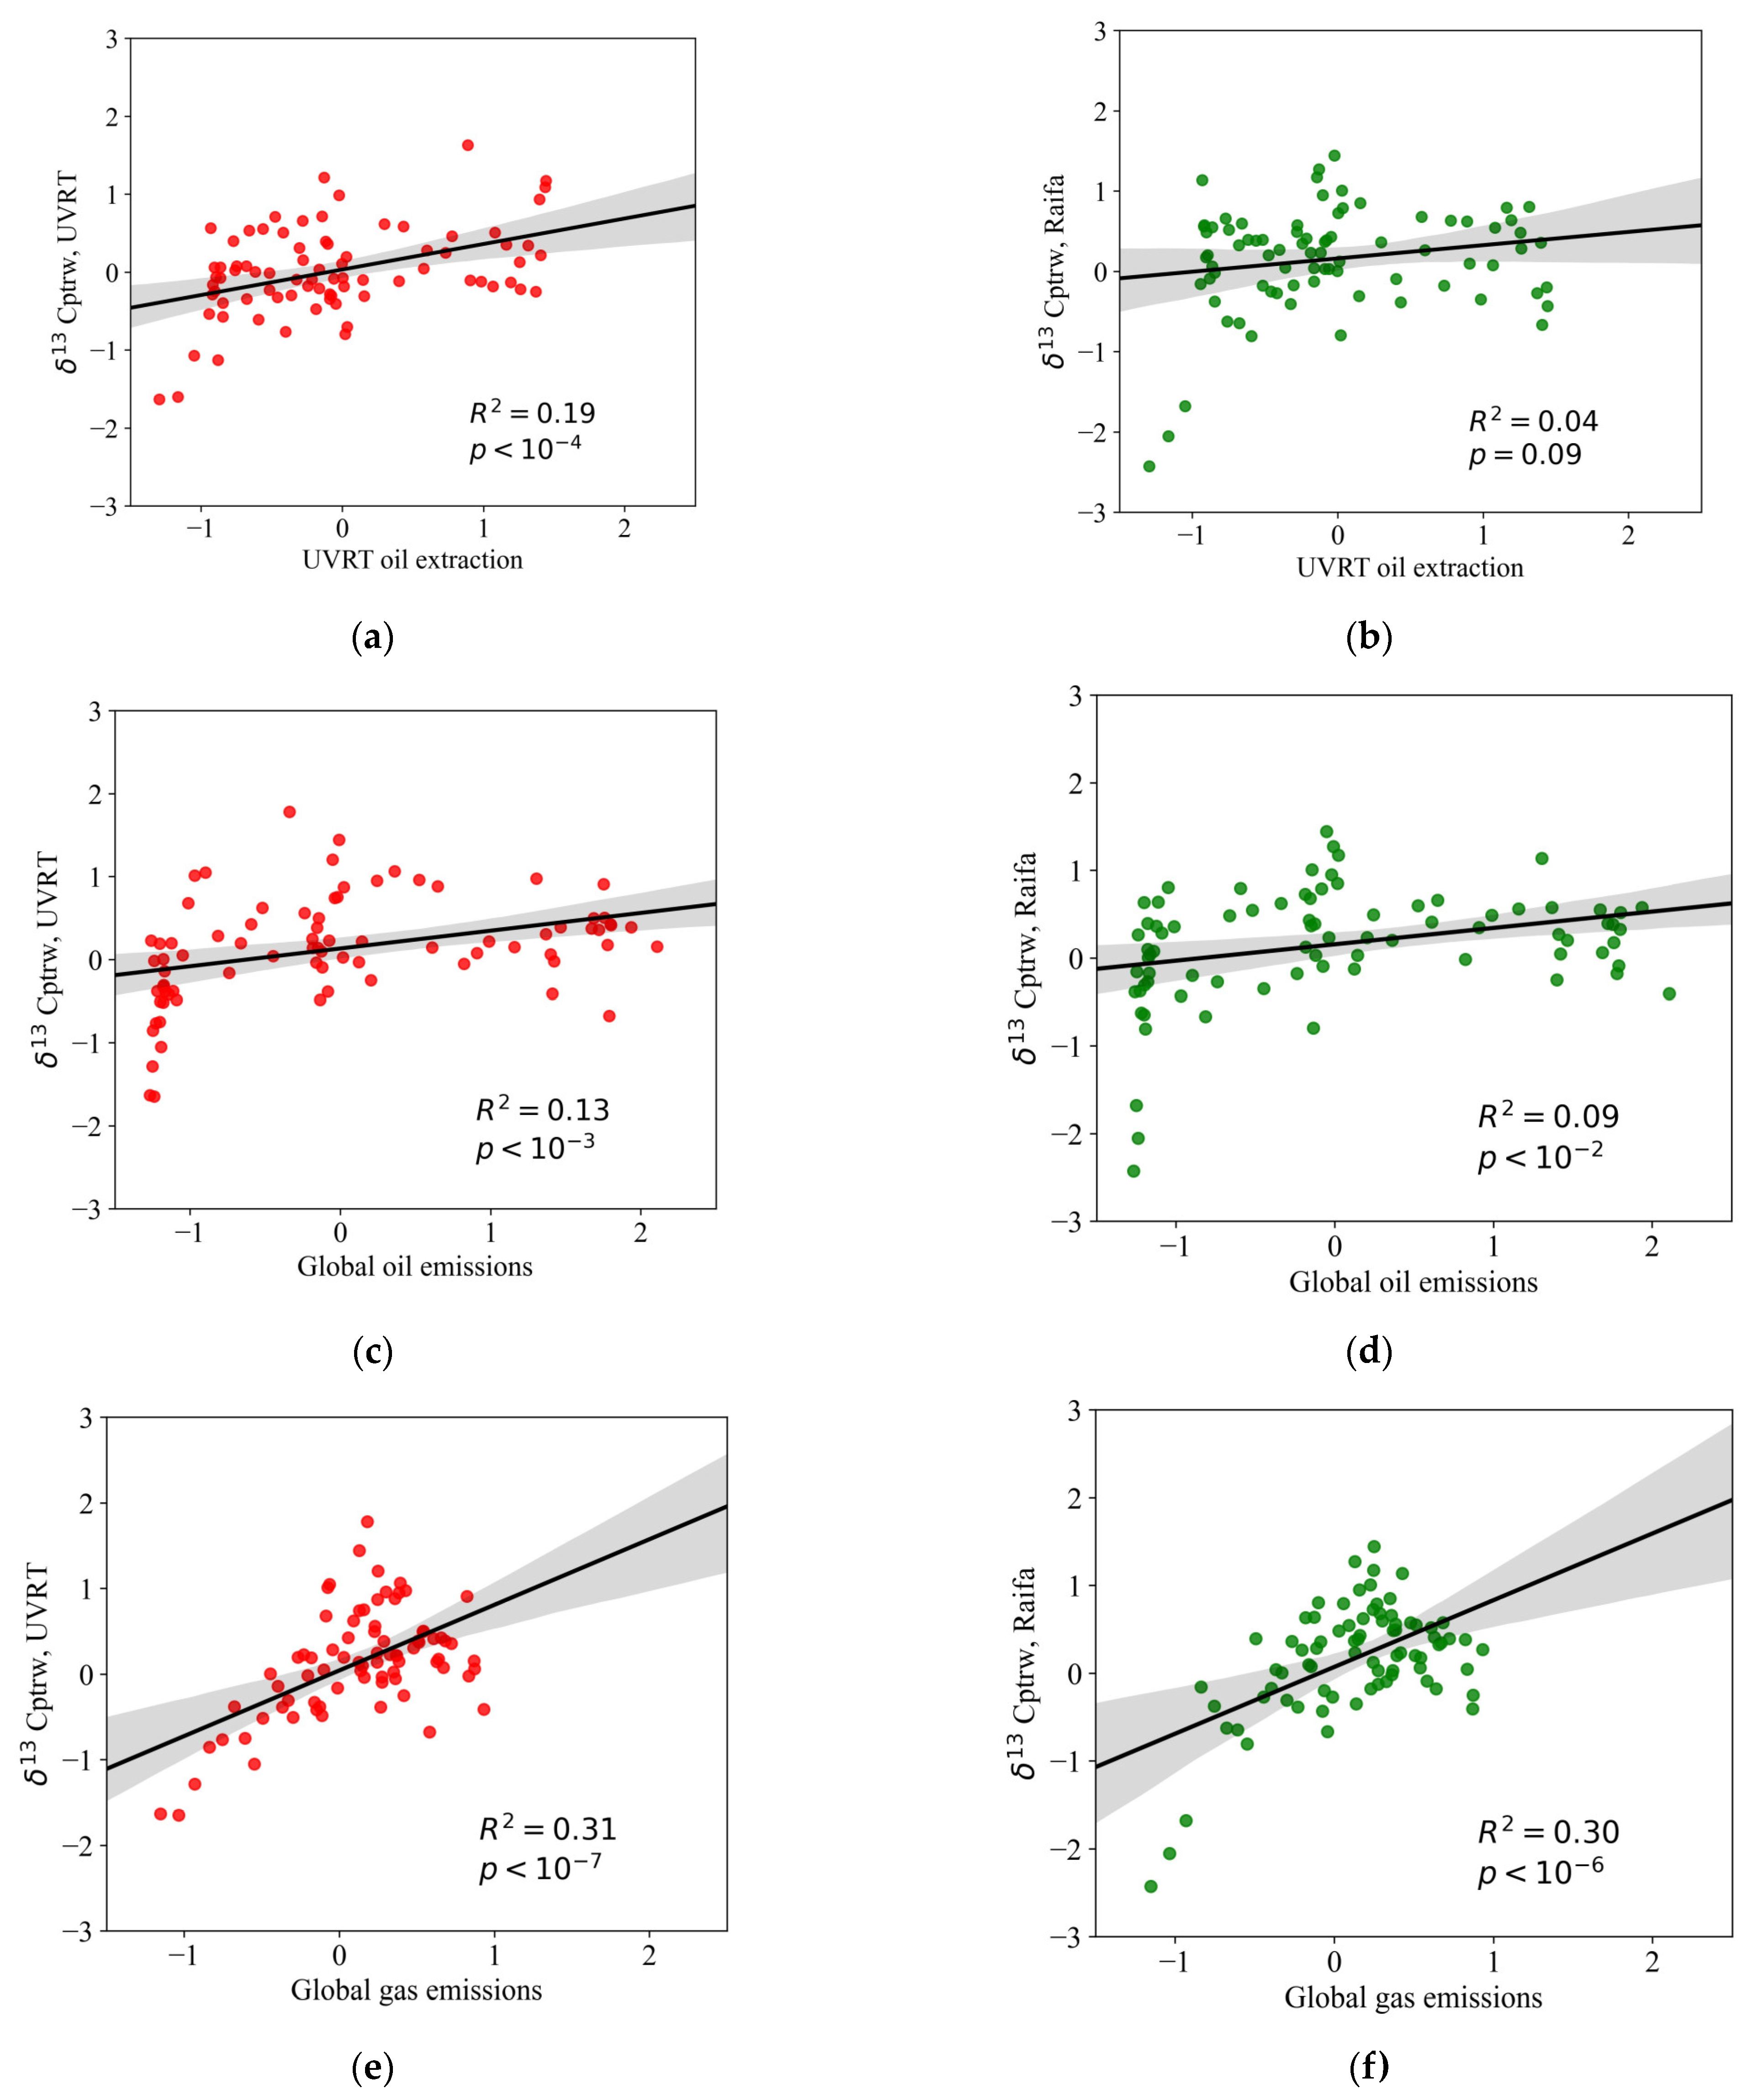
3.1. Stable Carbon Isotopes in Wood vs. Oil and Gas Emissions

Stable carbon isotope chronologies were developed for the UVRT and Raifa sites based on four individual trees for each study site for the common period from 1930 to 2021 (Figure 2a).
The mean δ13C value is more negative for Raifa (−23.6‰) compared to UVRT (−22.3‰). The standard deviation (SD) is higher for the UVRT site (1.2) compared to Raifa (0.8). The maximum and minimum values are more negative for Raifa (max −21.5‰ and min −25.4%) compared to UVRT (max −19.7‰ and min −24.3‰). The δ13C from Raifa showed a significant correlation with UVRT (r = 0.89 and p < 0.001). Moreover, we found more negative values for both δ13C CO2 and δ13C CH4 in the soil samples from the Raifa site (−19.3 ‰ and −64.4 ‰) compared to UVRT (−12.4 and −51.1 ‰), respectively.
A 5-year running correlation analysis between the δ13Cptrw from UVRT and Raifa (Figure 2b) showed a significant difference in the year of 1965, showing a negative correlation (r = −0.38 and p < 0.05) over the studied period 1930–2020. During other subperiods, positive correlations were revealed.
Oil and gas extractions from the deposits started in 1943 and reached their maximum in 1970 (Figure 2c), which corresponds with decreasing δ13C values from both study sites, with the most pronounced decrease for the Raifa natural reserve site (Figure 2a).
The regression analysis showed significant relationships between the local Romashkinskoye oil extraction and detrended stable carbon isotope chronologies for the UVRT and Raifa sites (r2 = 0.19 and r2 = 0.04), respectively (Figure 3a,b), with a higher significant correlation for the gas and oil deposit UVRT site only.
The global oil and gas emissions correlate significantly with the tree-ring δ13Cptrw for UVRT (r2 = 0.13 and r2 = 0.31) (Figure 3c,e) and for Raifa (r2 = 0.09 and r2 = 0.30) (Figure 3d,f), with p < 0.05, respectively.

3.2. Intrinsic Water-Use Efficiency (iWUE) versus Tree-Ring Width and Tree-Ring δ13C

The earlier 1930s averaged tree-ring width (TRW) chronology from UVRT shows lower mean values (1.42 mm) and SDs (1.21) compared to the Raifa site for TRWs (1.55 mm) and SDs (1.44), respectively. However, starting from the 1960s, the tree-ring widths from Raifa showed higher values, compared to the suppressed UVRT site (Figure 4a).
The intercellular CO2 concentration (ci) showed a higher offset between the two sites starting from 1965, when oil and gas production from Romashkinskoye was doubly increased (Figure 4b) with a higher ci for the Raifa site. The lower ci values found for the UVRT site can be explained by stomata closure and the incorporation of a higher CO2 concentration leading to drier conditions.
A strong decreasing ci/ca trend with lower values (Figure 4c) and a continuous increase of the iWUE (Figure 4d) were revealed for the UVRT site. Both UVRT and Raifa showed similar increasing trends from 1930 towards 2020 (Figure 4d).

3.3. The Impact of Local Environmental Parameters on Tree-Ring δ13C Variability

The Pearson correlation analysis between the non-detrended and detrended tree-ring δ13Cptrw from both study sites showed positive significant (p < 0.05) correlations with spring–summer air temperatures (April–July) (r = 0.65 and 0.52) for the Raifa and (r = 0.61 and 0.45) UVRT sites, respectively.
The highest correlation was found between the annual air temperature between the non-detrended δ13Cptrw for Raifa (r = 0.74) and UVRT (r = 0.68) (Figure 5). The detrended δ13Cptrw showed lower values but still had significant correlations (r = 0.44) for Raifa and for UVRT (r = 0.31).
A negative significant correlation was found between the tree-ring δ13C from the Raifa site and the summer (June–August) precipitation (r = −0.21 and p < 0.05). Positive significant correlations were found between the detrended δ13Cptrw from both sites, with a spring air temperature and precipitation of the previous year and the current one.

3.4. Spatial Correlation Patterns

The detrended tree-ring δ13C chronology from the UVRT site showed positively significant (p < 0.05) spatial correlations within the gridded net 0.5 × 0.5° for the coordinates within 50–60° N and 40–55° E with an averaged June–August evapotranspiration (r = 0.5) (Figure 6a) and a June–August Tmax-min (r = 0.5) (Figure 5b), while negative ones were shown with a June–August precipitation (r = −0.5) (Figure 6c) and a June–August cloud fraction (r = −0.6) (Figure 6d).

4. Discussion

The oil and gas industry started to be developed in Romashkinskoye, the Tatarstan Republic, the Russian Federation, in 1943 [19], and in the 1970s, it reached the maximum in oil extractions, which was recorded in the tree-ring pine δ13Cptrw chronologies from both the UVRT and Raifa sites. Recently, oil and gas production were increased by 3.5% compared to the past. A further increase of oil and gas production is expected in the near future [20]. The accelerating rate of GHG emissions will undouble and will change the environment, biodiversity and humans’ health. Only accidents in which a large volume of hydrocarbons released into the soil or water have been evaluated so far. Therefore, our pioneering study highlights how trees could respond to oil and gas development infrastructures near to the deposit and in the remote site locations of the region.
Our results, at the tree-ring level, show a higher tree growth suppression during oil extractions for the UVRT site, which is also reflected in the tree-ring δ13C values. This can be explained by the negative impact of the developed oil and gas infrastructure on the pine forest. Our finding is in line with Pickell et al. [33], who showed an anthropogenic disturbance in developed oil and gas activities on forest landscapes in the USA [34]. The heavier stable carbon isotope (13C) in tree rings is modulated by hydrocarbon emissions from the infrastructure site and to environmental parameters like the temperature, precipitation, sunshine duration and evapotranspiration. Moreover, anthropogenic CO2s increase due to the Suess effect and the global GHG emissions accumulated in tree rings, which is reflected in the drastic δ13C increase towards the recent decades.
Interestingly, pine trees from the natural reserve Raifa site, which is undisturbed by direct human impacts, show a more positive tree ring variability compared to the human-induced UVRT site. However, the tree-ring δ13C, CH4 and CO2 in the soil showed more negative values compared to the oil and gas deposit UVRT site. One of the explanations for this could be that pine trees from natural reserve sites are more sensitive to the impact of greenhouse emissions, while pine trees from human-induced sites are already stressed by local and global impacts. A significant impact of local oil extractions and global HC emissions was revealed for the UVRT site, which supports our hypothesis that both local and global hydrocarbon emissions affect local pine forests. An increasing intrinsic water-use efficiency (iWUE) along with a decreasing tree-ring width chronology from the oil and gas deposits indicate the development of drought conditions (Figure 4) during the vegetation period, which is confirmed by the local and spatial climatic correlation analyses. Despite site-specific and species-specific differences, the study by Guerrieri et al. [17] showed that NOx pollutions alter the iWUE by confirming the impact of anthropogenic factors on oak trees. It is well known that the variation of ci depends on various environmental factors and on species and site conditions. Our study demonstrates the site-specific response of trees to oil and gas productions after 1965, showing an offset between two sites. The ci/ca ratio has decreased in recent decades, indicating the closure of the stomata, which is also reflected in increased iWUE trends for both sites. However, a higher iWUE is observed for the natural reserve Raifa site.
An increasing evapotranspiration and extreme changes in air temperatures, less clouds and a decreasing of precipitation lead to developing drier environmental conditions. Pine trees from the Raifa site record more pronounced drought conditions during July over the period from 1970 to 2021, which is also recorded in the δ13Cptrw values. Early spring temperatures can impact tree growth significantly, by shifting the vegetation period to earlier dates. Such an early spring temperature shift was observed in the southern part of Siberia due to early snowmelt under recent anthropogenic warming [35,36]. However, it is challenging to separate the impacts from global and local anthropogenic emissions here. Therefore, further studies are needed for complex and multi-parametric approaches.

5. Conclusions

We conclude that pine trees from the UVRT site indicate developing unfavourable drier conditions and a suppressed tree growth caused by both human-induced oil and deposit infrastructures and natural eco-physiological processes compared to the undisturbed natural reserve Raifa site. Understanding the mechanisms behind local hydrocarbon emissions from oil and gas deposits and their contribution to global GHG emissions is of great importance and should be further investigated among transects. A comparative analysis may provide a comprehensive description of anthropogenic impacts among available oil and gas deposit infrastructures in the region, locally and globally.
Based on our pilot study, we would recommend performing seasonal and annual multi-proxy parameter approaches by analysing the δ13C in needles and the δ13C and CH4 in the soil at different depths and by analysing tree-ring cellulose instead of wood, which is a more sensitive parameter to both eco-physiological and climatological changes. Further local oil and gas developments and their impacts on forest ecosystems should be better tracked and analysed along the transect for long-term monitoring.

Author Contributions

Conceptualization, all authors; methodology, G.B., B.G., G.M., A.T., D.T., D.K. and D.N.; software, O.V.C. and G.M.; validation, O.V.C. and G.M.; formal analysis, O.V.C., G.M., A.T., D.T., G.B. and B.G.; resources, D.N.; data curation, O.V.C.; writing—original draft preparation, all authors; writing, all authors; visualization, O.V.C.; supervision, D.N.; project administration, D.K.; funding acquisition, D.N. All authors have read and agreed to the published version of the manuscript.

Funding

This research was funded by the Kazan Federal University Strategic Academic Leadership Program (PRIORITY-2030).

Data Availability Statement

Research data will be uploaded to the Zenodo repository upon acceptance of the manuscript.

Conflicts of Interest

The authors declare no conflict of interest.

References

  1. Jones, M.W.; Peters, G.P.; Gasser, T.; Andrew, R.M.; Schwingshackl, C.; Gütschow, J.; Houghton, R.A.; Friedlingstein, P.; Pongratz, J.; Le Quéré, C. National contributions to climate change due to historical emissions of carbon dioxide, methane, and nitrous oxide since 1850. Sci. Data 2023, 10, 155. [Google Scholar] [CrossRef]
  2. Saunois, M.; Bousquet, P.; Poulter, B.; Peregon, A.; Ciais, P.; Canadell, J.G.; Dlugokencky, E.J.; Etiope, G.; Bastviken, D.; Houweling, S.; et al. The global methane budget 2000–2012. Earth Syst. Sci. Data 2016, 8, 697–751. [Google Scholar] [CrossRef]
  3. Bruhwiler, L.M.; Basu, S.; Bergamaschi, P.; Bousquet, P.; Dlugokencky, E.; Houweling, S.; Ishizawa, M.; Kim, H.S.; Locatelli, R.; Maksyutov, S.; et al. CH4 emissions from oil and gas production: Have recent large increases been detected? J. Geophys. Res.-Atmos. 2017, 122, 4070–4083. [Google Scholar] [CrossRef]
  4. IPCC. Summary for Policymakers. In Climate Change 2021: The Physical Science Basis. Contribution of Working Group I to the Sixth Assessment Report of the Intergovernmental Panel on Climate Change; Masson-Delmotte, V., Zhai, P., Pirani, A., Connors, S.L., Péan, C., Berger, S., Caud, N., Chen, Y., Goldfarb, L., Gomis, M.I., et al., Eds.; Cambridge University Press: Cambridge, UK; New York, NY, USA, 2021; pp. 3–32. [Google Scholar] [CrossRef]
  5. Privalova, N.M.; Dvadnenko, M.V.; Nekrasova, A.A.; Privalov, D.M.; Popova, O.S. Impact of oil and oil products on the environment. Tech. Sci. 2017, 125, 309–318. [Google Scholar] [CrossRef]
  6. Ritchie, H.; Roser, M.; Rosado, P. Greenhouse Gas Emissions. 2020. Databased Platform. Available online: https://ourworldindata.org/co2-and-greenhouse-gas-emissions (accessed on 22 March 2023).
  7. Allen, C.D.; Macalady, A.K.; Chenchouni, H.; Bachelet, D.; McDowell, N.; Vennetier, M.; Kitzberger, T.; Rigling, A.; Breshears, D.D.; Hogg (Ted), E.H.; et al. A global overview of drought and heat-induced tree mortality reveals emerging climate change risks for forests. For. Ecol. Manag. 2010, 259, 660–684. [Google Scholar] [CrossRef]
  8. IPCC. Climate Change 2007: Synthesis Report. Contribution of Working Groups I, II and III to the Fourth Assessment Report of the Intergovernmental Panel on Climate Change; Core Writing Team, Pachauri, R.K., Reisinger, A., Eds.; IPCC: Geneva, Switzerland, 2017; p. 104. [Google Scholar]
  9. Covey, K.R.; Megonigal, J.P. Methane production and emissions in trees and forests. Transley Rev. New Phytol. 2019, 222, 35–51. [Google Scholar] [CrossRef]
  10. Menyailo, O.V.; Abraham, W.-R.; Conrad, R. Tree species affect atmospheric CH4 oxidation without altering community composition of soil methanotrophs. Soil Biol. Biochem. 2010, 42, 101–107. [Google Scholar] [CrossRef]
  11. Farquhar, G.D.; Ehleringer, J.R.; Hubick, K.T. Carbon isotope discrimination and photosynthesis. Annu. Rev. Plant Phisiol. Plant Mol. Biol. 1989, 40, 503–537. [Google Scholar] [CrossRef]
  12. Siegwolf, R.T.W.; Lehmann, M.M.; Goldsmith, G.R.; Churakova (Sidorova), O.V.; Mirande-Ney, C.; Timofeeva, G.; Weigt, R.B.; Saurer, M. Updating dual C and O isotope—Gas exchange model: A concept to understand plant responses to the environment and its implications for tree rings. Plant Cell Environ. 2023, 46, 2606–2627. [Google Scholar] [CrossRef] [PubMed]
  13. Farquhar, G.D.; Hubick, K.T.; Condon, A.G.; Richards, R.A. Carbon isotope fractionation and plant water-use efficiency. In Stable Isotopes in Ecological Research. Ecological Studies; Rundel, P.W., Ehleringer, J.R., Nagy, K.A., Eds.; Springer: New York, NY, USA, 1989; Volume 68. [Google Scholar] [CrossRef]
  14. Siegwolf, R.T.W.; Brooks, J.R.; Roden, J. Stable Isotopes in Tree Rings Inferring Physiological, Climatic and Environmental Responses Stable Isotope in Tree Rings; Springer: Berlin/Heidelberg, Germany, 2022; p. 773. [Google Scholar] [CrossRef]
  15. McCarroll, D.; Loader, N.J. Stable isotopes in tree rings. Quat. Sci. Rev. 2004, 23, 771–801. [Google Scholar] [CrossRef]
  16. Quinby, B.M.; Creighton, J.C.; Flacherty, E.A. Stable isotope ecology in insects: A review. Ecol. Entomol. 2020, 45, 1231–1246. [Google Scholar] [CrossRef]
  17. Guerrieri, R.; Siegwolf, R.T.W.; Saurer, M.; Ripullone, F.; Mencuccini, M.; Borghetti, M. Anthropogenic NOx emissions alter the intrinsic water-use efficiency (WUEi) for Quercus cerris stands under Mediterranean climate conditions. Environ. Pollut. 2010, 158, 2841–2847. [Google Scholar] [CrossRef]
  18. Leonelli, G.; Battipaglia, G.; Siegwolf, R.T.W.; Saurer, M.; Morra di Cella, U.; Cherubini, P.; Pelfini, M. Climatic isotope signals in tree rings masked by air pollution: A case study conductance along the Mont Blanc Tunnel access road (Western Alps, Italy). Atmos. Environ. 2012, 61, 169–1719. [Google Scholar] [CrossRef]
  19. Muslimov, R.K. (Ed.) Romashkino Oil Field; VNIIOENG: Moscow, Russia, 1995; Volume 1, p. 492. [Google Scholar]
  20. Khasanova, A.; Bakhtina, O. Tatneft Estimates Reserves of the Romashkinskoye Field. 2023. Available online: https://neftegaz.ru/news/gas/774735-tatneft-otsenila-zapasy-romashkinskogo-mestorozhdeniya/ (accessed on 22 March 2023).
  21. Selley, R.; Sonnenberg, S.A. Elements of Petroleum Geology, 3rd ed.; Elsevier: Amsterdam, The Netherlands, 2014. [Google Scholar] [CrossRef]
  22. Bakin, O.V.; Rogova, T.V.; Sitnikov, A.P. Vascular Plants of Tatarstan; University Press Kazan: Kazan, Russia, 2000; p. 496. [Google Scholar]
  23. RIHMI-WDC. Baseline Climatological Data Sets. Obninsk, Russia. 2022. Available online: http://meteo.ru/english/data (accessed on 3 December 2022).
  24. Francey, R.J.; Allison, C.E.; Etheridge, D.M.; Trudinger, C.M.; Enting, I.G.; Leuenberger, M.; Langenfelds, R.L.; Michel, E.; Steele, E. A 1000-year high precision record of δ13C in atmospheric CO2. Tellus B 1999, 51, 170–193. [Google Scholar] [CrossRef]
  25. Cook, E.R.; Kairiukstis, L.A. Methods of Dendrochronology. In Applications in the Environmental Sciences; Springer: Berlin/Heidelberg, Germany, 1990; p. 394. [Google Scholar] [CrossRef]
  26. Rinn, F. TSAPWin—Time Series Analysis and Presentation for Dendrochronology and Related Applications; V. 0.53, User Reference; Heidelberg, Germany, 2005. [Google Scholar]
  27. Holmes, R.L. Computer-assisted quality control in tree-ring dating and measurement. Tree-Ring Bull. 1983, 43, 51–67. [Google Scholar]
  28. Grissino-Mayer, H.D. Evaluating cross-dating accuracy: A manual and tutorial for the computer program COFECHA. Tree-Ring Res. 2001, 57, 205–221.27. [Google Scholar]
  29. Thermo Electron (Bremen) GmbH. Isodat 2.0 Operating Manual. In Finnigan Advanced Mass Spectrometry; Thermo Electron (Bremen) GmbH: Bremen, Germany, 2004. [Google Scholar]
  30. Saurer, M.; Voelker, S. Intrinsic water-use efficiency derived from stable carbon isotopes of tree rings. In Stable Isotopes in Tree Rings; Springer: Berlin/Heidelberg, Germany, 2023; pp. 481–498. [Google Scholar]
  31. Dawson, T.E.; Siegwolf, R. Book Stable Isotopes as Indicators of Ecological Change; Todd, E., Dawson, T.E., Rolf, T.W., Siegwolf, R., Eds.; Academic Press: Cambridge, MA, USA, 2007; ISBN 978-0-12-373627-7. [Google Scholar]
  32. Blackman, R.; Tukey, J.W. The Measurement of Power Spectra from the Point of View of Communications Engineering—Part I. Bell Syst. Tech. J. 1958, 37, 185–282. [Google Scholar] [CrossRef]
  33. Pickell, P.D.; Gergel, S.E.; Coops, N.C.; Andison, D.W. Monitoring Forest Change in Landscapes Under-Going Rapid Energy Development: Challenges and New Perspectives. Land 2014, 3, 617–638. [Google Scholar] [CrossRef]
  34. Turner, A.J.; Jacon, D.J.; Benmergui, S.C.; Wofsy, J.D.; Maasakkers, A.; Butz, O.; Hasekamp, S.C.; Biraud, A. large increase in U.S. methane emissions over the past decade inferred from satellite data and surface observations. Geophys. Res. Lett. 2016, 43, 2218–2224. [Google Scholar] [CrossRef]
  35. Vaganov, E.A.; Hughes, M.K.; Kirdyanov, A.V.; Schweingruber, F.H.; Silkin, P.P. Influence of snowfall and melt timing on tree growth in subarctic Eurasia. Nature 1999, 400, 149–151. [Google Scholar] [CrossRef]
  36. Knorre, A.A.; Siegwolf, R.T.W.; Saurer, M.; Sidorova, O.V.; Vaganov, E.A.; Kirdyanov, A.V. Twentieth century trends in tree ring stable isotopes (δ13C and δ18O) of Larix sibirica under dry conditions in the forest steppe in Siberia. J. Geophys. Res. 2010, 115, G03002. [Google Scholar] [CrossRef]
Figure 1. Map location with the study sites (black rectangle) (a) and photos from (b) the oil and gas deposit infrastructure UVRT (red circle) and (c) the natural reserve Raifa (green circle) sites. Average numbers of the δ13C atmospheric CO2 [24] and δ13Cptrw are presented for the common period from 1930 to 2021. The δ13C CO2 and δ13C CH4 are presented for the available year of 2023 with a schematic interaction of water evaporation and CH4 and CO2 soil–atmosphere–plant exchanges.
Forests 14 02093 g001aForests 14 02093 g001b
Figure 2. Raw (light-blue and light-red lines) and corrected (bold-blue and bold-red lines) according to the δ13C of atmospheric CO2 [24] tree-ring δ13C in pine wood chronologies (δ13Cptrw) from UVRT (red-coloured lines) and Raifa (blue-coloured lines) sites versus δ13C atmospheric CO2 (bold black) from 1930 to 2021 (a). A 5-year window running correlations between δ13Cptrw from UVRT and Raifa sites. A running correlation is presented as a blue line and the break-point year is represented as the dotted line in 1965 according to the normalized reference line (relative to the zero, red line) (b). Oil extractions (black line) and cumulative oil production (green line) from the Romashkinskoye oil and gas deposit UVRT site [19] for the period from 1943 to 2022 in comparison with δ13Cptrw from UVRT and Raifa (c).
Forests 14 02093 g002
Figure 3. Detrended tree-ring δ13Cptrw from the UVRT (left panel, red dots) and Raifa (right panel, green dots) sites versus detrended local Romashkinskoe oil extraction [19] (a,b), global oil (c,d) and gas (e,f) [6] emissions for the period 1943 to 2021. Confidential interval is 0.95 and p < 0.05.
Forests 14 02093 g003
Figure 4. Averaged tree-ring width chronologies (a), intercellular CO2 concentration (ci) (b) and intercellular CO2 concentration versus ambient CO2 concentration (ci/ca) from Raifa versus the oil and gas reservoir UVRT site (c). Intrinsic water-use efficiency (iWUE) was calculated for both the Raifa and UVRT study sites (d).
Forests 14 02093 g004
Figure 5. Pearson correlation analysis between the δ13Cptrw chronology from UVRT (red line), the δ13Cptrw chronology from Raifa (green line) as well as the detrended δ13Cptrw from UVRT (red line with circle) and the δ13Cptrw from Raifa (green line with green circle) versus climatic data from the local Kazan weather station. The temperature and precipitation from September of the previous year are marked as t9-1 and p9-1, respectively. The monthly averaged temperature and precipitation are indicated in numbers.
Forests 14 02093 g005
Figure 6. Spatial distribution of correlation coefficients within the gridded 0.5 × 0.5° net coordinates 50–60° N (latitude) and 40–55° E (longitude) between the detrended tree-ring δ13Cptrw from UVRT and the averaged June–August reference evapotranspiration (a), the differences between the maximal and minimal air temperature (Tmax-min) (b), precipitation (c) and cloud fractions (d) computed for the period from 1980–2020. Right vertical scales represent correlation coefficients within the range from −0.6 (dark blue, negative correlations) to +0.6 (dark red, positive correlations), with p < 0.05.
Forests 14 02093 g006aForests 14 02093 g006b
Disclaimer/Publisher’s Note: The statements, opinions and data contained in all publications are solely those of the individual author(s) and contributor(s) and not of MDPI and/or the editor(s). MDPI and/or the editor(s) disclaim responsibility for any injury to people or property resulting from any ideas, methods, instructions or products referred to in the content.

