Article

Measuring Tree Diameter with Photogrammetry Using Mobile Phone Cameras

1
Working Trees Inc., 2093 Philadelphia Pike #9249, Claymont, DE 19703, USA
2
Department of Geophysics, Stanford University, 397 Panama Mall, 3rd Floor Mitchell Building, Stanford, CA 94305, USA
3
Emmett Interdisciplinary Program in Environment and Resources, Stanford University, Suite 226, 473 Via Ortega, Stanford, CA 94305, USA
4
School of Plant and Environmental Sciences, Virginia Polytechnic Institute and State University, 185 Ag Quad Lane, Blacksburg, VA 24061, USA
5
Department of Statistics, Stanford University, 390 Jane Stanford Way, Stanford, CA 94305, USA
*
Author to whom correspondence should be addressed.
Forests 2023, 14(10), 2027; https://doi.org/10.3390/f14102027
Submission received: 2 September 2023 / Revised: 27 September 2023 / Accepted: 7 October 2023 / Published: 10 October 2023
(This article belongs to the Special Issue Forest and Climate Change Adaptation)

Abstract

:
Tree inventories are a cornerstone of forest science and management. Inventories are essential for quantifying forest growth rates, determining biomass and carbon stock variation, assessing species diversity, and evaluating the impacts of both forest management and climate change. Recent advances in digital sensing technologies on mobile phones have the potential to improve traditional forest inventories through increased efficiency in measurement and transcription and potentially through increasing participation in data collection by non-experts. However, the degree to which digital sensing tools (e.g., camera-enabled smartphone applications) can accurately determine the tree parameters measured during forest inventories remains unclear. In this study, we assess the ability of a smartphone application to perform a user-assisted tree inventory and compare digital estimates of tree diameter to measurements made using traditional forestry field sampling approaches. The results suggest that digital sensing tools on mobile phones can accurately measure tree diameter (R2 = 0.95; RMSE = 2.71 cm compared to manual measurements) while saving time during both the data-collection stage and data-entry stage of field sampling. Importantly, we compare measurements of the same tree across users of the phone application in order to determine the per-user, per-tree, and per-species uncertainty associated with each form of measurement. Strong agreement between manual and digital measurements suggests that digital sensing technologies have the potential to facilitate the efficient collection of high-quality and auditable data collected by non-experts but with some important limitations compared to traditional tree measurement approaches. Most people in the world own a smartphone. Enabling accurate tree inventory data collection through mobile phones at scale can improve our understanding of tree growth and biomass accumulation and the key factors (e.g., climate change or management practices) that affect these processes, ultimately advancing forest science and management.

1. Introduction and Background

Data collected during tree inventories play an essential role in understanding biomass fluctuations in forests, agricultural settings, and other environments (e.g., [1,2,3]). Traditionally, tree inventories are carried out using tape measures or calipers to estimate tree diameter (e.g., [4,5]) and notebooks or clipboards to record measurements, which are later logged into computers. Accurate estimation of tree diameter is an essential component of (1) determining biomass stocks and growth rates and (2) understanding changes in stocks and growth rates over time, including understanding the impacts of factors such as climate change and management practices. In addition to quantifying biomass accumulation in a variety of environments, tree inventories are also critical components of measurement, reporting, and verification requirements associated with reforestation efforts and nature-based carbon markets [6,7,8,9].
Recent advances in sensing technologies present an opportunity to improve tree inventories by facilitating the simple, rapid, and auditable collection of digital measurements of tree diameter. Existing camera sensors on most mobile phones can be leveraged to cheaply acquire these measurements, as well as other relevant information such as images and geolocation (e.g., [10,11,12,13,14]). If inventory data acquired from mobile phones are accurate enough to replace manual measurements, mobile-enabled data collection could significantly simplify the process of collecting the data required for a tree inventory, permitting the acquisition of high-quality tree measurements at a fraction of the time and cost of current approaches. Moreover, the broad availability of smartphones can facilitate data collection from non-experts, with appropriate guidance and quality control methods in place [13]. High-quality field data can also be used to calibrate or improve the accuracy of remotely sensed estimates of biomass derived from satellite or airborne platforms (e.g., [15,16,17,18]).

1.1. Background and Previous Work

Many recent studies have evaluated the ability of handheld sensors and postprocessing algorithms to accurately measure tree diameter, the key parameter measured during tree inventories, across a diverse spectrum of environments encompassing various climates, biomes, and understory conditions. We note that a review of terrestrial laser scanning and postprocessing approaches to estimate diameter are outside the scope of this paper because deploying such approaches at scale with non-experts is expensive and requires both equipment and expertise to deploy in a field setting, as well as software to postprocess the acquired data.
In general, diameter-estimation approaches can be performed in real-time (as the sampler is making the measurement) or via post-processing applied to images, point clouds, or other sensor data. Both hardware (e.g., [12]) and software (e.g., [13]) have been developed for this purpose, and various studies have sought to measure diameter in real-time (i.e., the user can view the measurement while they are still at the location of the tree, as in [14]), or via offline postprocessing algorithms to extract the diameter from images or other data after the user has left the location (e.g., [11]). Proudman et al. (2022) [12] developed a handheld Light Detection and Ranging (LiDAR) unit to estimate tree diameters by modeling each tree trunk as a cylinder through a least-squares optimization within a Random Sample Consensus (RANSAC) loop, producing inventory results that can be viewed in the field, in ~¼ the time of a traditional inventory. Errors associated with this approach ranged from 7 to 14 cm. However, despite the much-improved efficiency of the approach, the LiDAR unit used in the study was custom-made and not readily available, and errors of 7 to 14 cm may not be sufficient for applications requiring high accuracies and low uncertainties. Other studies have used post-processing techniques (applied after data collection) to images or point clouds in order to determine tree diameter. Wu et al. (2019) [11] developed an approach to estimate tree diameter from images through image segmentation and depth extraction, obtaining an RMSE of 0.21 cm, which corresponds to 2.32% at imaging distances between 2 and 10 m. Wang et al. (2022) [18] used ground-based LiDAR stations configured around trees with an integrated computational virtual measurement approach to estimate tree diameters, obtaining an RMSE of 1.02 cm. However, these approaches must be carried out offline after data collection has concluded, which potentially limits utility in field inventories because potential problems cannot be identified while still at the field site.
In terms of real-time mobile sensors, Tatsumi et al. (2022) [13] developed a mobile phone-based LiDAR scanning approach that measures tree diameters through real-time instance segmentation and circle fitting, finding a strong agreement (R2 = 0.96) between LiDAR-based and manual measurements. However, the LiDAR hardware required for this application is only available on iPhones from 2020 onwards, which prohibits the use of the approach on older mobile phone models, which make up the majority of mobile devices in most areas of the world. Fan et al. (2019) [10] developed an algorithm based on Simultaneous Localization and Mapping (SLAM; [19]) applied to a Time of Flight (TOF) camera that uses infrared light in order to estimate tree diameters. Their results suggest a relative RMSE of 1.26 cm, or 6.4%. Although promising, this approach requires an infrared light source, which is not typically included with mobile phone camera units. Holcomb et al. (2023) [14] developed an algorithm that uses LiDAR and camera data in order to estimate tree diameter via segmentation, filtering, depth estimation, and trunk boundary identification. The approach produced an RMSE of 3.7 cm and an R2 of 0.97 when evaluated against manually measured diameters and has the advantage of adequate performance, even in occluded conditions.
Each of the studies described in this section has either relied on Light Detection and Ranging (LiDAR) sensors (e.g., [12,13,14]), infrared sensors [10], or offline post-processing of images or point clouds [11] in order to determine tree diameter. Because most smartphones currently being used are not equipped with LiDAR sensors, these approaches cannot be readily applied, effectively limiting field applications in most areas of the world.
Recent advances in computer vision and digital photogrammetry have made it possible to easily apply the SLAM algorithm [19] with exclusively optical data in order to create a three-dimensional map and accurately measure distances from a series of images or video streams. Notably, the technique does not require the use of LiDAR, which potentially permits broad application across mobile phones, including the use of older smartphone models (i.e., those not equipped with LiDAR sensors) to conduct tree inventories. However, the accuracy and measurement uncertainties associated with such an approach are still not well understood, which currently limits the practical use of distance measurement via SLAM on mobile phones as suitable substitutes for traditional forestry approaches.

1.2. Study Goals

In this study, we present a new approach to estimating tree diameter using optical SLAM and user-specified anchor points, which permits the use of most existing smartphones to obtain accurate estimates of tree diameter. In order to determine the efficacy of measurements made using the developed approach, we compare estimates of diameter measured via a mobile phone application (on three iPhone models) to estimates of diameter acquired using a measuring tape, the standard method of measurement in forest inventories. This comparison includes a detailed statistical analysis of different species, including the variance among measurements collected through the mobile application by different users, as well as through traditional approaches.

2. Methods

Here, we describe the phone application, measurements collected, field sampling campaigns, and statistical analyses performed to assess the fidelity of the proposed approach to estimate tree diameter via mobile phones.

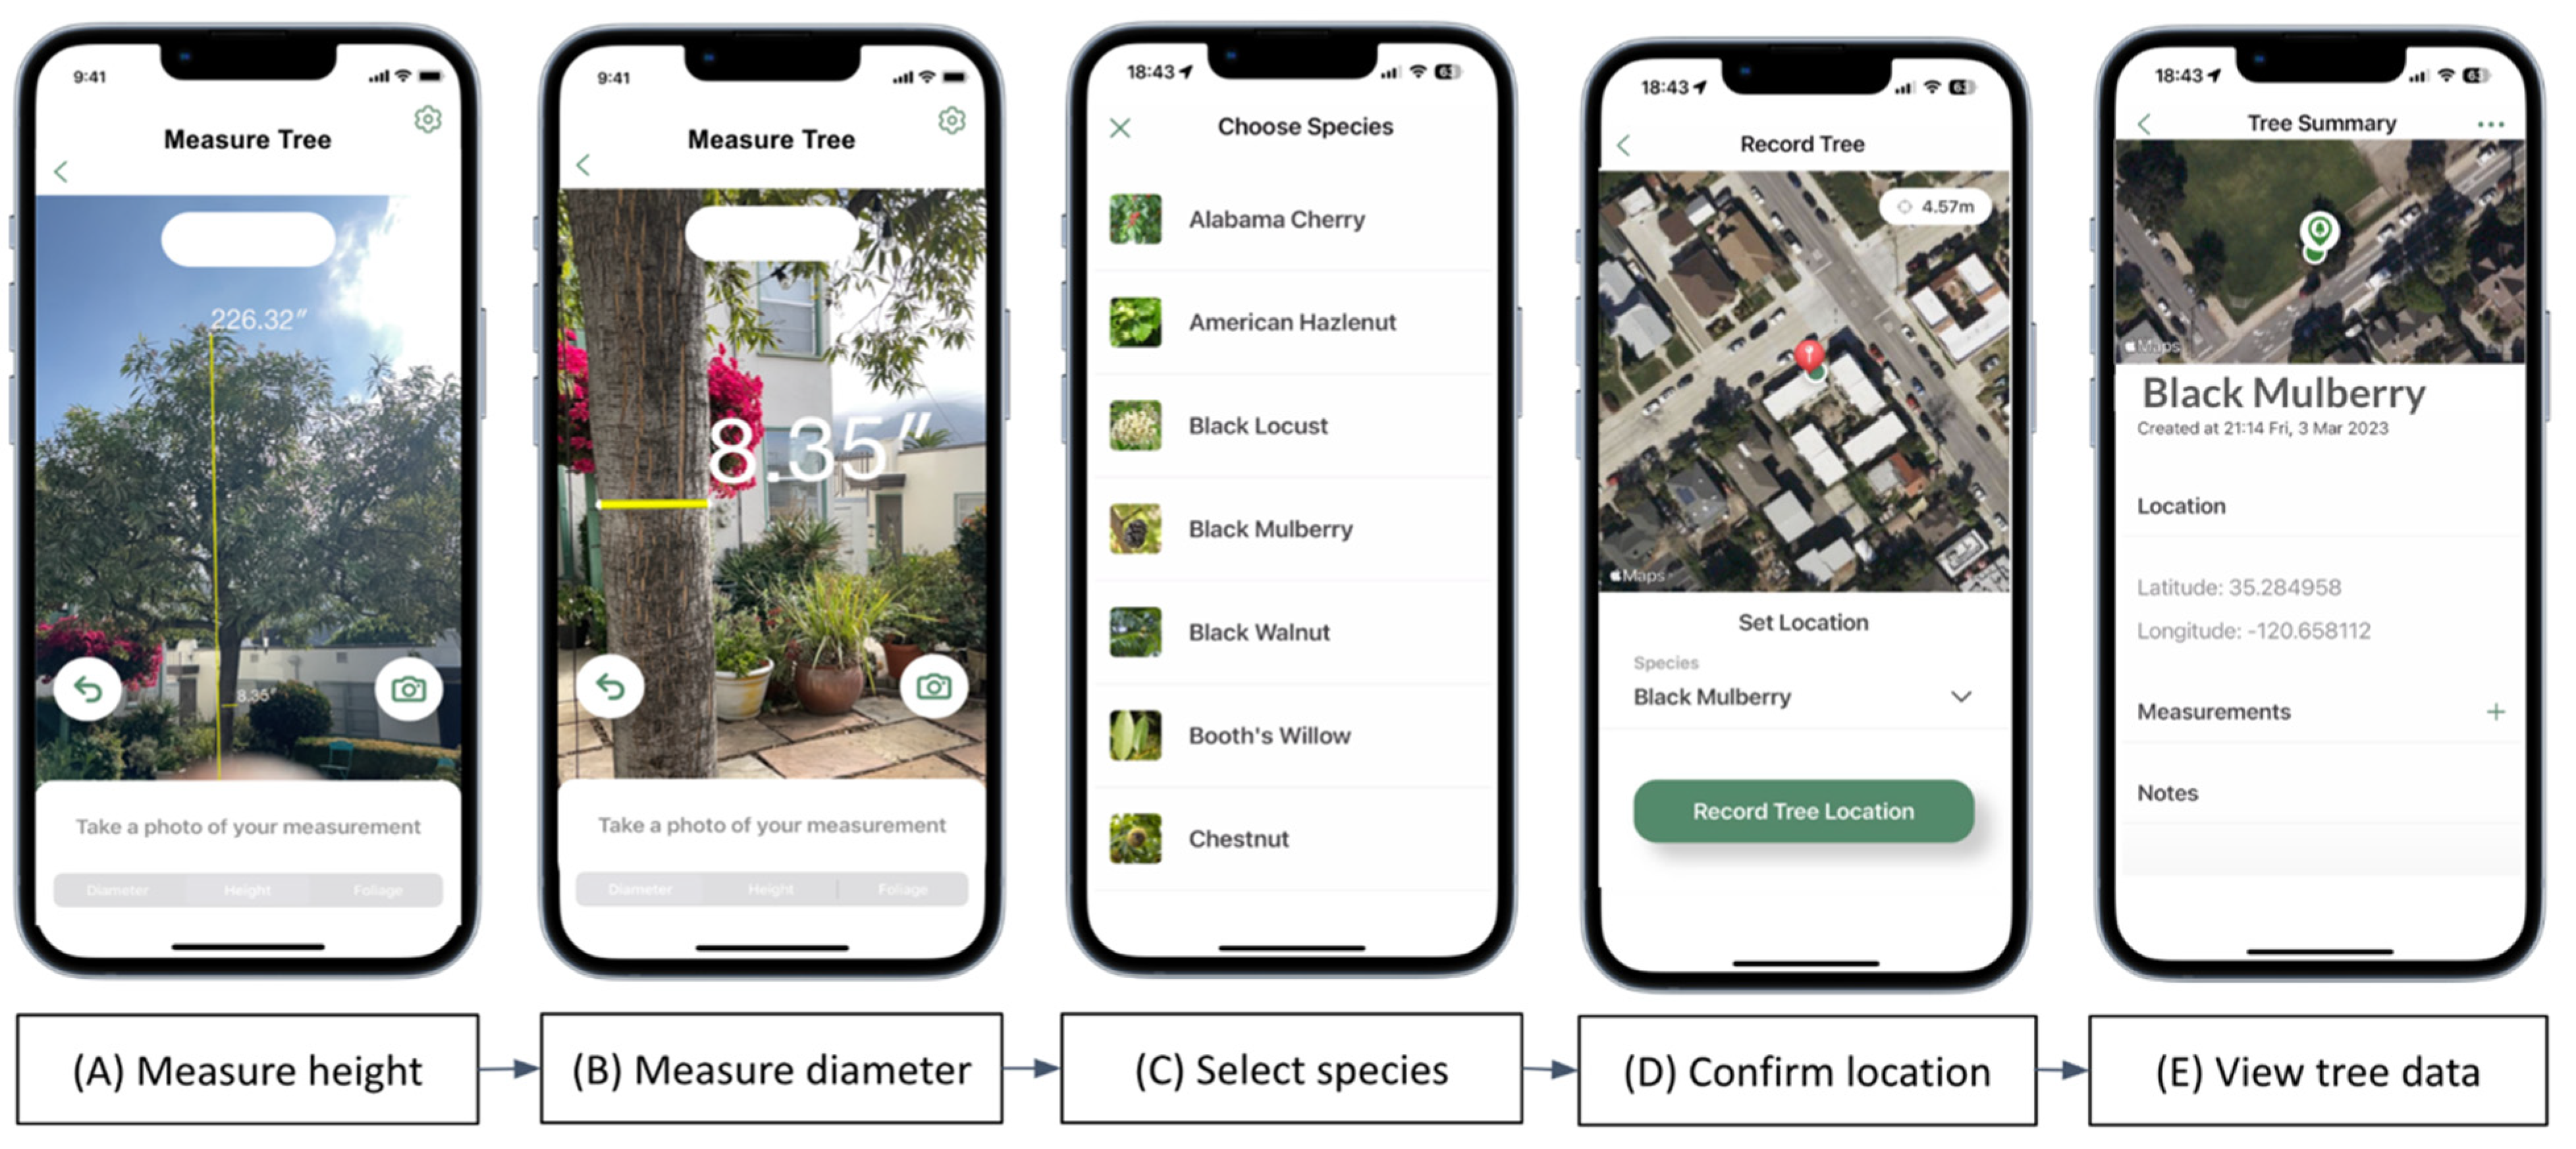
2.1. Description of Mobile Phone Application

The Working Trees phone application prompts a user to record measurements of tree diameter (at 1.3 m height) using a phone’s camera and SLAM photogrammetry. Beyond measurement, the application provides an interface to establish sampling plots, view sample locations on an interactive map (including species, images, timestamps, and units of sampled trees), and export data collected from multiple phones via an application programming interface (API).
The application currently runs on Apple iOS; an Android operating system version is currently in development. The iOS version (available on the Apple App Store at: https://apps.apple.com/us/app/working-trees/id1621922176 (accessed on 2 September 2023) uses the ARKit library (short for Augmented Reality kit, see: https://developer.apple.com/documentation/arkit (accessed on 2 September 2023)), an open source software library which provides image processing and computer vision functionality for iOS devices. Specifically, within ARKit, the application uses the SLAM algorithm; images from the camera sensor are used in conjunction with data from the gyroscope and accelerometer to model surfaces, and ray casting is used to measure distances. Importantly, ARKit does not require LiDAR, thus permitting use of older phone models that use cameras exclusively, as well as newer models which can make use of LiDAR sensors.
Distance can be determined via the application through a three-step process. (1) Objects within the camera’s field of view are identified and tracked from frame to frame, (2) Visual odometry [20] is used to determine movement of the camera from one image to the next, and loop closure is used to estimate the location of the camera with respect to the objects in the field of view (pose estimation). This involves using sensor data from the gyroscope and the accelerometer to determine the location of the camera relative to the tracked objects through optical flow [21]. (3) SLAM [19] is then used to construct a 3-dimensional surface based on the tracked objects and known imaging geometries. Distances can then be measured by placing anchor points to mark the ‘start’ and ‘end’ coordinates on a surface and an underlying ray casting algorithm (e.g., [22]) to determine distance (see Figure 1 for examples; a demo video is available at: https://youtu.be/n0P-UASCf-c (accessed on 2 September 2023)).
The analysis described herein focuses on the measurements of tree diameter because diameter is the most important property recorded in tree inventories. However, the mobile application developed for this study facilitates the collection of various ancillary data: (1) height of tree at sampling time; (2) location in latitude and longitude coordinates; (3) species of tree being measured (user-selected from a menu of species before measurement); (4) date and time of measurement; and (5) images of the height and diameter measurements. A follow-up study will assess the efficacy of tree height measurements collected using the application. The next section describes the field trials conducted to evaluate the mobile phone-based diameter measurements.

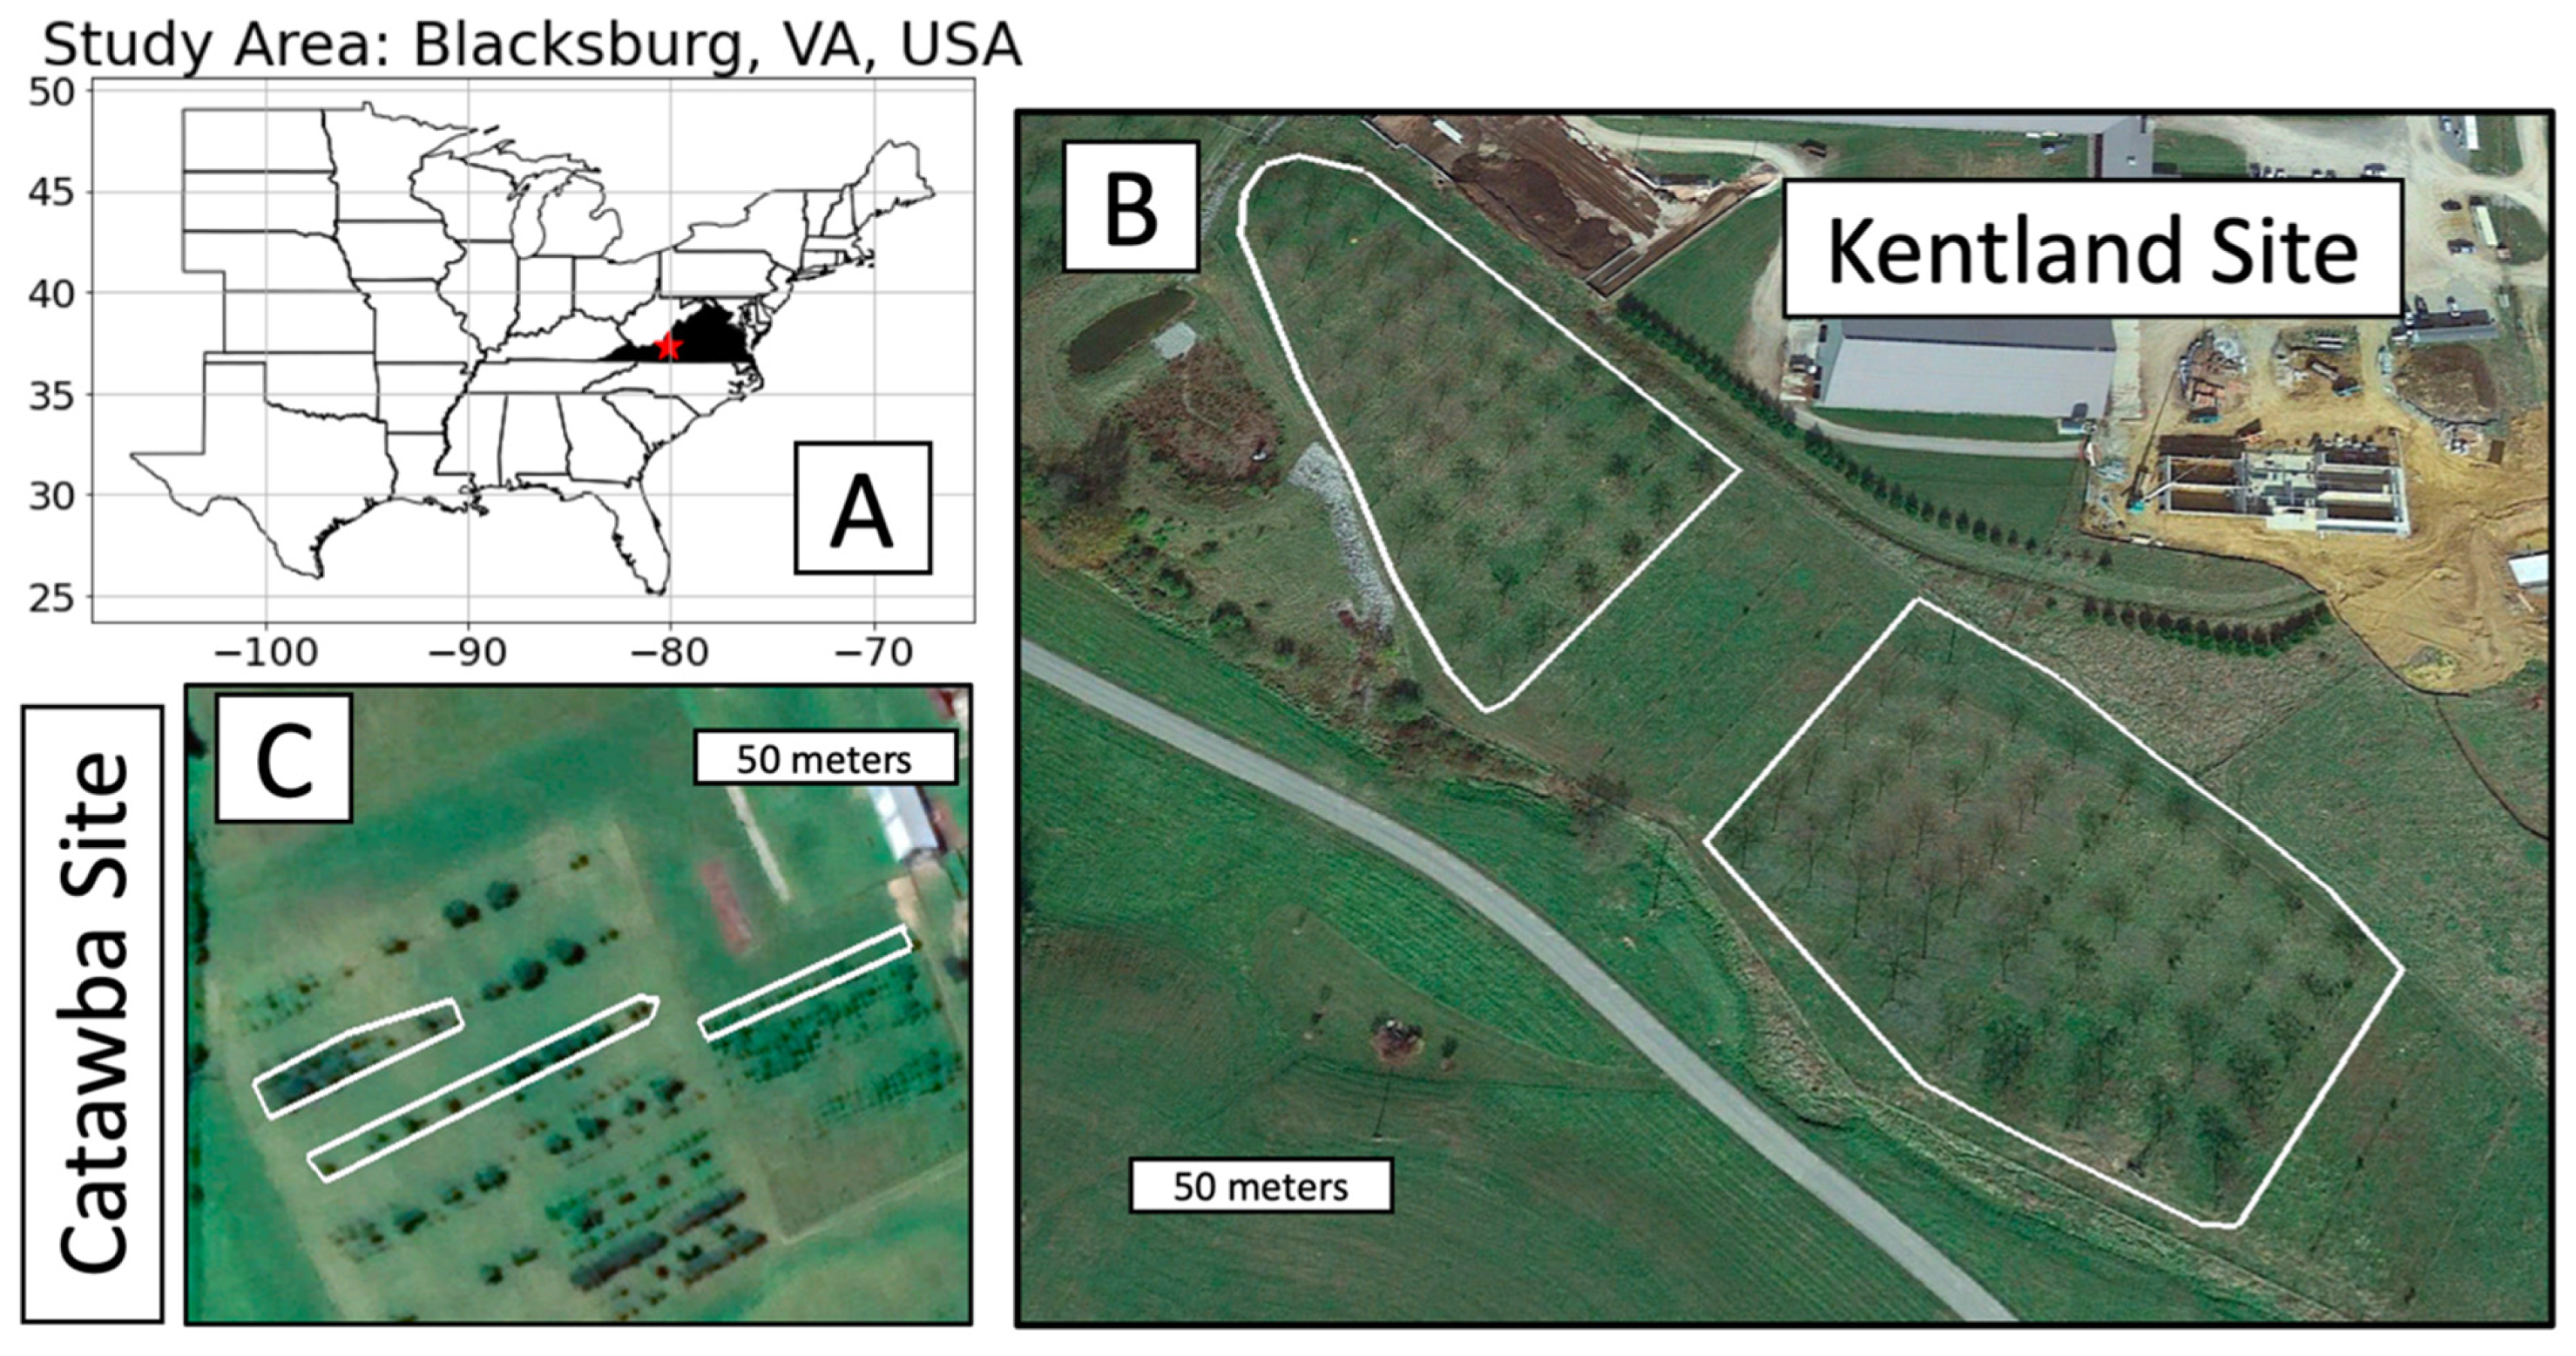
2.2. Description of Field Trials

In order to assess the fidelity of the mobile application to accurately measure tree diameter, two double-blind sampling campaigns were conducted at research farms operated by Virginia Tech in May and October of 2022. Digital measurements of diameter were collected using the mobile application, while manual measurements of diameter were obtained using a tape measure. Three individuals acquired manual measurements, three individuals used the mobile application, and one individual acquired both manual and mobile phone-based measurements. The iPhones used to collect tree diameter measurements were an iPhone 8+, an iPhone 12 mini, and an iPhone 13 pro.
The first field trial was undertaken at the Catawba Sustainability Center, Catawba, VA (Figure 2), on 5 May 2022. The application was tested on 20 Black Walnuts (Juglans nigra L.), 14 Black Locusts (Robinia pseudoacacia L.), and 13 Pitch–Loblolly Pines (Pinus rigida x taeda L.), all aged 7 years and planted in rows. During the first field trial, 2 individuals recorded diameter measurements of 47 trees using tape measures, while 1 individual used the mobile application to measure the diameter and height of the same set of 47 trees.
The second field trial was performed at a long-term agroforestry research site at Kentland Farm (Blacksburg, VA, USA) between 15 October and 31 October 2022. In the study, measures were made on 58 Honey Locust (Gleditsia triacanthos L.) and 50 Black Walnut trees. Trees were 27 years old, planted in ~13 m × ~13 m configuration, and boles had been pruned to facilitate site access with farm equipment and livestock and to support light reaching the understory. During the second field trial, one individual acquired both manual and phone-based measurements, while one other individual acquired phone-based measurements.
Tree diameter was defined at 1.3 m. While not strictly enforced at the time of sampling, each participant in the field trials was instructed to measure each tree at breast height for relative consistency. This inconsistency is unlikely to have a substantial effect on the results—Chojnacky et al. (2013) [23] showed that in most cases, tree diameter varies relatively little near where diameter at breast height is typically measured. For the case of a split tree trunk (approximately 3 total trees), diameter was measured directly below the split using both manual and phone-based methods. For every tree, measurements were acquired using a diameter tape measure and the mobile phone application.
Measurements were collected independently and double-blind, without the individuals sharing knowledge of the results from the other measurement approach. During the second field trial at Kentland, all trees were measured at least twice, using both the manual and phone-based approach, but only 47 trees were measured a third time due to the time constraints of field researchers. Repeated measurements collected using both the mobile application and manual approaches allowed for an analysis of uncertainty for each tree measured multiple times using both approaches, as well as an assessment of uncertainty associated with different users of the mobile application. These analyses are described in detail in Section 3.3.

Preprocessing of Field Data

In order to utilize all of the collected data from the Kentland site, we constructed all unique combinations of manual and phone-based measurements for each tree. This was performed as such because (as previously noted) all trees at Kentland were measured exactly twice manually and either two or three times using the mobile application (47 trees measured thrice, 61 trees measured twice). We created all pairs of data for each individual tree using the following procedure: For trees that were measured twice manually and twice using the mobile application, there are four possible combinations of data (Nmanual × Nphone = 2 × 2 = 4). Similarly, there were six combinations for trees measured thrice through the mobile application (Nmanual × Nphone = 2 × 3 = 6). Because 47 trees were measured thrice using the phone application, while 61 were only measured twice, iterating through all combinations provided a total of 567 samples ([47 × 6] + [61 × 4]). However, because some diameter measurements collected for a given tree matched exactly (i.e., there was no difference between the first and second manual diameter measurements for that tree, which produces duplicates when making pairs), we eliminated duplicate points from the dataset. This final step in the procedure resulted in 367 paired samples describing the 108 total trees at the Kentland site. When combined with the data collected at Catawba (measured only once using each method), the total size of paired data describing both manual and phone-based measurements was 414 samples.

2.3. Statistical Analyses

To assess the accuracy of the phone-based approach, six metrics were calculated to compare the phone-based measurements to manual measurements. These are described below. In this section, the manual measurements are referred to as the ‘true values’, while the phone-based measurements are the ‘predicted values’.
Mean Error (ME) was used to assess the average difference between phone-based and manual measurements:
M E = 1 n i = 1 n y i x i
where yi are the true values, xi are the predicted values, and n is the number of samples.
Mean Percent Error (MPE) is similar to ME as defined above, but expressed in percentages:
M P E = 1 n i = 1 n y i x i y i 100 %
where yi are the true values, xi are the predicted values, and n is the number of samples.
The R2 correlation coefficient measures the strength of correlation between two variables. It is defined as follows:
R 2 = i = 1 n ( y i x i ) 2 i = 1 n ( y i x - ) 2
where yi are the true values, xi are the predicted values, and y - is the mean of the true values.
Root Mean Square Error (RMSE) measures the difference in values predicted by a model or an estimator and observed values. It is defined as follows:
R M S E = i = 1 n ( y i x i ) 2 n
where yi are the true values, xi are the predicted values, and n is the number of samples.
The Concordance Correlation Coefficient (ρc) measures the degree of agreement between two variables that rate, code, or assess the same phenomenon. It is defined as follows:
ρ c = 2 p σ x σ y σ x 2 + σ y 2 + ( μ x μ y ) 2
where p is the Pearson Correlation (i.e., √R2); σx and σy are the variances of x and y, respectively; and µx and µy are the means of x and y, respectively. In general, a higher ρc denotes a stronger relationship between the data.
The Intraclass Correlation Coefficient (r) is used to assess the consistency, or conformity, of measurements made by multiple observers or methods measuring the same quantity [24]. Generally, a higher r also denotes a stronger relationship between the data. It is defined as follows:
r = 1 N s 2 i = 1 n ( x i x - ) ( y i x - )
where xi are the true values, yi are the predicted values, N is the total number of samples, and
x - = 1 2 N i = 1 n ( y i + x i )
and
s 2 = 1 2 N i = 1 n ( x i x - ) 2 + i = 1 n ( y i x - ) 2
The above metrics were computed in order to assess the level of agreement between phone-based and manual measurements of tree diameter. Table 1 shows each of the statistics for the entire set of measurements across both field trials (N = 414).

2.4. Graphical Statistical Analysis

The Bland–Altman plot, also known as the Tukey Mean Difference Plot, is a widely used graphical statistical inference tool that depicts the agreement between two quantitative measurements of the same parameter [25]. Often used in clinical trials to assess the fidelity of different assays or treatment techniques, it is suitable for comparing estimates of diameter derived from the manual approach with measurements made using the phone application.
These metrics were computed for diameter in order to assess the level of agreement between phone-based and manual measurements for the entire population (N = 414) of measurements across both field trials.

2.5. Analysis of Uncertainty among Users and Species

Repeated measurements of 108 trees were collected using both a tape measure and the phone application (described in Section 2.2). This allowed for an analysis of uncertainty both at the tree level (capturing the uncertainty in using each approach to measure a given tree) as well as the user level (capturing the uncertainty between different users measuring the same subsets of trees). The tree-specific uncertainty analysis evaluated the per-tree mean and standard deviation produced by both the application-based and manual forms of measurement. The results are depicted as a scatterplot with error bars that correspond to standard deviations. The user-specific uncertainty analysis evaluated the population means and standard deviations of each tree species for each separate user of the application and for each of the separate manual measurements collected.

Statistical Tests

For the 108 trees located at the Kentland site, where multiple measurements of diameter were available from both the manual and mobile approach, we applied a number of statistical tests in order to compare the manually collected measurements with the phone-based measurements. These included (1) a paired T-Test to test the null hypothesis that the mean between two groups is equal; (2) Analysis of Variance (ANOVA), which includes computation of an F statistic in order to test the null hypothesis that samples in all groups are drawn from populations with the same mean values; and (3) Levene’s test [26], which is used to test the null hypothesis that two populations have equal variances. All statistical tests were implemented using the stats module of the scipy package [27] in the Python programming language.

3. Results and Discussion

The metrics described in the Methods section were computed across both field trials and for all species in the study areas in order to assess the level of agreement between mobile phone-based and manual measurements of tree diameter. The results of the statistical analysis and species-level analysis are described in Section 3.1; the results of graphical statistical tests are described in Section 3.2; and the results of the user-level uncertainty analysis are described in Section 3.3. Limitations of the approach are discussed in Section 3.4, while the implications of the study and the goals of follow-up studies are presented in Section 3.5.

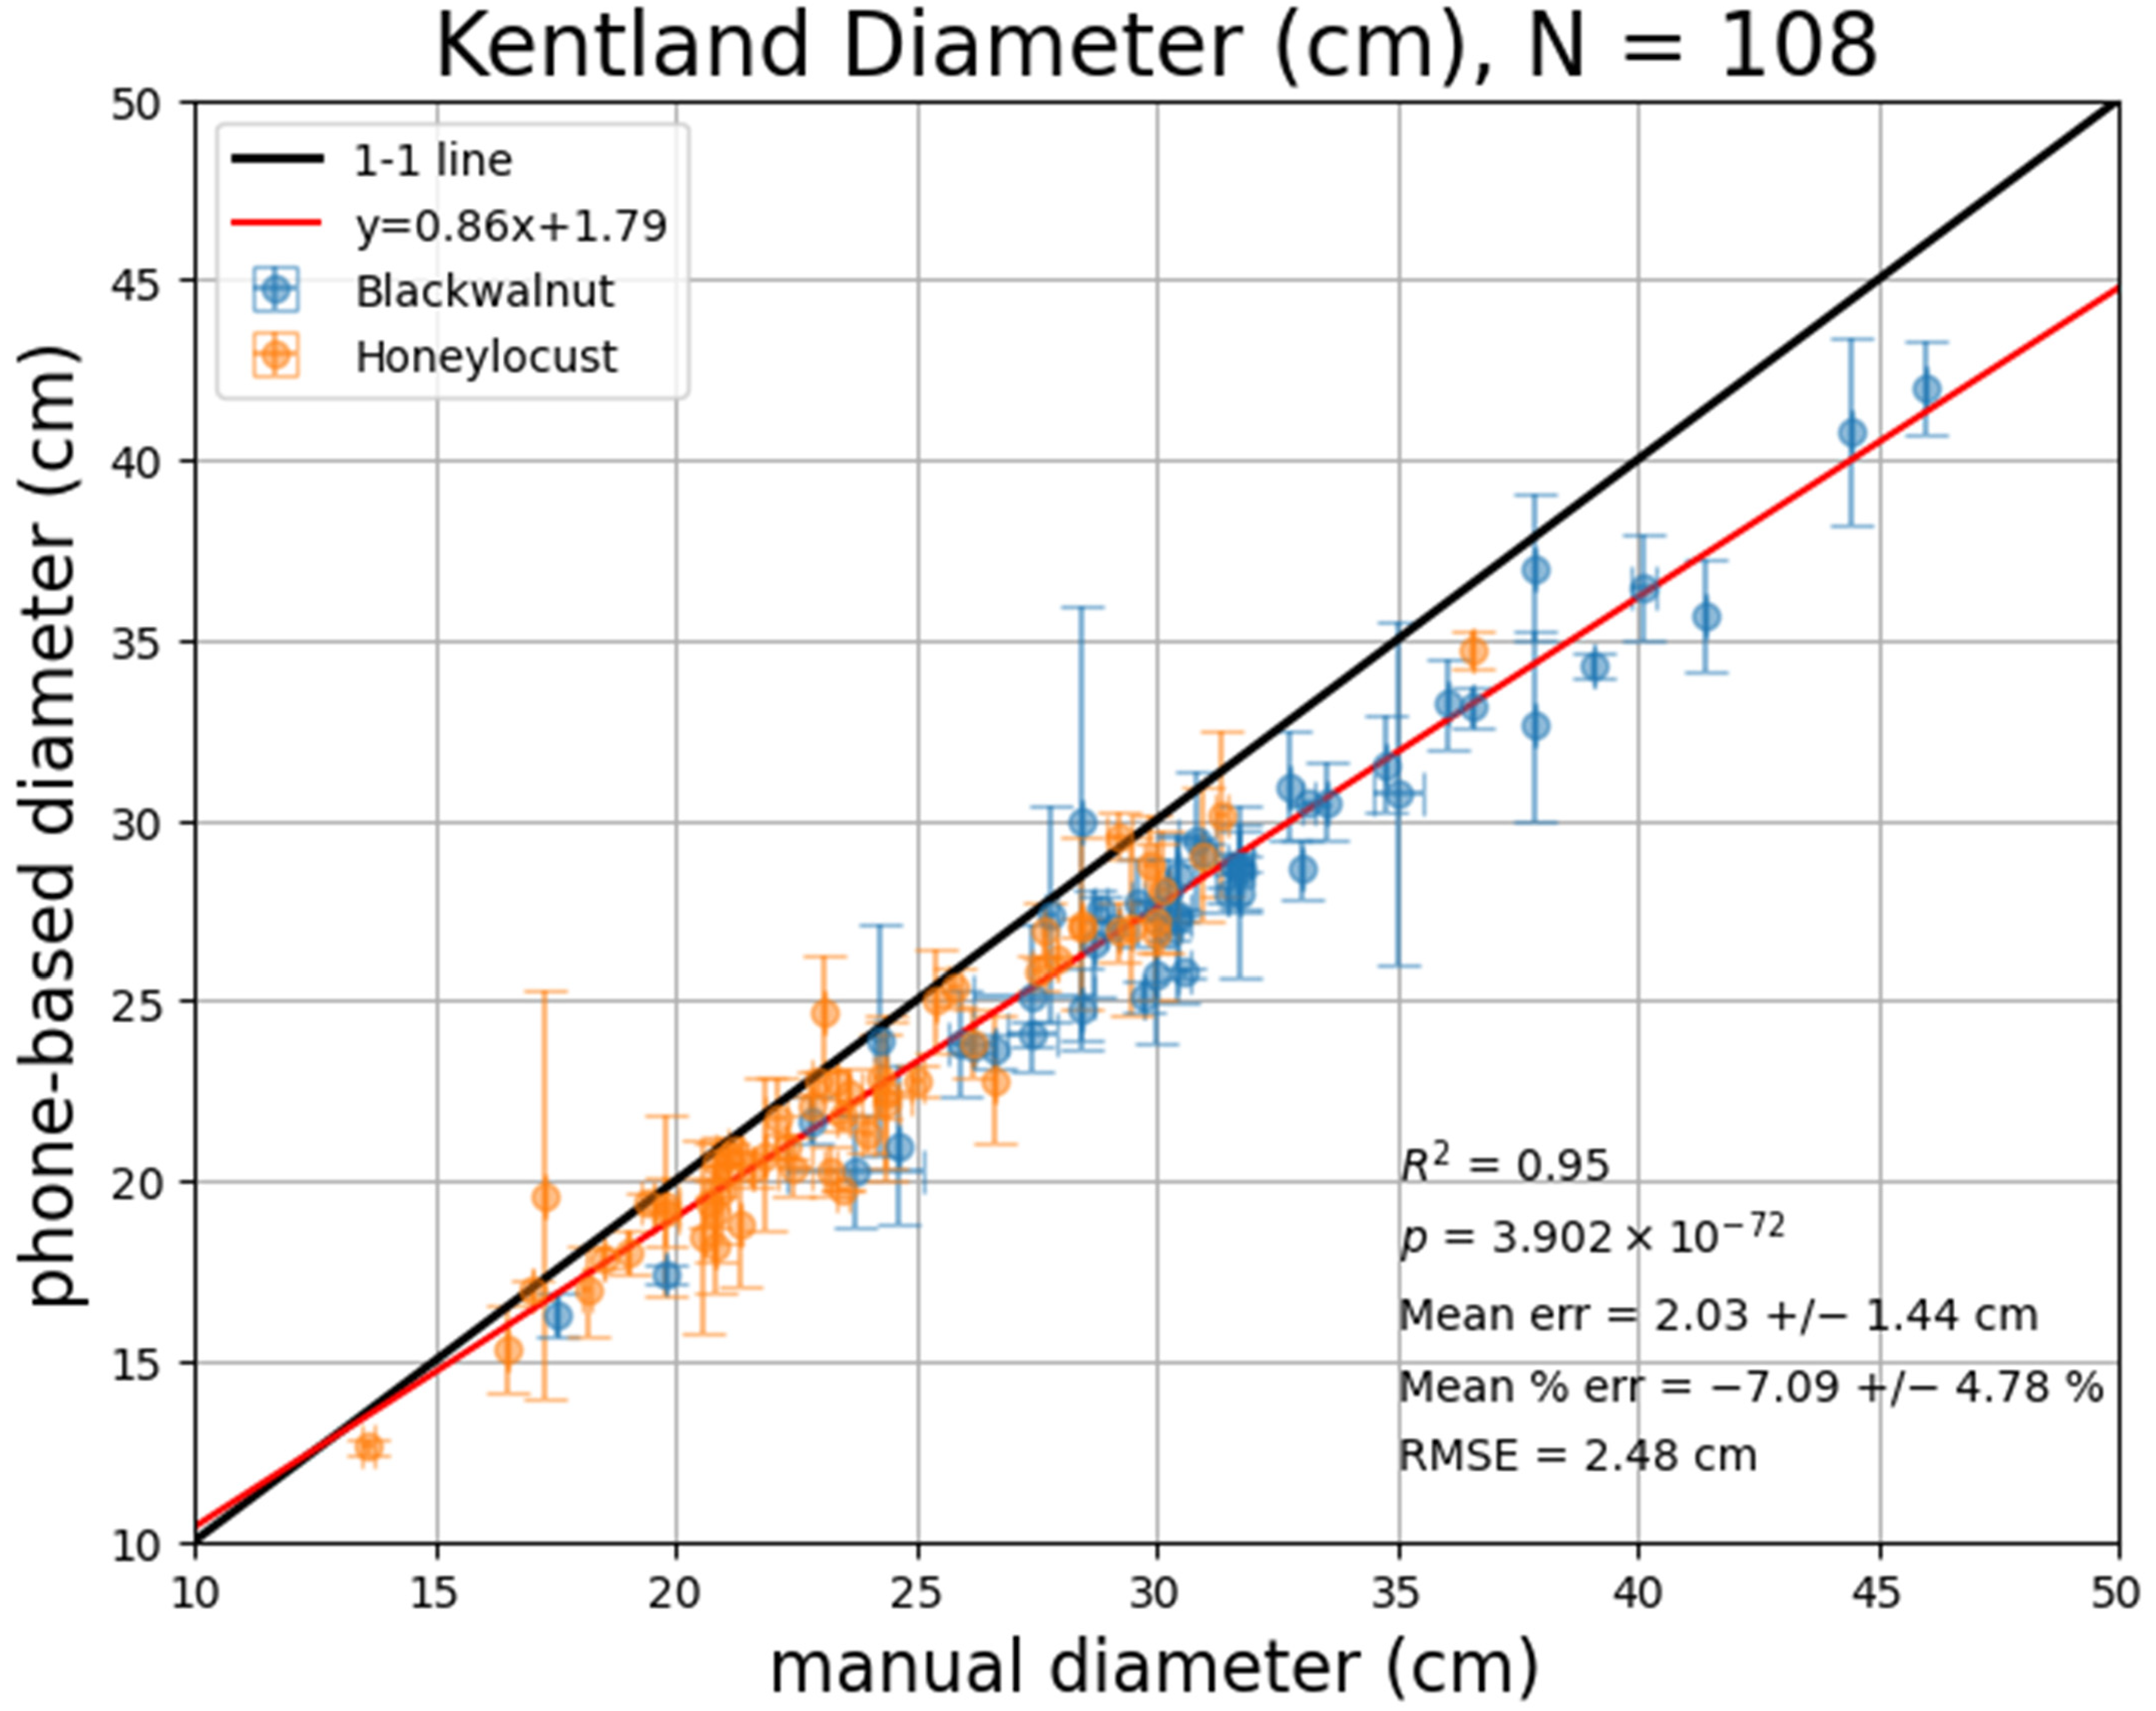
3.1. Results of Statistical Analysis and Species-Level Analysis

Across all species, the mobile app underpredicted diameter; the mean error averaged 1.9 cm, which represented an underestimate of about 8.3% (Table 1). The greatest underprediction (−2.45 cm) occurred with Black Walnut trees. The overall RMSE (2.71 cm) was comparable to previous studies: Holcomb et al. (2023) [14] reported an overall RMSE of 3.7 cm and a RMSE of 2.7 cm for trunks under 100 cm in diameter (all trunks in this study). Tatsumi et al. (2022) [13] reported an RMSE of 2.27 cm using a LiDAR-enabled mobile phone and iPad, while Fan et al. (2019) [10] reported an RMSE of 1.26 cm with an offline post-processing approach.
A strong correlation (R2 = 0.95) between phone-based and manual tree diameter measurements (Figure 3) was comparable to R2 values reported in past studies that utilized LiDAR or offline postprocessing (e.g., [13,14]). The line of best fit (shown in red in Figure 3; equation shown in legend) and slope of 0.91 also suggest that the phone-based approach underpredicts the true mean diameter for most trees (a slope of 1 would suggest a strong prediction, while a slope of >1 would suggest an overprediction). The analysis included trees with diameters between 0 and 50 cm.
Lower magnitudes of percent errors were observed with Honey Locust and Black Walnut trees (Figure 4). Larger errors with Black Locust and Pitch–Loblolly pine likely reflect the much smaller sample sizes. The variability among estimates of diameter for each tree species was further evaluated through analysis of histograms (Figure 5). Similar distributions for the manual and phone-based measurements again suggest that the mean diameter estimated with the phone application is comparable but slightly lower than the mean diameter estimated through manual measurements.

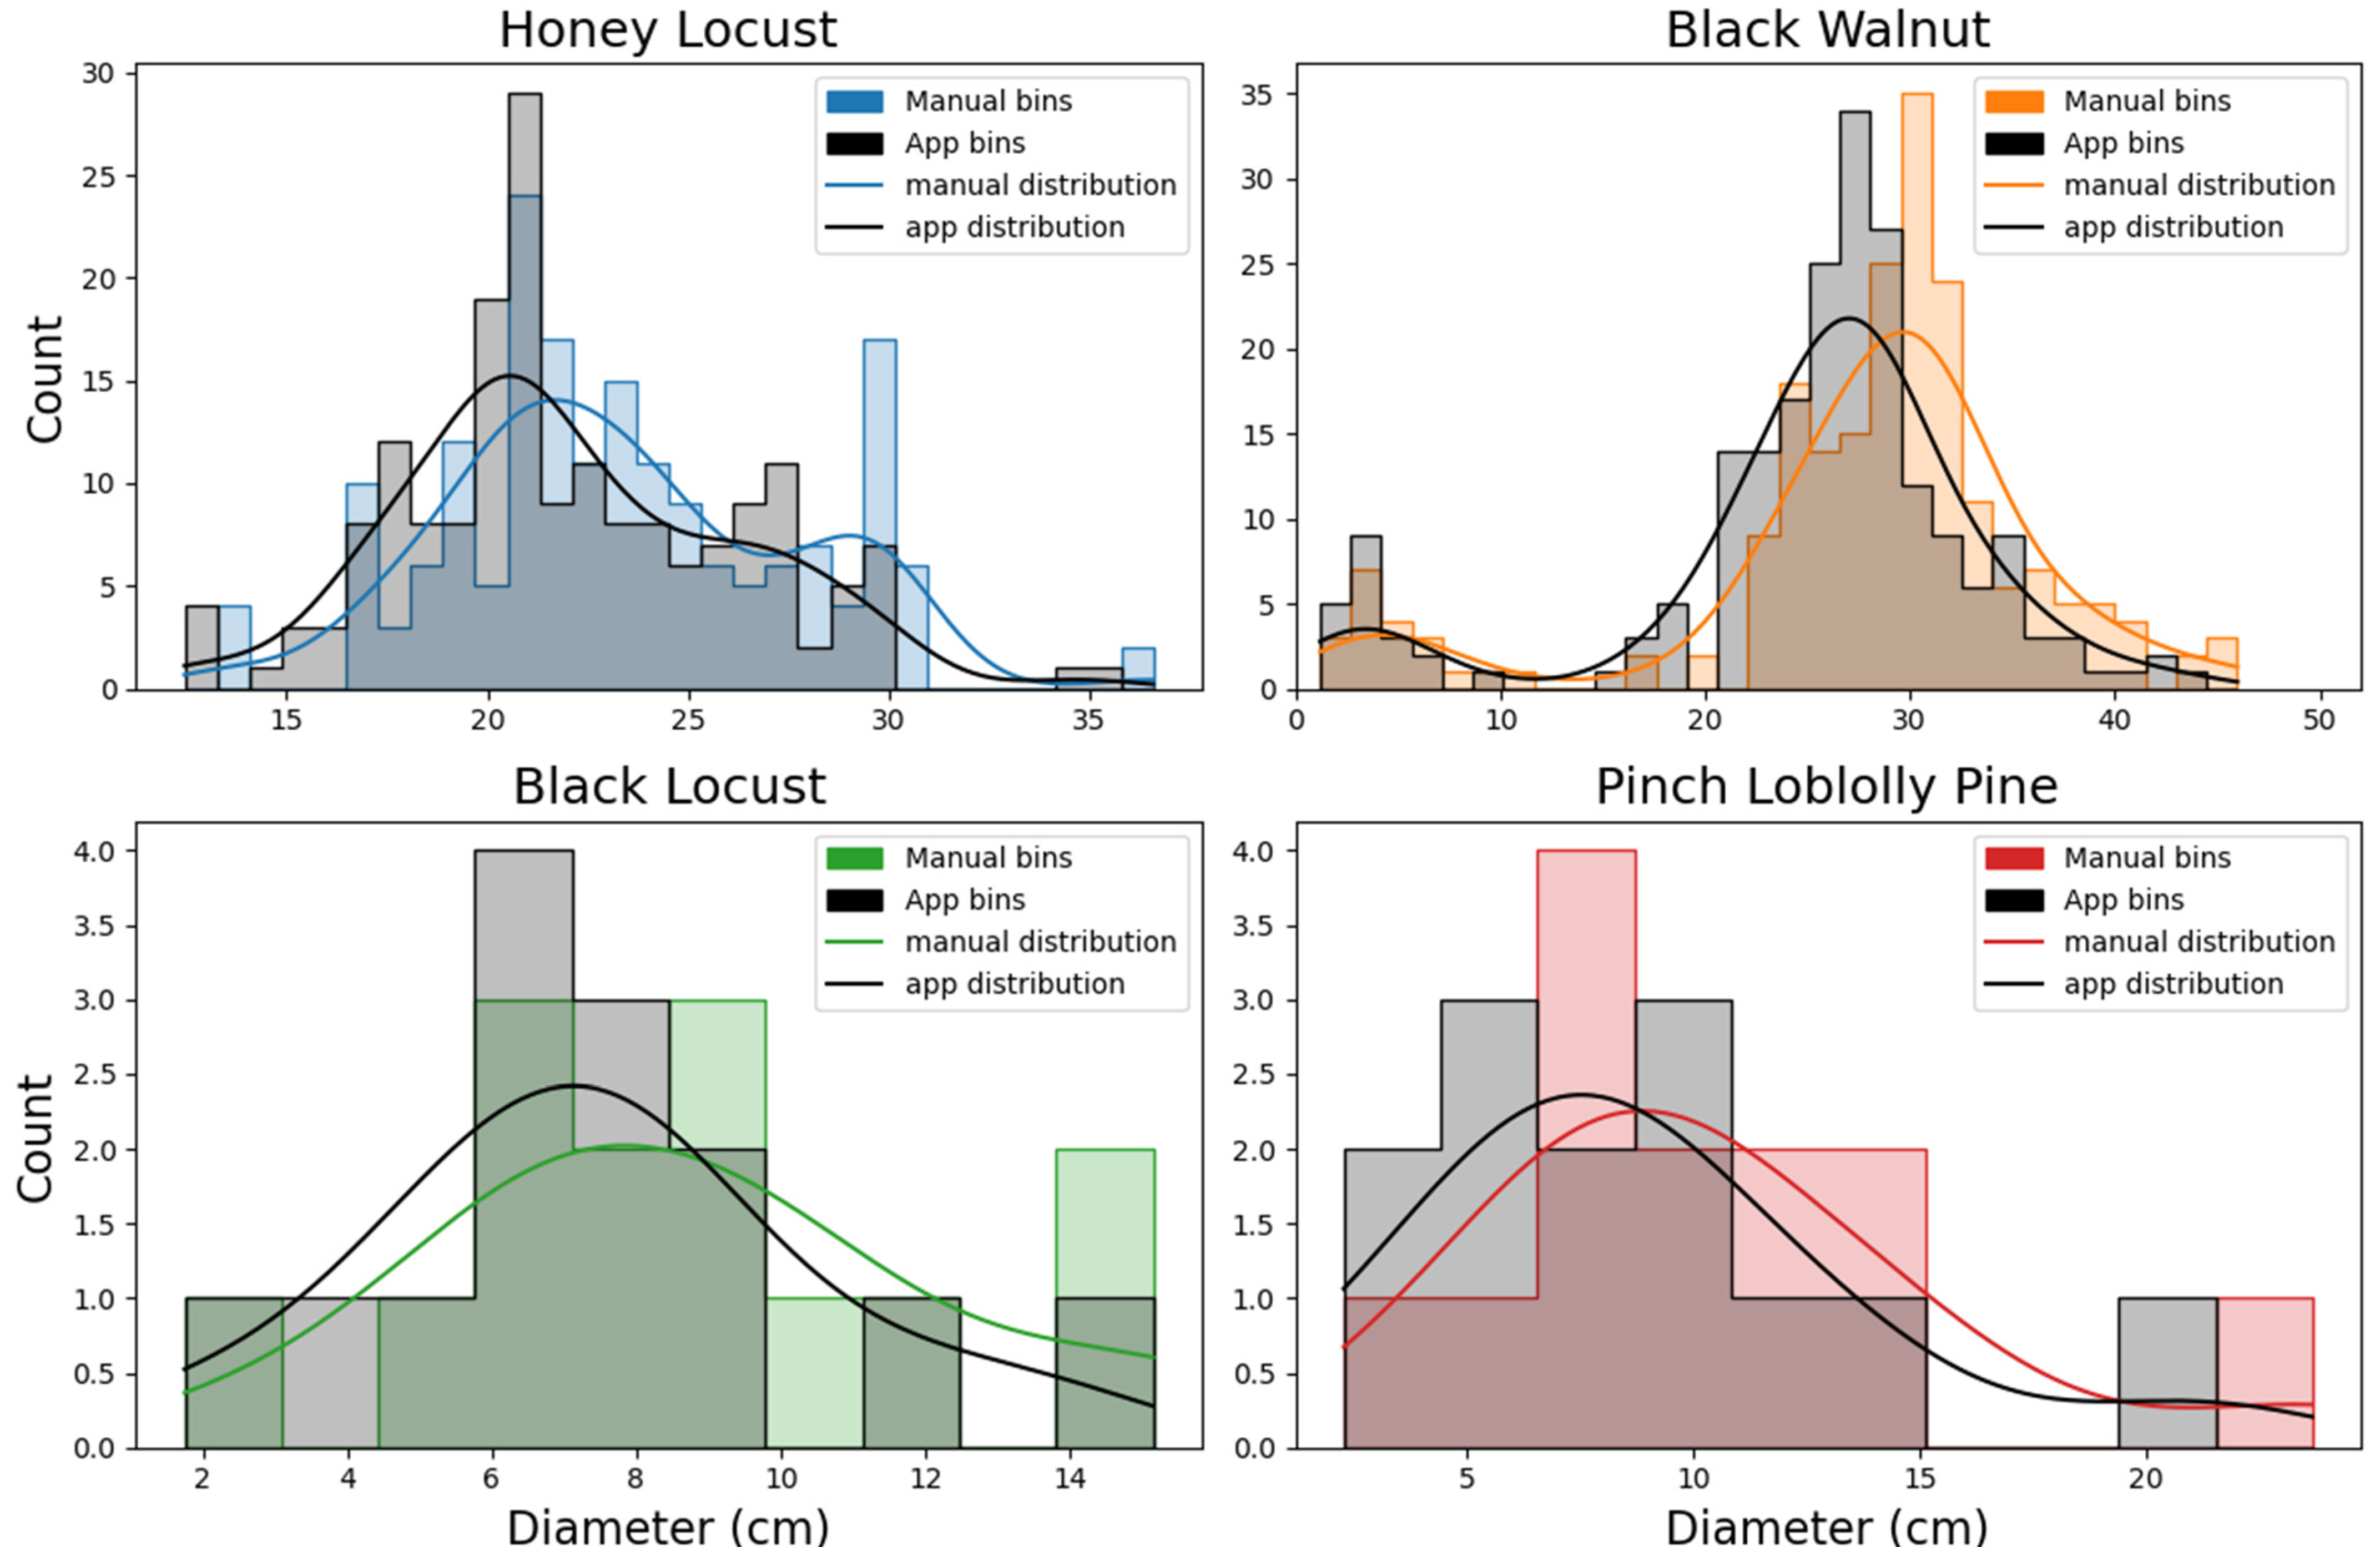
3.2. Graphical Statistical Analysis

The Bland–Altman plot (Figure 6) provides a different means of visualizing the comparison, showing more than 98% of the collected paired data fell within the 2 standard deviation confidence range. The application tends to underestimate diameter by 1.9 cm, and the results suggest a weak underestimation trend as diameter increases, especially for Black Walnuts (shown in blue).

3.3. Results of User and Species-Uncertainty Analysis

The collection of repeat measurements of individual trees allowed us to assess the user-specific uncertainty associated with both the manual and phone-based measurements. The results of repeated surveys for 108 trees at Kentland Farm are shown in Figure 7 and Figure 8. Figure 7 shows a scatterplot with the manual measurements on the x-axis and the phone-based measurements on the y-axis. Each point represents the mean of all measurements collected using multiple measurements from the phone application and a tape measure. The vertical error bars denote the phone-based standard deviation, while the horizontal error bars (which are so small they are difficult to detect) denote the manual standard deviation. The uncertainty associated with phone-based measurements was larger than that of manual measurements (Figure 7), but the phone-based approach still provided a strong level of agreement (R2 = 0.95; RMSE = 2.48 cm).
Figure 8 shows violin plots of the mean diameter (y-axis) for each species (x-axis), color-coded by each user who participated in the Kentland study. In the study, one user acquired measurements of each tree twice using the mobile application. These repeated measurements are termed ‘User 1’ and ‘User 1 repeat’, and those repeat distributions were nearly identical, indicating high repeatability within users, both for Honey Locusts and Black Walnuts. For both sets of phone-based measurements acquired by User 1, the diameter was slightly underestimated during both sampling sessions. User 2 tended to underestimate the diameter for both species more significantly, although this may be an effect of lower sample size.
Table 2 shows the results of the statistical tests performed on the repeat-measurement data acquired at Kentland. The values in each cell depict the results of the statistical tests applied to the row and column combination, with p values listed in parentheses. Table 2A shows the results of a paired T test. Because the T statistic in each case is larger in magnitude than the critical T value (1.35 < Tcrit < 1.65), and the p values are < 0.05, the paired T test suggests that we fail to reject the null hypothesis that there is no difference between the means of the two samples at a 95% confidence level.
A significant, negative T statistic in each case shows that the mean of the samples measured by users of the mobile application is lower compared to the mean of the samples measured manually. Table 2B shows the results from the one-way ANOVA, which tests the null hypothesis that samples in both groups are drawn from populations with the same mean values. The F statistics in the test are larger than the critical values for a 95% confidence interval (1.37 < Fcrit < 1.55), and the p values are all <0.05, which suggests that we can reject the null hypothesis that samples in both groups are drawn from populations with the same mean values. These results intuitively make sense because we observe in the data that the mean diameter values determined using the mobile application are generally lower than those produced by manual measurements. This supports the finding that the sample means and the means of the two underlying distributions are also not the same.
Levene’s test produced a low test statistic with high p values (all p > 0.2), meaning that we cannot reject the null hypothesis that the two populations have equal variances. This again supports our finding that while the means of mobile phone-based measurements and manual measurements of diameter are significantly different, the distribution of values about those means is similar (as presented in Figure 5).

3.4. Limitations and Assumptions

While the approach presented in this paper shows promising results for accurately estimating tree diameter using sensors on mobile phones, it is not without limitations. First and foremost, the mobile phone-based estimates of diameter have a slight negative bias relative to manual estimates, as indicated by regression slopes <1 (Figure 3 and Figure 7), as well as the mean error and mean percent error results shown in Table 1. While the conservative bias can be a positive attribute in the context of estimating carbon sequestration when reporting nature-based carbon projects, it may be alleviated by applying a calibration factor to mobile phone-based measurements, something that will be explored in future work. One potential source of the negative bias could be the lack of strict enforcement of the diameter acquired at a height of 1.3 m (~4 ft). While the diameter is unlikely to vary substantially between where manual and phone-based data were collected, this is nevertheless a source of uncertainty.
Another important consideration is that the approach is not fully algorithmic—it still requires a human to subjectively place anchor points on the ‘start’ and ‘end’ locations of a tree trunk (see Figure 1 for an example). Because the mobile application also stores images of the line segments that are drawn on the trees, they can be visually inspected for quality, though no quality control was undertaken for the data in this study. Future work will compare algorithmic estimation of tree diameter from the acquired images (using, for example, canny edge detection or segmentation to determine the edges of the trunk in an image) to the diameters captured by users placing anchor points, as was performed in this study.
Context is another limitation of this study. The mobile application was tested in an agroforestry research site. Closed-canopy forests with a dense understory can present challenging conditions related to surface detection and anchor point placement. In addition to a dense understory and canopies, the detection of surfaces through the SLAM algorithm and the measurement of distances through ray casting can also be affected by various conditions, such as fog/haze and a low sun angle. Moreover, homogeneous surfaces (uncommon in natural settings) can require a user to point the camera at a flat surface and move the phone around until enough points are identified to create a surface. This procedure might take several seconds for a setting that is homogenous in color and texture.

3.5. Discussion of Results and Future Work

The results of the field trials suggest a strong ability to accurately measure tree diameter through the use of the mobile phone application, as validated against manual measurements for each of the species being measured (Table 1; Figure 2, Figure 3 and Figure 4). Many widely cited allometric equations rely exclusively on the use of diameter measurements (e.g., [23,28,29]) to estimate standing biomass. Strong agreement between the phone application and traditional measures (R2 > 0.95; p < 0.01; RMSE = 2.71 cm; concordance correlation > 0.9; Intraclass Correlation > 0.9) indicate this technology can provide reasonable, rapid, and conservative estimates of woody biomass in orchard systems (Figure 3, Figure 4, Figure 5 and Figure 6). Additionally, the phone application has the advantage of automatically logging measurements (as well as images and metadata) to an online database, saving time that technicians would use for data entry and preventing transcription errors. These data can also be used for post hoc quality control and removal of any erroneous measurements.
The results suggest that diameter measurements estimated with the mobile application vary more than those gathered with a tape measure (Figure 7 and Figure 8), but this may also be user-dependent. For example, Figure 8 demonstrates that a single user who acquired fewer measurements with the mobile application significantly underestimated diameter relative to both another mobile user as well as to manual diameter measurements. These findings are corroborated by the results of statistical tests (Table 2) that suggest that the means of manual and mobile phone-based measurements are different (with mobile measurements slightly underpredicting the true diameter), but their distributions are similar. More analysis of the per-user accuracy and uncertainties is needed in order to confidently adopt any sensing technology for long-term use.
Ongoing and future work seeks to: (1) develop the approach for android operating systems to permit use on more mobile phones; (2) accommodate common edge cases, such as split trunks, sloping ground, and leaning, curved, or buttressed trees; (3) better understand the limitations of digital measurements, including the influence of different users of the application, lighting and shadows, foliage, seasonality, and other factors; (4) algorithmically identify tree diameter (e.g., as performed in [14]) in order to compare data collected by different users of the application, and (5) develop, refine, and test the capabilities of mobile-based photogrammetric techniques to estimate tree height.

4. Conclusions

Accurate measurements of tree diameter are essential for quantifying biomass stocks, determining changes in tree growth, and understanding the impacts of factors such as climate change and management practices. This study compared estimates of tree diameter collected manually (using a tape measure) to measurements collected digitally using a SLAM-enabled smartphone application. While mobile-based measurements of diameter varied more than manual measurements, the relatively low errors (mean error = 1.9 cm) and high correlation (R2 = 0.95) between mobile and manual estimates of diameter suggest that, with modifications, this system can be robust, accurate, and more time-effective than traditional measurement techniques. Widespread adoption of digital technologies for tree inventories has been limited due to (1) the requirements of LiDAR and (2) offline postprocessing. The software developed for this study does not require LiDAR or postprocessing; therefore, such an approach has the potential to be widely deployed on existing phones, which would permit fast, cheap, and accurate data collection by non-experts. This study also analyzed the uncertainty between repeat samples acquired by multiple individuals using the mobile application and multiple acquisitions of manual diameter measurements. Such an exercise is essential to validate the application for broad-scale use, but this type of work has not been widely carried out in previous studies. Although more studies are needed to better understand the context-dependent limitations and uncertainties of mobile phone sensing technology (including the time savings), mobile-enabled estimates of diameter may ultimately help facilitate widespread data collection by non-experts. This stands to improve data collection practices, increase available data, and afford a richer understanding of the environmental and management factors that influence tree growth.

Author Contributions

Conceptualization: A.A., J.F. (John Foye), S.P., E.T. and J.F. (John Fike); Data curation: A.A., J.F. (John Foye) and S.P.; Formal analysis: A.A.; Funding acquisition: A.A., J.F. (John Foye) and J.F. (John Fike); Investigation: A.A.; Methodology: A.A., S.P. and E.T.; Project administration: A.A., J.F. (John Foye), S.P. and J.F. (John Fike); Resources: A.A., J.F. (John Foye), S.P. and J.F. (John Fike); Software: A.A.; Supervision: S.P., J.F. (John Fike); Validation: A.A.; Visualization: A.A.; Writing—original draft: A.A.; Writing—review and editing: A.A., J.F. (John Foye), S.P., E.T. and J.F. (John Fike). All authors have read and agreed to the published version of the manuscript.

Funding

This research received no external funding.

Data Availability Statement

All collected data and code used to generate the figures and statistics reported in this paper can be found at: https://github.com/WorkingTrees/SamplingPaper.

Acknowledgments

All data and code used to generate the figures and statistics reported here can be found at: https://github.com/WorkingTrees/SamplingPaper (accessed on 9 October 2023). Thanks to Austin Unruh, Carole Bankhead, and Brenda Graff, who assisted with field sampling. Thanks to Wendy Silverman from the Virginia Tech Cooperative Extension Master Gardeners Program, who recruited field assistants. Thanks to John Munsell, who provided measurement equipment for these experiments. Thanks to Vickesh Solanki for mobile application development services.

Conflicts of Interest

The authors claim that there are no conflict of interest or financial interest beyond those expressed by the fact that lead author Aakash Ahamed and co-author John Foye are employed by Working Trees, and Erich Treischman and John Fike are advisors of Working Trees, which could use the proposed measurement approach in their business model.

References

  1. Brown, S.; Gillespie, A.J.; Lugo, A.E. Biomass estimation methods for tropical forests with applications to forest inventory data. For. Sci. 1989, 35, 881–902. [Google Scholar]
  2. Smith, W.B. Forest inventory and analysis: A national inventory and monitoring program. Environ. Pollut. 2002, 116, S233–S242. [Google Scholar] [CrossRef]
  3. Corona, P.; Chirici, G.; McRoberts, R.E.; Winter, S.; Barbati, A. Contribution of large-scale forest inventories to biodiversity assessment and monitoring. For. Ecol. Manag. 2011, 262, 2061–2069. [Google Scholar] [CrossRef]
  4. Nowak, D.J.; Crane, D.E.; Stevens, J.C.; Hoehn, R.E. The Urban Forest Effects (UFORE) Model: Field Data Collection Manual; US Department of Agriculture Forest Service, Northeastern Research Station: Syracuse, NY, USA, 2003; pp. 4–11. [Google Scholar]
  5. Luoma, V.; Saarinen, N.; Wulder, M.A.; White, J.C.; Vastaranta, M.; Holopainen, M.; Hyyppä, J. Assessing precision in conventional field measurements of individual tree attributes. Forests 2017, 8, 38. [Google Scholar] [CrossRef]
  6. Fahey, T.J.; Woodbury, P.B.; Battles, J.J.; Goodale, C.L.; Hamburg, S.P.; Ollinger, S.V.; Woodall, C.W. Forest carbon storage: Ecology, management, and policy. Front. Ecol. Environ. 2010, 8, 245–252. [Google Scholar] [CrossRef]
  7. Skutsch, M. (Ed.) Community Forest Monitoring for the Carbon Market: Opportunities under REDD; Routledge: London, UK, 2012. [Google Scholar]
  8. Kerchner, C.D.; Keeton, W.S. California’s regulatory forest carbon market: Viability for northeast landowners. For. Policy Econ. 2015, 50, 70–81. [Google Scholar] [CrossRef]
  9. Hurtt, G.; Zhao, M.; Sahajpal, R.; Armstrong, A.; Birdsey, R.; Campbell, E.; Dolan, K.; Dubayah, R.; Fisk, J.P.; Flanagan, S.; et al. Beyond MRV: High-resolution forest carbon modeling for climate mitigation planning over Maryland, USA. Environ. Res. Lett. 2019, 14, 045013. [Google Scholar] [CrossRef]
  10. Fan, Y.; Feng, Z.; Mannan, A.; Khan, T.U.; Shen, C.; Saeed, S. Estimating tree position, diameter at breast height, and tree height in real-time using a mobile phone with RGB-D SLAM. Remote Sens. 2018, 10, 1845. [Google Scholar] [CrossRef]
  11. Wu, X.; Zhou, S.; Xu, A.; Chen, B. Passive measurement method of tree diameter at breast height using a smartphone. Comput. Electron. Agric. 2019, 163, 104875. [Google Scholar] [CrossRef]
  12. Proudman, A.; Ramezani, M.; Digumarti, S.T.; Chebrolu, N.; Fallon, M. Towards real-time forest inventory using handheld LiDAR. Robot. Auton. Syst. 2022, 157, 104240. [Google Scholar] [CrossRef]
  13. Tatsumi, S.; Yamaguchi, K.; Furuya, N. ForestScanner: A mobile application for measuring and mapping trees with LiDAR-equipped iPhone and iPad. Methods Ecol. Evol. 2022, 14, 1603–1609. [Google Scholar] [CrossRef]
  14. Holcomb, A.; Tong, L.; Keshav, S. Robust Single-Image Tree Diameter Estimation with Mobile Phones. Remote Sens. 2023, 15, 772. [Google Scholar] [CrossRef]
  15. Houghton, R.A.; Butman, D.; Bunn, A.G.; Krankina, O.N.; Schlesinger, P.; Stone, T.A. Mapping Russian forest biomass with data from satellites and forest inventories. Environ. Res. Lett. 2007, 2, 045032. [Google Scholar] [CrossRef]
  16. Kennedy, R.E.; Ohmann, J.; Gregory, M.; Roberts, H.; Yang, Z.; Bell, D.M.; Kane, V.; Hughes, M.J.; Cohen, W.B.; Powell, S.; et al. An empirical, integrated forest biomass monitoring system. Environ. Res. Lett. 2018, 13, 025004. [Google Scholar] [CrossRef]
  17. Yu, Y.; Saatchi, S.; Domke, G.M.; Walters, B.; Woodall, C.; Ganguly, S.; Li, S.; Kalia, S.; Park, T.; Nemani, R.; et al. Making the US national forest inventory spatially contiguous and temporally consistent. Environ. Res. Lett. 2022, 17, 065002. [Google Scholar] [CrossRef]
  18. Wang, Z.; Lu, X.; An, F.; Zhou, L.; Wang, X.; Wang, Z.; Zhang, H.; Yun, T. Integrating Real Tree Skeleton Reconstruction Based on Partial Computational Virtual Measurement (CVM) with Actual Forest Scenario Rendering: A Solid Step Forward for the Realization of the Digital Twins of Trees and Forests. Remote Sens. 2022, 14, 6041. [Google Scholar] [CrossRef]
  19. Durrant-Whyte, H.; Bailey, T. Simultaneous localization and mapping: Part I. IEEE Robot. Autom. Mag. 2006, 13, 99–110. [Google Scholar] [CrossRef]
  20. Nistér, D.; Naroditsky, O.; Bergen, J. Visual odometry. In Proceedings of the 2004 IEEE Computer Society Conference on Computer Vision and Pattern Recognition, CVPR, Washington, DC, USA, 27 June –2 July 2004; Volume 1, p. I-I. [Google Scholar]
  21. Lucas, B.D.; Kanade, T. An iterative image registration technique with an application to stereo vision. In Proceedings of the IJCAI’81: 7th International Joint Conference on Artificial Intelligence, Vancouver, BC, Canada, 24–28 August 1981; Volume 2, pp. 674–679. [Google Scholar]
  22. Ro, H.; Byun, J.H.; Park, Y.J.; Lee, N.K.; Han, T.D. AR pointer: Advanced ray-casting interface using laser pointer metaphor for object manipulation in 3D augmented reality environment. Appl. Sci. 2019, 9, 3078. [Google Scholar] [CrossRef]
  23. Chojnacky, D.C.; Heath, L.S.; Jenkins, J.C. Updated generalized biomass equations for North American tree species. Forestry 2014, 87, 129–151. [Google Scholar] [CrossRef]
  24. Shrout, P.E.; Fleiss, J.L. Intraclass correlations: Uses in assessing rater reliability. Psychol. Bull. 1979, 86, 420. [Google Scholar] [CrossRef]
  25. Bland, J.M.; Altman, D.G. Measuring agreement in method comparison studies. Stat. Methods Med. Res. 1999, 8, 135–160. [Google Scholar] [CrossRef]
  26. Levene, H. Robust tests for equality of variances. Contrib. Probab. Stat. 1960, 69, 278–292. [Google Scholar] [CrossRef]
  27. Virtanen, P.; Gommers, R.; Oliphant, T.E.; Haberland, M.; Reddy, T.; Cournapeau, D.; Burovski, E.; Peterson, P.; Weckesser, W.; Bright, J.; et al. SciPy 1.0: Fundamental algorithms for scientific computing in Python. Nat. Methods 2020, 17, 261–272. [Google Scholar] [CrossRef]
  28. Jenkins, J.C.; Chojnacky, D.C.; Heath, L.S.; Birdsey, R.A. National-scale biomass estimators for United States tree species. For. Sci. 2003, 49, 12–35. [Google Scholar]
  29. Chave, J.; Réjou-Méchain, M.; Búrquez, A.; Chidumayo, E.; Colgan, M.S.; Delitti, W.B.; Duque, A.; Eid, T.; Fearnside, P.M.; Goodman, R.C.; et al. Improved allometric models to estimate the aboveground biomass of tropical trees. Glob. Chang. Biol. 2014, 20, 3177–3190. [Google Scholar] [CrossRef] [PubMed]
Figure 1. Screen captures of the mobile phone application workflow, demonstrating, in order, measurement of tree (A) height and (B) diameter; (C) selection of species; (D) recording of location; and (E) summary screen of collected data. To measure diameter, the user is prompted to place ‘anchor points’ at the left and right sides of the tree trunk, respectively. The application uses Apple’s ARKit library to detect surfaces and place anchor points.
Forests 14 02027 g001
Figure 2. Map data from Google, NASA. (A) Map of the study location in Blacksburg (red star), Virginia (black shading), USA, is shown. (B) Aerial image of the Kentland Study site composed of 58 Honey Locusts and 50 Black Walnuts aged 27 years; (C) Aerial image of the Catawba Study Site, composed of 20 Black Walnuts, 14 Black Locusts, and 13 Loblolly Pines, all aged 7 years.
Forests 14 02027 g002
Figure 3. Scatterplot showing the tree diameter measured manually (x-axis) and by the mobile application (y-axis). Results are color-coded by species, and results for the Catawba study area are shown as crosses, while the results for the Kentland study area are shown as circles. The mean error between phone-based and manual measurements was 1.9 cm, and the RMSE was 2.71 cm.
Forests 14 02027 g003
Figure 4. Violin plots showing the mean error for each species as a white dot, while error distributions around the mean are shown for each species.
Forests 14 02027 g004
Figure 5. Histograms depicting bins and fitted distributions (lines) of manual diameter measurements (blue for Honey Locust, orange for Black Walnut, Green for Black Locust, red for Loblolly Pine) and phone-based diameter measurements (black) for each species. The histograms and fitted distributions show that diameter and height measured using the application are conservative relative to manual measurements, and both approaches have similar distributions.
Forests 14 02027 g005
Figure 6. Bland–Altman Plot for tree diameter showing that phone-based measurements of heights and diameters are conservative, and >95% of all measurements are within a two-standard deviation range.
Forests 14 02027 g006
Figure 7. Scatterplot showing the tree diameter measured manually (x-axis) and by the mobile application (y-axis). Points correspond to the mean value for each tree, while error bars correspond to the standard deviation of each tree. Results are color-coded by species. The mean error between phone-based and manual measurements was 2.03 cm, and the RMSE was 2.48 cm.
Forests 14 02027 g007
Figure 8. Violin plots depicting the mean (white dots) and distribution of diameter (cm, y-axis), estimated by each user (colors), for the two species at the Kentland study site (x-axis).
Forests 14 02027 g008
Table 1. Summary of error statistics for phone-based estimates of diameter.
Mean Error (cm)Mean Percent Error (%)RMSE (cm)R2 (Dimensionless)Concordance Correlation (Dimensionless)Intraclass Correlation (Dimensionless)
Honey Locust (N = 207)1.33−5.502.180.840.870.87
Black Walnut (N = 180)2.45−9.623.190.950.940.93
Black Locust (N = 14)1.29−15.421.540.950.890.89
Pitch-Loblolly Pine (N = 13)1.58−17.491.650.990.940.94
All (N = 414)1.90−8.272.710.900.910.91
Table 2. Results of statistical tests applied to the field data collected at Kentland. The columns depict the two sets of measurements collected manually, while columns depict the three sets of measurements collected using the mobile application.
(A) Paired T Test (B) One Way ANOVA(C) Levene’s Test
T Statistic (p Value)F Statistic (p Value)W Statistic (p Value)
Manual 1Manual 2Manual 1Manual 2Manual 1Manual 2
User 1−3.27 (0.0014)−3.45 (0.0008)6.81 (0.0097)7.46 (0.0068)1.21 (0.2735)1.03 (0.312)
User 1 repeat−2.82 (0.0057)−2.98 (0.0036)5.7 (0.0178)6.29 (0.0129)1.6 (0.2078)1.39 (0.2391)
User 2−3.04 (0.0039)−3.06 (0.0037)6.31 (0.0131)6.8 (0.01)0.07 (0.7928)0.04 (0.8398)
Disclaimer/Publisher’s Note: The statements, opinions and data contained in all publications are solely those of the individual author(s) and contributor(s) and not of MDPI and/or the editor(s). MDPI and/or the editor(s) disclaim responsibility for any injury to people or property resulting from any ideas, methods, instructions or products referred to in the content.

