Article

Exploring the Role of Weather and Forest Management on Nutrient Export in Boreal Forested Catchments Using Spatially Distributed Model

by
Aura Salmivaara
1,*,†,
Antti Leinonen
2,†,
Marjo Palviainen
3,
Natalia Korhonen
4,
Samuli Launiainen
1,
Heikki Tuomenvirta
4,
Liisa Ukonmaanaho
1,
Leena Finér
5 and
Annamari (Ari) Laurén
2,3
1
Natural Resources Institute Finland (Luke), Latokartanonkaari 9, FI-00790 Helsinki, Finland
2
School of Forest Sciences, Faculty of Science and Forestry, University of Eastern Finland, Joensuu Campus, Yliopistokatu 7, FI-80100 Joensuu, Finland
3
Department of Forest Sciences, University of Helsinki, Latokartanonkaari 7, FI-00014 Helsinki, Finland
4
Weather and Climate Change Impact Research, Finnish Meteorological Institute, Erik Palménin Aukio 1, FI-00560 Helsinki, Finland
5
Natural Resources Institute Finland (Luke), Yliopistokatu 6, FI-80100 Joensuu, Finland
*
Author to whom correspondence should be addressed.
These authors contributed equally to this work.
Forests 2023, 14(1), 89; https://doi.org/10.3390/f14010089
Submission received: 7 November 2022 / Revised: 19 December 2022 / Accepted: 26 December 2022 / Published: 3 January 2023
(This article belongs to the Special Issue Forest Management, Hydrology and Biogeochemistry Modelling)

Abstract

:
Weather-driven hydrological variability and forest management influence the nutrient export from terrestrial to aquatic systems. We quantified the effect and range of variation in total nitrogen and phosphorus export in Vehka-Kuonanjärvi catchment located in southeastern Finland. A distributed model NutSpaFHy was used with varying weather scenarios (compiled from observed extreme years of dry, wet and wet & mild) and forest management scenarios (including no additional management and intensive clear-cutting of all mature stands in the existing forest structure). Nutrient exports by scenario combinations were compared to modeled baseline export in observed weather. The results showed that the increase in nutrient export by wet & mild weather (over 55%) exceeded the increase caused by the clear-cutting scenario (23 %). Dry weather decreased the exports to tenth of the baseline, which was per hectare 2.22 kg for N, 0.08 kg for P). The results suggest that in future maintaining a good ecological status in aquatic systems can be challenging if extreme wet years with mild winters occur more frequently. Certain catchment characteristics, e.g., deciduous tree percentage, open area percentage and site fertility, influence the export increase induced by the extreme weather. Hotspot analysis enabled identifying areas with currently high nutrient export and areas with high increase induced by the extreme weather. This helps targeting water protection efficiently.

1. Introduction

The Water Framework Directive of the European Union (2000/60/EC, WFD) aims at good ecological and chemical status of all surface waters [1], which calls for reducing the terrestial nutrient export that causes eutrophication deteriorating the water quality. Nutrient export emerges as a result of complex processes that have spatial and temporal variability and are influenced by weather conditions and climate, site characteristics, and human activities [2,3,4,5,6]. In the Nordic countries the naturally occurring background nutrient export contributes a significant proportion of nitrogen (N) and phosphorus (P) export to surface waters [7,8,9,10].
Various spatially varying factors influence the magnitude of nutrient export from forests [11,12,13,14,15]. These include soil type (peat/mineral), site fertility, distance to water body, slope, tree species composition, and implemented forest management practices [11,12,14]. Temporal variability in nutrient export is mainly related to intra- and inter-annual variability in runoff and changes in the nutrient demand - supply balance [14,16,17,18]. In boreal region, strong seasonal cycle in temperature and radiation, and synoptic-scale variations in precipitation lead to highly variable runoff. The runoff peaks typically during spring snowmelt and late autumn when precipitation greatly exceeds evapotranspiration. The baseflow runoff is low during snow-covered winters and frozen soils as well as during the dry spells in the growing season [19,20]. Likewise, the soil temperature controls the decomposition and nutrient release rates, while nutrient uptake is driven by vegetation growth. The nutrient export is onset when there is a mismatch between the nutrient release and nutrient uptake. Therefore, the increased risk of nutrient leaching occurs in periods outside the growing season when the soil is not frozen [11] and there is runoff to transport nutrients to water bodies. These factors jointly make the nutrient balance dynamic, and strongly linked to hydrology and forest management [11]. Nutrient export is particularly high after clear-cutting [12], as it reduces interception and transpiration, raising water table, increasing runoff [21] and halting nutrient uptake by trees [22,23]. Clear-cutting increases nutrient export to surface waters for approximately ten years period of time [14,15,17,24].
Nutrient exports can be potentially mitigated by altering forest regeneration and harvesting strategies, e.g., by converting clear-cut harvesting to continuous cover forestry [24], or by widening buffer zones between the operation site and the water bodies [25]. Water protection structures, such as constructed wetlands and overland flow areas, can also be used to decrease nutrient export [26]. To efficiently locate water protection measures in the catchment, nutrient export hotspots must be identified. This has not previously been possible with commonly used methods and data, e.g., by the specific export coefficient method [14,27]. These methods are insensitive to site properties and typically ignore temporally varying weather and spatially varying patterns altogether. While the role of weather and runoff for nutrient export is known to be important [9,10], it has not been explored thoroughly even in the more process-based modelling studies (e.g., [28,29,30,31]). The main emphasis on boreal zone nutrient export research has been in quantifying anthropogenic factors, such as forest management [2,32,33], while the inter-annual variability and effect of weather has not received sufficient attention. This requires attention since runoff is expected to increase in the future [26] together with extreme weather conditions, such as heavy rainfall [34] and mild winters [35], which may further increase the risk of nutrient leaching.
Recently developed spatially distributed nutrient balance model NutSpaFHy [11] enables identification of nutrient export hotspots in boreal forested catchments considering weather conditions. The model builds on the hydrological model SpaFHy [36] by adding a grid-based nutrient balance sub-model and a conceptual solute transport routine to approximate total N and P export to streams. NutSpaFHy can handle the spatial heterogeneity of forest landscape, and multiple combinations of factors contributing to nutrient export, such as scenarios of extreme weather and location of clear-cuts within the catchment. In this study, we aim to explore the role of extreme weather for nutrient export. We use the term ‘extreme weather’ for heavy rainfall and anomalous warm periods outside the growing season, and for dry periods especially during the growing season. Using NutSpaFHy, the study objectives are to:
i
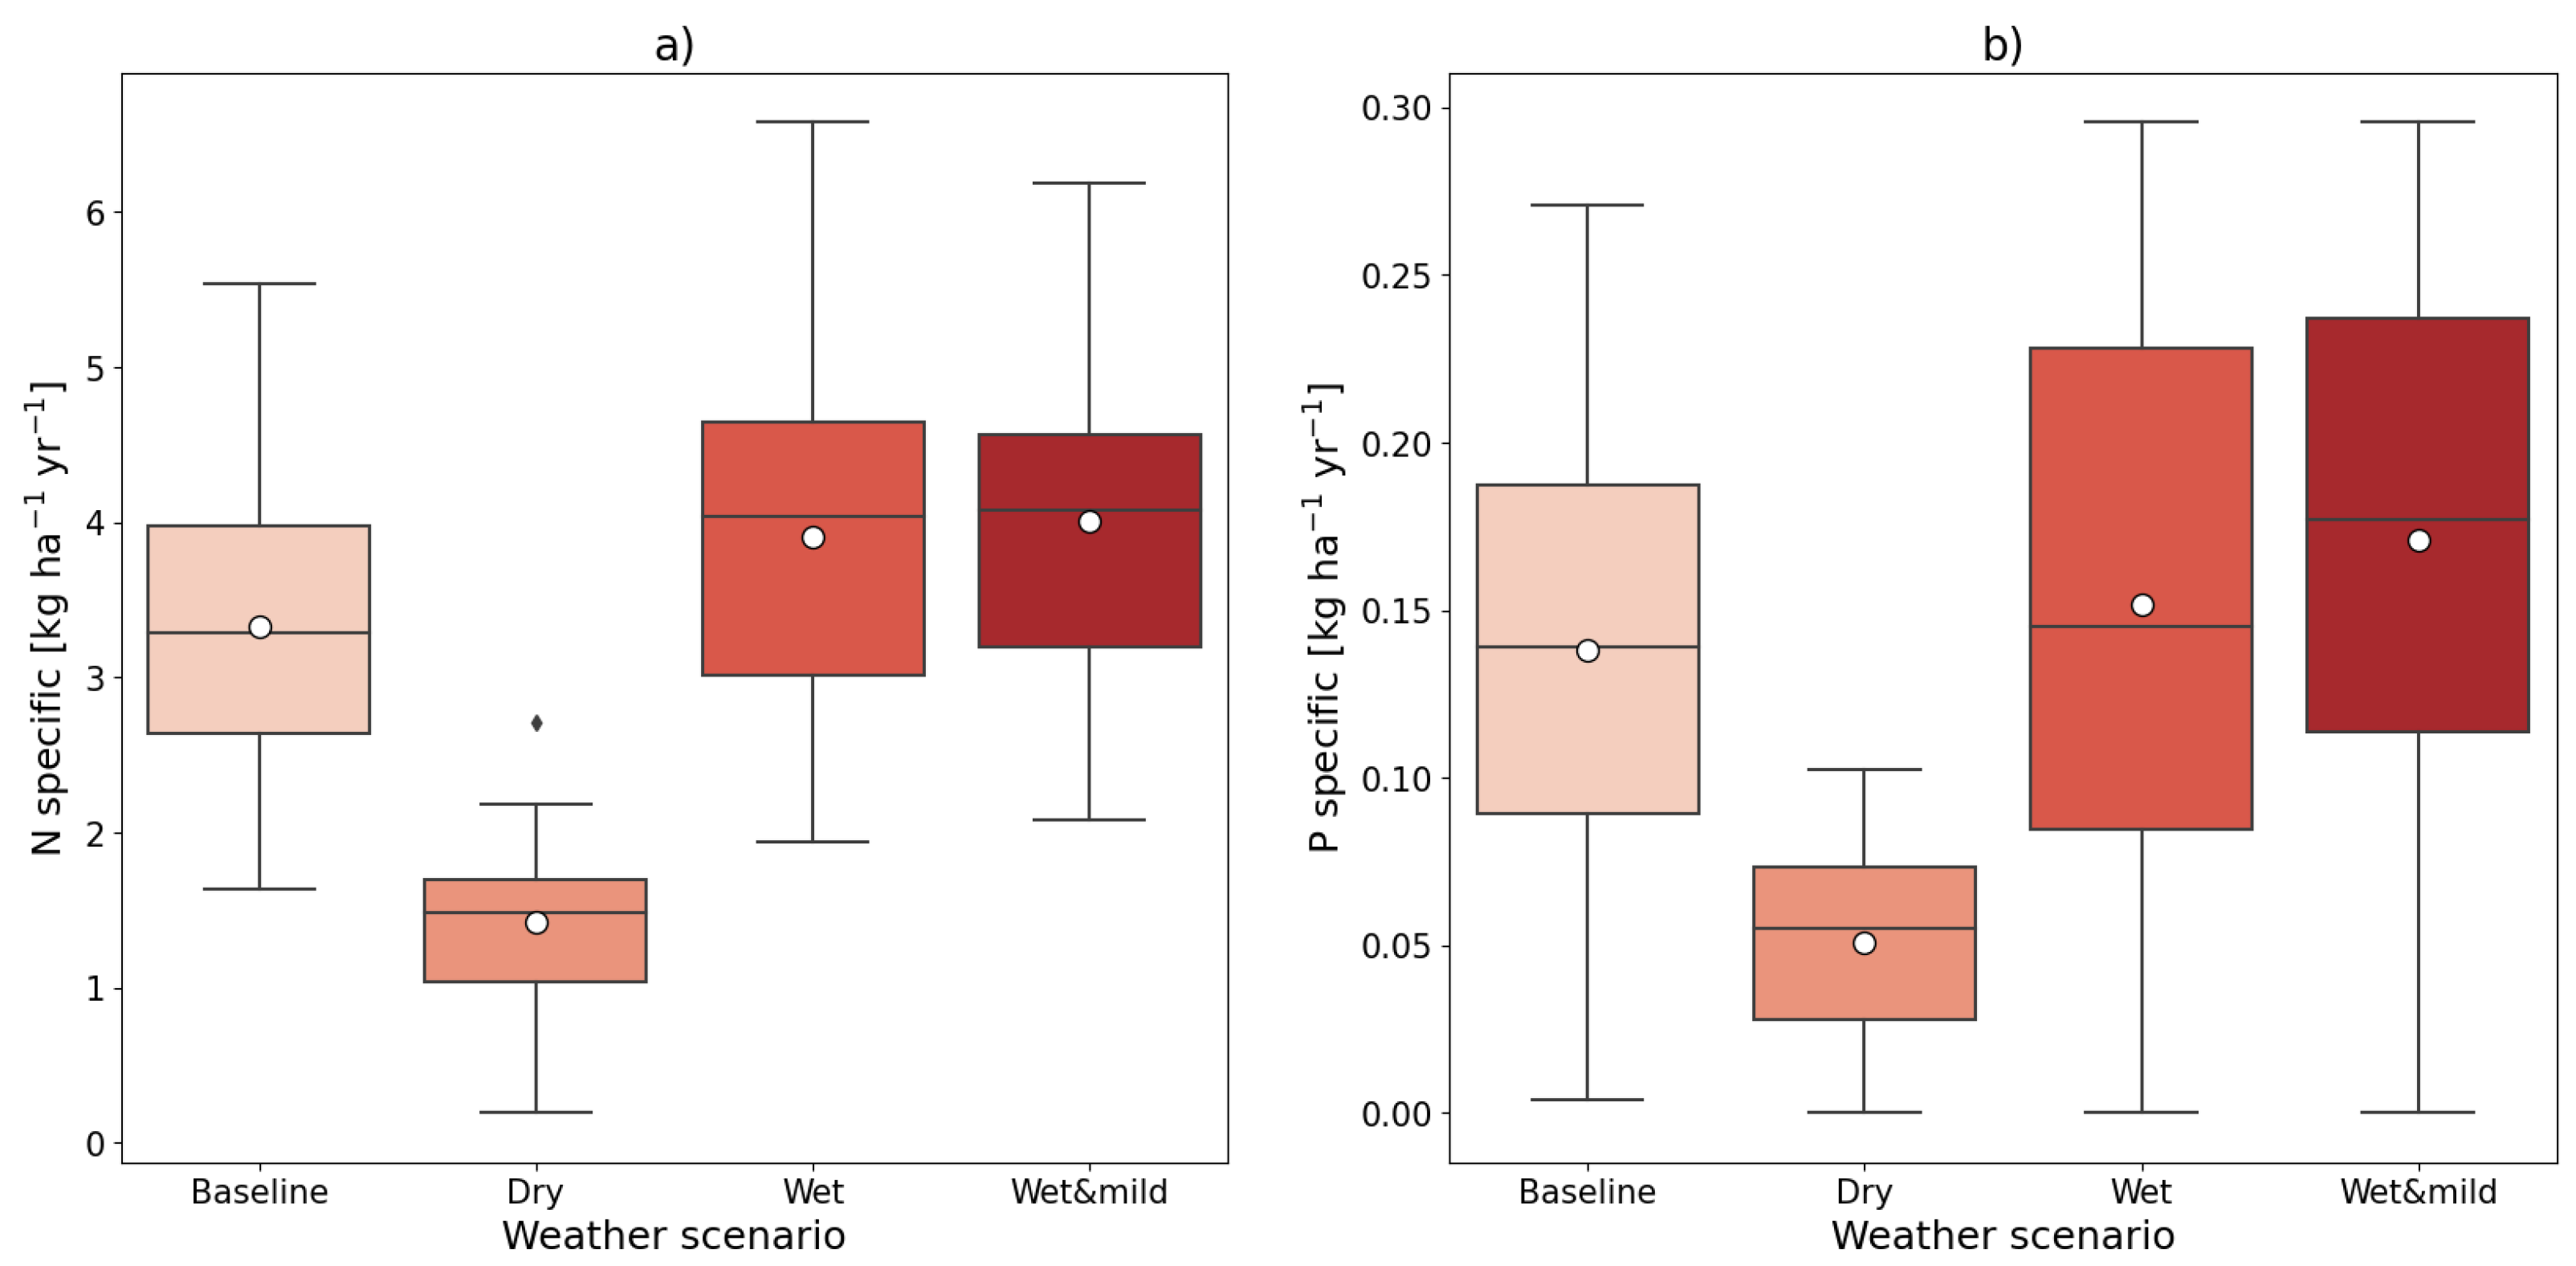
Estimate how much extreme weather conditions (dry, wet, and wet & mild) influence the N and P export from managed forest areas to water bodies,
ii
Estimate how much the effect of clear-cutting is affected by the extreme weather conditions, and
iii
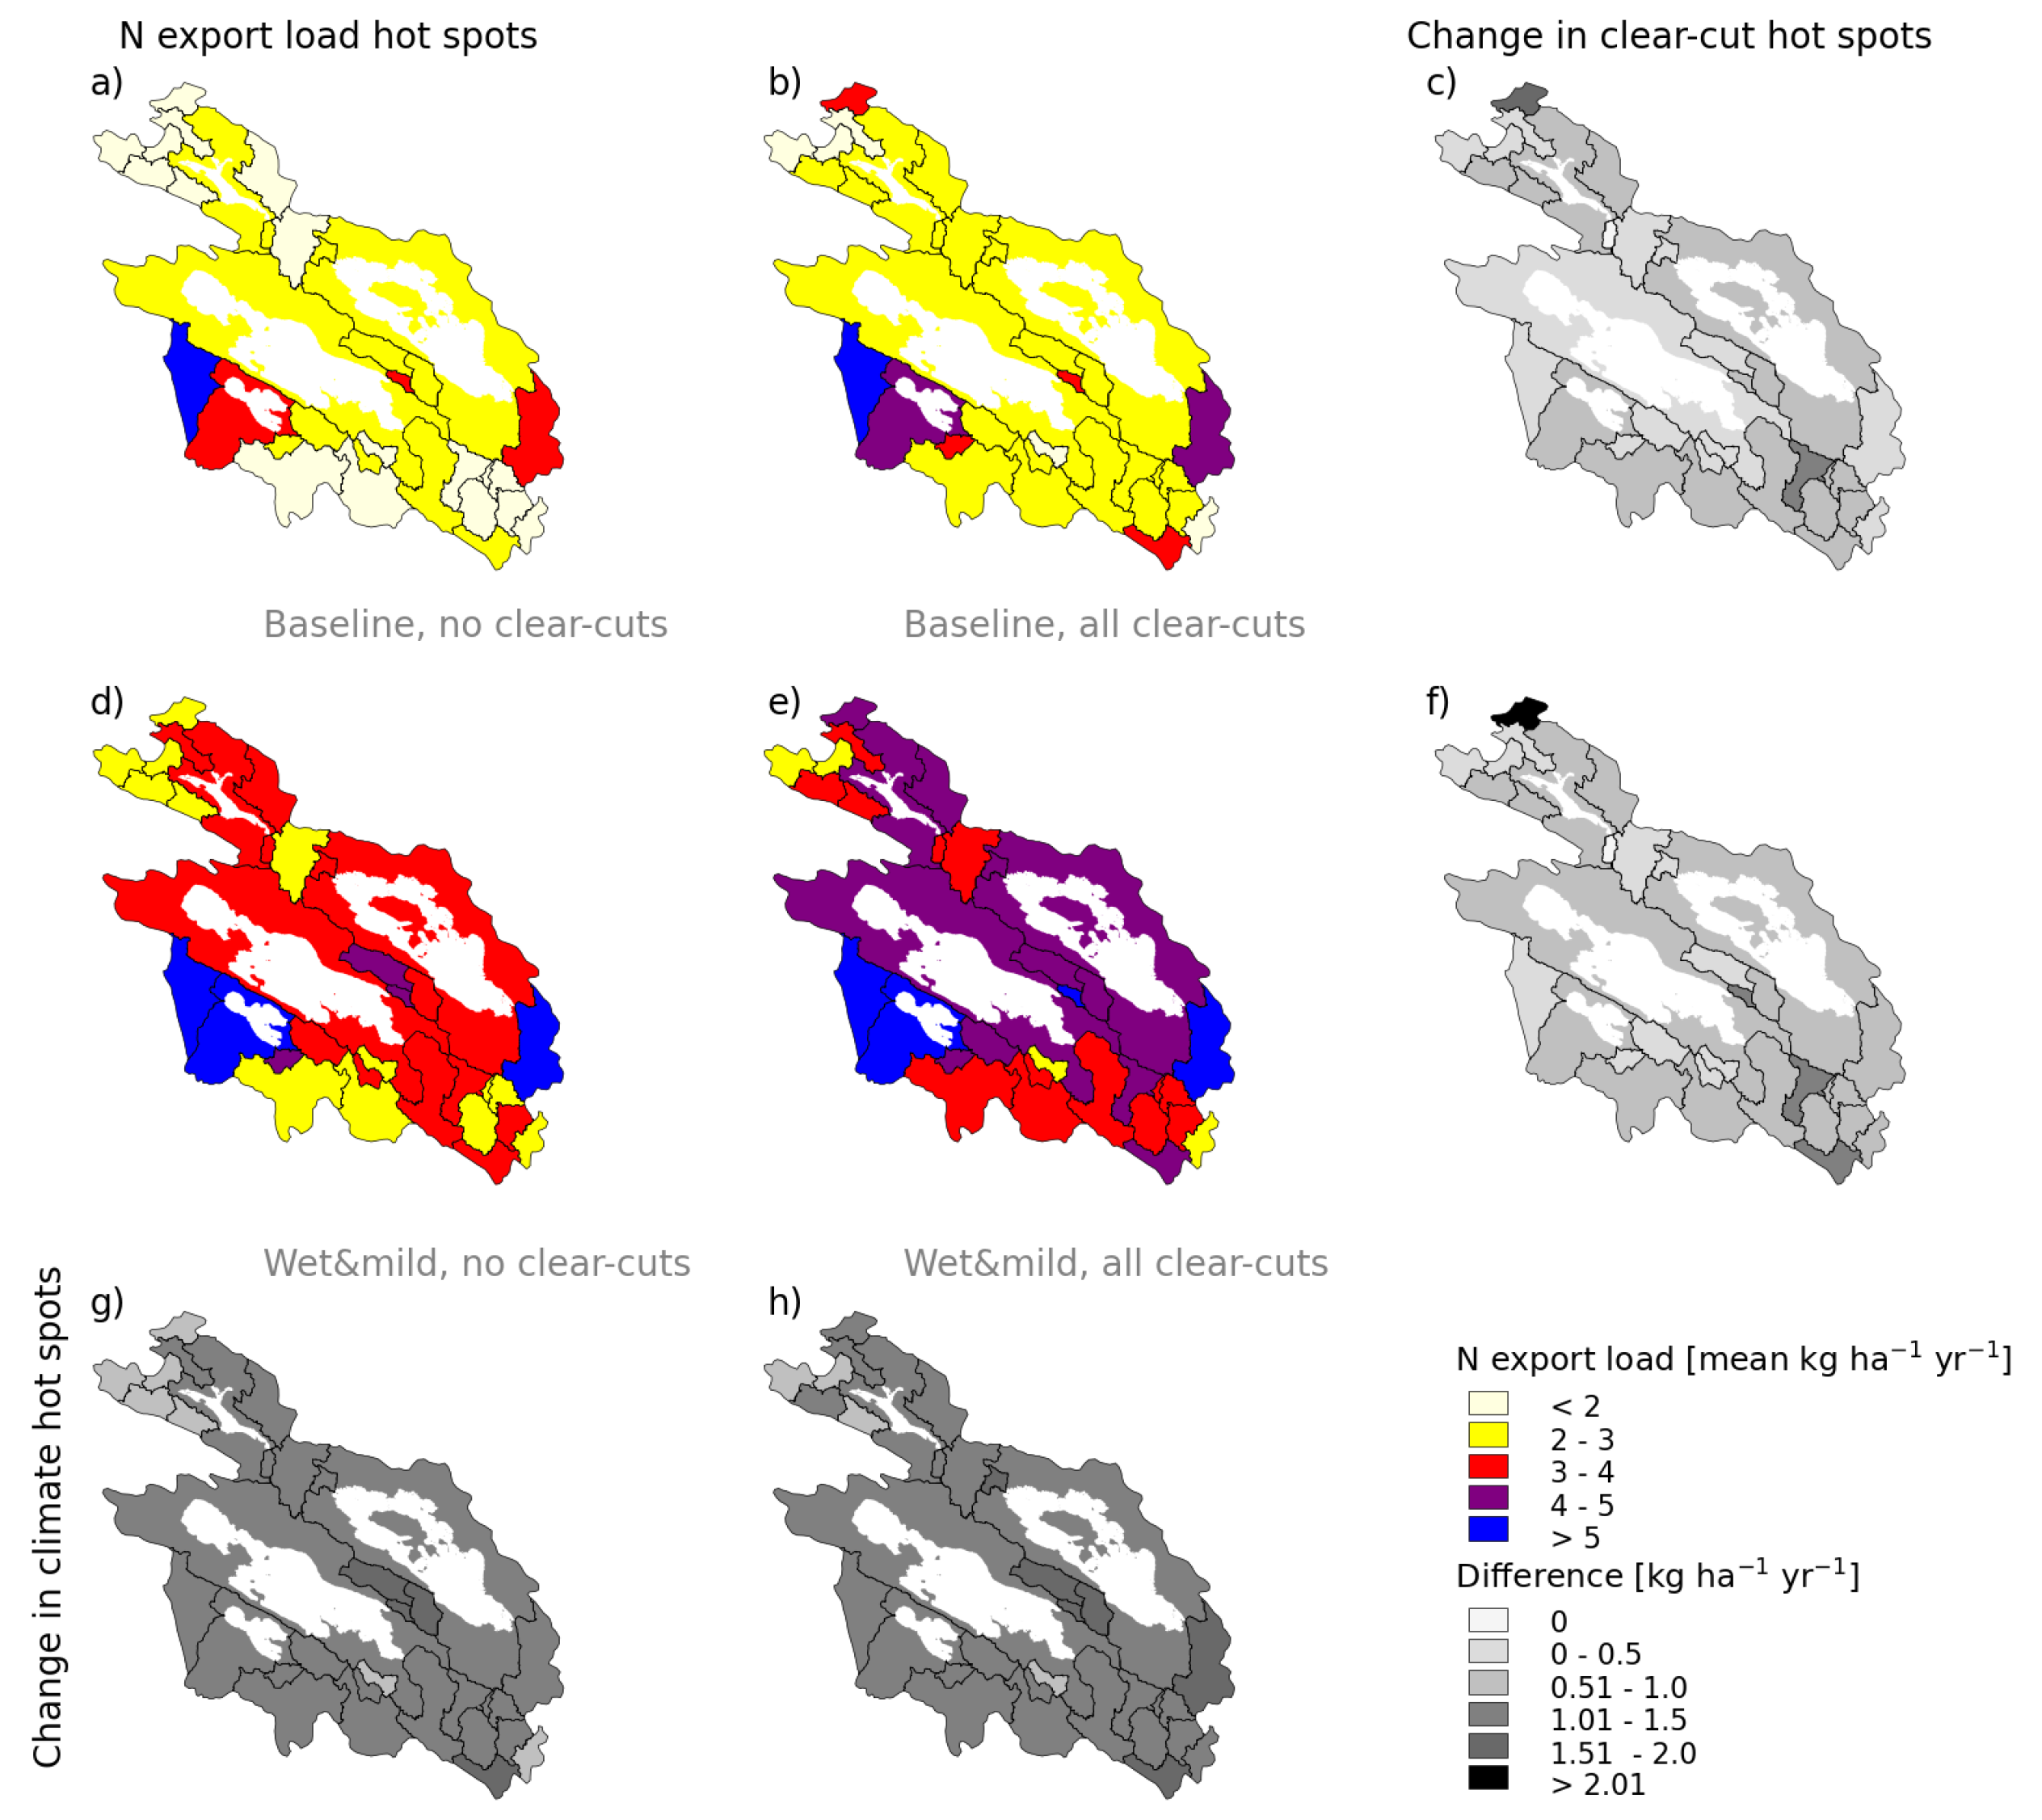
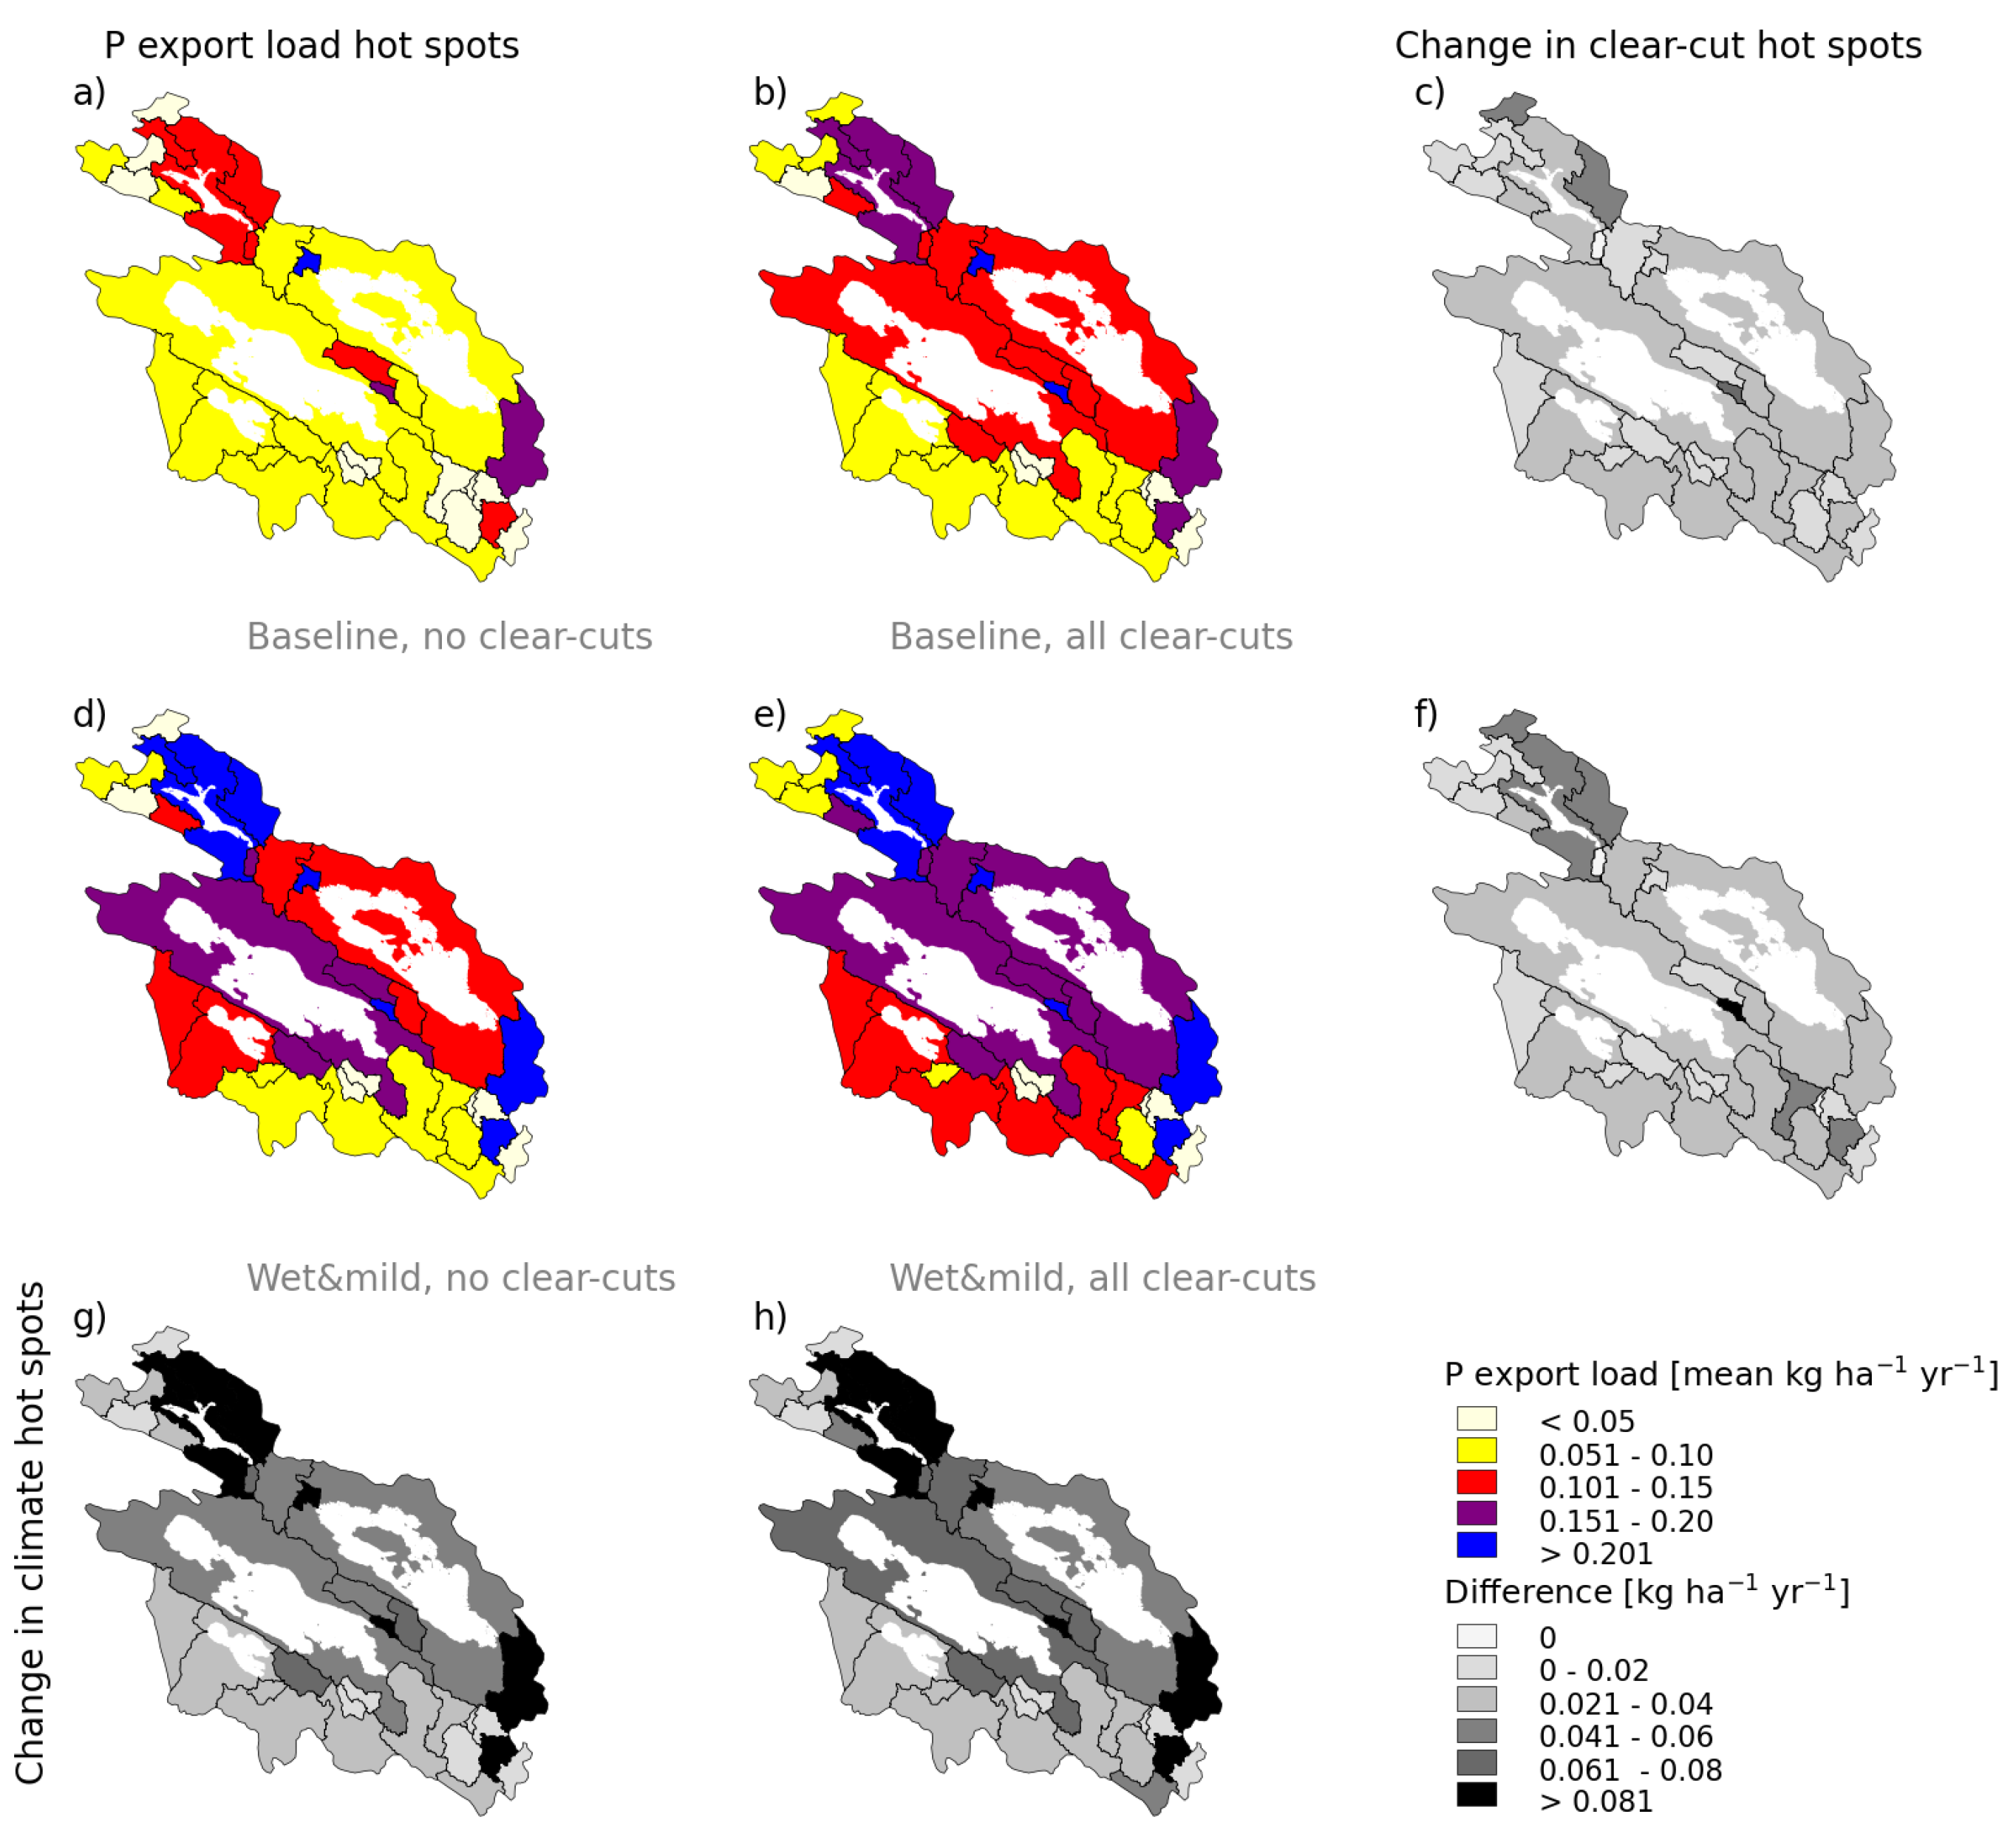
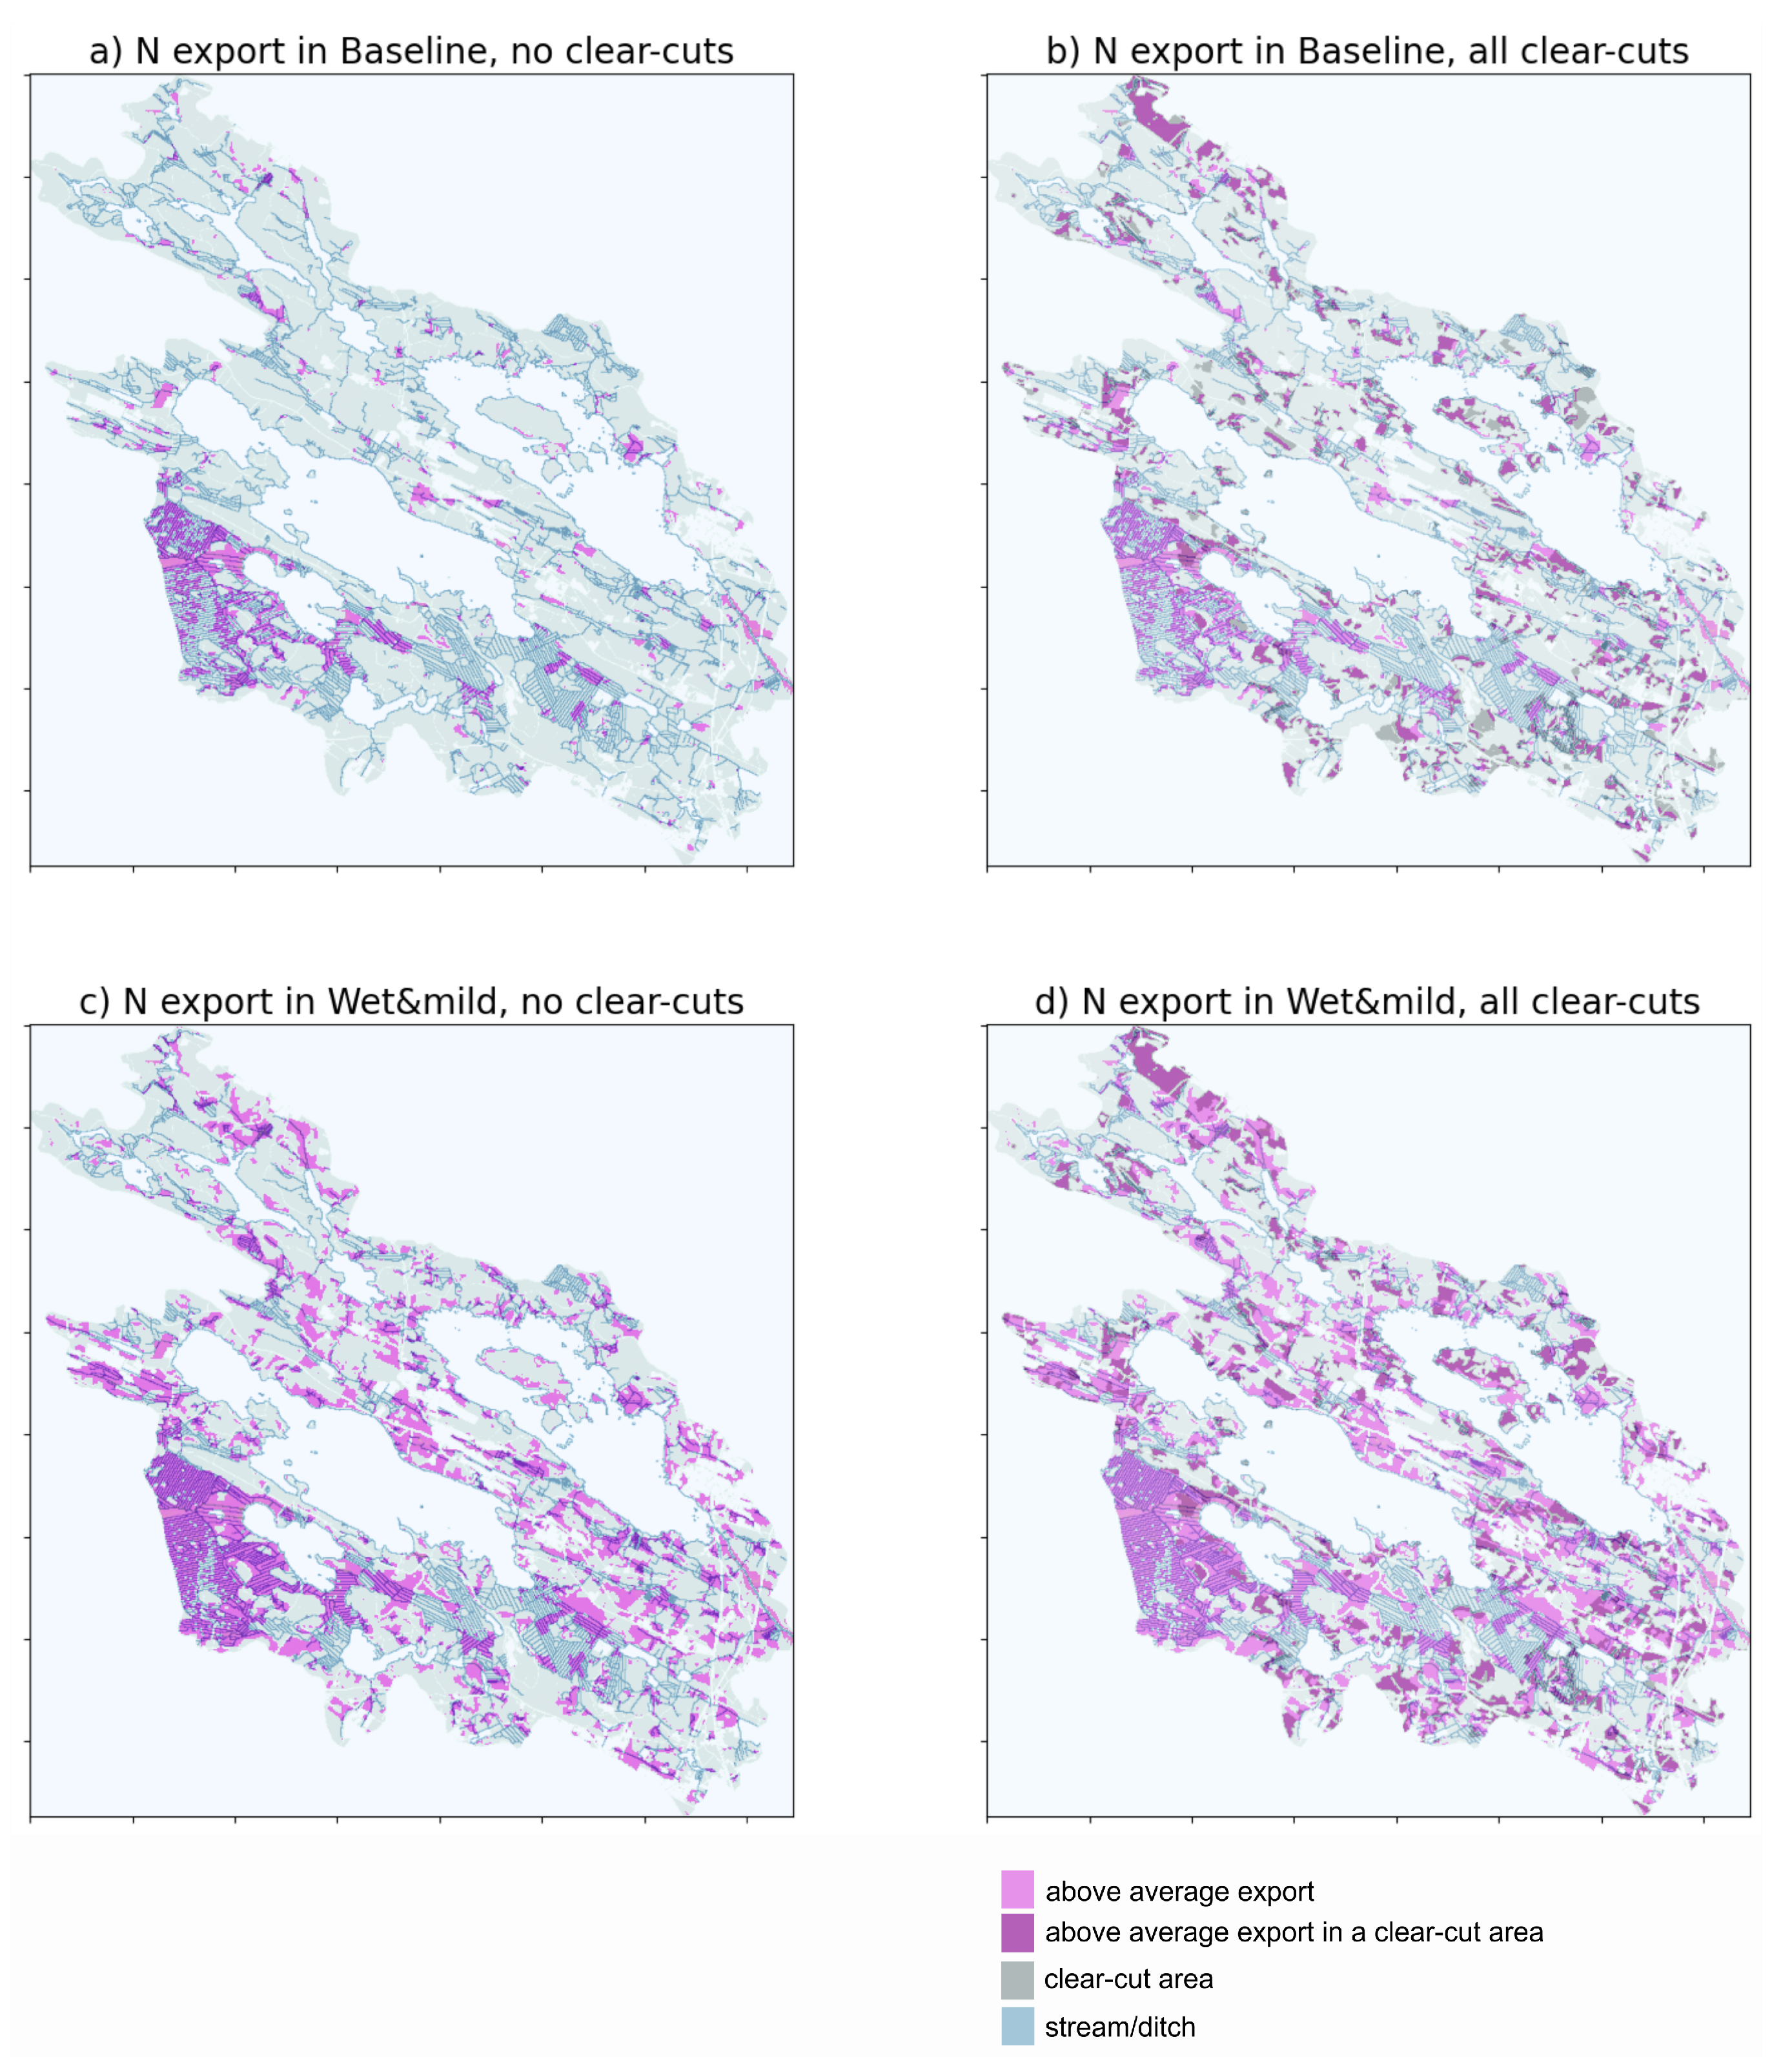
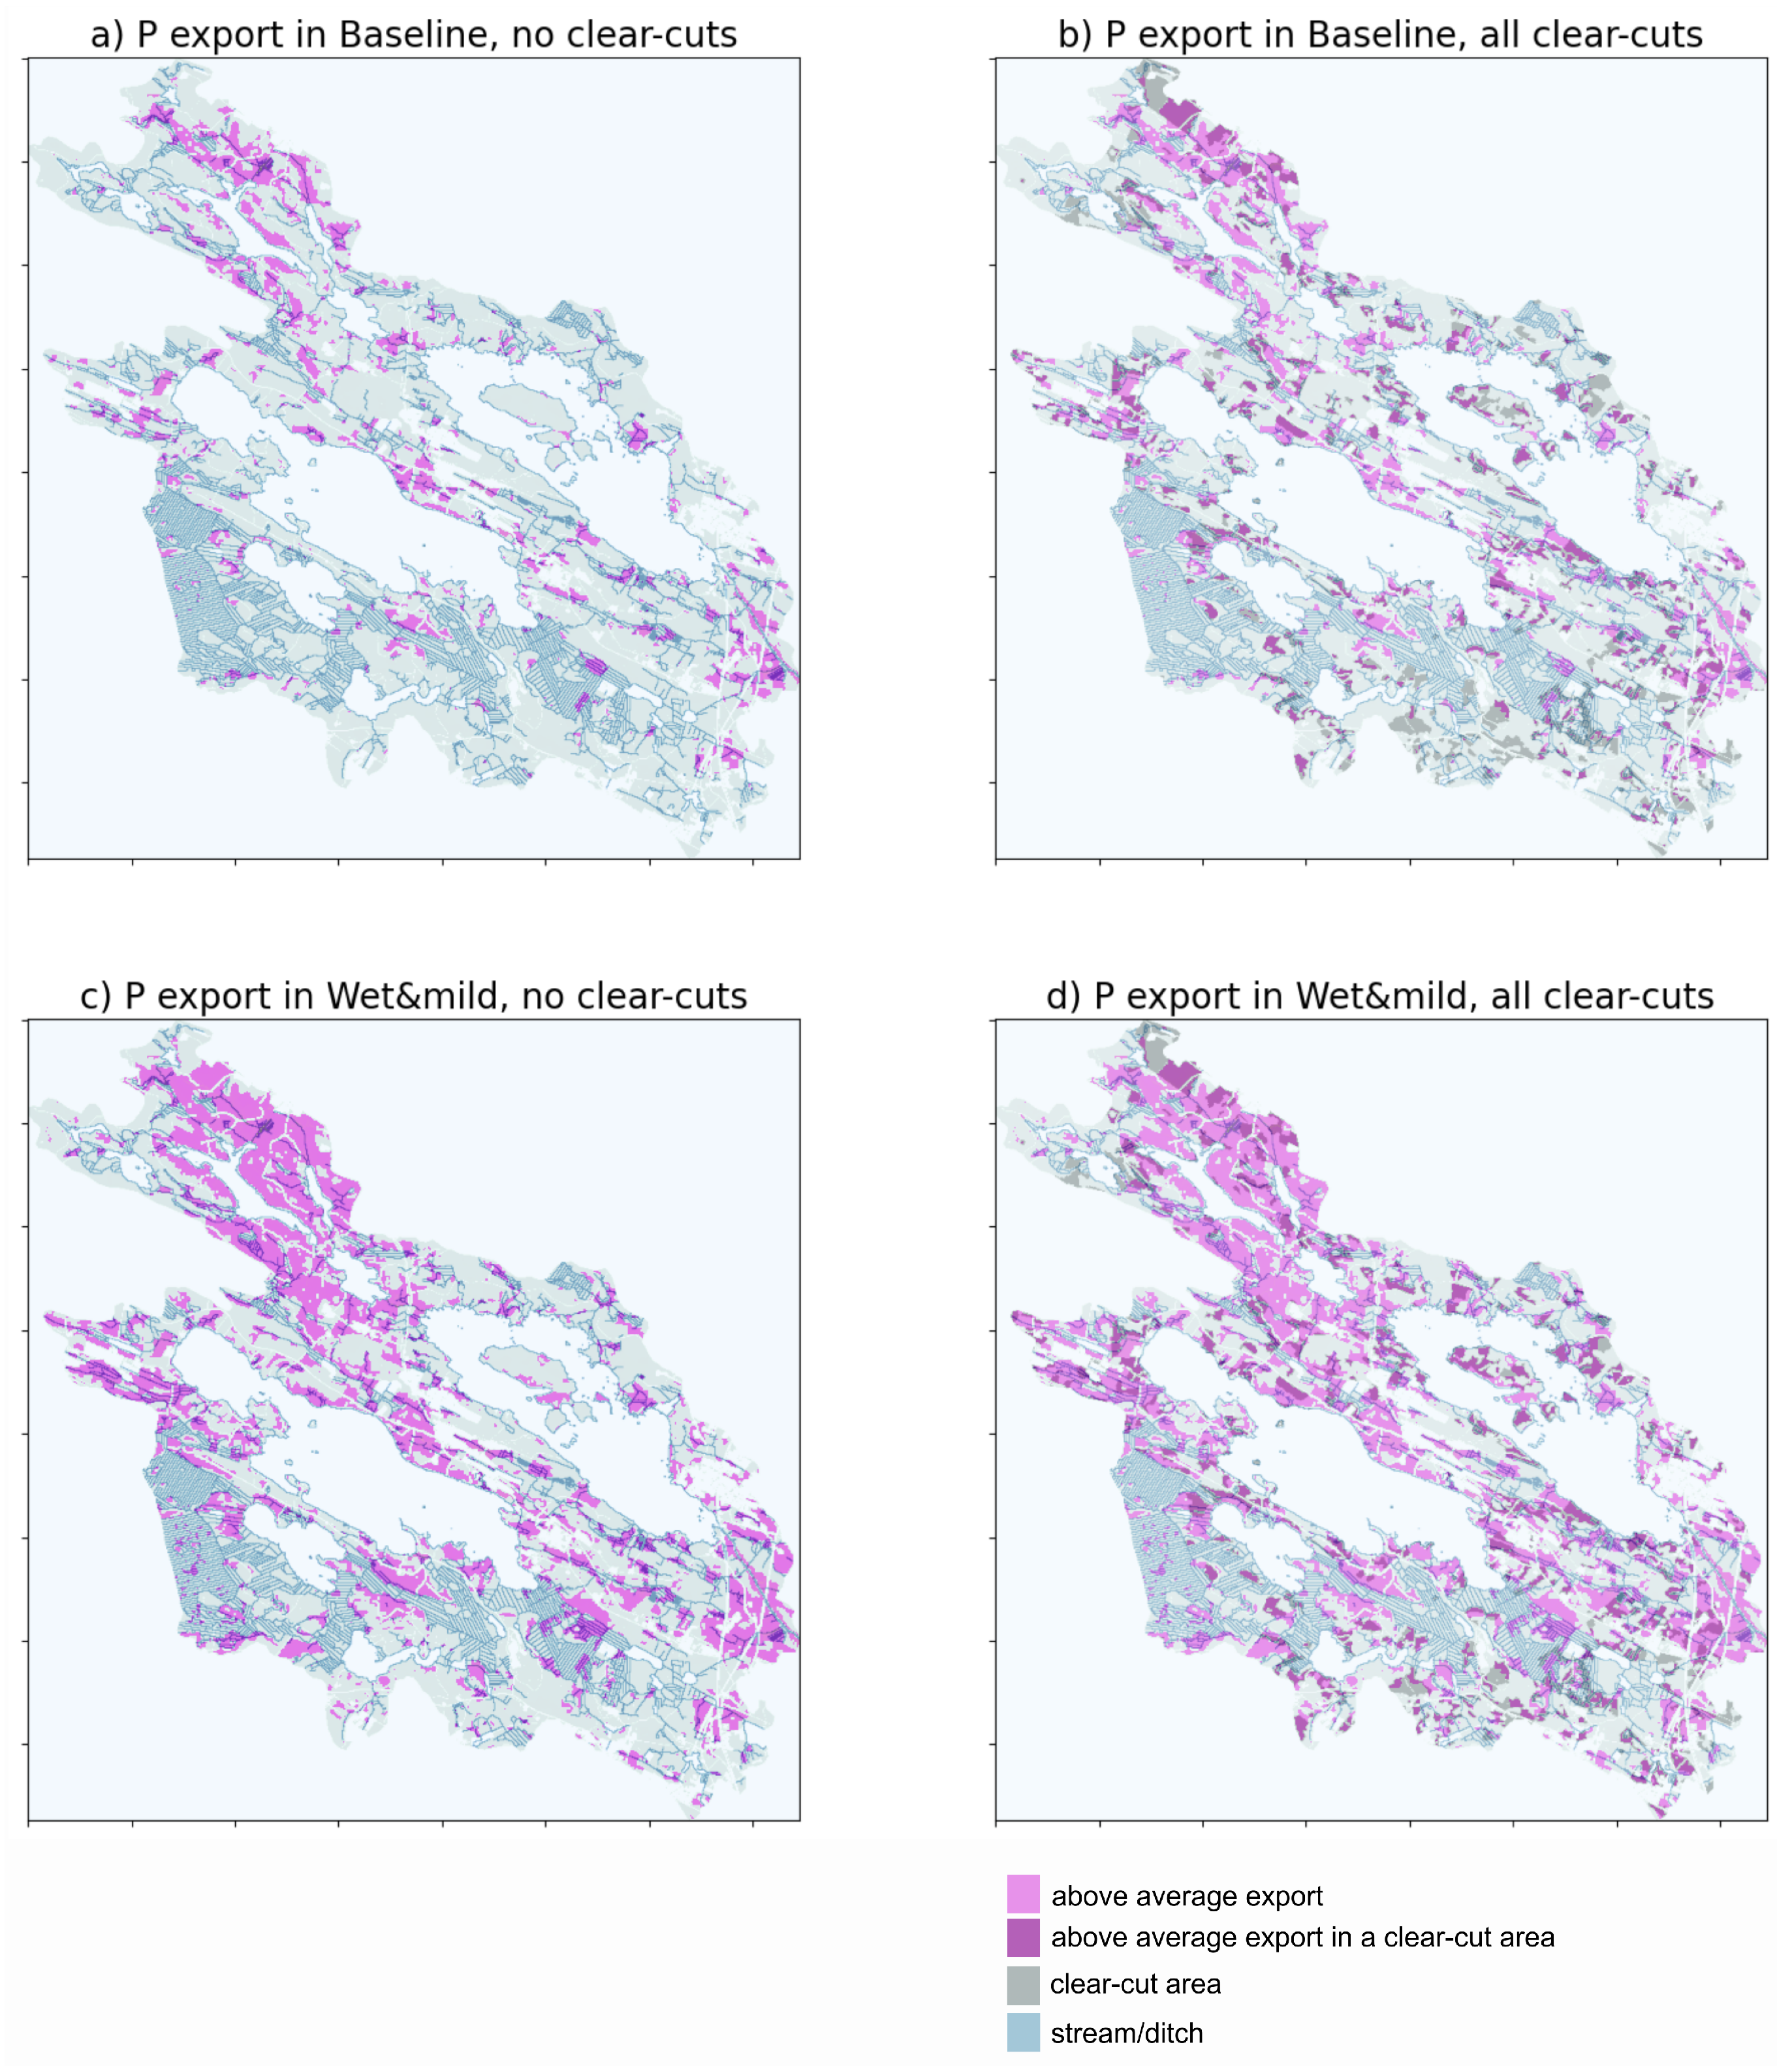
Identify the nutrient export hotspots on sub-catchment and grid-cell level, and explore whether the hotspots vary between different weather conditions and clear-cut scenarios.

2. Materials and Methods
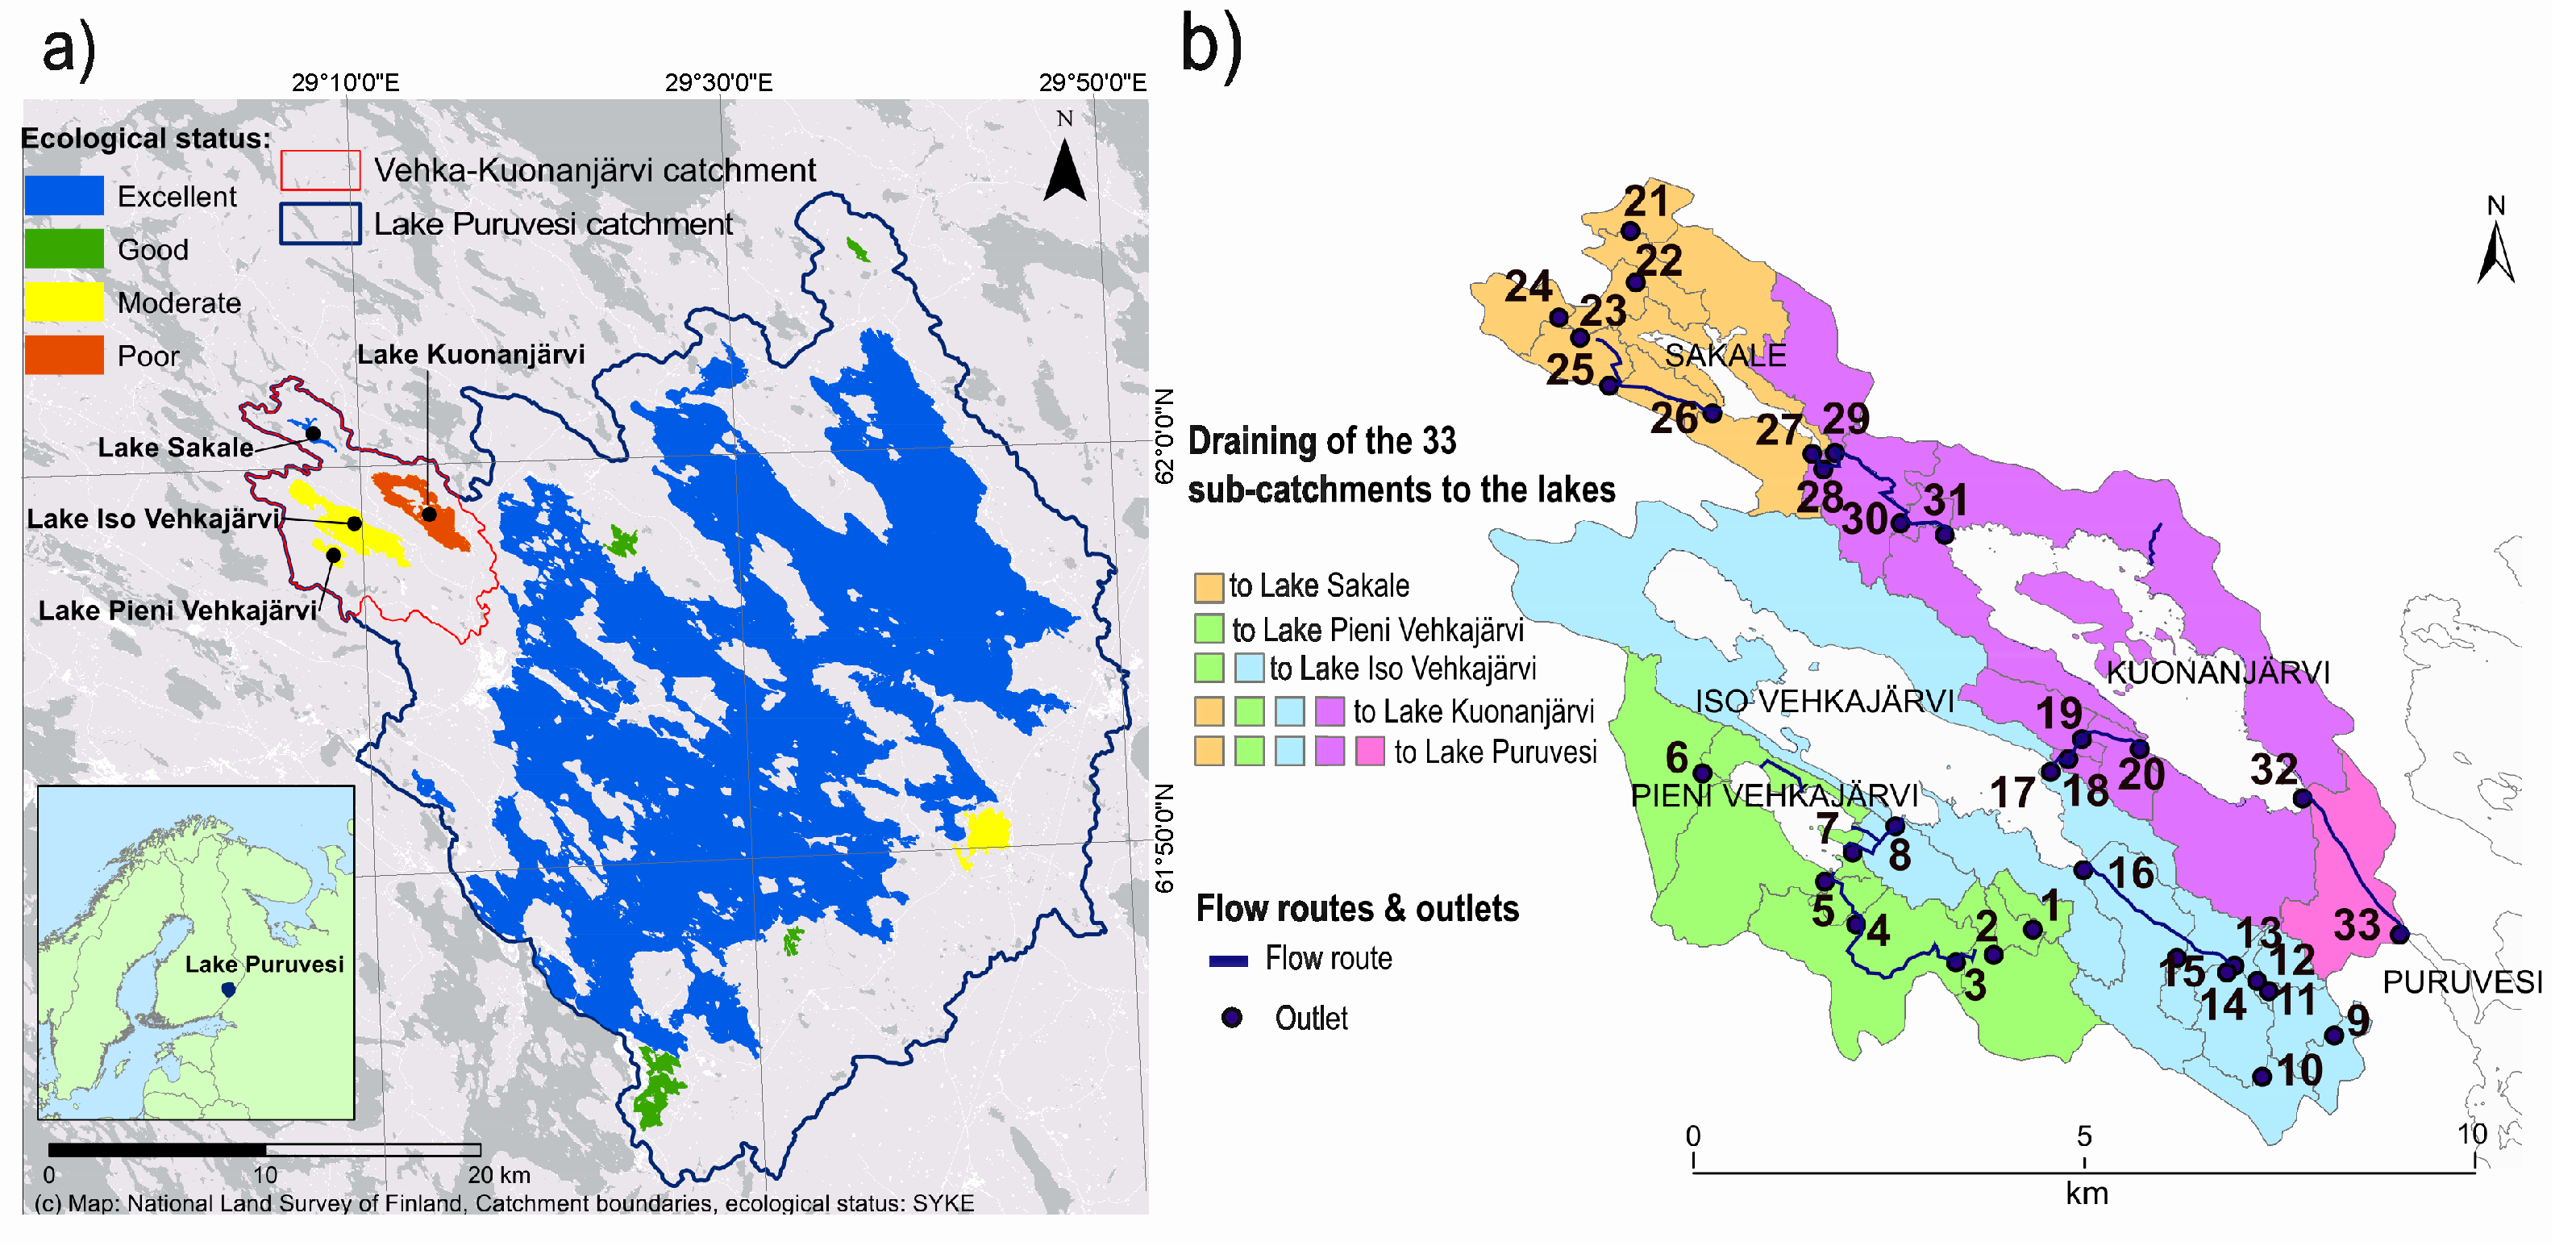
2.1. Study Area

The study area, Vehka-Kuonanjärvi catchment (7300 ha) belongs to a larger Lake Puruvesi catchment, located in southeastern Finland (Lat 61°58 45 , Lon 29°12 10 ) (Figure 1). Lake Puruvesi represents an exceptionally oligotrophic and clear water lake (416 km2) belonging to the Natura 2000 network. The ecological status of the lakes in the study area is classified from excellent to poor. Forestry activities and changes in air temperature, precipitation and runoff induced by climate change are expected to increase the N and P load risk for these lakes [9,37].
The Kuonanjoki river drains the waters of the Vehka-Kuonanjärvi catchment to the Lake Puruvesi. Due to its poor ecological status, Lake Kuonanjärvi requires nutrient reduction measures. Land cover in the Vehka-Kuonanjärvi catchment is dominated by forest (75% of area), of which 74% is on mineral, glacial till, and 26% on peatland mainly drained for forestry in 1950s–1970s. Forests consists mainly of coniferous species i.e., Norway spruce (Picea abies (L.) H. Karst.) and Scots pine (Pinus sylvestris L.), mixed with deciduous species, such as Silver and Downy birch (Betula pendula Roth and B. pubescens Ehrh.). Agricultural land covers 4% and water bodies 21% of the total catchment area. Vehka-Kuonanjärvi catchment is further divided into 33 sub-catchments for the study, area varying from 9 to 1843 ha in size (Table S1 in Supplementary Materials).

2.2. NutSpaFHy

Monthly nutrient export from forested areas was calculated running NutSpaFHy model in 16 m × 16 m grid [11] with the input data of the study area. In the model, daily grid-cell hydrology is calculated with SpaFHy [36], which is aggregated to monthly time-step for local nutrient balance calculation based on nutrient release from organic matter decomposition and input from atmospheric deposition; and nutrient uptake by forest and ground vegetation. Nutrient export follows a transport model, which accounts for nutrient retention and transport delay as a function of the distance to nearest water body (for details, see [11]). The model was run separately for the 33 sub-catchments in the study area (Figure 1). The model gives the total nitrogen and total phosphorus export in kilograms dissolved in the water draining from the forested areas, the instream and lake processes are not accounted for in the model.
NutSpaFHy requires immobilization parameters for N and P release for mineral soils and peat areas. The sub-catchment features of the study area were used to compose the N immobilization parameters using the regression model presented in [11] including main site type, site fertility class, mineral and peat areas, total tree volume and coniferous tree volume. Furthermore, following [11], the parameters for P immobilization were taken as an average of 12 catchments distributed across boreal forested region in Finland. Model performance was evaluated against reported nutrient loads measurements.
Clear-cuts were considered in the model by updating the stand volume, height, age, leaf area and ground vegetation biomass for the grid cells under the clear-cut. After the clear-cut the growth followed the site specific growth curve from age 0 until the end of the simulation. Ground vegetation nutrient uptake was downscaled at the clear-cut event to one third to mimic the harvesting disturbance.

2.3. Input Data

Spatial data on forest resources, soils, topography and weather were gathered from various sources (Table 1). Stand-wise information on tree species, leaf/needle and root biomass, age, stem volume, stand height, basal area and site fertility were derived for privately owned forests (87%) from the open forest inventory data (FID) of the Finnish Forest Centre (FFC) [38], and for the publicly owned forests from the Multi-Source National Forest Inventory data (MS-NFI) provided by the Natural Resources Institute Finland [39]. The FID and MS-NFI data and their integration are described in detail by Leinonen et al. [40]. Other input data included digital elevation model (DEM) [41], and its derivatives (slope and Topographic Wetness Index, TWI [42]), soil data [43], as well as peatlands, bare rock areas, and road and water elements [41].
All spatial data were converted (if not inherently) to 16 m × 16 m grid resolution. Non-forest grid cells were no-data in both FID and MS-NFI and nutrient balance was not calculated in those grid cells. Coverage of the sub-catchment area, where nutrient balance was calculated, varied between 63–100% (92% on average) (Table S1).

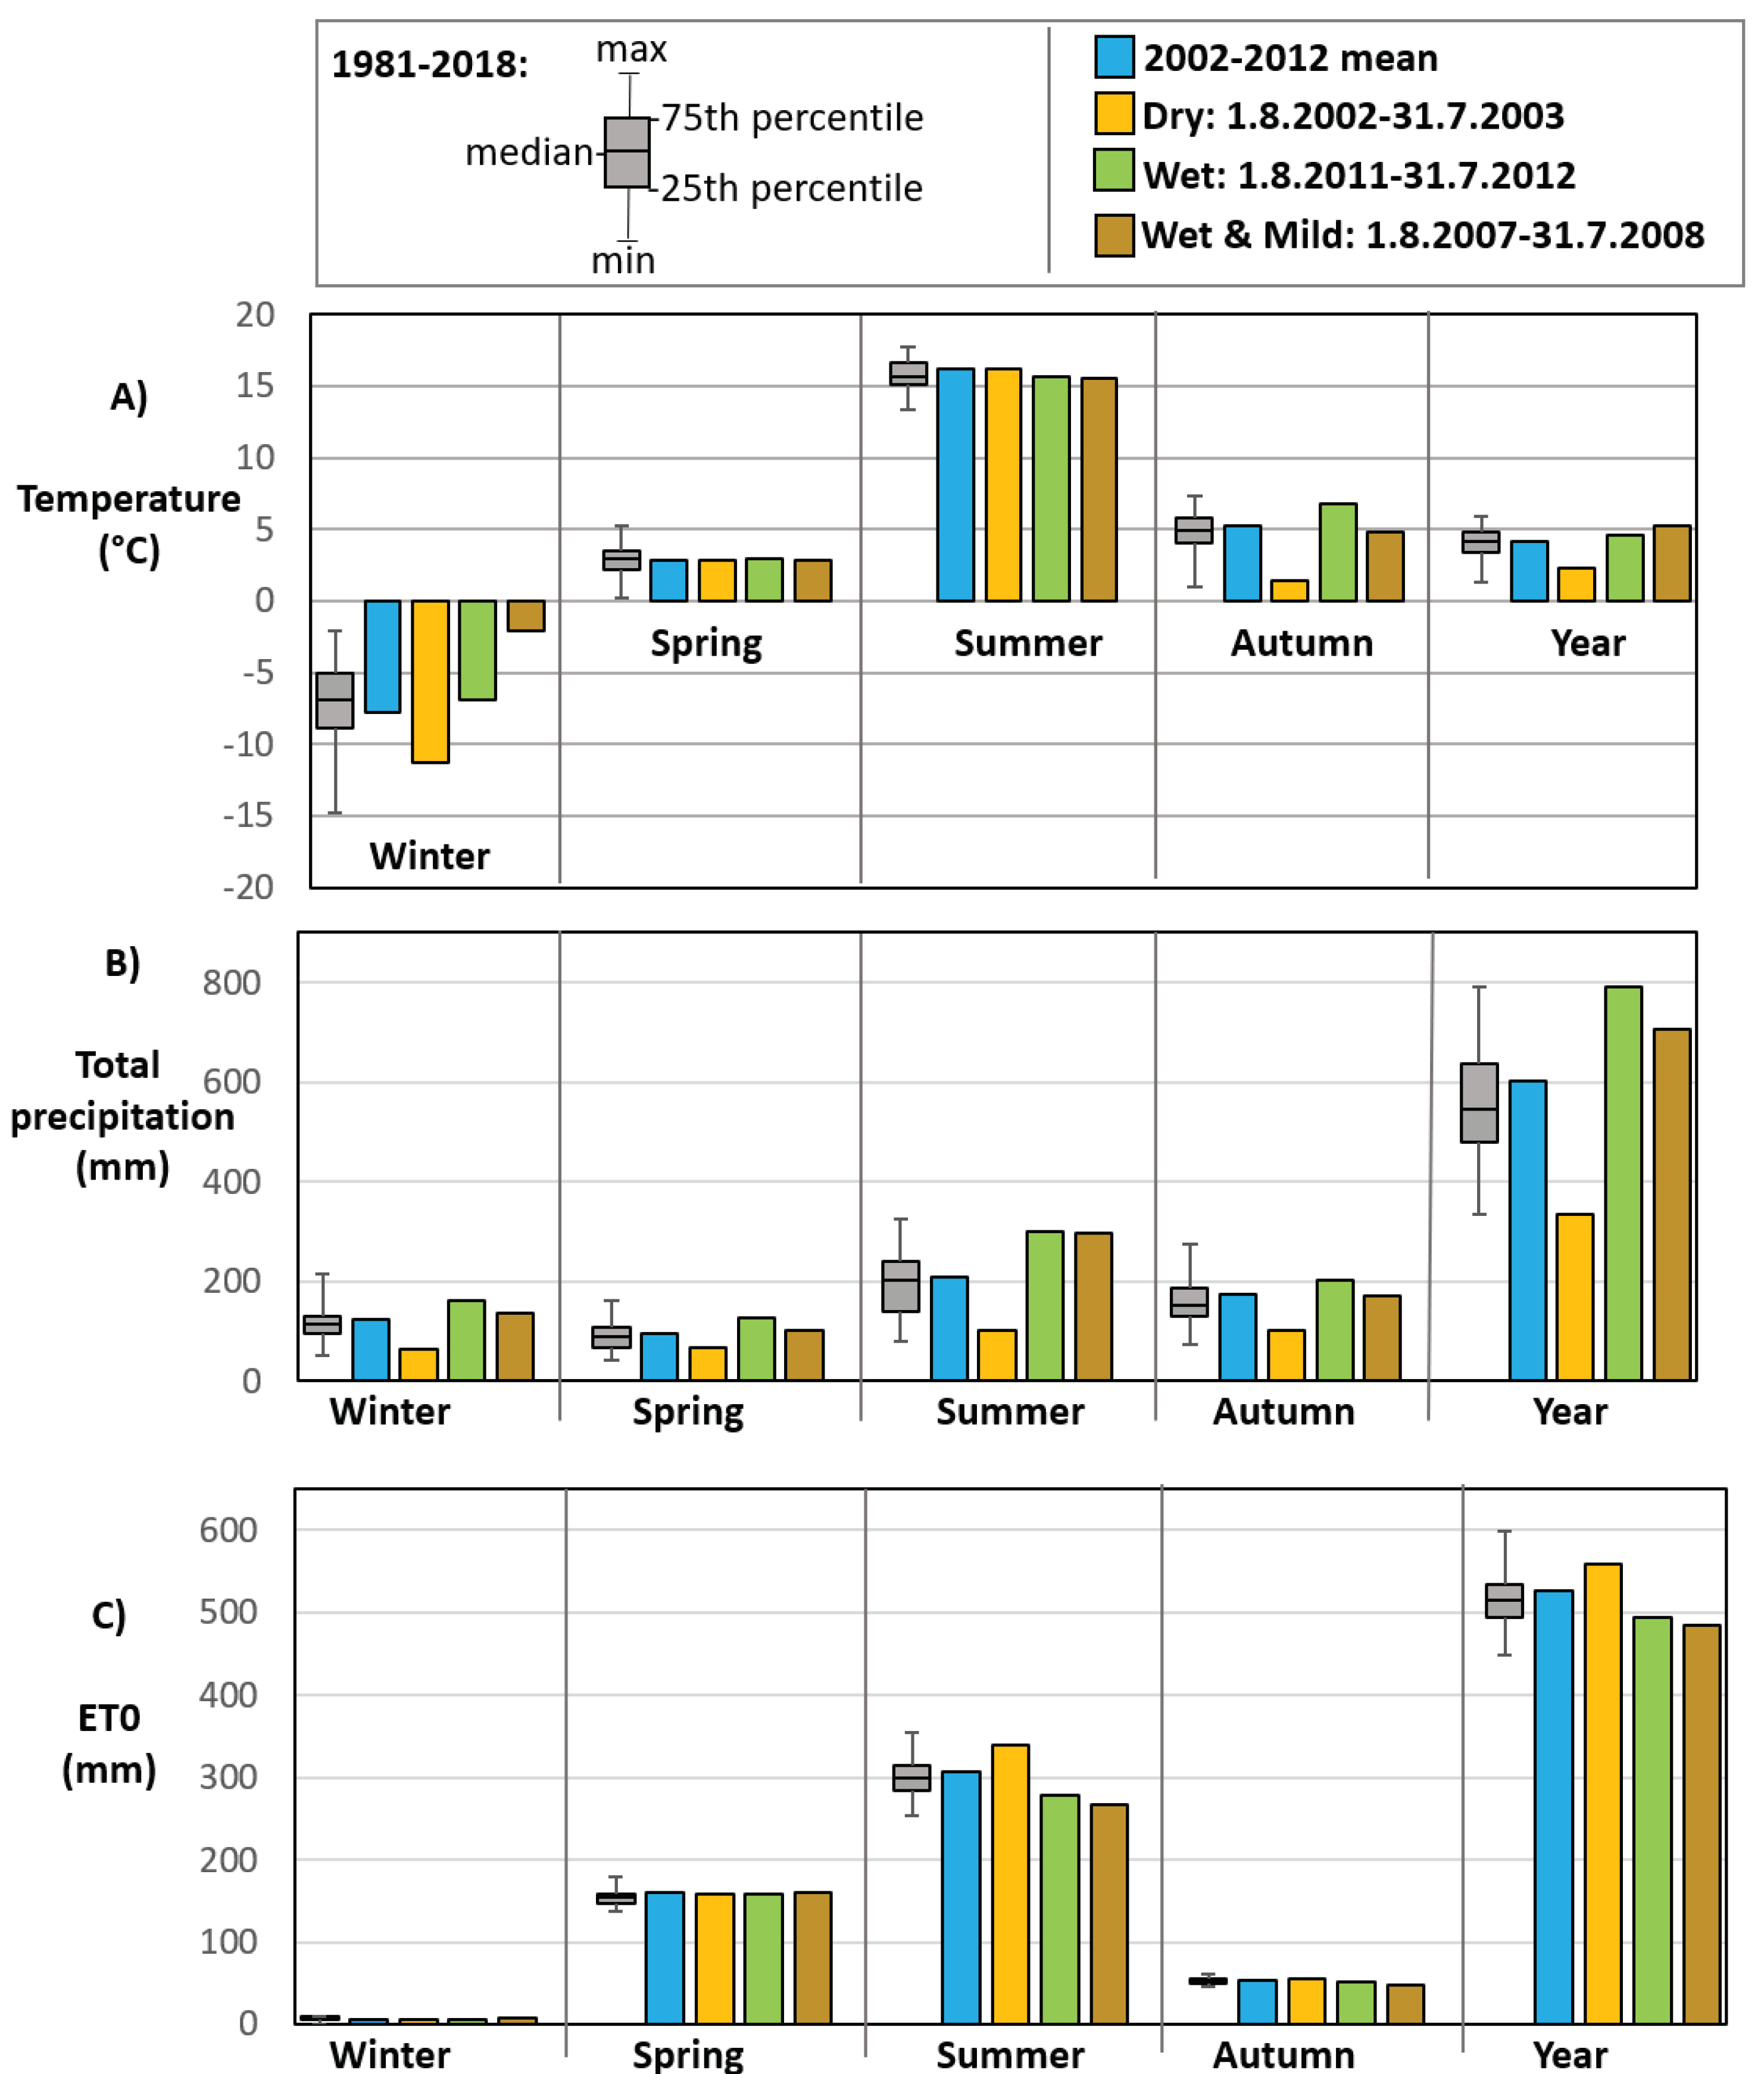
2.3.1. Weather Scenarios

The weather data included mean daily air temperature and precipitation, global radiation, temperature sum of growing season (threshold +5 °C), and relative humidity [46]. The NutSpaFHy simulations were run by using 11 years weather data, and the results were examined excluding the first year to account for a general 10-year period of clear-cut effect. First year was a spin-off year to set up the initial values for the state variables. Four different 11-years-long weather scenarios (2002–2012 as baseline, dry, wet, and wet & mild) were constructed from an interpolated weather data in 10 km grid extending from 2002 to 2012 [46]. Roughly one weather data grid cell covers the Vehka-Kuonanjärvi catchment area.
We use as baseline the observed weather data of the period 2002–2012. This represented rather well the median of the long-term (1981–2018) seasonal and annual means in temperature, precipitation and reference evapotranspiration (ET0) (Figure 2).
The weather scenarios were constructed to describe the extreme dry, wet and wet & mild years present in the weather data from 2002–2012. The effect of such years on the nutrient export was examined by repeating the weather period over the simulation time. The dry scenario was constructed by repeating 11 times the dry period observed during 1 August 2002–31 July 2003. In this period, high-pressure conditions were frequently occurring, resulting in lower than the median of the long-term (1981–2018) means in precipitation in all 3-month seasons (winter: December–February, spring: March–May, summer: June–August, and autumn: September–November). In addition, the mean summer air temperature was above, whereas the mean winter temperature was below the median of the long-term (1981–2018) means in seasonal temperatures accordingly.
The wet scenario was a repetition of the weather observed during 1 August 2011–31 July 2012 that was wetter than the median of the observed long-term (1981–2018) means in precipitation. During this period, the mean precipitations exceeded the median of the observed long-term (1981–2018) means in precipitation during all seasons. Moreover, the mean temperature was higher than the baseline mean in all seasons except for summer. Also February, April, and June were actually cooler than the median of the observed long-term (1981–2018) means in temperature.
The wet & mild scenario was a repetition of the period 1 August 2007–31 July 2008. During winter 2007–2008 the weather in Fennoscandia was dominated by southerly and westerly winds and low-pressure systems arriving from the North Atlantic Ocean leading to a winter significantly wetter and milder than the median of the observed long-term (1981–2018) means in precipitation and winter temperatures. Also, autumn 2007 and spring 2008 were slightly warmer while precipitation levels were close to the baseline mean. June–July 2008 was in turn cooler and rainier than the median of the observed long-term (1981–2018) means in temperature and precipitation. The 12-month period to be repeated began in summertime (July–August), so there was no discontinuation in the wintertime snow cover. Figure 2 displays as boxplots the range of the seasonal mean temperatures, total precipitation amounts, and ET0s in the study region during 1981–2018, and as bars the mean temperature, total precipitation and ET0 for the selected four weather periods. The ET0 was calculated by R package ‘SPEI’ [47] according to Hargreaves [48] and was used for comparing different years in Figure 2.

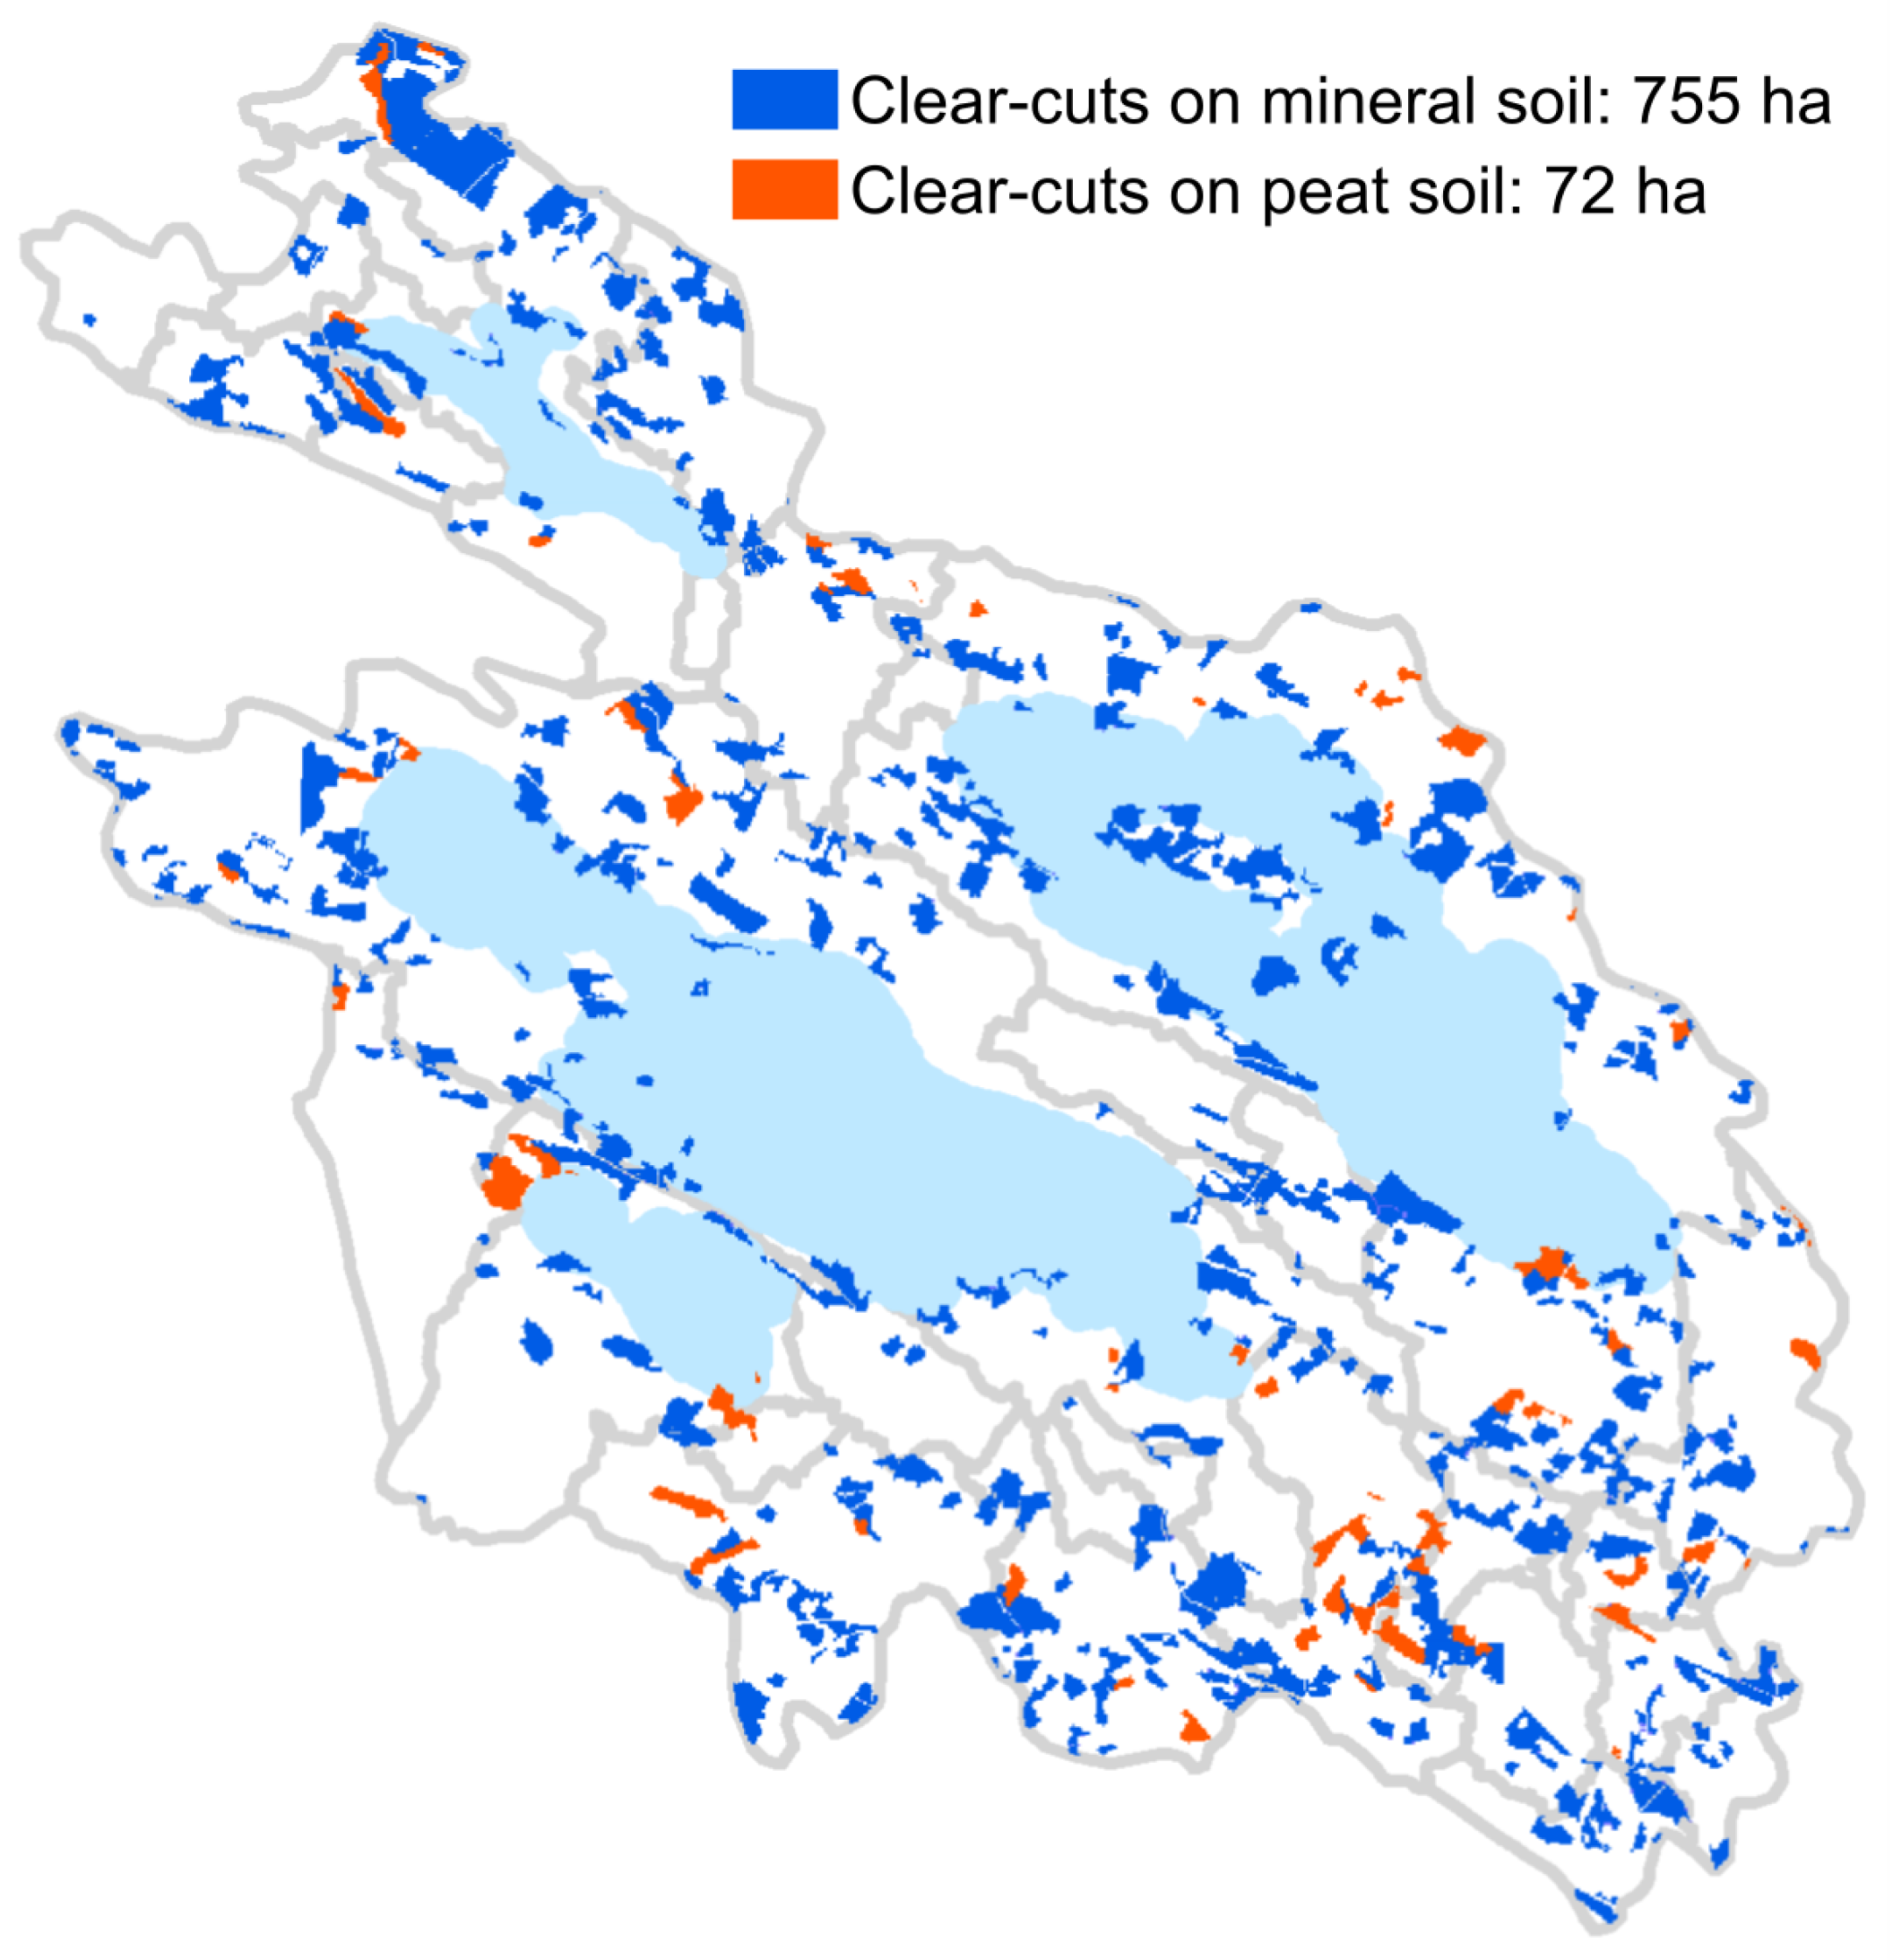
2.3.2. Clear-Cut Scenarios

Two harvesting scenarios (‘no clear-cuts’ and ‘all clear-cuts’) were used to examine the effect of clear-cuts under different weather scenarios. The ‘all clear-cuts’ scenario was based on the FID data on forest stands, which had reached the economical regeneration maturity. This means that they are ready for clear-cut in the near future, if so decided by the landowner. The clear-cuts were all set to occur simultaneously in March on the first year of the simulation period after the spin off year. In the ‘no clear-cuts’ scenario no clear-cuts were made during the simulation period.
In the ‘all clear-cuts’ scenario, 755 ha were harvested on mineral soils and 72 ha on drained peatlands, together accounting for 14% of the forest area in the Vehka-Kuonanjärvi catchment (Figure 3). In Finland, on average 2% of the productive forest area is regenerated annually [49], thus, the total harvested area in the ‘all clear-cuts’ scenario was considerably larger that would be cut in one year but is 70% of the amount that would typically be harvested during a ten-year period. In the ‘all clear-cuts’ total of 250,000 m3 timber was harvested.

2.4. Calculations and Mapping of Hotspots

The model outputs include sub-catchment and grid cell level N and P export (kg ha−1). We calculated the annual average for each sub-catchment from the monthly N and P export results with each weather and clear-cut scenario combination (Table 2). The specific export (SN,P, kg ha−1 year−1) that indicates the excess nutrient export induced by clear-cuts, was calculated with Equation (1):
S N , P = E N , P a l l C C E N , P n o C C A C C ,
where EN,P all CC is the N or P export (kg year−1) for the ‘all clear-cuts’ scenario, EN,P no CC is the N or P export (kg year−1) for the ‘no clear-cuts’ scenario, and ACC is the area under the clear-cuts (ha). We further calculated the export (kg year−1) accumulated to the Lake Kuonanjärvi by summing the exports from the sub-catchments draining to the lake. Also the average N and P concentrations ( μ g L −1) were calculated.
For nutrient export hotspot identification, we used model outputs on two levels: sub-catchment and grid cell level. The hotspots were identified by interpreting the results and mapped (1) those sub-catchments, where weather and/or clear-cut scenarios produce highest difference compared to the baseline export (EN,P, base; i.e., 2002–2012 period with no clear-cuts), and (2) those grid cells that contribute above the average export per grid cell calculated for the baseline scenario.
In order to explore the factors causing higher differences in nutrient export in some sub-catchments due to change in weather compared to EN,P, base, we applied correlation analysis. The differences between the export (both N and P) by each scenario and EN,P, base were explored with correlation analysis against various sub-catchment characteristics. The characteristics calculated for the sub-catchments using the FID data and other spatial data included deciduous tree volume (m3 ha−1), mean distance to water body (m), open area percentage calculated based on tree volume (% < 10 m3 ha−1 and <2 m3 ha−1 representing recent clear-cut areas), biomass (10 kg ha−1), peatland area percentage and median site fertility class (sfc) (Table S1). The same characteristics were analysed in [40].

3. Results

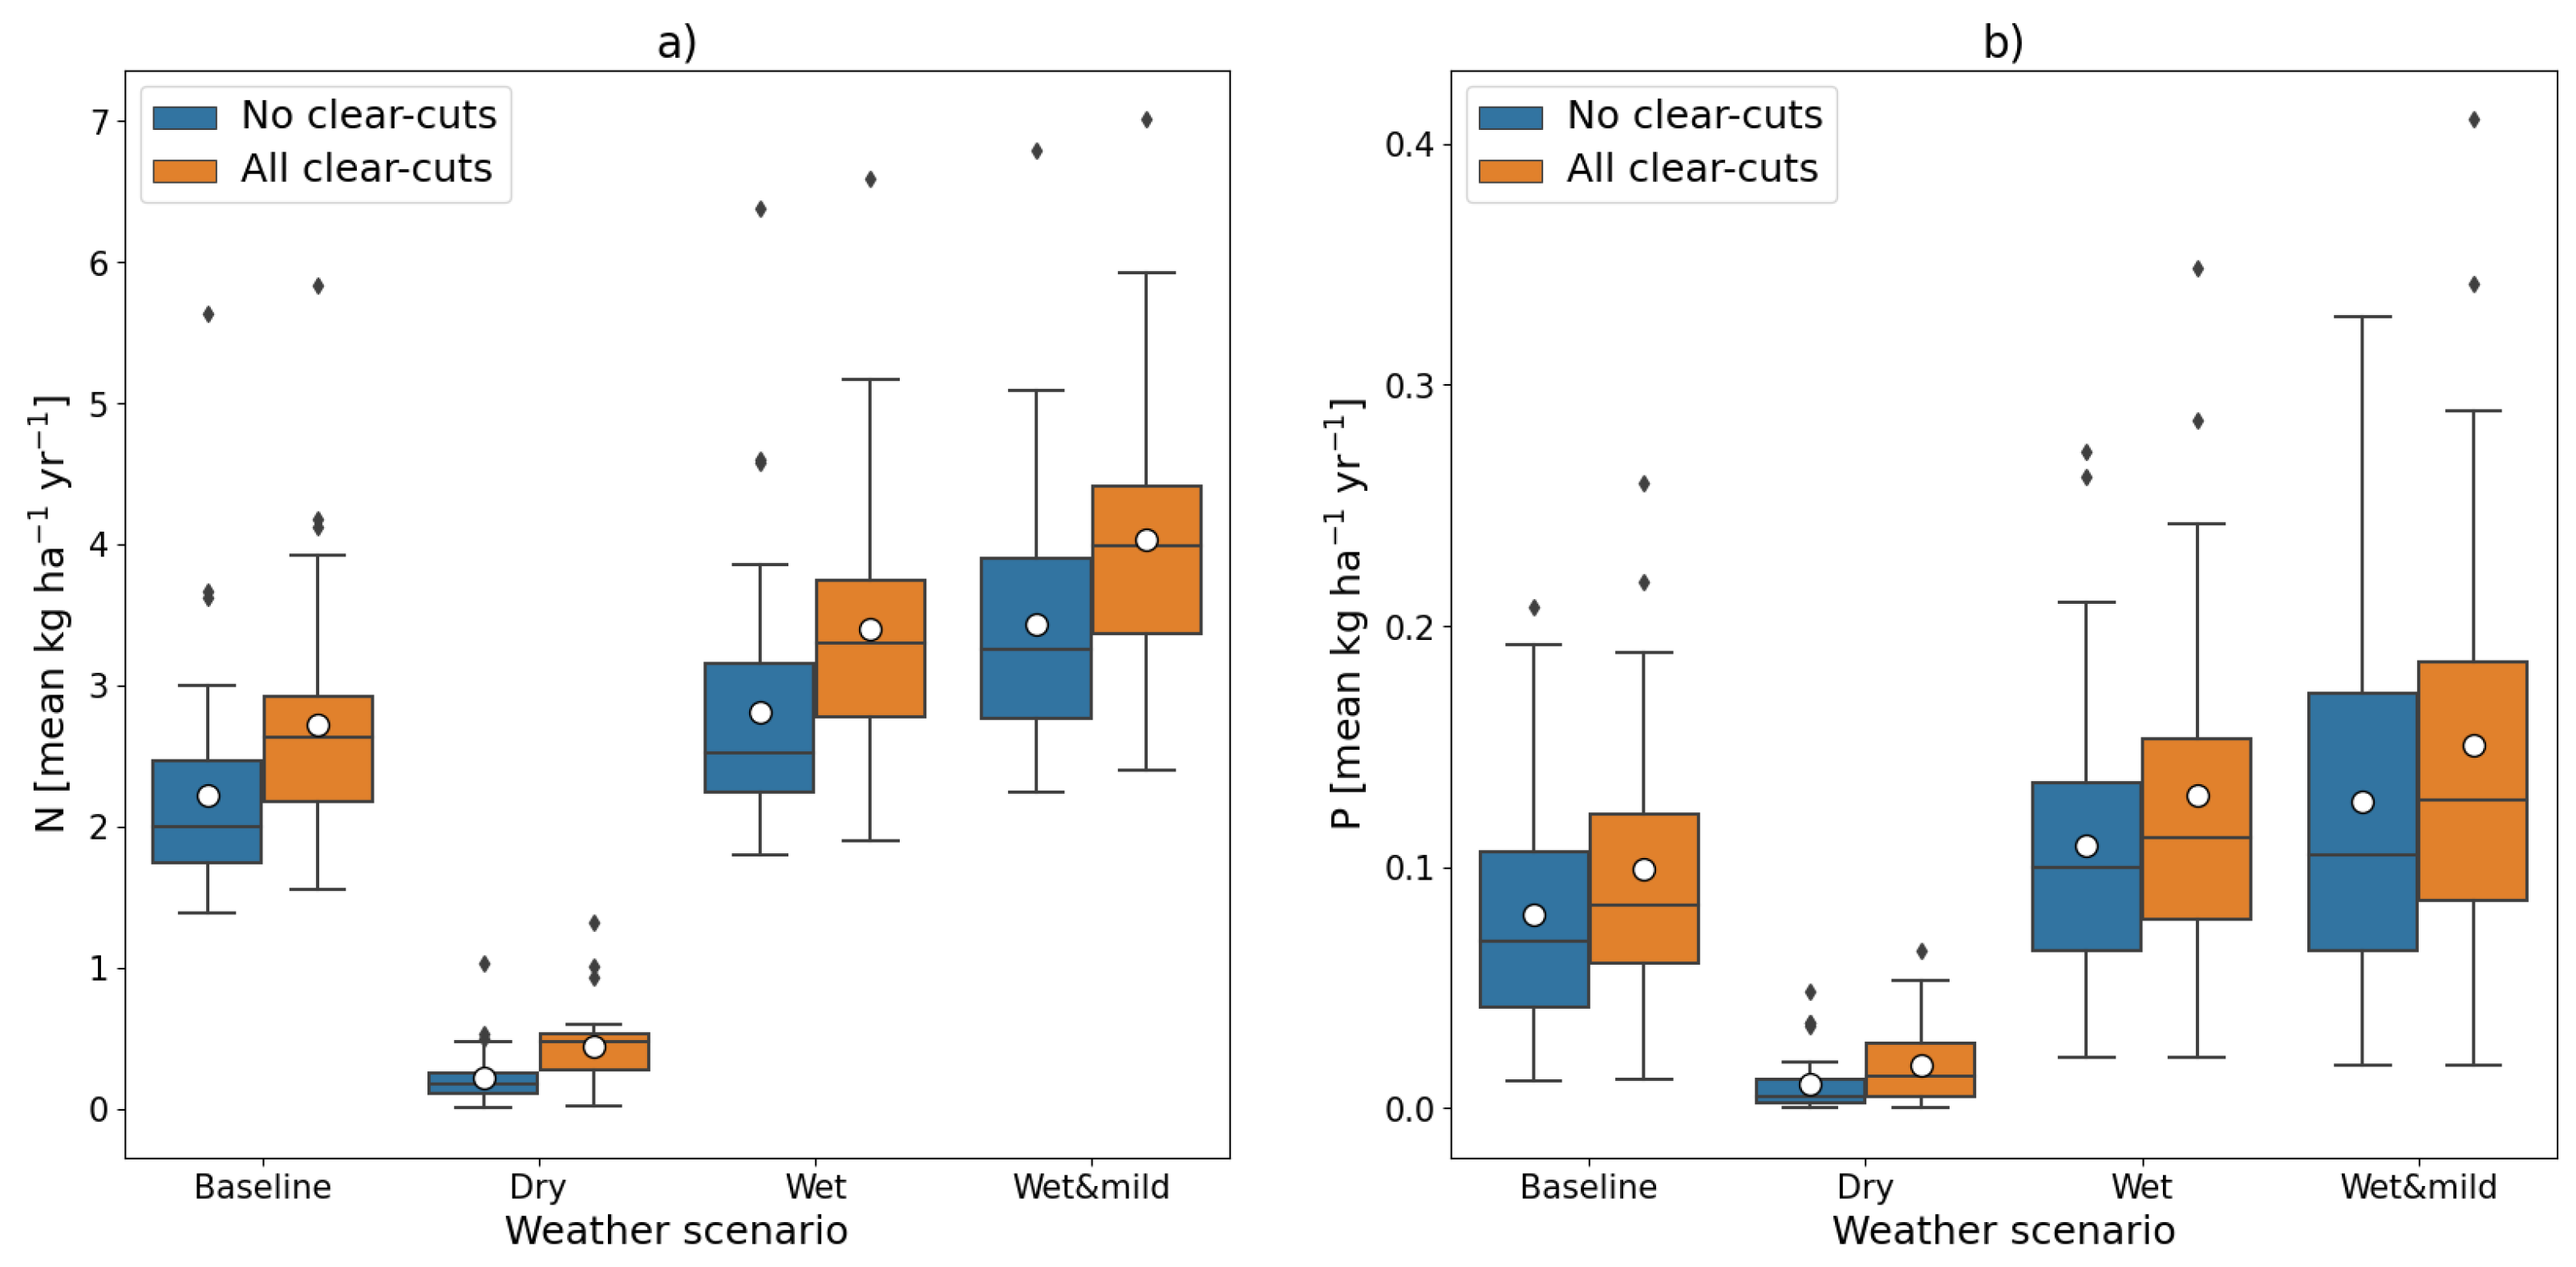
3.1. The Effects of Clear-Cuts and Extreme Weather on the Nutrient Export

Clear-cuts and extreme weather scenarios changed remarkably the exports from the sub-catchments compared to the baseline scenario of 2002–2012 (EN,P, base) for which the average export for N was 2.22 kg ha−1 year−1 and for P 0.08 kg ha−1 year−1 (Figure 4, detailed results per sub-catchments in Table S1). Without clear-cuts both N and P export were on average 55% (3.43 kg ha−1 year−1, N) and 58% (0.127 kg ha−1 year−1, P) higher in the wet & mild scenario than in the EN,P, base. In the wet scenario, N export was, on average, 27% higher and P export 35% higher compared to EN,P, base; whereas, in the dry scenario, N and P exports were only a tenth of the exports in the EN,P base (0.22 kg ha−1 year−1 for N and 0.010 kg ha−1 year−1 for P). The ‘all clear-cuts’ scenario with baseline weather increased both the N and P export by 23% compared to EN,P, base. The export increase caused by wet & mild weather was significantly higher than that induced by the clear-cuts. The variation in exports between the sub-catchments increased also in the wet & mild scenario compared to that of the EN,P, base (Figure 4).
The clear-cuts increased the export in all weather scenarios (Figure 5). The specific export caused by clear-cuts increased when weather conditions became wetter. For baseline period the average specific N export was 3.33 kg ha−1 year−1 and average specific P export was 0.138 kg ha−1 year−1. However, the variation between sub-catchments was high even in the baseline weather period. Variations in specific exports for both N and P were highest in the wet scenario, while the average specific export increased most in the wet & mild scenario and reached 4.00 kg ha−1 year−1 for N and 0.171 kg ha−1 year−1 for P.
The sum of N and P exports from the 33 sub-catchments to Lake Kuonanjärvi varied remarkably between different extreme weather scenarios (Table 3). The concentrations increase less compared to the kilograms since there is also a higher runoff and it dilutes the concentrations. The runoffs are roughly 38% higher in the wet & mild scenario than in the baseline period (average being 240 mm year−1 for the 33 sub-catchments, Table 3). In the wet scenario the average runoffs were 64% higher while in the dry scenario they were only one sixth of the runoffs in the baseline period.

3.2. Nutrient Export Hotspots

We identified the clear-cut and weather induced nutrient export hotspots on the sub-catchment level by creating factorial map arrays (Figure 6 and Figure 7), which indicate the differences between the combinations of clear-cut and weather scenarios. The baseline weather with no clear-cuts represents the minimum export (Figure 6a and Figure 7a) and the wet & mild with all clear-cuts represent the maximum export (Figure 6h and Figure 7h). The factorial map array enables exploring change in export when either one or both of the scenarios occur. The grid cell level hotspots (Figure 8 and Figure 9) show the increase in the number of grid cells that produce above the baseline average export per grid cell, and therefore, enable exploration of high export areas within the sub-catchments.
The hotspots were somewhat different for N and for P. Generally, the extreme weather scenarios, particularly that of wet & mild, imposed larger increase in the export than the clear-cuts alone; however, the combined impact of the weather and the clear-cuts was even more pronounced. For N, the change in weather impacted all the sub-catchments in rather a similar quantity and there were less sub-catchments that stood out (Figure 6g), but for P, the sub-catchments that were hotspots in the baseline scenario also got the highest increase in export in the wet & mild weather scenario and stood out as hotspots (Figure 7g).
The correlation analysis showed that in wet & mild scenario both N and P exports increased with deciduous tree percentage compared to the baseline (Figure 10) (the difference is shown in Figure 6g and Figure 7g). N and P exports increased also with decreasing stand age and volume with respect to the baseline (Figure 10, volume as percentage of open areas). Decreasing site fertility (sfc) was connected to lower N and P export increase from the baseline, meaning that in fertile sites the increase was higher. The peat percentage was negatively correlated with P export (−0.24) and with N export (−0.15), suggesting that increase in export due to change in weather is relatively lower in sub-catchments with high percentage of peatlands compared to other sub-catchments.

4. Discussion

Nutrient export from forested catchments to surface waters is a complex process that is simultaneously affected by weather conditions, catchment characteristics and forest management [17,50,51,52,53,54]. Here we present a model application, where the role of the contributing factors can be quantified, and the effect of varying weather conditions can be compared to the effect of forest management. This approach allows identification of nutrient export hotspots for planning forest management and water protection, and prediction of climate change effect on nutrient concentrations in surface waters. The simulated N and P export in the baseline scenario (Table 3) were similar to those measured for managed boreal catchments [12,24,53,54] and simulated concentrations were in line with the 38.2 μ g L−1 for P and 1048 μ g L−1 for N (means of period 2008–2018), reported for Lake Kuonanjärvi (Table 43, 44 and 45 on p.85 in [55]), giving a good basis for the model application in weather and forest management scenarios. However, in the absence of sufficient time series for a thorough morel performance evaluation, the result should be interpreted in relative terms.
The results suggested that extreme weather conditions significantly influence nutrient export. Extreme weather and forest operations together can yield non-uniform increase in nutrient leaching across the catchments (Figure 6h and Figure 7h). Moreover, the exports increase more due to increasing winter air temperatures and precipitation in the wet & mild scenario than due to clear-cutting alone (Figure 4, Table 3). Runoff seems to be in a key role in the nutrient export and also in explaining how much the effect of clear-cuts is affected by the weather conditions. The wet scenario with the highest runoff (Table 3) also increased the nutrient export, but overall this increase was lower compared to the wet & mild scenario. Thus, it matters, when the runoff occurs. The runoff is higher outside the growing season in the wet & mild scenario compared to the wet scenario, especially during autumn season with lower temperatures (Figure S1 and Figure 2), thus potentially causing higher nutrient exports due to earlier end of growth season and higher runoff. Further, if the time when the soil is under frost decreases, the organic matter decomposition outside growing season increases the amount of mobile nutrients that can leach to water bodies. In the dry scenario, the nutrient export was low because of weaker transport of nutrients to the receiving water body. While the probability of the used extreme weather scenarios is low, i.e., there will unlikely occur ten consecutive years of wet & mild weather; they give valuable information on the scale and interactions in which the weather and the clear-cuts influence the nutrient export.
The results suggested that due to the significant impact of the weather on nutrient exports, water protection might become increasingly difficult and inefficient in the changing climate. To mitigate the increasing nutrient exports induced by potentially wetter weather with mild winters, water protection structures and/or less intensive forest management have to be targeted to the areas, where the nutrient export risk is highest i.e., the hotspots. This study identified sub-catchments and areas within the sub-catchments that would be hotspots in case of weather change for wet & mild (Figure 6, Figure 7, Figure 8 and Figure 9). The hotspot maps can also be used to infer the areas that will go through largest increase in the nutrient export (Figure 6h,f and Figure 7h,f).
Since the studied area fits within one 10 km × 10 km grid cell of the weather data, the change in weather conditions influences the whole study area similarly. However, different areas stood out in having higher sensitivity than others, particularly to P export increase (Figure 7g). The correlation analysis revealed that both N and P export increment in wet & mild scenario compared to the baseline was higher for catchments where the deciduous tree volume was high or where the open areas dominated (Figure 10). This might be related to the fact that deciduous trees favour fertile sites with higher soil moisture [56]. These areas might also experience higher increases in nutrient export due to the increased runoff, which applies also to the open areas with less trees. Leinonen et al. [40] studied the effect of catchment characteristics on the background nutrient export in the baseline weather period using the same study area. The catchment characteristics that were strongly positively correlated with the N export increase in wet & mild scenario, got lower correlation coefficients in [40]. For P export, the correlations in this study and in Leinonen et al. [40] were rather similar, i.e., similar areas produce high P export and experience highest increases in P export due to changes in weather conditions.
Peatlands require special attention in forest management planning, because they can be sinks or sources of N and P depending on their management [12,15,53,57,58,59,60]. We found that the higher the peat percentage and the presence of low fertility site classes (sfc) indicate lower increase both in N and P export when changing from the baseline weather to wet & mild scenario. For P export, this might be due to the large area of low-fertility peatlands present in the area. Leinonen et al. [40] found that an increase in peat percentage contributed to higher background N load. Previous studies [12,51,53] also suggest that peat percentage is an important factor in regulating nutrient export. Accordingly, higher percentage of peat contributed to higher N export already in the baseline weather (Figure 6a), and therefore, the changes due to extreme weather conditions remained modest.
Under the wet & mild scenario, the grid-wise hotspots in N and P export (Figure 8 and Figure 9) consisted especially of open areas, where the soil moisture is likely to increase with small interception and evapotranspiration. This suggests that clear-cuts might amplify the weather effect on the increasing export, and therefore avoiding clear-cuts, e.g., by applying continuous cover forestry, might result in higher resiliency towards extreme weather conditions.
In Lake Kuonanjärvi, the annual P load is 630 kg [55], which should be reduced by 110 kg [61] to be able to improve the ecological status of the the lake. According to the results, forest areas in the ‘all clear-cuts’ scenario under the current weather contribute altogether 524 kg year−1 of P (Table 3), while the export in the ‘no clear-cuts’ scenario was 111 kg year−1 less. This suggest that decreasing the clear-cut area has potential to improve the water quality. However, according to [55], the internal loading in the Lake Kuonanjärvi has already collapsed the P retention system of the lake, and thus, the impact of reducing the external loading may remain small. Even though forest management could not achieve the reduction targets alone, any reduction in the external load gained with well-targeted water protection structures and adjusted forest management practices become valuable [55].
Without modelling, the examination of the range in which nutrient export can vary would be difficult due to the complexity of influencing factors and underlying biogeochemical processes. However, particularly modelling the P export has several uncertainties ([11]). More research is needed concerning the ground vegetation dynamics after harvesting and site preparation. The nutrient transport sub-models from grid cells to the receiving water body should also be further developed considering the interaction and hydraulic connectivity between grid cells. Furthermore, concerning the P export, the model structure should be developed to differentiate between the unmanaged and managed peatlands to better account for the influence of drainage on the nutrient export.

5. Conclusions

Due to the ongoing climate change, the mean temperatures and the annual total precipitation rates are projected to increase in Finland and other Nordic countries [62], which might lead to increased nutrient export [9]. Forest regeneration with clear-cutting further increases these risks, and can amplify the effect of runoff increase on nutrient leaching, particularly in drained peat land forests [37]. Spatially explicit nutrient release and transport modelling enables considering multiple factors that simultaneously influence the complex dynamics of nutrient export. Based on the results presented, it seems that the potential changes in the weather can cause significant increases to the nutrient export, and therefore, the water protection needs to be targeted efficiently and covering also areas outside direct forest operations. Our approach can be used to locate nutrient export hotspots in the forest landscape now and in the changing climate to steer water protection efforts, and to adjust forest management by applying precision forestry. While the effect of changing climate is on larger scale than our study area, it was also clear in our results that the changes in weather will not be equally distributed. Besides spatial variation, also temporal changing of runoff peaks and the interplay of temperature and precipitation cause the impacts on the nutrient export to be difficult to predict without a modeling approach. Adding the impact of forest management to the assessment and considering the inability to fully influence on timing and location of clear-cuts, mitigating nutrient export is a very challenging task. Despite of the uncertainties, the strength of the modelling is in the ability to test beforehand the spectrum of conditions and management possibly occurring in the future, which is needed in the search for environmentally responsible forest management. While timing of forest operations might not be possible to plan in terms of considering the coming decade’s weather, the location and type of operation can be considered to balance wood extraction and nutrient export. Furthermoe, while these results can only be interpreted in relative terms, they also reveal the needs for further development of, for example, P modelling and the inclusion of differing characteristics of drained and undrained peat lands. Modelling approaches are needed to identify and to develop the best strategies to mitigate the deterioration of the surface waters. This study quantified the role of weather for nutrient export and made it comparable to management impacts.

Supplementary Materials

The following are available online at https://www.mdpi.com/article/10.3390/f14010089/s1, Table S1: Sub-catchment data and results, and Figure S1: Seasonal runoff in weather scenarios.

Author Contributions

Conceptualization, A.S., A.L. (Annamari (Ari) Laurén), M.P., L.F. and A.L. (Antti Leinonen); methodology, A.L. (Annamari (Ari) Laurén), A.S., M.P., A.L. (Antti Leinonen), L.F., N.K. and H.T.; writing—original draft preparation, A.S.; writing—review and editing, L.F., A.L. (Annamari (Ari) Laurén), A.L. (Antti Leinonen), N.K., H.T., M.P., L.U. and S.L.; visualization, A.S.; supervision, L.F. and A.L. (Annamari (Ari) Laurén). All authors have read and agreed to the published version of the manuscript.

Funding

This research was funded by OPERANDUM EU Horizon 2020 project grant agreement No. 776848, Academy of Finland (325168, 325169, 326831, 348103, 323997, 323998), and Ministry of Agriculture and Forestry project “Kokonaiskestävää puuntuotantoa turvemailta SUO”.

Institutional Review Board Statement

Not applicable.

Informed Consent Statement

Not applicable.

Data Availability Statement

Data used in this study are publicly available and are reported in Table 1. The results are provided in Table S1 of the Supplementary Materials.

Acknowledgments

The authors would like to thank the anonymous reviewers for their valuable comments.

Conflicts of Interest

The authors declare no conflict of interest. The funders had no role in the design of the study; in the collection, analyses, or interpretation of data; in the writing of the manuscript, or in the decision to publish the results.

References

  1. WFD. Water Framework Directive. Directive 2000/60/EC of the European Parliament and the Council of 23 October 2000 establishing a framework for community action in the field of water policy. Off. J. Eur. Communities 2000, 327, 1–73. [Google Scholar]
  2. Röman, E.; Ekholm, P.; Tattari, S.; Koskiaho, J.; Kotamäki, N. Catchment characteristics predicting nitrogen and phosphorus losses in Finland. River Res. Appl. 2018, 34, 397–405. [Google Scholar] [CrossRef]
  3. Basnyat, P.; Teeter, L.; Flynn, K.; Lockaby, B.G. Relationships Between Landscape Characteristics and Nonpoint Source Pollution Inputs to Coastal Estuaries. Environ. Manag. 1999, 23, 539–549. [Google Scholar] [CrossRef] [PubMed]
  4. Evans, D.; Schoenholtz, S.; Wigington, P.; Griffith, S.; Floyd, W. Spatial and temporal patterns of dissolved nitrogen and phosphorus in surface waters of a multi-land use basin. Environ. Monit. Assess. 2014, 186, 873–887. [Google Scholar] [CrossRef] [PubMed]
  5. Malve, O.; Tattari, S.; Riihimäki, J.; Jaakkola, E.; Voss, A.; Williams, R.; Bärlund, I. Estimation of diffuse pollution loads in Europe for continental scale modelling of loads and in-stream river water quality. Hydrol. Process. 2012, 26, 2385–2394. [Google Scholar] [CrossRef] [Green Version]
  6. Taka, M. Key Drivers of Stream Water Quality Along an Urban-Rural Transition—A Watershed-Scale Perspective. Ph.D. Thesis, Department of Geosciences and Geography, University of Helsinki, Helsinki, Finland, 2017. [Google Scholar]
  7. Vesistöjen Kuormitus ja Luonnon Huuhtouma. 2020. Available online: https://www.ymparisto.fi/fi-fi/kartat_ja_tilastot/vesistojen_kuormitus_ja_luonnon_huuhtouma (accessed on 6 November 2022).
  8. Pihlainen, S.; Zandersen, M.; Hyytiäinen, K.; Andersen, H.E.; Bartosova, A.; Gustafsson, B.; Jabloun, M.; McCrackin, M.; Meier, H.M.; Olesen, J.E.; et al. Impacts of changing society and climate on nutrient loading to the Baltic Sea. Sci. Total. Environ. 2020, 731, 138935. [Google Scholar] [CrossRef]
  9. Räike, A.; Taskinen, A.; Knuuttila, S. Nutrient export from Finnish rivers into the Baltic Sea has not decreased despite water protection measures. Ambio 2020, 49, 460–474. [Google Scholar] [CrossRef] [Green Version]
  10. de Wit, H.A.; Lepistö, A.; Marttila, H.; Wenng, H.; Bechmann, M.; Blicher-Mathiesen, G.; Eklöf, K.N.; Futter, M.; Kortelainen, P.; Kronvang, B.; et al. Land-use dominates climate controls on nitrogen and phosphorus export from managed and natural Nordic headwater catchments. Hydrol. Process. 2020, 34, 4831–4850. [Google Scholar] [CrossRef]
  11. Lauren, A.A.; Guan, M.; Salmivaara, A.; Leinonen, A.; Palviainen, M.; Launiainen, S. NutSpaFHy—A Distributed Nutrient Balance Model to Predict Nutrient Export from Managed Boreal Headwater Catchments. Forests 2021, 12, 808. [Google Scholar] [CrossRef]
  12. Finér, L.; Lepistö, A.; Karlsson, K.; Räike, A.; Härkönen, L.; Huttunen, M.; Joensuu, S.; Kortelainen, P.; Mattsson, T.; Piirainen, S.; et al. Drainage for forestry increases N, P and TOC export to boreal surface waters. Sci. Total. Environ. 2021, 762, 144098. [Google Scholar] [CrossRef]
  13. Sponseller, R.A.; Gundale, M.J.; Futter, M.; Ring, E.; Nordin, A.; Näsholm, T.; Laudon, H. Nitrogen dynamics in managed boreal forests: Recent advances and future research directions. Ambio 2016, 45, 175–187. [Google Scholar] [CrossRef] [PubMed]
  14. Palviainen, M.; Finér, L.; Laurén, A.; Launiainen, S.; Piirainen, S.; Mattsson, T.; Starr, M. Nitrogen, Phosphorus, Carbon, and Suspended Solids Loads from Forest Clear-Cutting and Site Preparation: Long-Term Paired Catchment Studies from Eastern Finland. Ambio 2014, 43, 218–233. [Google Scholar] [CrossRef] [PubMed] [Green Version]
  15. Nieminen, M. Export of dissolved organic carbon, nitrogen and phosphorus following clear-cutting of three Norway spruce forests growing on drained peatlands in southern Finland. Silva Fenn. 2004, 38, 422. [Google Scholar] [CrossRef] [Green Version]
  16. Kreutzweiser, D.P.; Hazlett, P.W.; Gunn, J.M. Logging impacts on the biogeochemistry of boreal forest soils and nutrient export to aquatic systems: A review. Environ. Rev. 2008, 16, 157–179. [Google Scholar] [CrossRef]
  17. Ahtiainen, M.; Huttunen, P. Long term effects of forestry managements on water quality and loading in brooks. Boreal Environ. Res. 1999, 4, 101–114. [Google Scholar]
  18. Kortelainen, P.; Mattsson, T.; Finér, L.; Ahtiainen, M.; Saukkonen, S.; Sallantaus, T. Controls on the export of C, N, P and Fe from undisturbed boreal catchments, Finland. Aquat. Sci. 2006, 68, 453–468. [Google Scholar] [CrossRef]
  19. Korhonen, J. Suomen Vesistöjen Virtaaman ja Vedenkorkeuden Vaihtelut; Suomen Ympäristökeskus: Helsinki, Finland, 2007. [Google Scholar]
  20. Lindgren, V.; Guillaume, J.H.; Räsänen, T.A.; Jakkila, J.; Veijalainen, N.; Kummu, M. Spatiotemporal hydroclimate variability in Finland: Past trends. J. Hydrometeorol. 2017, 18, 1765–1782. [Google Scholar] [CrossRef]
  21. Ide, J.; Finér, L.; Laurén, A.; Piirainen, S.; Launiainen, S. Effects of clear-cutting on annual and seasonal runoff from a boreal forest catchment in eastern Finland. For. Ecol. Manag. 2013, 304, 482–491. [Google Scholar] [CrossRef]
  22. Finér, L.; Mannerkoski, H.; Piirainen, S.; Starr, M. Carbon and nitrogen pools in an old-growth, Norway spruce mixed forest in eastern Finland and changes associated with clear-cutting. For. Ecol. Manag. 2003, 174, 51–63. [Google Scholar] [CrossRef]
  23. Palviainen, M.; Finér, L.; Mannerkoski, H.; Piirainen, S.; Starr, M. Responses of ground vegetation species to clear-cutting in a boreal forest: Aboveground biomass and nutrient contents during the first 7 years. Ecol. Res. 2005, 20, 652–660. [Google Scholar] [CrossRef]
  24. Nieminen, M.; Sallantaus, T.; Ukonmaanaho, L.; Nieminen, T.M.; Sarkkola, S. Nitrogen and phosphorus concentrations in discharge from drained peatland forests are increasing. Sci. Total. Environ. 2017, 609, 974–981. [Google Scholar] [CrossRef] [PubMed]
  25. Laurén, A.; Finér, L.; Koivusalo, H.; Kokkonen, T.; Karvonen, T.; Kellomäki, S.; Mannerkoski, H.; Ahtiainen, M. Water and nitrogen processes along a typical water flowpath and streamwater exports from a forested catchment and changes after clear-cutting: A modelling study. Hydrol. Earth Syst. Sci. 2005, 9, 657–674. [Google Scholar] [CrossRef]
  26. Huttunen, I.; Lehtonen, H.; Huttunen, M.; Piirainen, V.; Korppoo, M.; Veijalainen, N.; Viitasalo, M.; Vehviläinen, B. Effects of climate change and agricultural adaptation on nutrient loading from Finnish catchments to the Baltic Sea. Sci. Total. Environ. 2015, 529, 168–181. [Google Scholar] [CrossRef] [PubMed]
  27. Finér, L.; Mattsson, T.; Joensuu, S.; Koivusalo, H.; Laurén, A.; Makkonen, T.; Nieminen, M.; Tattari, S.; Ahti, E.; Kortelainen, P.; et al. Metsäisten Valuma-Alueiden Vesistökuormituksen Laskenta; Suomen Ympäristökeskus: Helsinki, Finland, 2010; p. 33. (In Finnish) [Google Scholar]
  28. Huttunen, I.; Huttunen, M.; Piirainen, V.; Korppoo, M.; Lepistö, A.; Räike, A.; Tattari, S.; Vehviläinen, B. A national scale nutrient loading model for Finnish watersheds—VEMALA. Environ. Model. Assess. 2016, 21, 83–109. [Google Scholar] [CrossRef]
  29. Wade, A.; Durand, P.; Beaujouan, V.; Wessel, W.W.; Raat, K.J.; Whitehead, P.G.; Butterfield, D.; Rankinen, K.; Lepistö, A. A nitrogen model for European catchments: INCA, new model structure and equations. Hydrol. Earth Syst. Sci. Discuss. 2002, 6, 559–582. [Google Scholar] [CrossRef]
  30. Børgesen, C.D.; Olesen, J.E. A probabilistic assessment of climate change impacts on yield and nitrogen leaching from winter wheat in Denmark. Nat. Hazards Earth Syst. Sci. 2011, 11, 2541–2553. [Google Scholar] [CrossRef] [Green Version]
  31. Mellander, P.E.; Jordan, P.; Bechmann, M.; Fovet, O.; Shore, M.M.; McDonald, N.T.; Gascuel-Odoux, C. Integrated climate-chemical indicators of diffuse pollution from land to water. Sci. Rep. 2018, 8, 1–10. [Google Scholar] [CrossRef] [Green Version]
  32. Tattari, S.; Koskiaho, J.; Kosunen, M.; Lepistö, A.; Linjama, J.; Puustinen, M. Nutrient loads from agricultural and forested areas in Finland from 1981 up to 2010—Can the efficiency of undertaken water protection measures seen? Environ. Monit. Assessessment 2017, 189, 95. [Google Scholar] [CrossRef] [Green Version]
  33. Rankinen, K.; Keinänen, H.; Cano Bernal, J.E. Influence of climate and land use changes on nutrient fluxes from Finnish rivers to the Baltic Sea. Agric. Ecosyst. Environ. 2016, 216, 100–115. [Google Scholar] [CrossRef]
  34. Lehtonen, I.; Jylhä, K. Tendency towards a more extreme precipitation climate in the Coupled Model Intercomparison Project Phase 5 models. Atmos. Sci. Lett. 2019, 20, e895. [Google Scholar] [CrossRef]
  35. Olsson, T. Impacts of climate change on temperature, precipitation and hydrology in Finland-studies using bias corrected Regional Climate Model data. Hydrol. Earth Syst. Sci. 2015, 12, 2657–2706. [Google Scholar] [CrossRef] [Green Version]
  36. Launiainen, S.; Guan, M.; Salmivaara, A.; Kieloaho, A.J. Modeling boreal forest evapotranspiration and water balance at stand and catchment scales: A spatial approach. Hydrol. Earth Syst. Sci. 2019, 23, 3457–3480. [Google Scholar] [CrossRef]
  37. Nieminen, M.; Sarkkola, S.; Hasselquist, E.M.; Sallantaus, T. Long-Term Nitrogen and Phosphorus Dynamics in Waters Discharging from Forestry-Drained and Undrained Boreal Peatlands. Water Air Soil Pollut. 2021, 232, 1–9. [Google Scholar] [CrossRef]
  38. FFC. Open Forest Inventory Data (FID) of the Finnish Forest Centre (FFC). 2018. Available online: https://www.metsaan.fi/paikkatietoaineistot (accessed on 1 March 2020).
  39. Mäkisara, K.; Katila, M.; Peräsaari, J.; Tomppo, E. The Multi-Source National Forest Inventory of Finland—Methods and Results 2013; Number 8/2019 in Natural Resources and Bioeconomy Studies; Natural Resources Institute Finland (Luke): Helsinki, Finland, 2016. [Google Scholar]
  40. Leinonen, A.; Laurén, A.A.; Salmivaara, A.; Palviainen, M.; Finér, L. Identifying Nutrient Export Hotspots Using Spatially Distributed Process Model in Boreal Forested Catchments Managed by Clear-Cuts. Forests, 2022; submitted. [Google Scholar]
  41. NLSF. National Land Survey of Finland. Topographic Database. Available online: http://www.maanmittauslaitos.fi/en/e-services/open-data-file-download-service (accessed on 1 March 2020).
  42. Salmivaara, A. Topographical Wetness Index for Finland, 16 m. 2016. Available online: http://urn.fi/urn:nbn:fi:csc-kata20170511114638598124 (accessed on 1 March 2020).
  43. GSF. Geological Survey of Finland. Bedrock 1:200,000 and Superficial Deposits 1:20,000, 1:50,000 and 1:200,000. 2015. Available online: https://hakku.gtk.fi/en (accessed on 1 March 2020).
  44. Härkönen, S.; Lehtonen, A.; Manninen, T.; Tuominen, S.; Peltoniemi, M. Estimating forest leaf area index using satellite images: Comparison of k-NN based Landsat-NFI LAI with MODIS-RSR based LAI product for Finland. Boreal Environ. Res. 2015, 20, 181–195. [Google Scholar]
  45. Korhonen, L.; Korhonen, K.T.; Stenberg, P.; Maltamo, M.; Rautiainen, M. Local models for forest canopy cover with beta regression. Silva Fenn. 2007, 41, 671–685. [Google Scholar] [CrossRef] [Green Version]
  46. Aalto, J.; Pirinen, P.; Jylhä, K. New gridded daily climatology of Finland: Permutation-based uncertainty estimates and temporal trends in climate. J. Geophys. Res. Atmos. 2016, 121, 3807–3823. [Google Scholar] [CrossRef] [Green Version]
  47. Vicente-Serrano, S.M.; Beguería, S.; López-Moreno, J.I. A multiscalar drought index sensitive to global warming: The standardized precipitation evapotranspiration index. J. Clim. 2010, 23, 1696–1718. [Google Scholar] [CrossRef] [Green Version]
  48. Hargreaves, G.H. Defining and using reference evapotranspiration. J. Irrig. Drain. Eng. 1994, 120, 1132–1139. [Google Scholar] [CrossRef]
  49. Niinistö, T.; Peltola, A.; Räty, M.; Sauvula-Seppälä, T.; Torvelainen, J.; Uotila, E.; Vaahtera, E. (Eds.) Finnish Statistical Yearbook of Forestry 2021; Luonnonvarakeskus (Luke): Helsinki, Finland, 2021. [Google Scholar]
  50. Laurén, A.; Heinonen, J.; Koivusalo, H.; Sarkkola, S.; Tattari, S.; Mattsson, T.; Ahtiainen, M.; Joensuu, S.; Kokkonen, T.; Finér, L. Implications of Uncertainty in a Pre-treatment Dataset when Estimating Treatment Effects in Paired Catchment Studies: Phosphorus Loads from Forest Clear-cuts. Water Air Soil Pollut 2009, 169, 251–261. [Google Scholar] [CrossRef]
  51. Palviainen, M.; Laurén, A.; Launiainen, S.; Piirainen, S. Predicting the export and concentrations of organic carbon, nitrogen and phosphorus in boreal lakes by catchment characteristics and land use: A practical approach. Ambio 2016, 45, 933–945. [Google Scholar] [CrossRef] [Green Version]
  52. Palviainen, M.; Finér, L.; Laurén, A.; Högbom, L. A method to estimate the impact of clear-cutting on nutrient concentrations in boreal headwater streams. Ambio 2015, 44, 521–531. [Google Scholar] [CrossRef] [Green Version]
  53. Aaltonen, H.; Tuukkanen, T.; Palviainen, M.; Laurén, A.A.; Tattari, S.; Piirainen, S.; Mattsson, T.; Ojala, A.; Launiainen, S.; Finér, L. Controls of Organic Carbon and Nutrient Export from Unmanaged and Managed Boreal Forested Catchments. Water 2021, 13, 2363. [Google Scholar] [CrossRef]
  54. Finér, L.; Lepistö, A.; Karlsson, K.; Räike, A.; Tattari, S.; Huttunen, M.; Härkönen, L.; Joensuu, S.; Kortelainen, P.; Mattsson, T.; et al. Metsistä ja Soilta Tuleva Vesistökuormitus 2020; Valtioneuvoston Kanslia: Helsinki, Finland, 2020. (In Finnish)
  55. Tossavainen, T. Puruveteen Laskevan Kuonanjärven Nykyinen Tila—Sedimentin Laatu Ja Määrä, Pohjaeläimistö, Vedenlaatu Sekä Kuormitus—Ja fOsforimallitarkastelu Kunnostussuunnittelun Perustaksi (In Finnish) [The Current Status of Lake Kuonanjärvi Draining to Lake Puruvesi—Quality and Quantity of Sediment, Macro Invertebrates, Water Quality and Loading and Phosphorus Modelling for Water Protection Planning]; Karelia-ammattikorkeakoulu: Joensuu, Finland, 2019; p. 117. [Google Scholar]
  56. Siipilehto, J. Taimikoiden tila valtakunnan metsien 11. inventoinnin mukaan ja biometriset mallit eritasoisilla lähtötiedoilla. MetsäTieteen Aikakauskirja 2021, 2021, 10421. [Google Scholar] [CrossRef]
  57. Worrall, F.; Moody, C.S.; Clay, G.D.; Burt, T.P.; Rose, R. The total phosphorus budget of a peat-covered catchment. J. Geophys. Res. Biogeosci. 2016, 121, 1814–1828. [Google Scholar] [CrossRef] [Green Version]
  58. Tuukkanen, T.; Marttila, H.; Kløve, B. Predicting organic matter, nitrogen, and phosphorus concentrations in runoff from peat extraction sites using partial least squares regression. Water Resour. Res. 2017, 53, 5860–5876. [Google Scholar] [CrossRef]
  59. Leppä, K.; Hökkä, H.; Laiho, R.; Launiainen, S.; Lehtonen, A.; Mäkipää, R.; Peltoniemi, M.; Saarinen, M.; Sarkkola, S.; Nieminen, M. Selection Cuttings as a Tool to Control Water Table Level in Boreal Drained Peatland Forests. Front. Earth Sci. 2020, 8, 428. [Google Scholar] [CrossRef]
  60. Nieminen, M.; Hasselquist, E.M.; Mosquera, V.; Ukonmaanaho, L.; Sallantaus, T.; Sarkkola, S. Post-Drainage Stand Growth and Peat Mineralization Impair Water Quality from Forested Peatlands. J. Environ. Qual. 2022, 51, 1211–1221. [Google Scholar] [CrossRef]
  61. Tattari, S.; Leinonen, A. Malliperheen Sovellus Puruveden vesistöalueelle (In Finnish) [Applying the National Integrated Modelling framework in Lake Puruvesi region] Report of Milestone 3. First Applications on National Integrated Model for River Basin Management Pilot Areas to be Applied Ready (Case Puruvesi); Freshabit Life IP, Metsähallitus: Helsinki, Finland, 2017; p. 45. [Google Scholar]
  62. Ruosteenoja, K.; Jylhä, K. Projected climate change in Finland during the 21st century calculated from CMIP6 model simulations. Geophysica 2021, 56, 39–69. [Google Scholar]
Figure 1. The location and ecological status of the lakes in the Puruvesi catchment (a). The outlets and drainage paths of the 33 sub-catchments of Vehka-Kuonanjärvi catchment (b). Sub-catchment details are provided in Table S1 in Supplementary Materials.
Forests 14 00089 g001
Figure 2. The range of the mean values during the period 1981-2018, and the mean per each weather scenario for (A) temperature, (B) total precipitation, and (C) reference evapotranspiration (ET0) in the study area according to [46] during different seasons (winter, spring, summer, autumn) and the whole year. The grey boxplots display the minimum, the maximum, the median, and the first and third quartiles of the mean values during the period 1981–2018. The bars display the mean values in the weather scenarios: baseline (blue), dry (yellow), wet (green), and wet & mild (brown).
Forests 14 00089 g002
Figure 3. The clear-cut sites on mineral and peat soils in the 33 sub-catchments of the study area. Detailed information of the clear-cut areas is presented in Table S1 in Supplementary Materials.
Forests 14 00089 g003
Figure 4. Mean annual exports of N (a) and P (b) in ‘no clear cuts’ and ‘all clear cuts’ scenarios under baseline and extreme weather scenarios in the 33 sub-catchments. Average of the mean annual exports per sub-catchments is shown as a white dot, black line shows the median, and 50% of the sub-catchments fit within the box. The whiskers show minimum and maximum values and outlier values are presented with black dots.
Forests 14 00089 g004
Figure 5. The mean annual specific export caused by clear-cuts in different weather scenarios for N (a) and for P (b). Average of the mean annual specific exports is shown as a white dot, black line shows the median, and boxes include 50% of the values. The whiskers show minimum and maximum values and outlier values are presented with black dots.
Forests 14 00089 g005
Figure 6. Nitrogen export [kg ha−1year−1] with clear-cut scenarios in baseline (maps a,b) and in wet & mild scenario (maps d,e). The clear-cut induced sub-catchment level hotspots having highest differences compared to baseline are shown in maps (c,f) and the weather driven hotspots having highest difference compared to baseline in maps (g,h). Lake areas were not included in the analysis.
Forests 14 00089 g006
Figure 7. Phosphorus export [kg ha−1 year−1] with clear-cut scenarios in baseline (maps a,b) and in wet & mild scenario (maps d,e). Differences to baseline for P export in the clear-cut scenarios are shown in maps (c,f). Differences to baseline in the weather scenarios are shown in maps g and h. Current hotspots are visible in map a, areas having highest difference to baseline caused by clear-cut scenario or by weather scenario are shown in maps (c,f) and (g,h). Lake areas were not included in the analysis.
Forests 14 00089 g007
Figure 8. N export hotspots in baseline (maps a,b) without (a) and with clear-cuts (b) and in wet & mild scenario (maps c,d) without (c) and with clear-cuts (d). Areas highlighted with pink colour have average annual N export over 2.7 kg ha−1 year−1 (average in EN, base) during the ten-year period. The clear-cut areas are shown with grey colour and when areas highlighted with pink coincide with a clear-cut area, they are shown as purple.
Forests 14 00089 g008
Figure 9. P export hotspots in baseline (maps a,b) without (a) and with clear-cuts (b) and in wet & mild scenario (maps c,d) without (c) and with clear-cuts (d). Areas highlighted with pink have colour have average annual P export over 1 kg ha−1 year−1 (average in EP, base) during the ten-year period. The clear-cut areas are shown with grey colour and when areas highlighted with pink coincide with a clear-cut area, they are shown as purple.
Forests 14 00089 g009
Figure 10. Sub-catchment characteristics correlating with change in N (a) and P (b) export in wet & mild scenario relative to the baseline.
Forests 14 00089 g010
Table 1. Input data: Sources and preparations. Forest resource data are combination of FID and MS-NFI.
Data ItemSource; Additional Information
Needle/leaf biomass per tree species, [10 kg/ha]FID&MS-NFI; converted to [kg/ha], Leaf-area index calculated based on [44]
Tree stand basal area, [m2/ha]FID&MS-NFI; canopy cover calculated based on [45]
Stem volume per tree species, [m3/ha]FID&MS-NFI
Stand age, [years]FID&MS-NFI
Tree height, [dm]FID&MS-NFI; converted to [m]
Root biomass, [10 kg/ha]FID&MS-NFI; converted to [kg/ha]
Site type [unitless, classes 1–4]FID&MS-NFI; Appendix A. in [11]
Site fertility class [unitless, classes 1–7]FID&MS-NFI; Appendix A. in [11]
Clear-cut scenario rasters [binary]FID; see Section 2.3.2
Soil class [unitless][43]
Peat areas [binary][41]
Bare rock areas [binary][41]
Water elements [binary][41]
Digital elevation model (DEM) [m][41]
Slope [degree]calculated from DEM
Flow accummulation [m2]calculated from DEM
Topographic Wetness Index (TWI) [unitless][42]
Mean distance to waterbody [m]calculated from DEM
Latitude & longitude [m][41]; in EUREF TM35FIN, EPSG:3067
Mean daily temperature [°C][46]; temperature sum calculated as degree days, threshold above 5 °C, see Section 2.3.1. for weather scenario description
Daily precipitation [mm][46]
Water vapour partial pressure [hPa][46]
Global radiation [kJ/m2][46]
Table 2. Weather and clear-cut scenario combinations.
WeatherClear-Cut ScenarioDescription of Weather Construction
Baselineno clear-cutsEN,P base is the nutrient export simulated with observed weather in
period 2002–2012 without any clear-cuts. It gives the baseline to
which other scenarios were compared
Baselineall clear-cuts2002–2012 observed weather and all mature forest sites clear-cut
Dryno clear-cutsrepeating observed dry period without any clear-cuts
Dryall clear-cutsrepeating observed dry period with all mature forest sites clear-cut
Wetno clear-cutsrepeating observed wet period without any clear-cuts
Wetall clear-cutsrepeating observed wet period with all mature forest sites clear-cut
Wet & mildno clear-cutsrepeating observed wet & mild period without any clear-cuts
Wet & mildall clear-cutsrepeating observed wet & mild period with all mature forest
sites clear-cut
Table 3. Sum of N and P export and mean annual concentrations to the Lake Kuonanjärvi calculated from the 33 sub-catchments that drain hierarchically to the lake (Figure 1). Detailed results in Table S1.
ScenarioN [kg year−1]P [kg year−1]N [ μ g L−1 year−1]P [ μ g L−1 year−1]Runoff [mm year−1]
EN,P base11,51041396735240
Baseline: all clear-cuts14,177524108140264
Dry: no clear-cuts1059435192140
Dry: all clear-cuts2278898593452
Wet: no clear-cuts14,46855974329394
Wet: all clear-cuts17,59868183432425
Wet & mild: no clear-cuts17,756656108440331
Wet & mild: all clear-cuts20,955770119545353
Disclaimer/Publisher’s Note: The statements, opinions and data contained in all publications are solely those of the individual author(s) and contributor(s) and not of MDPI and/or the editor(s). MDPI and/or the editor(s) disclaim responsibility for any injury to people or property resulting from any ideas, methods, instructions or products referred to in the content.

