Article

Distinct Rainfall Interception Profiles among Four Common Pacific Northwest Tree Species

by
Dylan G. Fischer
1,*,
Spencer T. Vieira
2 and
Anand D. Jayakaran
3
1
The Evergreen State College, Olympia, WA 98505, USA
2
Department of Ecosystem and Conservation Sciences, University of Montana, Missoula, MT 59812, USA
3
Washington Stormwater Center, Puyallup Research and Extension Center, Washington State University, Puyallup, WA 98371, USA
*
Author to whom correspondence should be addressed.
Forests 2023, 14(1), 144; https://doi.org/10.3390/f14010144
Submission received: 29 December 2022 / Revised: 9 January 2023 / Accepted: 10 January 2023 / Published: 12 January 2023
(This article belongs to the Section Forest Hydrology)

Abstract

:
Forest tree canopies have a critical influence on water cycles through the interception of precipitation. Nevertheless, radial patterns of canopy interception may vary interspecifically. We analyzed canopy interception using catchments along radial transects underneath four common forest tree species (Acer macrophyllum, Alnus rubra, Pseudotsuga menziesii, and Thuja plicata) in the Pacific Northwest over two years. Near the center of the canopy in the leaf-off season, interception was 51.6%–67.2% in conifer species and only 20.1%–40.1% in broadleaf species, and interception declined to 19.9–29.9 for all species near the edge of the canopy. One deciduous species (A. rubra) showed spatially uniform interception during the leaf-off period (19.9%–20.96%), while another varied from 23.1%–40.1%. Patterns were more pronounced in the leaf-on period (under high vapor pressure deficit conditions), where conifers intercepted 36.5%–95.9% of precipitation, depending on the species and position under the canopy. Deciduous species similarly intercepted 42.1%–67.7% of rainfall, depending on species and canopy position. Total throughfall was curvilinearly related to the amount of rainfall near canopy centers for conifer trees but less so for deciduous trees. Soil moisture was predictably related to interception across and within species. These data highlight interspecific differences in radial interception patterns, with consequences for soil moisture, hydrologic processes, and ecosystem function.

1. Introduction

The importance of forest trees in mediating precipitation through canopy interception has been recognized for centuries [1,2]. Tree canopy interception of rainfall can represent large components of total forest water budgets [2,3,4,5]. For example, the amount of precipitation intercepted by forest tree canopies may be 20%–60% or more [5,6,7,8,9,10]. Interception can vary significantly among different canopy types and growth forms [5,7,11,12,13]. Canopy interception can also vary significantly based on the leaf-on versus leaf-off phenological stage of deciduous forest trees [14,15], with implications for sub-canopy soil moisture [16,17,18,19]. Accordingly, quantifying the spatiotemporal patterns in canopy throughfall and interception can provide important insights into hydrologic function and soil chemistry in forests [10,16,17,18,20,21]. Global reviews of interception patterns have highlighted the need to better quantify growth-form and species-dependent patterns in interception among trees across biomes [5,10,21,22]. Nevertheless, species-specific radial spatial patterns among tree species in the high-rainfall temperate rainforests of the Pacific Northwest are not well defined (but see [9,23]).
Individual species variation in canopy interception may be substantial, especially since individual species may vary in key canopy traits, such as branch density, epiphyte and bryophyte abundance, and canopy architecture [24]. Temporally, leaf-on and leaf-off time periods are likely to also enhance species-specific differences in interception patterns among deciduous and evergreen tree species, and patterns may also be dependent on the rainfall regime [14,15,25]. Tree water-use studies in the Pacific Northwest documented transpiration water-use within basins or stands subject to different management activities [26,27], large tree hydrologic function [28,29], variability in throughfall and interception patterns and modeling in stands [9,23,30], and landscape water budgets [27,31]. The Pacific Northwest is a region well known for dense temperate rainforests, and differences in radial spatial interception patterns among dominant tree species may also result in unique influences on hydrologic processes [23,32]. Differences in canopy architecture are likely to lead to differences in how individual tree species intercept rainfall from the center to the outside of the canopy, and how interception varies with precipitation [25]. Measuring tree canopy spatial influences could better refine the understanding of the species-specific influences of trees on water budgets, resulting in spatial models of interception using known locations of trees. Further, radial patterns in tree water-use and interception could represent an important mechanism through which trees might influence soil moisture, biota, and ecosystem function from the center of the tree to the dripline [16,17,18,20,33,34,35].
Here, we use a two-year study of four common lowland tree species in temperate rainforests of the Pacific Northwest (USA) to examine radial spatial patterns in tree canopy throughfall and interception. While there can be tremendous temporal and spatial variation within stands [4,19,23,24], interactions with evaporation and interception, and tremendous hydrological complexity in throughfall related to drop size distributions [22], we take the simplistic approach of measuring radial patterns in throughfall and estimated canopy interception under distinct individual tree canopies. Throughfall precipitation was collected along transects from tree boles to canopy edges in all four species throughout the two years. Canopy interception was estimated based on the difference between throughfall and total precipitation. Collection was paired with coincident measurement of soil moisture, tree leaf phenology, and precipitation. We had three main objectives in this work: (1) examine radial interception profiles with distance from the canopy center among four different tree species that represent the dominant species in temperate rainforests of the Pacific Northwest; (2) determine relationships between throughfall and precipitation intensity associated with different species and canopy locations [36]; and (3) examine relationships between interception and soil moisture under tree canopies.

2. Materials and Methods

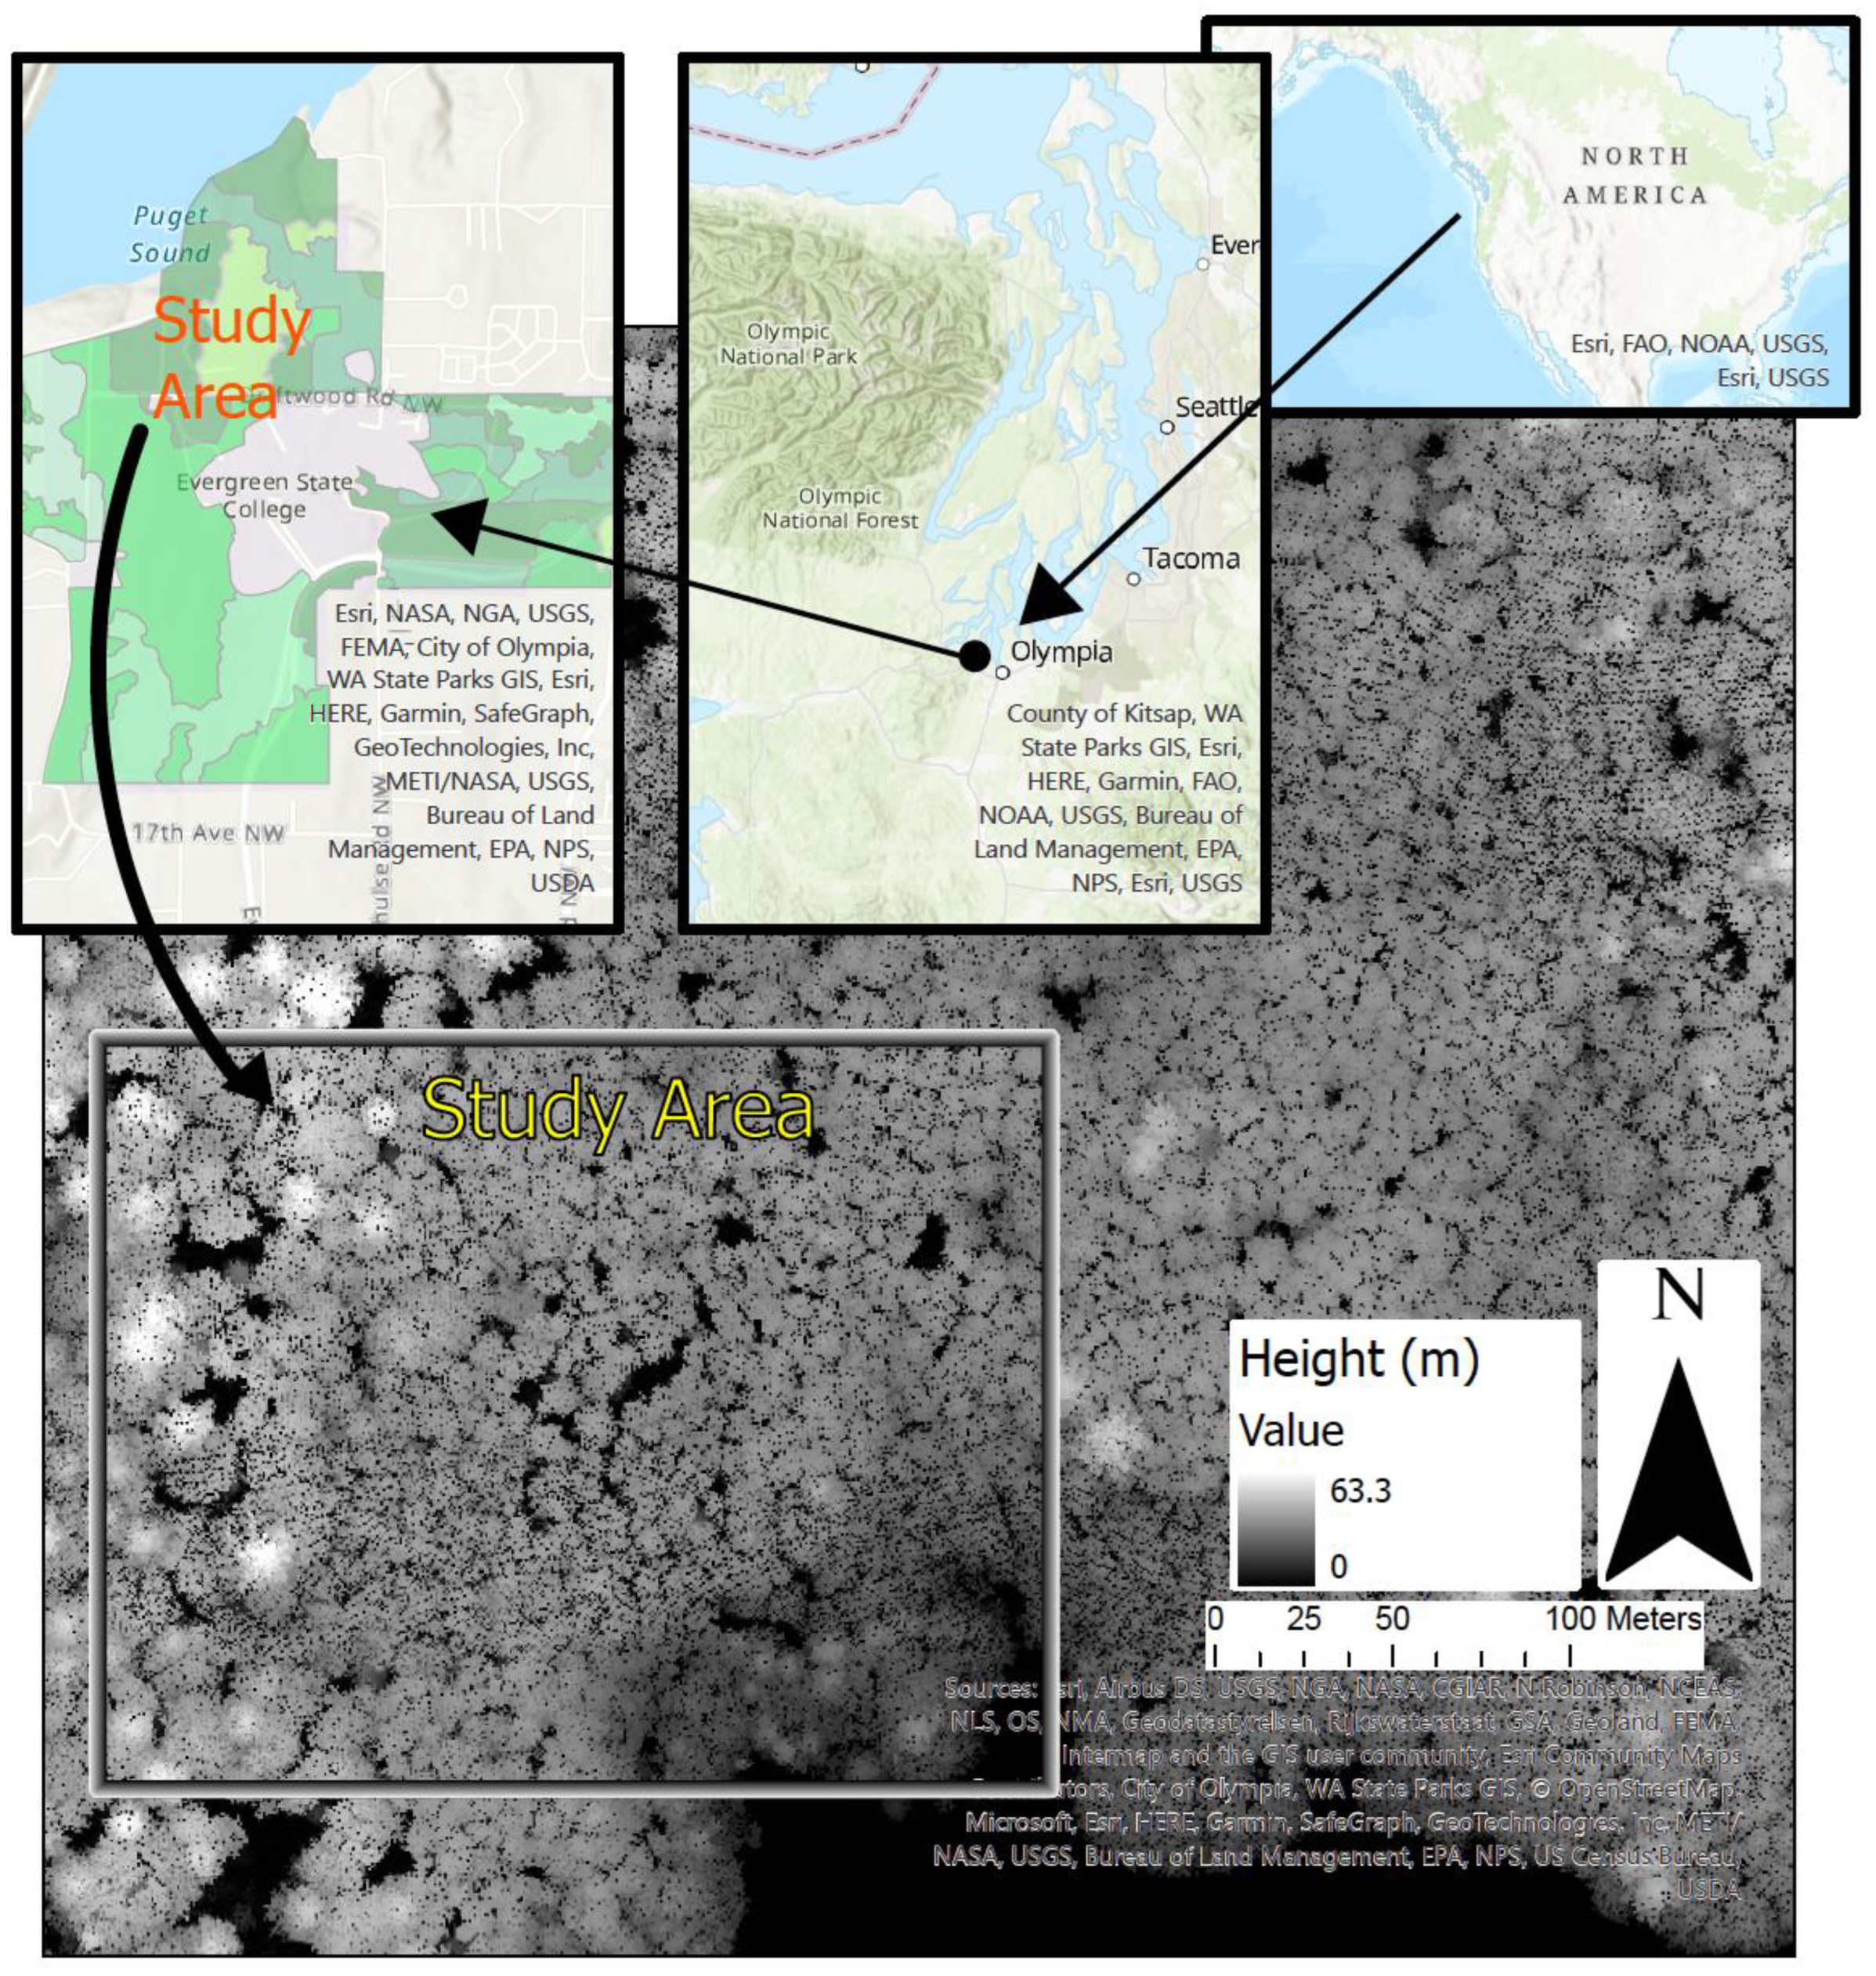
2.1. Site Characteristics

Rainfall and hydrometeorological observations were made within an ~4 ha stand in the Evergreen State College (TESC) campus experimental forest reserve. The site is located near Eld Inlet, near Olympia, Washington, USA (47°4′36.45″ N, 122°58′44.78″ W) at an elevation of 45 m (Figure 1). The location is characterized by cool, wet winters and warm, dry summers. The average annual precipitation is 2471 mm, with seasonally dry summers where only 4.7% of the precipitation occurs in June–August. Mean annual air temperature is 10.3 °C with mean monthly maxima and minima of 18.3 °C in August and 3.1 °C in December, respectively. Mean climatic data are based on the TESC weather station (Ref. [37], last accessed 29 November 2022) observations for the period from 2008 to 2019. Soils at the site are classified as alder-wood gravelly sandy loam based on USGS classifications.
Vegetation at the site was representative of typical mature (approx. 80 years old [38,39]) Douglas-fir (Pseudotsuga menziesii), western redcedar (Thuja plicata), Big-leaf maple (Acer macrophyllum), and red alder (Alnus rubra) dominated stands. Understories are dominated by sword fern (Polystichum munitum), bracken fern (Pteridium aquilinum), salal (Gaultheria shallon), and Oregon grape (Mahonia nervosa) [39]. The average height of the conifer trees at the site was 35.7 m (+/− 4.7 m SE), with the tallest individual reaching 63.3 m (see LiDAR-derived heights in Figure 1). The average height of the hardwoods (big-leaf maple and red alder) at the site was approximately 22.0 m (+/− 0.87 m SE). Diameter at Breast Height (DBH) was measured at 1.4 m high on stem using a DBH tape (283 D/5 m, Forestry Suppliers Inc., Jackson, MS, USA). Twenty-four trees were selected for the study, representing mature trees of four dominant species at the site (six trees each of P. menziesii, T. plicata, A. macrophyllum, and A. rubra; Table 1). Trees used in the study ranged from 22–30 m tall within the study area, and the tallest individuals were not selected.

2.2. Weather Measurement

Hydrometeorological data were collected from a weather station installed on a 3 m tripod 0.8 km SE of the Driftwood Meadow experimental site on the TESC campus in an open field location. Hydrometeorological data were recorded as averages over 5-min intervals on a CR10X Campbell Scientific datalogger (CR10X, Campbell Scientific Inc., Logan, UT, USA). Precipitation was measured with a 203 mm diameter funnel, tipping bucket rain gauge (Model TR-525USW, Texas Electronics Inc., Dallas, TX, USA). Precipitation was also measured manually with weekly resolution from a 76 mm inner-diameter rain catchment placed in an open field near the experimental site. The tipping bucket rain gauge provided better temporal resolution and was used for gross precipitation calculations. The open field manually logged rain catchment was used to emulate the design of the throughfall catchments underneath the canopy and served by giving the maximum evaporation of throughfall collected between weekly data collections. Weather station soil moisture estimates were used to confirm the accuracy of hand-held soil moisture measurements (next section). Weather station soil moisture was measured at 7 cm depth at the base of the weather station in alder-wood gravelly sandy loam soil (same as experimental plot) using a time-domain reflectometry probe (CS616, Campbell Scientific Inc., Logan, UT, USA).

2.3. Throughfall, Soil Moisture

Throughfall and soil moisture were recorded weekly from 19 March 2019 to 20 March 2021 for all weeks when precipitation was measurable. To quantify throughfall, ninety-six 76 mm inner-diameter rain catchments were installed around the 24 selected trees, 1 m above the ground, in groups of four sample points located at distinct distances along transects spanning radially from stem to perimeter of individual tree canopies (see Table 1, Figure 2). Sample points were: 1, adjacent to the tree bole and center of tree canopy; 2, at ~40% distance to the outer edge of the canopy; 3, located at ~70% distance to the edge of the canopy; and 4, at 100% of transect distance (edge of canopy; see Table 1 for exact distances from tree boles). Individual catchments had a collection area of 4536.5 mm2, a cumulative collection area of 0.435 m2. Catchments were periodically cleaned, re-leveled, and re-positioned to maintain consistent placement along transects relative to the growing canopy. The understory was lightly cleared around soil moisture sampling points to ensure no understory throughfall interception was taking place at the sample points.
Canopy interception (hereafter Ic) at each gauge was estimated based on a calculation from one-dimensional gross precipitation (measured using weather station values) minus net throughfall (sample point values) for all weekly collection dates. However, we emphasize that actual interception is likely to differ slightly due to variations in stemflow and branch-flow to driplines. Long-term data from our site suggest that both values are minor components of tree hydrologic budgets (stemflow < 1% of precipitation, B. Leonard pers. comm., data not shown); however, both could represent a source of error for the estimated Ic [2,4,6,20].
Soil moisture was recorded coincident with catchment measurements near the base of each sampling point, and at the base of an open field sampling point using a hand-held soil moisture probe (SM150, 41113910, Delta-T Devices Ltd., Cambridge, UK) at approximately 7 cm depth at each location. A 40 mm diameter circle of forest floor was cleared around the center of each sampling point to ensure accurate soil moisture data.
Maximum canopy cover at each sampling point was determined using analysis of photos taken of canopy during peak growing season and overcast conditions, directly above each catchment, using a Nikon D7000 DSLR camera and AF-S Nikkor 35 mm non-hemispherical lens mounted on a bubble-leveled tripod. Images were analyzed using standard image analysis software (Image-J) to quantify the percentage of open canopy, subtracted from 100% to estimate canopy cover.

2.4. Statistical Analysis
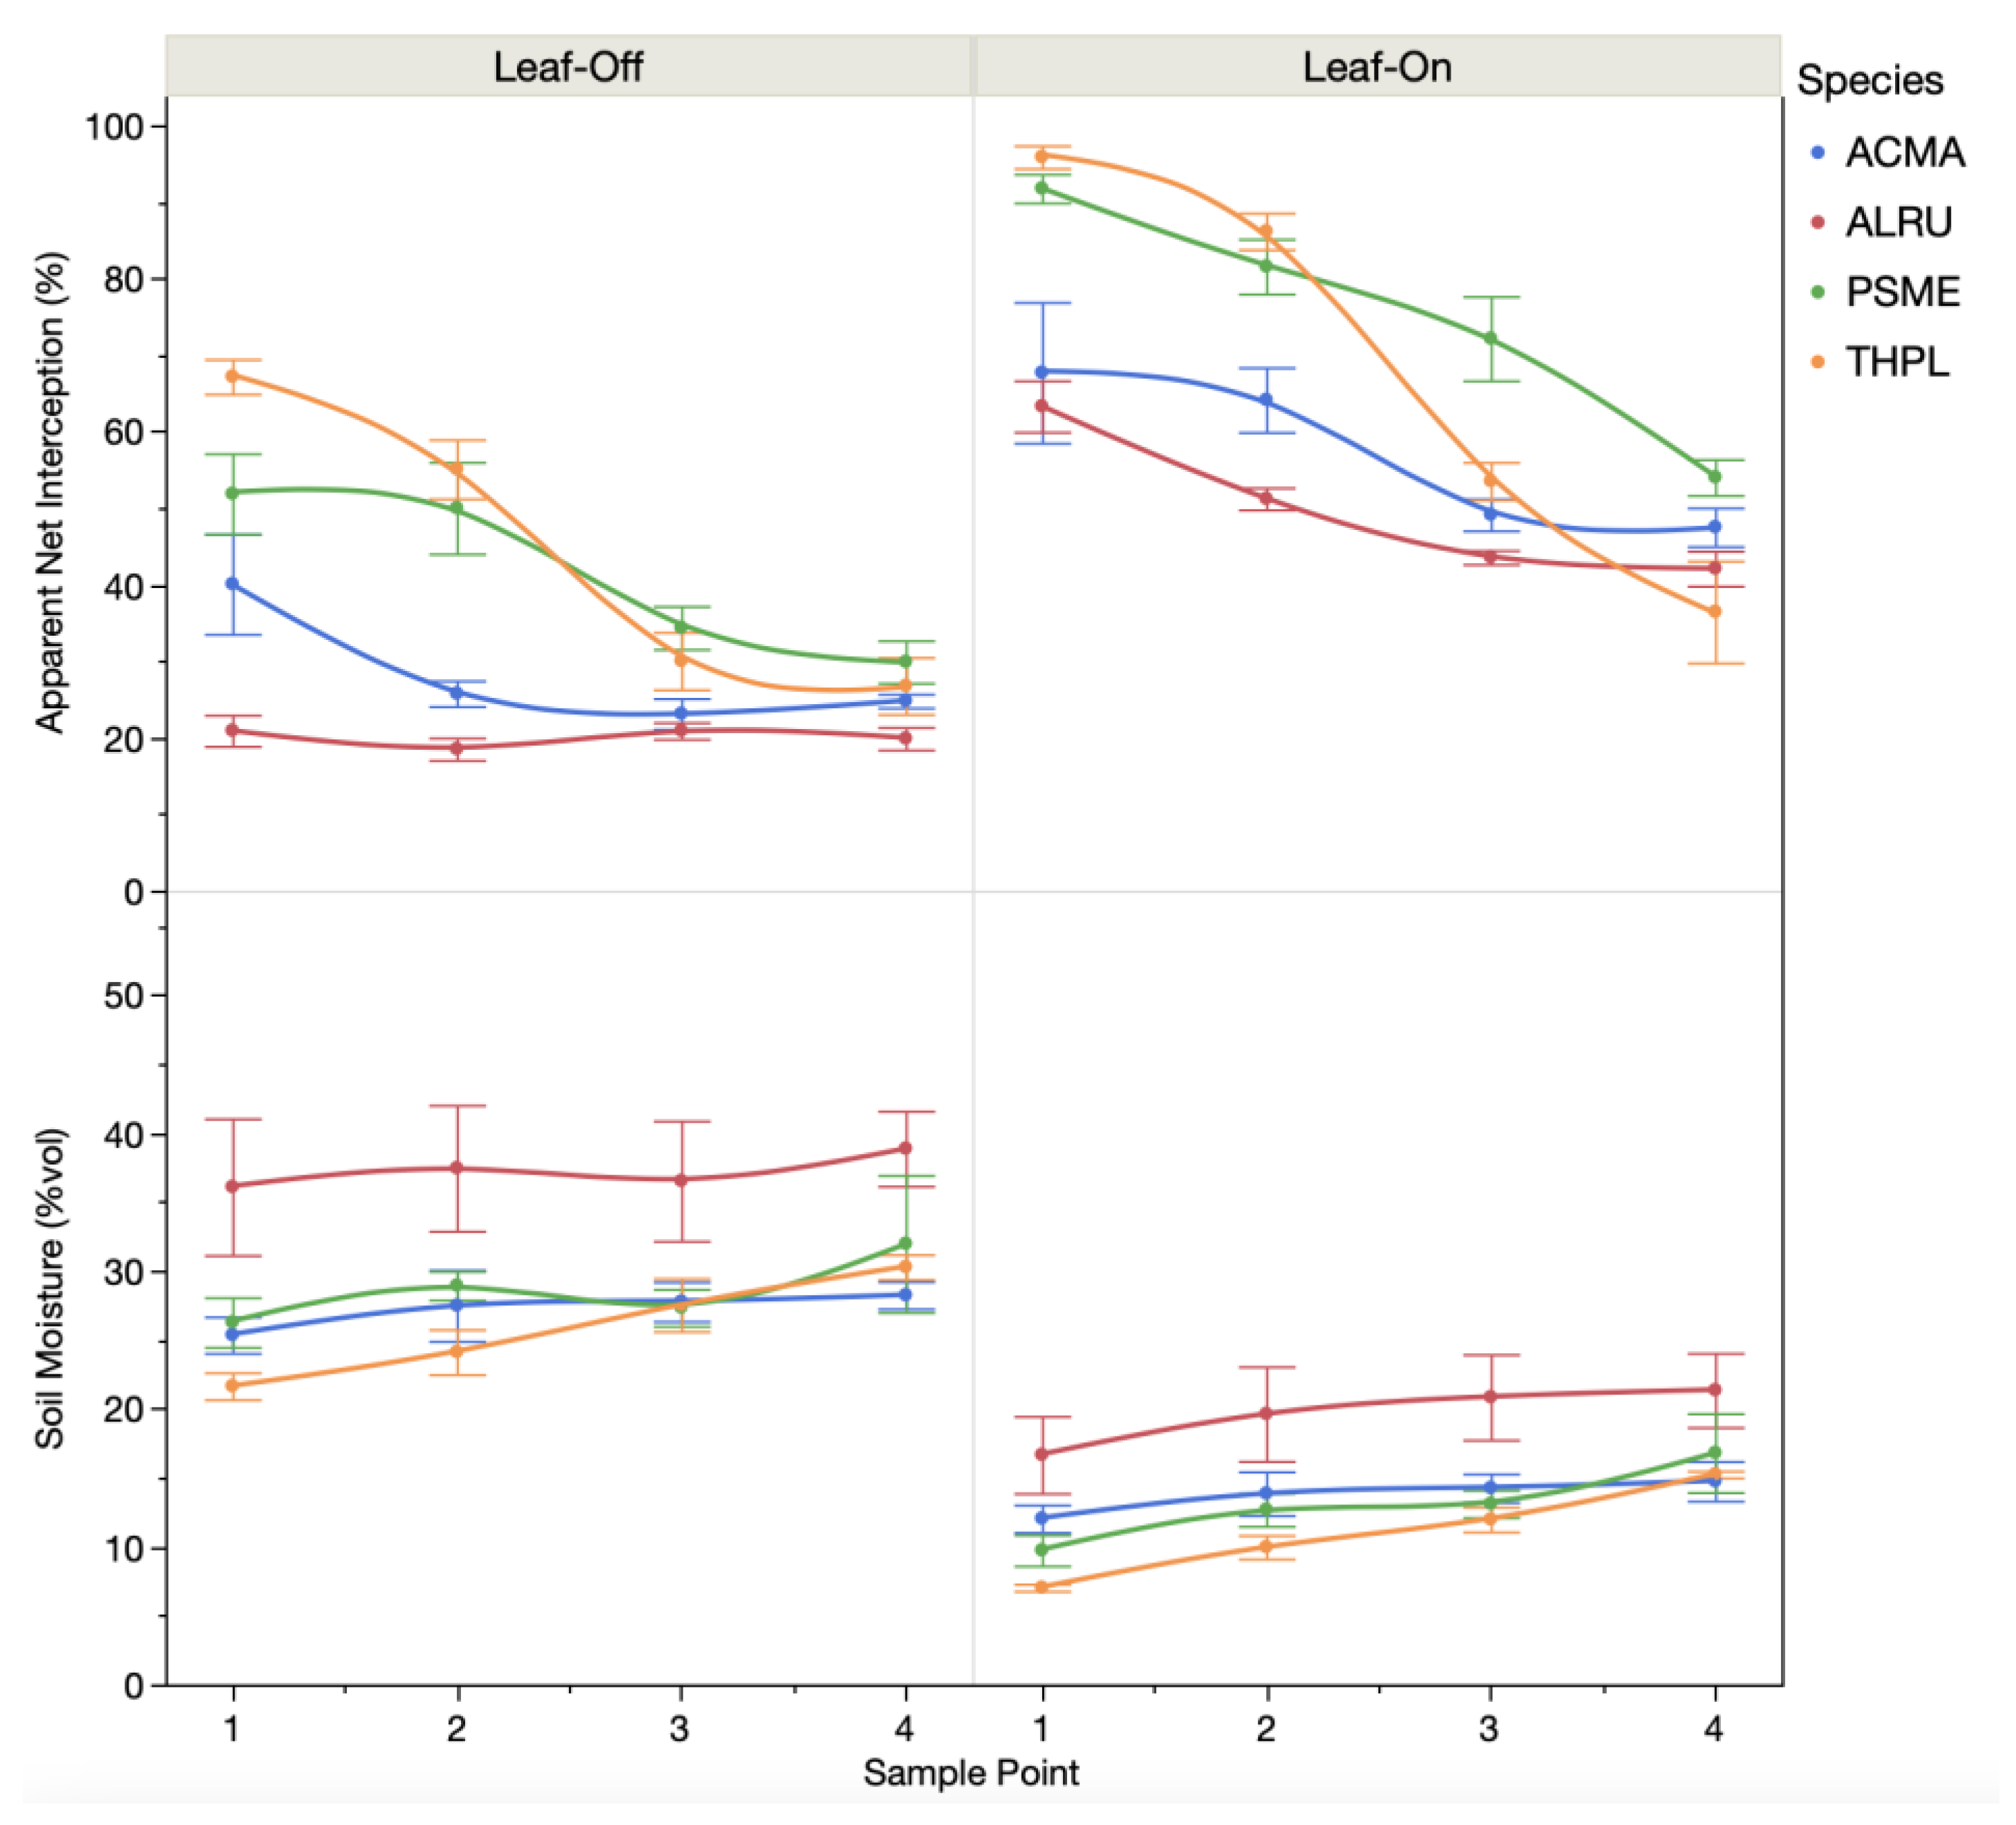
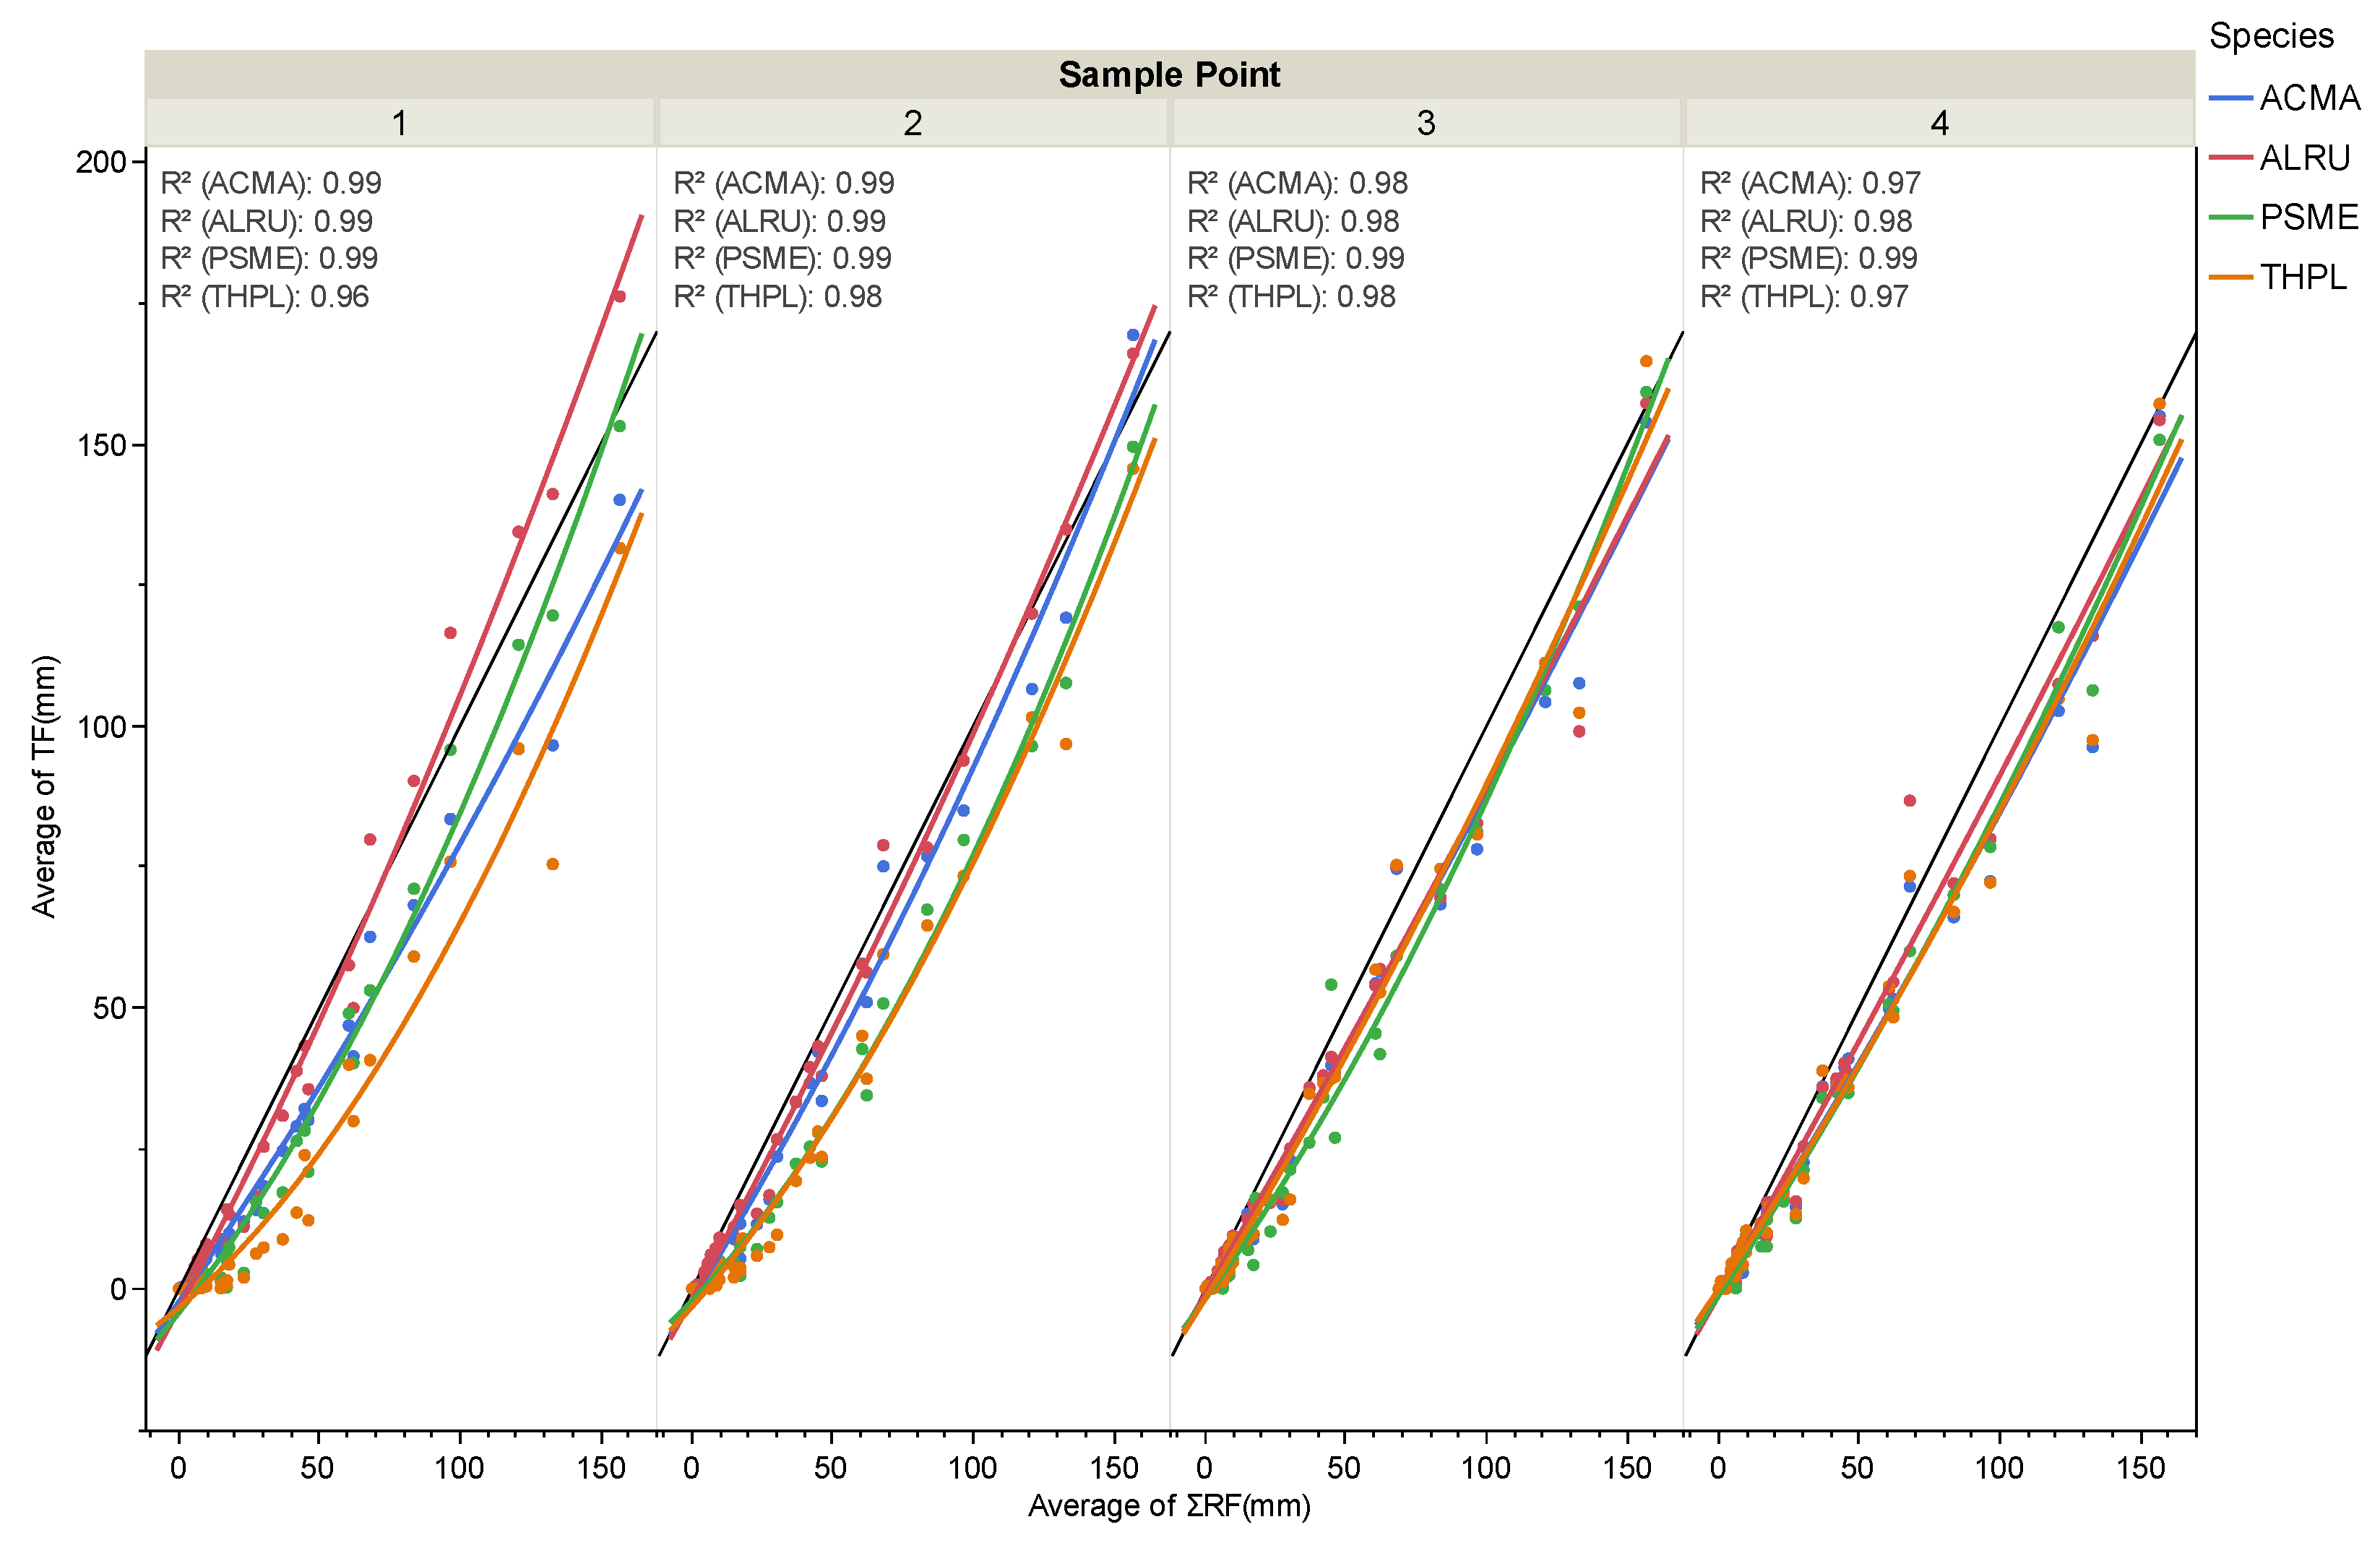
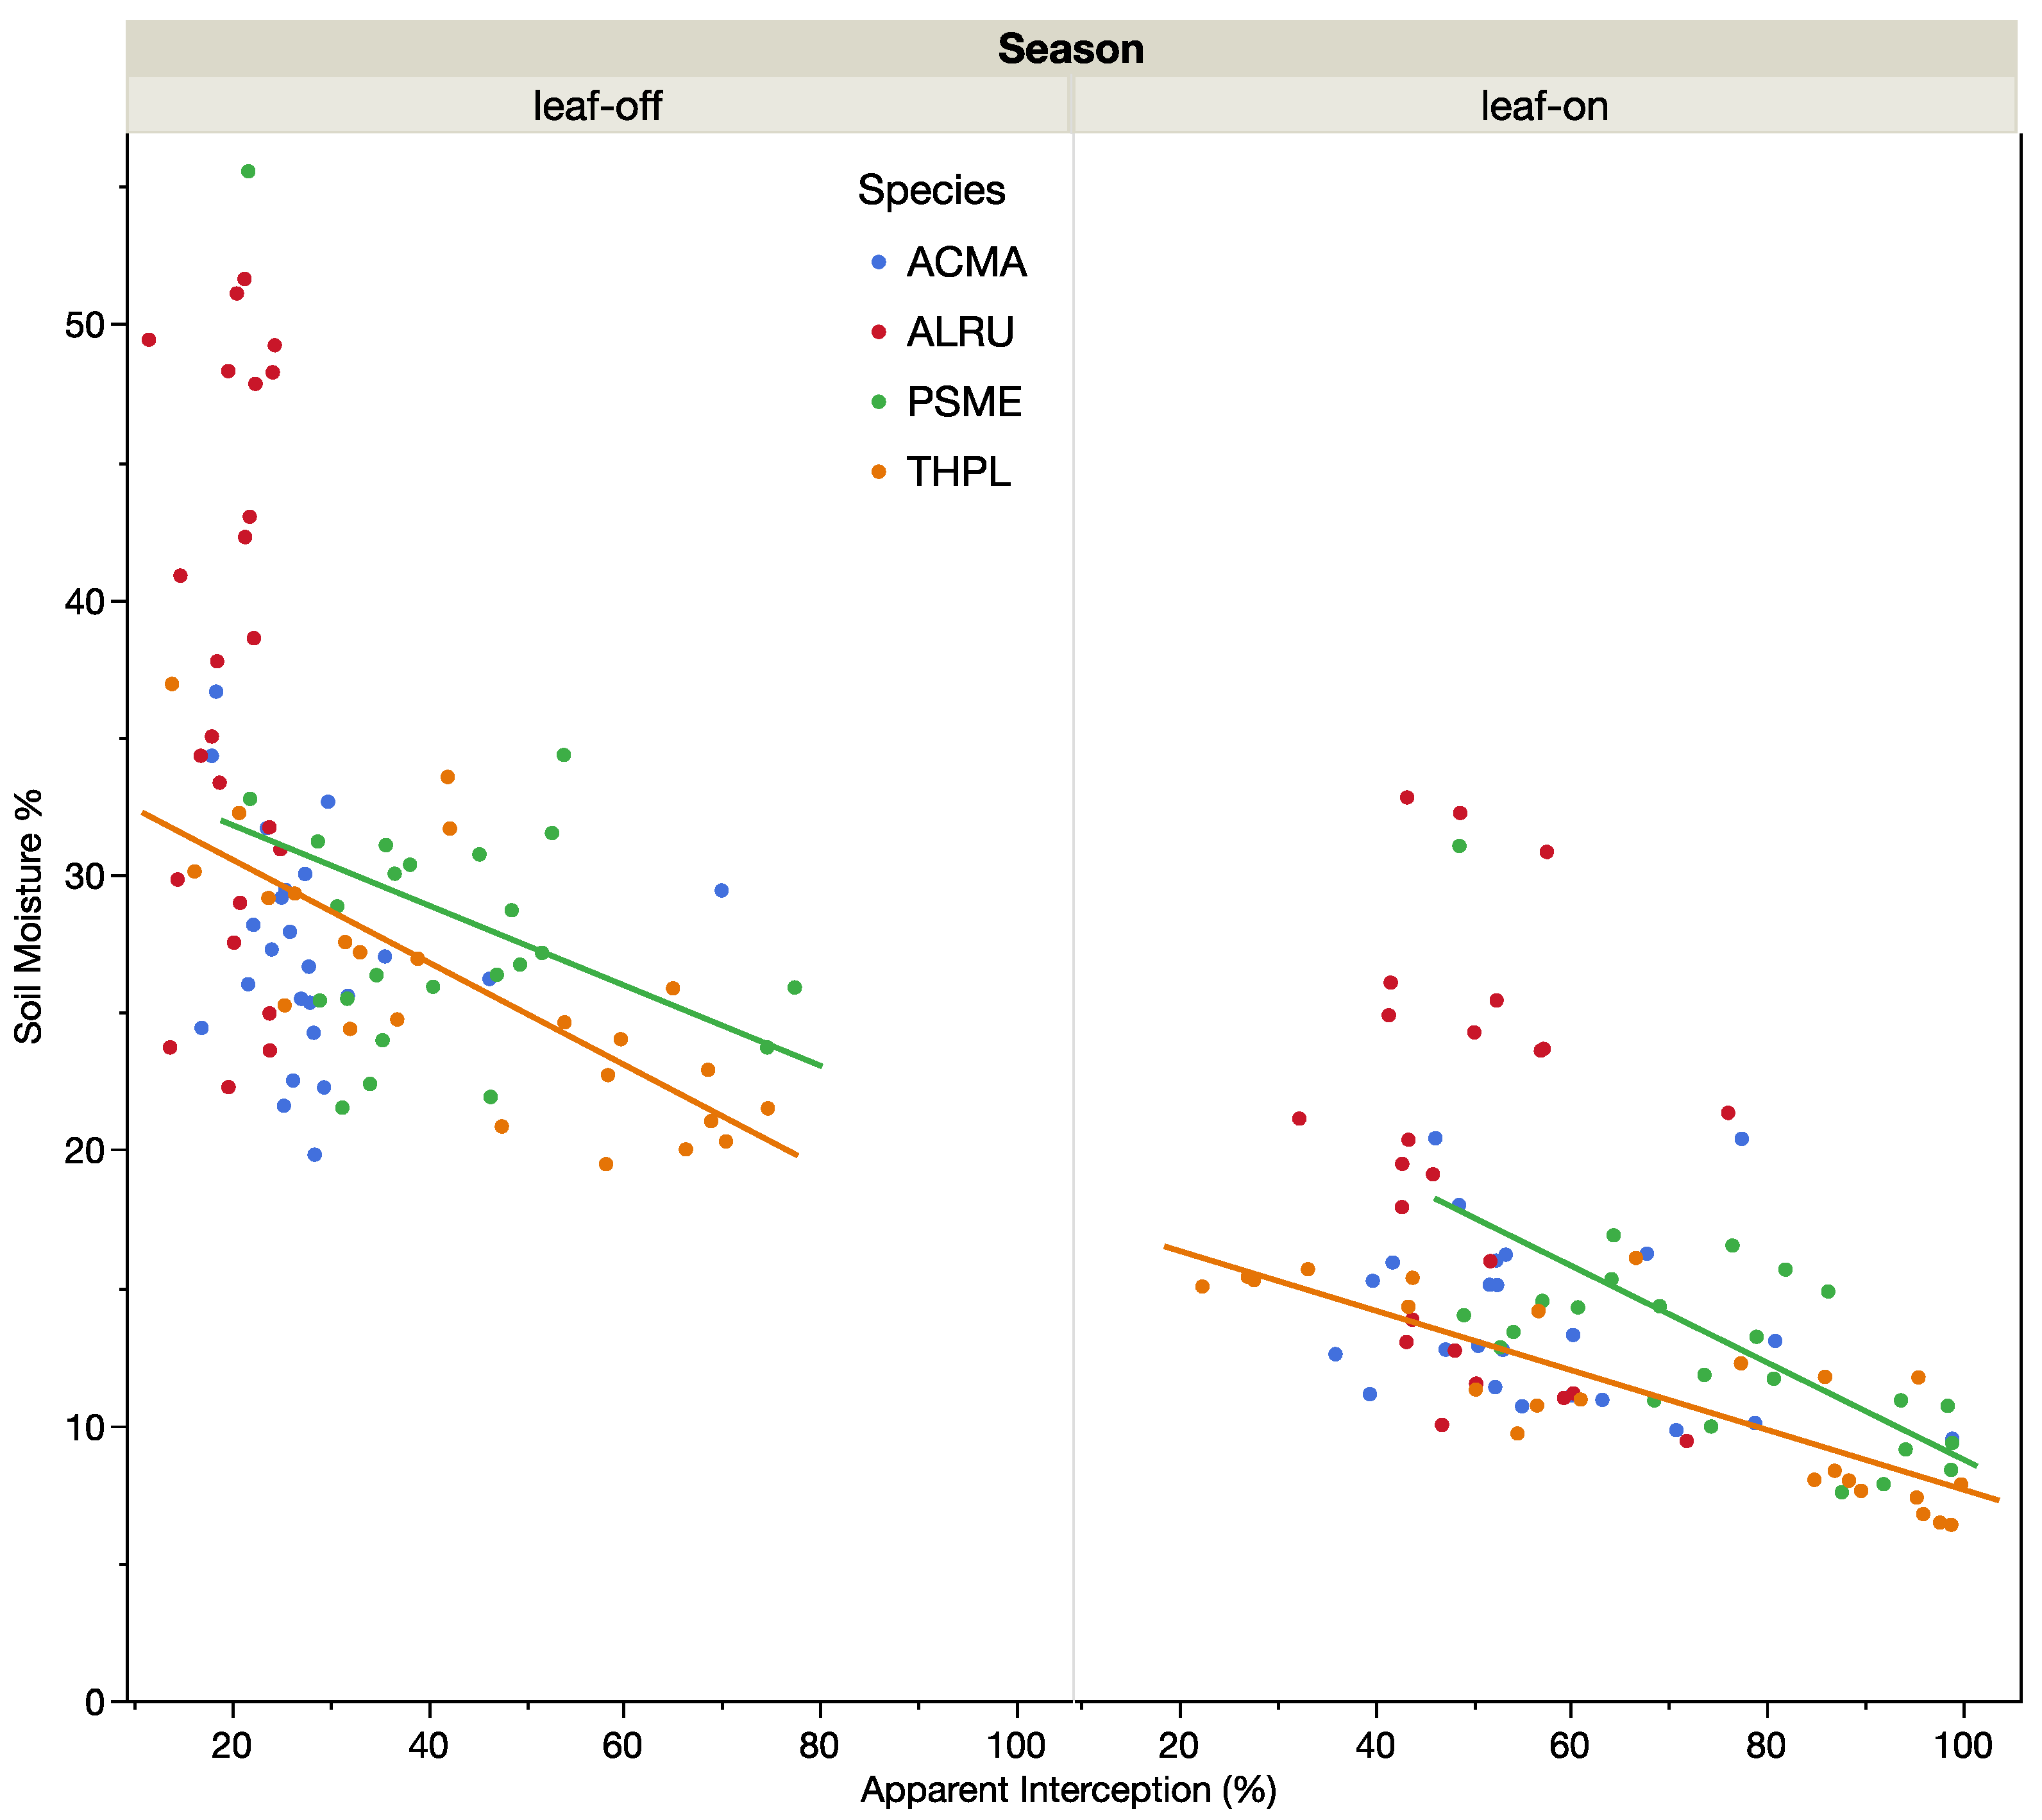
We visually compared patterns in Ic from the base of trees toward the edge of the canopy among species using cubic spline regression through average values for Ic by sample points. Each spline used a lambda value of 0.05 and four knots. Regression fits were derived separately for each species and season. Average Ic was the y-axis (dependent variable) for each species (averaged over trees and collection times), and the sample catchment point (distance from the tree base) was used as the x-axis (predictor variable). The spline parameters were optimized based on residual patterns in the data.
To further compare how patterns in Ic varied with tree species and distance from canopy, we conducted a multi-factor mixed model ANOVA analysis using a REML model within leaf-off and leaf-on seasons. In each analysis, Ic was averaged within season and then used as a dependent variable, while tree species was treated as an independent factor along with distance from base of tree (nested within tree identity), which was treated as a categorical factor to allow for non-linear trends with distance. Individual tree identity was used as the random effect in each model. Interactions between sampling point (distance category) and tree species were interpreted as significant differences in the pattern of Ic by tree species, and Tukey’s HSD tests were used to determine significant pairwise differences for each species and distance combination.
Linear regression was used to evaluate the relationships between raw throughfall data (response variable) and weekly precipitation totals (independent variable) within each distance category and species. Polynomial (quadratic) models were selected for all regressions based on even residual fits. This approach allowed for more curvilinear fits when appropriate, but quadratic fits approximated linear fits when data conformed to a more linear form—thus, the same model form could be used for all fits and still demonstrate curvilinear and more linear trends depending on the data. More curvilinear trends indicated a change in slope dependent on precipitation (e.g., effects of canopy storage and saturation).
Finally, we again used regression (simple linear regression) to determine whether soil moisture was predictable by Ic at each collection. Analyses were conducted for all data pooled, data separated by species, and data separated by species and leaf-off vs. leaf-on periods.
All analyses were conducted using JMP 12 (SAS Inc., Cary, NC, USA). An α of 0.05 was used to indicate significance in all tests.

3. Results

Patterns in the estimated canopy interception (Ic) from the base of trees out toward the edge of the canopy indicated highly divergent trends among species that were also dependent on leaf-off and leaf-on conditions (Figure 2). The deciduous species A. rubra demonstrated no trends with distance outward from the tree bole during leaf-off conditions, when Ic tended to be near 10%–15% and only occasionally reduced at measurements adjacent to the tree bole. The deciduous species A. macrophyllym, on the other hand, widely recognized for hosting dense epiphyte communities, intercepted nearly 50% of precipitation adjacent to the tree bole, and then Ic declined beyond 40% of the distance outward and away from the center of the tree (Figure 2). Beyond this distance, Ic was similar for both deciduous species. For the conifer species P. menziezii, interception declined evenly, from 70% to 30% from the center to the edge of the canopy. For T. plicata, Ic remained high (~60%) from adjacent to the tree bole to near 40% of the distance toward the outside of the tree, and beyond this distance Ic fell rapidly to levels below P. menziesii (Figure 2).
Confirmatory of the patterns discussed above, the REML model indicated strong effects of species by distance interactions (p < 0.0001; Table 2). In the leaf-on season (April–October), the two deciduous species (A. rubra and A. macrophyllum) were indistinguishable in Ic patterns from the tree bole to the outside of the canopy. Both species demonstrated a mild decline in Ic from 40%–50% near the center of the tree to near 30% at the outside of the canopy. In contrast, T. plicata demonstrated a pattern consistent with leaf-off periods where interception remained high from the center of the canopy to approximately 40% distance away from the canopy, where Ic dropped considerably (from 60%–70% to 30%–40%). The other conifer species, P. menziesii, showed a consistent average decline in Ic, similar to the patterns in leaf-off conditions (Figure 2). Additionally, the REML model results were consistent with the regression trends (Table 2).
Relationships between raw throughfall data and weekly precipitation totals (analyzed within distance categories) indicated curvilinear (polynomial) relationships between throughfall and amount of precipitation for the two conifer species (P. menziesii and T. plicata) that were more pronounced at the sample point nearest to the tree bole and more linear in form beyond sample point 2 (>40% of the canopy radius). Relationships were generally more variable among species near the tree bole but similar near the edge of the tree canopy (Figure 3). While most relationships indicated slopes below a 1:1 line at most precipitation amounts, an exception was A. rubra, where throughfall amounts exceeded precipitation values for high precipitation events near the tree bole (sample point 1; Figure 3). Similarly, at low precipitation amounts, throughfall was much less than precipitation near the tree bole for the species T. plicata—as indicated by the strong curvilinear relationship in Figure 3. Such relationships have previously been interpreted as indicative of canopy saturation points where the slope change occurs (approximately 50 mm precipitation at sample point 1) [9]. Across all species and distance categories, R2 values were generally between 0.96–0.99 (Figure 3; all relationships p < 0.001). Accordingly, throughfall patterns changed depending on precipitation amounts for conifer species, but less so for deciduous species, and there were apparent differences in such responses with the distance from the center to the edge of tree canopies (Figure 3).
Across all species, soil moisture was predictable based-on Ic, where soil moisture declined linearly with Ic (R2 = 0.50, p < 0.001). However, such patterns were more apparent for conifers, where similar relationships were present regardless of the season (Figure 4). In the leaf-off period, the negative relationship for P. menziesii was weaker (reciprocal fit, R2 = 0.22, p = 0.02) than during the leaf-on period (linear fit, R2 = 0.35, p = 0.001). Similarly, T. plicata had a slightly weaker relationship between Ic and soil moisture in the leaf-off period (linear model, R2 = 0.58, p < 0.001) compared to the leaf-on period (linear model, R2 = 0.69, p < 0.001). Patterns among conifers suggested that Ic could account for as much as a 10% decrease in soil moisture within each period, and pooled data from leaf-off and leaf-on periods resulted in significant relationships for all species (A. macrophyllum R2 = 0.5, p < 0.001; A. rubra R2 = 0.46, p < 0.001; P. menziesii, R2 = 0.59, p < 0.001; T. plicata, R2 = 0.53, p < 0.001; Figure 4).

4. Discussion

In a now classic reference, Zinke [33] described tree zones of influence in which individual tree canopies can have distinct spatial patterns in soil chemical properties underneath their canopies. While such “Zinke” effects have often been examined in the context of plant phytochemistry and soil chemistry [40], the simple physical process of intercepting or re-directing rainfall in high precipitation climates could similarly lead to altered environments for moisture-dependent processes underneath tree canopies [41,42]. Here, we show that radial patterns of canopy interception as a percentage of precipitation are different among four common species in Pacific Northwest forests.
Functional groups (e.g., conifer versus deciduous canopies) may differ in interception, but more nuanced spatial variation may occur at the species level. For example, other studies have similarly found pronounced spatial patterns in throughfall in coniferous compared to deciduous canopies [23]. In fact, differences in average rainfall interception between coniferous and deciduous tree types have been examined from local to global scales, and these estimates are within the range of the average values observed [21,25]. Nevertheless, species-specific differences in radial spatial patterns may be more nuanced. Some previous work across ecosystem and forest types has shown inconsistent trends with regard to spatial patterns of throughfall under trees [23,42]. Radial trends in canopy structure and throughfall may be highly species-specific—and hence variable in broad reviews spanning ecosystems and diverse species [25]. Our data support this supposition. Here, we found that two deciduous species had minimal, but not identical, patterning of canopy interception (Ic) during leaf-off. Two conifer species showed more distinct patterns of high Ic and either gradual (P. menziesii) or sharp (T. plicata) declines in Ic towards the edge of tree canopies. Further, relationships between total measured rainfall and measured throughfall suggested highly divergent curves for relationships near the tree bole among species but less so at the canopy margins. Relationships were curvilinear for one conifer species in particular (T. plicata)—suggesting interception is greater with low precipitation and approaches a 1:1 relationship with precipitation away from the tree bole and with higher total precipitation. The data suggest that the canopy saturation point [9] may occur at approximately 50 mm of precipitation at sample point 1 for T. plicata. Interestingly, one deciduous species may show enhanced throughfall near the tree bole under high rainfall events (A. rubra; Figure 2), consistent with the concept that branch architecture in the species may funnel water to locations near the tree base under high precipitation events [23]. Another deciduous species, A. marcrophyllum, has notable Ic values even during leaf-off periods, likely as a result of high bryophyte loads. These data are thus both consistent with other studies in Ic estimates, and suggestive of more nuanced species-specific spatial variation that is masked by average interception estimates.
Differences in the spatial patterns of precipitation can have extended consequences for a variety of critical ecosystem processes [34]. For example, a species like western red-cedar (T. plicata), which intercepts the majority of rainfall near the canopy center and then steeply reduced interception at canopy edges, may be associated with the “islands” of dry soil in forests associated with tree canopies—especially when precipitation is low. Reductions in throughfall near tree boles may be associated with reduced soil moisture, reduced rates of denitrification [43], and reduced decomposition, and could lead to higher spatial heterogeneity in soils. Soil processes are dependent on both spatial and temporal patterning in soil moisture [41], and patterns over time in the current dataset similarly showed that Ic varied between leaf-off versus leaf over time periods, specifically for deciduous species. While such patterns may seem obvious—intact tree canopies block rainfall—the quantification of these patterns may enable better modeling of spatial patterns in throughfall and soil moisture in diverse forest stands and clarify why acknowledging interspecific variation is so important [22,33,34,42].
Indeed, our coincident measurements of soil moisture and Ic suggested a strong relationship, particularly for conifer species. Weaker relationships with deciduous species may occur due to (1) weaker radial patterns in interception, and (2) higher precipitation totals occurring during the leaf-off season (when deciduous canopy leaves are not present to intercept rainfall). The consistency of patterns among our conifer species despite variation in precipitation among collection periods was surprising but also consistent with Keim et al. [23], who found a lack of variation in spatial patterns with storm throughfall volume. Nevertheless, we also expected that high rainfall events would overwhelm interception patterns that might be more abundant when rainfall was low, as speculated by Keim et al. [23]. We found relationships between throughfall and precipitation that were more dependent on tree species and location within the tree canopy—curvilinear relationships for conifers near the tree base, and more-linear relationships among deciduous species and near the canopy edge.
Rainfall that is intercepted by tree canopies must have one of three fates: evaporation back into the atmosphere, absorption by bark, wood, or epiphyte communities on tree branch surfaces, or runoff as stemflow or branch flow at the canopy edge (drip line). In our data, Ic during the leaf-on period was much higher than the typical annual interception rates, likely due to a higher vapor pressure deficit (VPD) and canopy evaporation during the warmer part of the year. However, during the leaf-off period in the Pacific Northwest (late fall–early spring), VPD is generally so low that rapid evaporation from tree canopies following precipitation events is likely a small contributor to the rate of intercepted precipitation. The absorption of water by wood and bark is likely low enough to be negligible, but absorption by bryophyte mats may be significant [24,32,44,45,46]. Between the two deciduous species measured here, there was an obvious difference in near-tree-bole canopy interception, where A. macrophyllum (known for hosting dense bryophyte mats up to 10 cm deep and covering 50%–90% of the bark surface [45]) had higher canopy interception amounts near the tree bole than A. rubra in the leaf-off period. A. rubra is known to host conspicuously fewer bryophytes and epiphytes than A. macrophyllum, although the apparent difference may be related to the typical branch surface area on mature trees [47]. Nevertheless, evaporation and absorption cannot account for all intercepted precipitation in both leaf-off and leaf-on periods. Accordingly, branch runoff and stemflow must account for the remaining fate of precipitation (and likely a greater proportion of canopy interception in the leaf-off period when VPD is low). Stemflow measurements at our site over a two-year time frame have suggested very small stemflow volumes (median < 1% of precipitation totals). Although our data did not detect enhanced throughfall values near the drip line, such “pour-off” points and large droplets may be spatially variable enough to have been missed by our catchments [22], and we suspect that enhanced throughfall at specific locations at the drip line is likely when canopy interception patterns are strong (e.g., for the species T. plicata). Such patterning would further enhance spatial patterns, resulting in drier soil conditions near tree boles and higher moisture at the canopy edge, especially for species with more dramatic differences in interception. For other species (e.g., A. rubra), high (or enhanced) throughfall may even occur near the center of the canopy. Regardless, our study demonstrates species-specific spatial variation despite potential methodological issues related to using canopy catchments to estimate Ic and the potential high spatial variability of drop-size distributions and throughfall in similar forests [6,7,19,22,42].

5. Conclusions

These data show that species-level differences influence hydrological dynamics in a temperate rainforest ecosystem. Species-level patterns were apparent both during leaf-off periods (when precipitation values are generally high), and during leaf-on periods inclusive of predictable summer drought climate patterns (when precipitation is low). Furthermore, patterns in canopy interception were correlated with soil moisture. Variations in interception and soil moisture can have important implications for ecosystem processes [41,43] and high runoff amounts at the landscape scale. Reduced soil moisture as a result of high interception, on the other hand, may be associated with reduced water infiltration, lower organic matter decomposition rates, and more limited moisture availability during drought [22,34,40,41,42]. Taken together, such effects suggest an important mechanism by which species variation can result in hydrologic “Zinke effects” in a temperate rainforest landscape [33,40]. Future research can build on these findings by generating spatial prediction surfaces for interception and soil moisture that can be matched to coincident measures of biological and ecosystem response variables.

Author Contributions

Conceptualization, D.G.F.; methodology, D.G.F. and S.T.V.; formal analysis, D.G.F.; resources, D.G.F.; data curation, S.T.V.; fieldwork, S.T.V. and D.G.F.; writing—original draft preparation, D.G.F. and S.T.V.; writing—review and editing, D.G.F. and A.D.J.; visualization, D.G.F.; supervision, D.G.F.; project administration, D.G.F.; funding acquisition, D.G.F. and A.D.J. All authors have read and agreed to the published version of the manuscript.

Funding

This research was funded by The Washington Department of Ecology, IAA no. C1900011, and Washington Department of Natural Resources IAA no. 93-097801. Sabbatical support to DGF was provided by The Evergreen State College.

Data Availability Statement

Data are available through the Open Science Framework website, https://osf.io/, upon article acceptance to the journal.

Acknowledgments

We would like to thank the Evergreen Ecosystem Ecology lab and the Evergreen State College Scientific Support staff for assistance in this work. We are especially thankful to Jade Jones-Hawk, Paul “Saul” Silberman, Chris Nolte, and Ryan Bartlett who provided extensive help with field data collection between 2019 and 2021. We thank Ben Leonard who contributed to theoretical discussions about interception patterns in PNW forests. Finally, we thank Abby Barnes, Linden Lampman, Keunyea Song, Brandi Lubliner, and Jamie Duberstein who contributed time and energy to the broad theoretical framework for better understanding tree contributions to PNW hydrology, which is ultimately responsible for inspiring this work.

Conflicts of Interest

The authors declare no conflict of interest.

References

  1. Horton, R.E. Rainfall Interception. Mon. Weather Rev. 1919, 47, 603–623. [Google Scholar] [CrossRef]
  2. Carlyle-Moses, D.E.; Gash, J.H.C. Rainfall Interception Loss by Forest Canopies. In Forest Hydrology and Biogeochemistry: Synthesis of Past Research and Future Directions; Ecological Studies; Levia, D.F., Carlyle-Moses, D., Tanaka, T., Eds.; Springer: Dordrecht, The Netherlands, 2011; pp. 407–423. ISBN 978-94-007-1363-5. [Google Scholar]
  3. David, J.; Valente, F.; Gash, J. Evaporation of Intercepted Rainfall. In Encyclopedia of Hydrological Sciences; Anderson, M.G., Ed.; John Wiley and Sons: Hoboken, NJ, USA, 2005; pp. 627–634. ISBN 978-04-708-4894-4. [Google Scholar]
  4. Muzylo, A.; Llorens, P.; Valente, F.; Keizer, J.J.; Domingo, F.; Gash, J.H.C. A Review of Rainfall Interception Modelling. J. Hydrol. 2009, 370, 191–206. [Google Scholar] [CrossRef] [Green Version]
  5. Sadeghi, S.M.M.; Gordon, D.A.; Van Stan, J.T., II. A Global Synthesis of Throughfall and Stemflow Hydrometeorology. In Precipitation Partitioning by Vegetation: A Global Synthesis; Van Stan, I., John, T., Gutmann, E., Friesen, J., Eds.; Springer International Publishing: Cham, Switzerland, 2020; pp. 49–70. ISBN 978-3-030-29702-2. [Google Scholar]
  6. Asadian, Y.; Weiler, M. A New Approach in Measuring Rainfall Interception by Urban Trees in Coastal British Columbia. Water Qual. Res. J. 2009, 44, 16–25. [Google Scholar] [CrossRef]
  7. Crockford, R.H.; Richardson, D.P. Partitioning of Rainfall in a Eucalypt Forest and Pine Plantation in Southeastern Australia: I Throughfall Measurement in a Eucalypt Forest: Effect of Method and Species Composition. Hydrol. Process. 1990, 4, 131–144. [Google Scholar] [CrossRef]
  8. Llorens, P.; Poch, R.; Latron, J.; Gallart, F. Rainfall Interception by a Pinus sylvestris Forest Patch Overgrown in a Mediterranean Mountainous Abandoned Area I. Monitoring Design and Results down to the Event Scale. J. Hydrol. 1997, 199, 331–345. [Google Scholar] [CrossRef]
  9. Link, T.E.; Unsworth, M.; Marks, D. The Dynamics of Rainfall Interception by a Seasonal Temperate Rainforest. Agric. For. Meteorol. 2004, 124, 171–191. [Google Scholar] [CrossRef] [Green Version]
  10. Llorens, P.; Domingo, F. Rainfall Partitioning by Vegetation under Mediterranean Conditions. A Review of Studies in Europe. J. Hydrol. 2007, 335, 37–54. [Google Scholar] [CrossRef]
  11. Miralles, D.G.; Gash, J.H.; Holmes, T.R.H.; de Jeu, R.A.M.; Dolman, A.J. Global Canopy Interception from Satellite Observations. J. Geophys. Res. Atmos. 2010, 115, D16122. [Google Scholar] [CrossRef]
  12. Sadeghi, S.M.M.; Attarod, P.; Van Stan, J.T.; Pypker, T.G. The Importance of Considering Rainfall Partitioning in Afforestation Initiatives in Semiarid Climates: A Comparison of Common Planted Tree Species in Tehran, Iran. Sci. Total Environ. 2016, 568, 845–855. [Google Scholar] [CrossRef]
  13. Sadeghi, S.M.M.; Van Stan, J.T.; Pypker, T.G.; Friesen, J. Canopy Hydrometeorological Dynamics across a Chronosequence of a Globally Invasive Species, Ailanthus altissima (Mill., Tree of Heaven). Agric. For. Meteorol. 2017, 240–241, 10–17. [Google Scholar] [CrossRef]
  14. Sadeghi, S.M.M.; Van Stan, J.T.; Pypker, T.G.; Tamjidi, J.; Friesen, J.; Farahnaklangroudi, M. Importance of Transitional Leaf States in Canopy Rainfall Partitioning Dynamics. Eur. J. For. Res. 2018, 137, 121–130. [Google Scholar] [CrossRef]
  15. Fathizadeh, O.; Sadeghi, S.M.M.; Holder, C.D.; Su, L. Leaf Phenology Drives Spatio-Temporal Patterns of Throughfall under a Single Quercus castaneifolia C.A.Mey. Forests 2020, 11, 688. [Google Scholar] [CrossRef]
  16. Bouten, W.; Heimovaara, T.J.; Tiktak, A. Spatial Patterns of Throughfall and Soil Water Dynamics in a Douglas Fir Stand. Water Resour. Res. 1992, 28, 3227–3233. [Google Scholar] [CrossRef]
  17. Beier, C. Water and Element Fluxes Calculated in a Sandy Forest Soil Taking Spatial Variability into Account. For. Ecol. Manag. 1998, 101, 269–280. [Google Scholar] [CrossRef]
  18. Baba, M.; Okazaki, M. Spatial Variability of Soil Solution Chemistry under Hinoki Cypress (Chamaecyparis obtusa) in Tama Hills. Soil Sci. Plant Nutr. 1999, 45, 321–336. [Google Scholar] [CrossRef]
  19. Raat, K.J.; Draaijers, G.P.J.; Schaap, M.G.; Tietema, A.; Verstraten, J.M. Spatial Variability of Throughfall Water and Chemistry and Forest Floor Water Content in a Douglas Fir Forest Stand. Hydrol. Earth Syst. Sci. 2002, 6, 363–374. [Google Scholar] [CrossRef]
  20. Voigt, G.K. Distribution of Rainfall under Forest Stands. For. Sci. 1960, 6, 2–10. [Google Scholar]
  21. Yue, K.; De Frenne, P.; Fornara, D.A.; Van Meerbeek, K.; Li, W.; Peng, X.; Ni, X.; Peng, Y.; Wu, F.; Yang, Y.; et al. Global Patterns and Drivers of Rainfall Partitioning by Trees and Shrubs. Glob. Chang. Biol. 2021, 27, 3350–3357. [Google Scholar] [CrossRef]
  22. Levia, D.F.; Hudson, S.A.; Llorens, P.; Nanko, K. Throughfall Drop Size Distributions: A Review and Prospectus for Future Research. WIREs Water 2017, 4, e1225. [Google Scholar] [CrossRef] [Green Version]
  23. Keim, R.F.; Skaugset, A.E.; Weiler, M. Temporal Persistence of Spatial Patterns in Throughfall. J. Hydrol. 2005, 314, 263–274. [Google Scholar] [CrossRef]
  24. Nadkarni, N.M.; Sumera, M.M. Old-Growth Forest Canopy Structure and Its Relationship to Throughfall Interception. For. Sci. 2004, 50, 290–298. [Google Scholar]
  25. Lian, X.; Zhao, W.; Gentine, P. Recent Global Decline in Rainfall Interception Loss Due to Altered Rainfall Regimes. Nat. Commun. 2022, 13, 7642. [Google Scholar] [CrossRef]
  26. Moore, G.W.; Bond, B.J.; Jones, J.A.; Phillips, N.; Meinzer, F.C. Structural and Compositional Controls on Transpiration in 40- and 450-Year-Old Riparian Forests in Western Oregon, USA. Tree Physiol. 2004, 24, 481–491. [Google Scholar] [CrossRef] [PubMed] [Green Version]
  27. Moore, G.W.; Bond, B.J.; Jones, J.A. A Comparison of Annual Transpiration and Productivity in Monoculture and Mixed-Species Douglas-Fir and Red Alder Stands. For. Ecol. Manag. 2011, 262, 2263–2270. [Google Scholar] [CrossRef]
  28. Ryan, M.G.; Yoder, B.J. Hydraulic Limits to Tree Height and Tree Growth. BioScience 1997, 47, 235–242. [Google Scholar] [CrossRef] [Green Version]
  29. McDowell, N.G.; Phillips, N.; Lunch, C.; Bond, B.J.; Ryan, M.G. An Investigation of Hydraulic Limitation and Compensation in Large, Old Douglas-Fir Trees. Tree Physiol. 2002, 22, 763–774. [Google Scholar] [CrossRef] [Green Version]
  30. Massman, W.J. The Derivation and Validation of a New Model for the Interception of Rainfall by Forests. Agric. Meteorol. 1983, 28, 261–286. [Google Scholar] [CrossRef]
  31. Bond, B.J.; Jones, J.A.; Moore, G.; Phillips, N.; Post, D.; McDonnell, J.J. The Zone of Vegetation Influence on Baseflow Revealed by Diel Patterns of Streamflow and Vegetation Water Use in a Headwater Basin. Hydrol. Process. 2002, 16, 1671–1677. [Google Scholar] [CrossRef]
  32. Gauslaa, Y.; Goward, T.; Asplund, J. Canopy Throughfall Links Canopy Epiphytes to Terrestrial Vegetation in Pristine Conifer Forests. Fungal Ecol. 2021, 52, 101075. [Google Scholar] [CrossRef]
  33. Zinke, P.J. The Pattern of Influence of Individual Forest Trees on Soil Properties. Ecology 1962, 43, 130–133. [Google Scholar] [CrossRef]
  34. Fischer, D.G.; Hart, S.C.; Whitham, T.G.; Martinsen, G.D.; Keim, P. Ecosystem Implications of Genetic Variation in Water-Use of a Dominant Riparian Tree. Oecologia 2004, 139, 288–297. [Google Scholar] [CrossRef] [PubMed]
  35. Fischer, D.G.; Dickson, B.G.; Whitham, T.G.; Hart, S.C. Self-Similarity, Leaf Litter Traits, and Neighborhood Predicting Fine Root Dynamics in a Common-Garden Forest. Front. Environ. Sci. 2019, 7, 142. [Google Scholar] [CrossRef]
  36. Sensoy, H.; Tanyel, M. Effect of Heavy Rain Conditions on Throughfall in Evergreens and Conifers in Urban Settings. Pol. J. Environ. Stud. 2021, 31, 271–279. [Google Scholar] [CrossRef]
  37. The Evergreen State College. The Evergreen State College Weather Station. Available online: https://weather.evergreen.edu/ (accessed on 12 December 2022).
  38. Kirsch, J.L.; Fischer, D.G.; Kazakova, A.N.; Biswas, A.; Kelm, R.E.; Carlson, D.W.; LeRoy, C.J. Diversity-Carbon Flux Relationships in a Northwest Forest. Diversity 2012, 4, 33–58. [Google Scholar] [CrossRef] [Green Version]
  39. Rex, I.; Fischer, D.G.; Bartlett, R. A Decade of Understory Community Dynamics and Stability in a Mature Second-Growth Forest in Western Washington. Northwest Sci. 2023; in press. [Google Scholar]
  40. Waring, B.; Alvarez-Cansino, L.; Barry, K.; Becklund, K.; Dale, S.; Gei, M.; Keller, A.; Lopez, O.; Markesteijn, L.; Mangan, S.; et al. Pervasive and Strong Effects of Plants on Soil Chemistry: A Meta-Analysis of Individual Plant ‘Zinke’ Effects. Proc. R. Soc. B Biol. Sci. 2015, 282, 20151001. [Google Scholar] [CrossRef] [PubMed]
  41. McClain, M.E.; Boyer, E.W.; Dent, C.L.; Gergel, S.E.; Grimm, N.B.; Groffman, P.M.; Hart, S.C.; Harvey, J.W.; Johnston, C.A.; Mayorga, E.; et al. Biogeochemical Hot Spots and Hot Moments at the Interface of Terrestrial and Aquatic Ecosystems. Ecosystems 2003, 6, 301–312. [Google Scholar] [CrossRef]
  42. Levia, D.; Frost, E. Variability of Throughfall Volume and Solute Inputs in Wooded Ecosytems. Prog. Phys. Geogr. 2006, 30, 605–632. [Google Scholar] [CrossRef]
  43. Groffman, P.M.; Butterbach-Bahl, K.; Fulweiler, R.W.; Gold, A.J.; Morse, J.L.; Stander, E.K.; Tague, C.; Tonitto, C.; Vidon, P. Challenges to Incorporating Spatially and Temporally Explicit Phenomena (Hotspots and Hot Moments) in Denitrification Models. Biogeochemistry 2009, 93, 49–77. [Google Scholar] [CrossRef]
  44. Pypker, T.; Unsworth, M.; Bond, B. The Role of Epiphytes in Rainfall Interception by Forests in the Pacific Northwest. I. Laboratory Measurements of Water Storage. Can. J. For. Res. Rev. Can. Rech. For. 2006, 36, 809–818. [Google Scholar] [CrossRef] [Green Version]
  45. Nadkarni, N.M. Biomass and Mineral Capital of Epiphytes in an Acer macrophyllum Community of a Temperate Moist Coniferous Forest, Olympic Peninsula, Washington State. Can. J. Bot. 1984, 62, 2223–2228. [Google Scholar] [CrossRef]
  46. Van Stan, J.T.; Pypker, T.G. A Review and Evaluation of Forest Canopy Epiphyte Roles in the Partitioning and Chemical Alteration of Precipitation. Sci. Total Environ. 2015, 536, 813–824. [Google Scholar] [CrossRef] [PubMed]
  47. Peck, J.E. The Association of Commercially Harvestable Bryophytes and Their Host Species in Northwestern Oregon. Bryologist 1997, 100, 383–393. [Google Scholar] [CrossRef]
Figure 1. Study site used in the current study. Insets represent (right to left) broad geographic location, location relative to the Puget Sound (Washington state), and specific study location inside the Evergreen State College Forest Reserve. The main image represents the LiDAR-derived tree height (2017). White values represent maximum tree height (~63 m), and black represents ground. Trees used in the study ranged from 22–30 m tall within the study area.
Forests 14 00144 g001
Figure 2. Catchment interception and adjacent soil moisture in relation to distance from trees. Relationships represent cubic spline regression fits the data. Top panels: relationships between catchment sample point and estimated canopy interception of throughfall under four species of tree in leaf-off and leaf-on periods. Bottom panels: relationship between soil moisture and sample points. For all points, catchment and soil moisture values represented are averaged by species and collection period. Species codons in the legend refer to A. macrophyllum (ACMA), A. rubra (ALRU), P. menziesii (PSME), and T. plicata (THPL).
Forests 14 00144 g002
Figure 3. Simple linear regression relationships between precipitation (ΣRF) and throughfall (TF) averaged by species for each collection period and catchment sample point throughout the study. Sample point 1: represents locations adjacent to tree bases. Sample point 2: represents locations ~40% away from the tree base. Sample point 3: represents locations ~70% from the base. Sample point 4: at the canopy edge. In all panels, the colored lines reflect the different species, while the black line represents a 1:1 line. Species codons in the legend refer to A. macrophyllum (ACMA), A. rubra (ALRU), P. menziesii (PSME), and T. plicata (THPL). Deviations of slopes among species and curvilinear (polynomial) fits are more apparent for collections at the base of trees, while more linear relationships are common at distances greater than 40% of the canopy width.
Forests 14 00144 g003
Figure 4. Linear regression relationships between apparent canopy interception (%) and soil moisture (%) in the leaf-off period (left panel) and the leaf-on period (right panel). Species codons in the legend refer to A. macrophyllum (ACMA), A. rubra (ALRU), P. menziesii (PSME), and T. plicata (THPL). Significant relationships within leaf-off and leaf-on periods were only present for the two conifer species (leaf-off: P. menziesii R2 = 0.22, p = 0.02, T. plicata R2 = 0.58, p < 0.001; leaf-on: P. menziesii: R2 = 0.35, p = 0.001, T. plicata R2 = 0.69, p < 0.001). All species showed significant relationships when both periods were pooled (p < 0.05).
Forests 14 00144 g004
Table 1. Tree characteristics of the species used in this study.
Max Cover (%), Distance from Tree (m)
Catchment Point
SpeciesDBH 1 (cm)1234
Acer
macrophyllum
41.386.30.286.02.287.04.187.36.0
33.386.40.486.42.385.54.285.86.2
30.487.30.584.12.382.63.983.25.7
39.380.90.486.52.682.24.482.56.3
29.479.90.380.61.583.42.687.43.8
51.183.30.581.62.184.73.684.15.1
Alnus rubra39.781.60.381.51.680.33.080.84.1
32.287.10.384.31.082.41.881.42.3
33.477.70.277.41.177.11.977.74.2
36.986.00.484.31.583.42.682.94.0
38.283.20.482.11.580.82.580.73.6
33.483.70.482.81.482.42.782.84.0
Pseudotsuga menziesii42.291.60.387.61.588.82.854.34.2
42.184.80.386.81.885.73.084.44.4
36.283.80.283.61.886.73.386.74.7
47.884.10.383.91.785.13.084.24.4
5285.20.384.82.286.54.087.05.9
69.885.30.584.71.583.22.681.43.7
Thuja plicata73.287.20.681.72.668.84.358.86.5
58.893.50.391.22.578.64.277.06.0
107.487.30.482.62.180.33.973.25.4
62.386.90.590.22.689.74.987.87.3
113.789.90.589.72.090.43.787.85.2
85.289.30.487.82.085.13.684.75.1
1 DBH refers to tree diameter measured at 1.4 m above the ground.
Table 2. Tukey’s test results from pairwise comparisons of species by sample point interactions. Shared letters within leaf-off and leaf-on periods represent non-significant differences (p > 0.05), and non-shared letters represent significant pairwise differences among all species and sample points.
Catchment Sample Point
Forests 14 00144 i001Forests 14 00144 i002 Forests 14 00144 i003Forests 14 00144 i004Forests 14 00144 i005Forests 14 00144 i006Forests 14 00144 i007Forests 14 00144 i008
1234123412341234
A. macrophyllumA. rubraP. menziesiiT. plicata
Leaf-Off AA AA
B BB B
CC C CC CC
DDDDDDD DD DD
Leaf-On AA AA
B BB B
CC C CC
DD D D D
EE EE E E
FFFFF F F
GG GGG G GG
1 Significant models (leaf-off: R2 = 0.84, p < 0.001; leaf-on: R2 = 0.86, p < 0.001) and significant interactions were present in leaf-off (F [9.60] = 7.99, p < 0.001) and leaf-on (F [9.60] = 6.76, p < 0.001) seasons. Sample point (F [3.60] = 35.61, p < 0.001) and species (F [3.20] = 29.07, p < 0.001) were significant effects.
Disclaimer/Publisher’s Note: The statements, opinions and data contained in all publications are solely those of the individual author(s) and contributor(s) and not of MDPI and/or the editor(s). MDPI and/or the editor(s) disclaim responsibility for any injury to people or property resulting from any ideas, methods, instructions or products referred to in the content.

