Article

Harmonious Degree of Sound Sources Influencing Visiting Experience in Kulangsu Scenic Area, China

1
School of Architecture and Urban-Rural Planning, Fuzhou University, Fuzhou 350108, China
2
Institute of Geography, Ruhr University Bochum, 44801 Bochum, Germany
3
Fujian Key Laboratory of Digital Technology for Territorial Space Analysis and Simulation, Fuzhou University, Fuzhou 350108, China
4
Institute of Environmental Planning, Leibniz University Hannover, Herrenhäuser Str. 2, 30419 Hanover, Germany
*
Author to whom correspondence should be addressed.
Forests 2023, 14(1), 138; https://doi.org/10.3390/f14010138
Submission received: 1 December 2022 / Revised: 5 January 2023 / Accepted: 10 January 2023 / Published: 12 January 2023
(This article belongs to the Special Issue Landsenses in Green Spaces)

Abstract

:
Soundscapes are important resources and contribute to high-quality visiting experiences in scenic areas. Based on a public investigation of 195 interviewees in the Kulangsu scenic area, this study aimed to explore the relationships between the harmonious degree of sound sources (SHD) and visiting experience indicators, in terms of soundscape perception, as well as the satisfaction degree of visual landscape and comprehensive impression. The results suggested that the dominating positions of human sounds did not totally suppress the perception of natural sounds such as birdsong and sea waves in the scenic area. Natural sound sources also showed a higher harmonious degree than other artificial sounds. Significant relationships existed between the SHD of most sound sources and the visiting experience indicators. Natural sounds were closely related to pleasant and comfortable soundscape perception, while mechanical sound sources were mainly related to eventful and varied soundscapes. The close relationships between certain sound sources and the satisfaction degree of the visual landscape and comprehensive impression evaluation indicated the effectiveness of audio-visual and even multi-sensory approaches to enhance visiting experience. The structural equation model further revealed that (1) natural sound was the most influential sound source of soundscape and visual landscape perception; (2) human sounds and mechanical sounds all showed significant positive effects on soundscape perception; and (3) indirect relationships could exist in the SHD of sound sources with comprehensive impression evaluation. The results can facilitate targeted soundscape and landscape management and landsense creation with the aim of improving visiting experience.

1. Introduction

As an important part of urban green infrastructure and urban ecosystems, scenic areas play the roles of meeting people’s expectations or visions of the natural ecological and cultural environment and providing their needs in various aspects such as health-related, aesthetic, and cultural experiences [1,2,3]. In fact, the realization of these visions and needs is a complex process [4]. In practice, designers or managers usually endow or integrate one or more of their visions into a carrier through appropriate manifestation forms, so that others (including themselves) can graft these visions from this carrier and associated manifestation forms, and then satisfy the needs generated by their own visions [5]. This highlights the importance of the carrier, that is, the landsense element [6]. Effective management of the various landsense elements in the scenic areas will therefore help to optimize the planning and design of these areas and to achieve a resonance between the practices and the vision of people [7,8].
At the same time, it is worth noting that people’s perception of these landsense elements is mainly achieved through the five senses, i.e., the interaction of landsense elements with human senses to produce landscape experiences (landsense effects) [5]. This is what landsenses ecology highlights—the interaction between human perception and landscape [6]. That is, the multidimensional sensory perception of the landscape is a central part of the overall visiting experience [9]. However, many of the previous researchs on the visiting experience have focused on the visual dimension, neglecting the role of the other senses [10,11,12,13], which limits our understanding of complex environments, as visualization only describes a fragment of a given landscape [14]. There is a growing interest in sensory perception other than vision, with new sensory perception research focusing on auditory perception, as it is the second most important way of perceiving the environment after the visual [15]. For example, Agapito et al. found that in the context of rural destinations, the frequency of auditory impressions reported by visitors regarding their sensory experiences (23%) was second only to visual elements (26%) [16]. The tourism industry, while prosperous, has also brought many problems, including the destruction of the acoustic environment by the noise generated during the visit, which affects people’s perception of the unique sound sources in a scenic area, including natural and cultural sounds. Soundscape, as the acoustic environment perceived or experienced and/or understood by a person or people, in context [17], has been drawing increasing attention from researchers, also as an important resource in scenic areas. For example, it has been found that soundscapes can induce specific perceptions that cannot be experienced through visual stimuli, and can provide a unique set of emotional supports [18]. Soundscapes have a different impact on visitors’ cognition and emotions than visual landscapes based on the cognitive–emotional model [19]. However, the coherence between soundscape and landscape has also been highlighted in several studies, both as a direct influence on overall visit satisfaction [19], and as a variable that mediates the impact of soundscape perception on the visiting experience [20].
In addition, the definition of soundscape differs from traditional acoustics in that it emphasizes the relationship between subjective human perception and the acoustic environment [17]. This is perfectly in line with the viewpoint emphasized by landsenses ecology [6]. In addition, what is highlighted by soundscape is precisely the interaction between the human auditory sense and the acoustic environment. It should be particularly noted that sound sources play key roles in this process, being important carriers or landsenses elements. Different sound sources, perceived by different individuals in different contexts, could form completely different soundscapes [21]. In this regard, some researchers have explored the perception characteristics of sound sources, such as perceived occurrences, perceived loudness, dominance and preference [1,22], in order to reveal how they contribute to soundscape perception, as well as visual perception, environmental satisfaction, and restorative benefits [23,24,25,26], etc. Therefore, it is essential to explore to what extent the existence of certain sound sources in a landscape corresponds to a person’s preference, and how this correlation relates to the visiting experience. This will be an important guide for the management and protection of soundscapes in scenic areas and the enhancement of their quality. This is because, in concrete soundscape practice, people also often manage or change the sound source and the acoustic environment to achieve the ultimate soundscape creation [27]. In addition, this is a very important part of landsenses ecology, i.e., landsense creation. By integrating a vision with an existing carrier or a newly constructed one, people achieve the process of landsense creation [5]. This process is also reflected in the protection and management of soundscape resources in scenic areas [8].
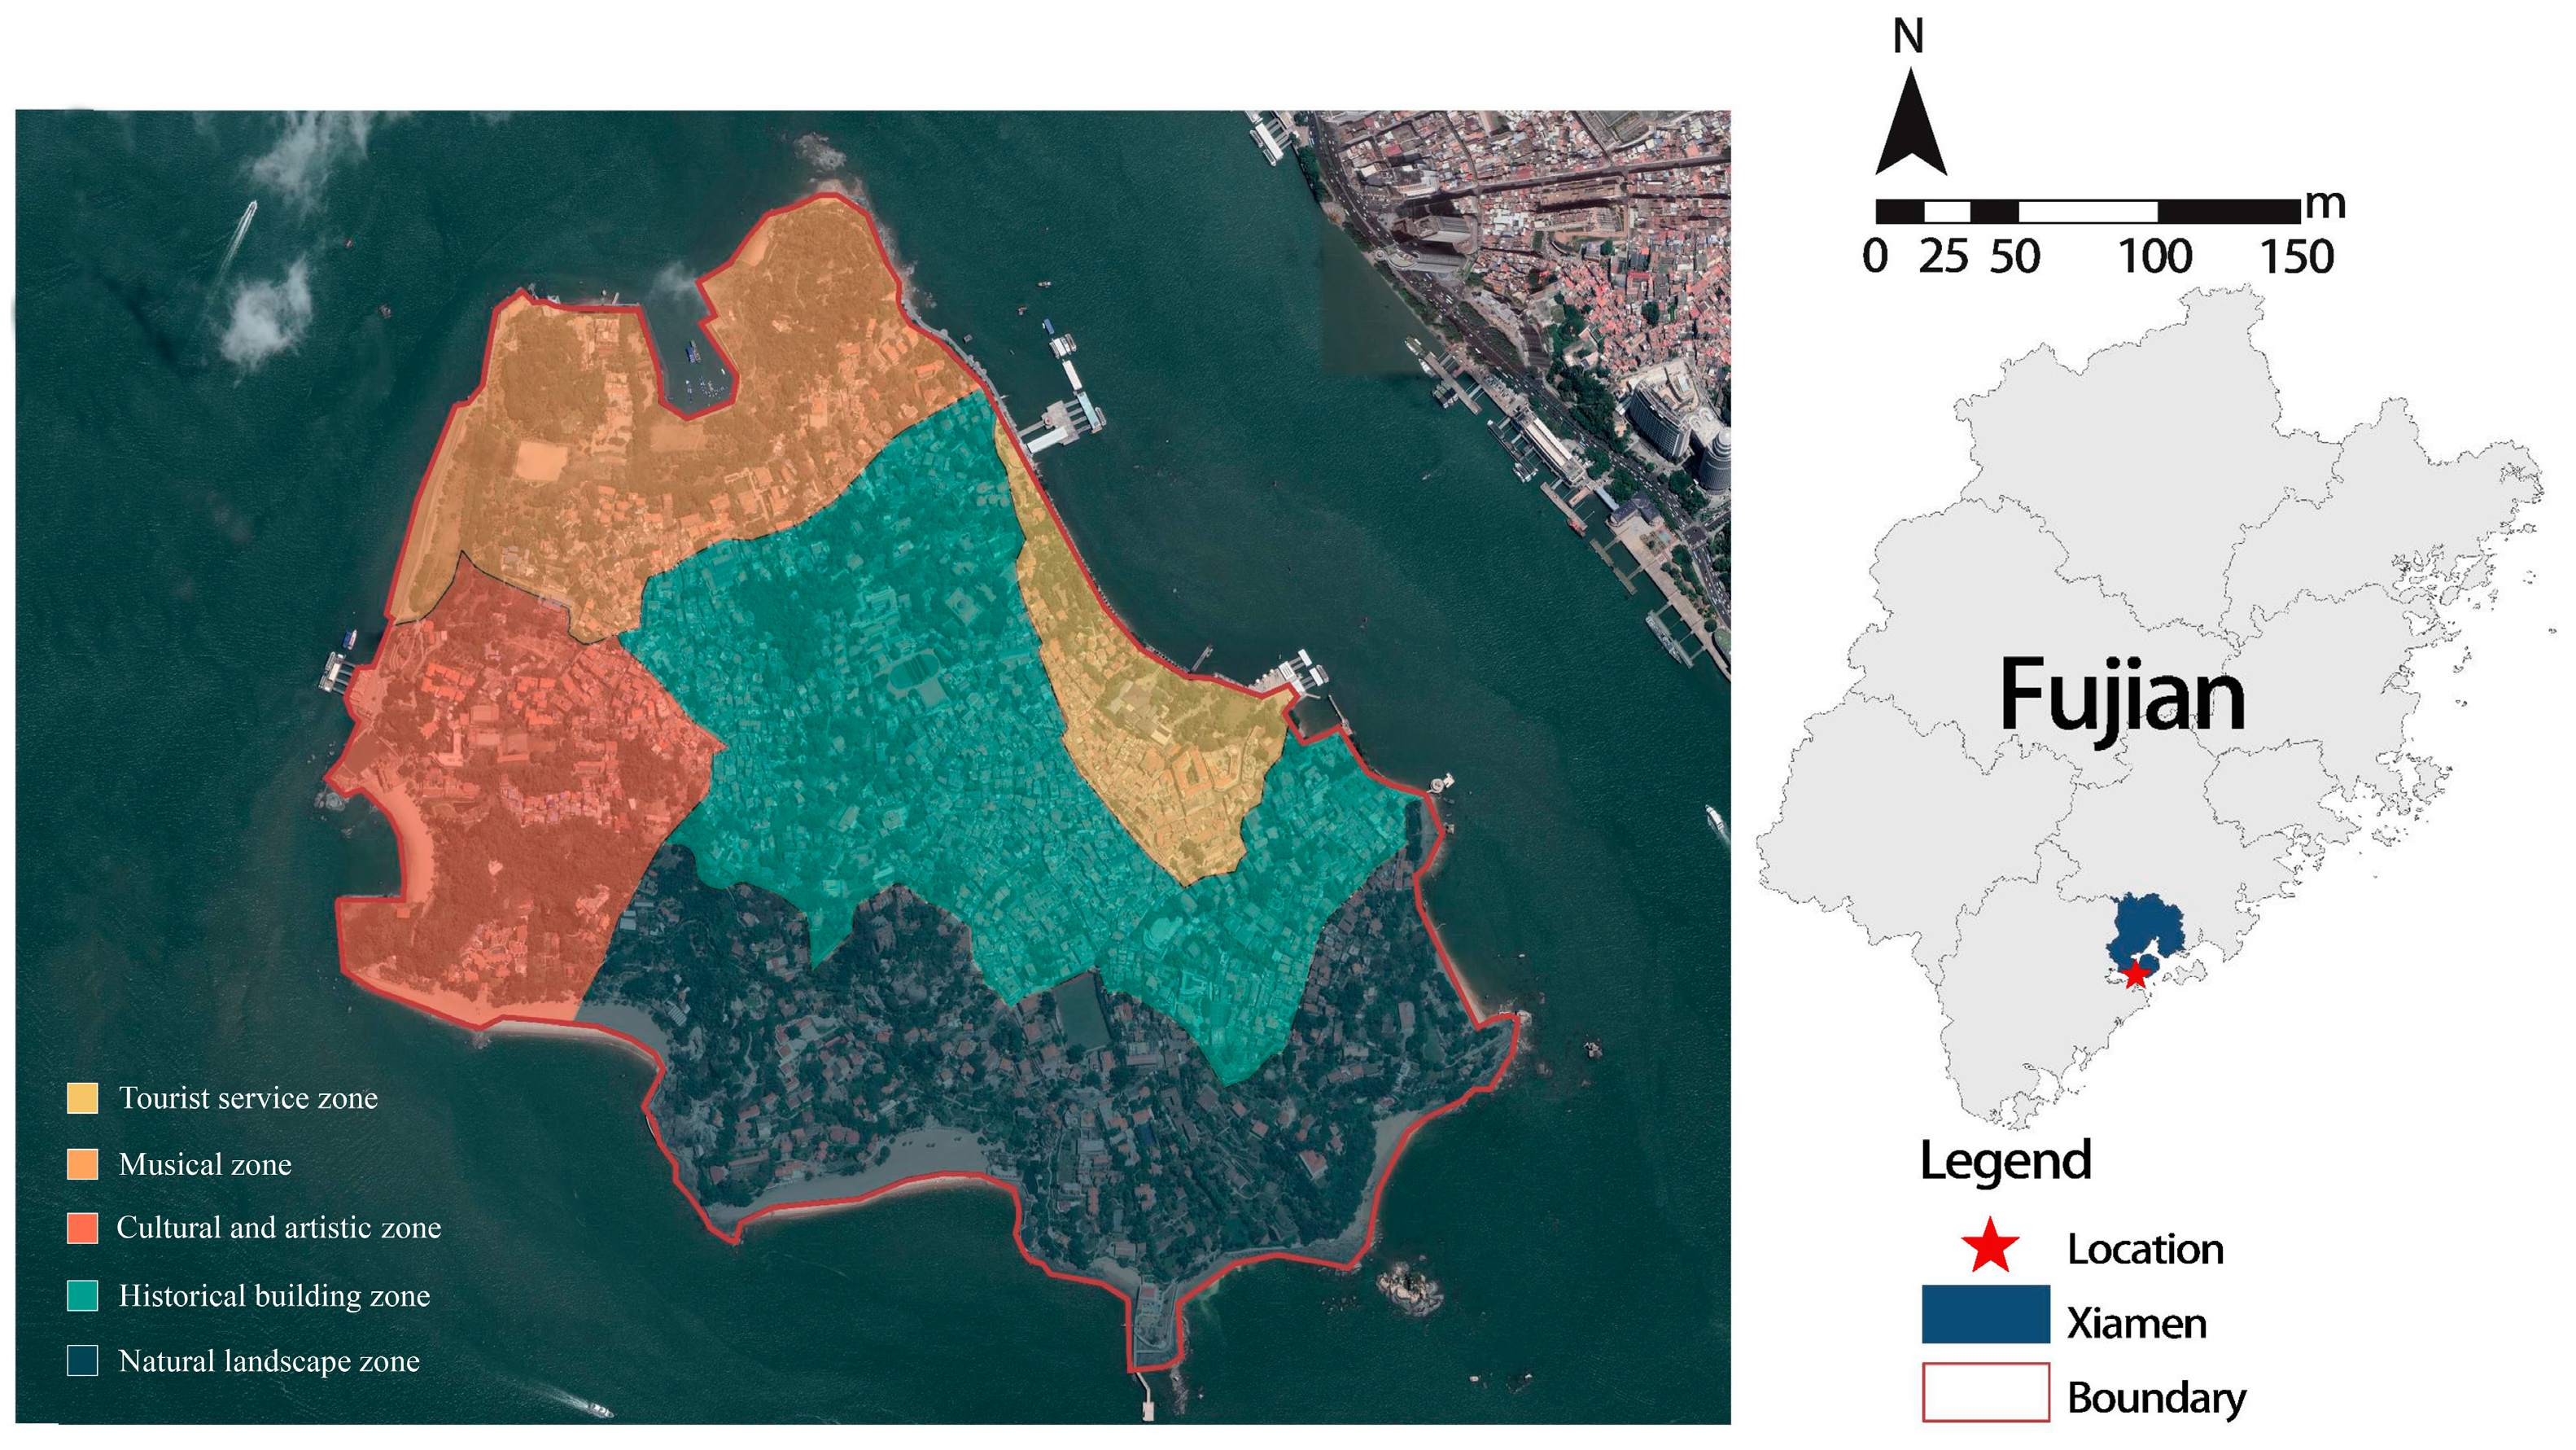
Kulangsu was listed as a World Heritage Site by UNESCO on 8 July 2017, in acknowledgement of its outstanding value to humanity. Prior to this, it was already a famous scenic spot in China, with rich natural and cultural landscape and soundscape resources, attracting a large number of visitors. In addition, after receiving the World Heritage designation, the number of visitors to Kulangsu increased by 12.19% in the same month of the time of its listing on the World Heritage List, according to the “Monthly report on the completion of main economic indicators in Kulangsu” (Issued by: KulangSu Administrative Committee). This will undoubtedly disturb or even threaten the status of soundscapes on the island. Consequently, an in-depth exploration of the current situation and the role of the soundscapes in Kulangsu will provide theoretical guidance for the management and conservation of soundscapes resources in World Heritage sites under the pressure of tourism.
Therefore, in the framework of the landsenses ecology theory and based on a public questionnaire survey in the Kulangsu scenic area, this study aims to investigate the extent to which the objective presence of sound sources corresponds to the subjective preference, and how this status could influence visitors’ visiting experience. By proposing the harmonious degree of sound sources (SHD) as a comprehensive indicator of the perceived occurrences, loudness, as well as preference for certain sound sources, we analyzed the impact of the SHD of different sound sources on the visiting experience from three aspects, including visual landscape, soundscape and comprehensive impression, in order to promote further understanding of this interactive process between landsense elements and human perception, and to achieve sustainable development of scenic areas.

2. Methods

2.1. Study Area

The study was conducted in Kulangsu Scenic Area in Xiamen city, China, a small island with an area of 1.88 km2, a subtropical monsoon climate, as well as excellent light and heat conditions and an average temperature of 21.2 °C throughout the year (Figure 1). Due to the adequate weather conditions, there is rich flora, including over 40% of vegetation coverage, and more than 1000 species of trees, shrubs, vines, and ground cover plants. Kulangsu has been one of the most popular tourist resorts in China, especially after it was listed in the World Heritage List in the name of “Kulangsu: International Historic Community” in 2017. There are many famous scenic spots in Kulangsu, such as Sunlight Rock, Shuzhuang Garden, Haoyue Garden, Yu Garden, Kulangsu Stone, etc. In addition, Kulangsu has a unique historical and international culture. Based on the master tourism planning of the Kulangsu scenic area (2014), the island is divided into five functional zones, including the tourist service zone, musical zone, cultural and artistic zone, historical building zone, and natural landscape zone (Figure 1). This study was conducted in July 2019, two years after it was recognized as a world heritage site, as part of a series studied here [1]. Thus, it facilitates us to reveal what the soundscape status of the sonic area is after this change. Combining several field surveys and public investigation results, we identified the typical soundscape elements of Kulangsu as 12 sound sources in 3 sound categories (see Table 1).

2.2. Questionnaire Design

Questionnaires are an effective method supported by technical standards and previous research [28,29,30]. Data of this study were collected through a three-part questionnaire targeted to the visitors in Kulangsu.
The first part of the questionnaire was related to the basic personal information of the interviewee [22], including gender (male, female), age (≤24, 25–30, 31–40, 41–50, 51–59, ≥60), educational background (primary, secondary, high school, university, postgraduate), occupation (student, enterprise and public institution, self-employed, retiree, other), residential status (Kulangsu resident, Xiamen resident, tourist, local merchant, foreign merchant, student), visit frequency (first time, second–third time, once a day, once a month, once a week, other), and length of residence (less than a week, less than a month, less than a year, less than five years, permanent residents).
The second part of the questionnaire was to evaluate each of the 12 sound sources according to their own perceptions [22,24], in terms of perceived occurrences (POS) (1—never, 2—occasionally, 3—normal, 4—often, 5—frequently), perceived loudness (PLS) (1—very weak, 2—weak, 3—normal, 4—strong, 5—very strong), and preference (PFS) (1—very dislike, 2—rather dislike, 3—normal, 4—rather like, 5— like very much).
The third part of the questionnaire was the evaluation of visiting experience from three aspects, including visual landscape, soundscape, and comprehensive impression [2,23]. Specifically, the satisfaction degree of the visual landscape (SVL) was evaluated in terms of natural scenery, architectural style, landscape design, sculpture (with other sketches), and pavement with a Likert 5-scale (1—very dissatisfied, 2—dissatisfied, 3—fair, 4—satisfied, 5—very satisfied) [2]. Six representative adjectives of soundscape perception (SSP) from previous studies were selected, including “harmonious”, “pleasant”, “vivid”, “eventful”, “comfortable”, and “varied”, and evaluated with a Likert 5-scale (1—strongly disagree, 2—disagree, 3—fair, 4—agree, 5—strongly agree) [23,31]. In addition, the comprehensive impression evaluation (CIE), as a comprehensive visiting experience evaluation and an overall impression of the scenic area to the visitors, was evaluated in terms of fascinating, interesting, harmonious, distinctive, and culturally profound with a Likert 5-scale (1—strongly disagree, 2—disagree, 3—fair, 4—agree, 5—strongly agree) [23].
The investigation was conducted on sunny days during July 2019, and 217 questionnaires were collected, including 195 valid questionnaires with an efficiency of 89.86%, with 35 to 43 in each functional zones. According to the requirements of partial lease squares structural equation modeling (PLS-SEM) as suggested by Hair, the sample size should be at least ten times the largest number of structural paths directed at a particular latent construct in the structural model [32]. In this study, the largest number of structural paths directed at a particular latent construct was 5, that is, the sample size was required to be more than 50. Therefore, the number of valid questionnaires collected in this study was able to meet the needs of the subsequent analysis.
The statistical results of the participants’ personal information are shown in Table 2. In addition, the reliability and validity of the questionnaire were analyzed. After the reliability test, the Cronbach’s alpha was 0.796 (>0.7), indicating a high reliability of the questionnaire. Validity analysis was carried out by KMO (Kaiser–Meyer–Olkin) and Bartlett’s sphericity test, in which KMO = 0.813 (>0.6) and the significance value of Bartlett’s sphericity test was 0.000 (<0.05), indicating a good validity of the questionnaire.

2.3. Data Analysis

2.3.1. Calculating the Harmonious Degree of Sound Sources

Soundscape perception is the result of the probability of cognitive stimulation and the perception of sound sources [33]. The usually used indicators from a single dimension, such as perceived occurrences and perceived loudness, as well as preference for certain sound sources, can provide useful soundscape information [24], but not in a comprehensive way reflecting the cognition process. Thus, we proposed a new harmonious degree indicator on the basis of the previous research [22], the harmonious degree of sound sources (SHD). It combines the three aforementioned sound source perception indicators, and indicates the degree to which the dominance of a sound source in the landscape matches the visitors’ preference for the sound, which can reflect the harmonious status of the sound in the soundscape.
First of all, we conducted a process of formula manipulation to reduce the potential errors of data caused by subjective factors. The sound dominant degree (SDD), referring to the perception degree of a sound source, could then be acquired by Equation (1):
S D D j i = P O S j i × P L S j i
where POS denotes perceived occurrences of individual sounds. PLS denotes the perceived loudness of individual sounds. Similarly, j represents the jth sample, and i represents the ith sound source.
In addition, we conducted the initial orientation of soundscape preference (S) as an indicator to distinguish the relative value of preference or dislike. The mean value of preference for individual sounds (PFS) was calculated from each sound source as a boundary value. If the preference for individual sounds of tourists is greater than the mean value of the preference for individual sounds, it means that tourists have a relative preference for the sound source; otherwise, it means they do not. The equation between S and PFS is as follows:
S j i = j = 1 n P F S j / n - P F S j i
where S denotes the initial orientation of soundscape preference. PFS denotes the preference for individual sounds. In addition, n represents the sample size. In this study, j = 1, …, n, where n = 195 valid questionnaires.
Then, considering the extreme value of subjective data influencing the PFS, the S should be transformed. We adopted the final orientation of soundscape preference (M) as an indicator based on exponential function. If M > 0, the M value would represent like, and otherwise dislike. The equation between M and S is as follows:
M = ( 1 / ( e S j i + 1 ) - 0.5 )
where M denotes the final orientation of soundscape preference, e represents an Euler, irrational and transcendental number.
Finally, the SHD combining M and SDD to express the orientation of sound dominant and preference degree, is built as follows:
S H D = M × S D D
Moreover, this equation is equivalent to the equation as follows:
S H D j i = ( 1 / ( e j = 1 n P F S j i / n - P F S j i + 1 ) - 0.5 ) × P O S j i P L S j i
These equations suggest that (1) SHD is determined by SDD and PFS; (2) due to using exponential function to relate the PFS and S, if a PFS value was higher than the mean value of PFS, high SDD would result in high SHD; (3) otherwise, if a PFS value was lower than the mean value of PFS, the SDD would reach a high value but the SHD would reach a low value. Ultimately, in combination with the study settings, the SHD value could range from −12.5 to 12.5.

2.3.2. Modeling the Relationships among the SHD and Visiting Experience Indicators

Spearman’s rho correlation analysis was carried out in SPSS 25.0 to detect the potential relationships between the SHD of different sounds and the visiting experience indicators. Furthermore, we conducted a structural equation model to explore (1) the effect of the SHD of different sound types on visiting experience, and (2) the significant variation of this effect in different functional zones. The procedure of the structural equation model was performed based on PLS-SEM (partial least squares SEM). The PLS-SEM has many advantages over CB-SEM (covariance-based SEM), including optimal consistency and target prediction [32]. The procedure of the structural equation model was carried out in Smart PLS 3.3.

3. Results

3.1. Characteristics of Sound Source Perception

The mean values of the four sound source perception indicators, i.e., POS, PLS, PFS, and SHD are shown in Figure 2. The trend of POS and PLS are similar among different sound sources, reflecting relative dominating positions of human sounds represented by surrounding speech and sales calling, and natural sounds represented by sea waves and birdsong. In addition, the POS and PLS of traffic sound and construction noise were the lowest among all sound sources, indicating that these two sound sources were controlled effectively. In terms of the PFS, all natural sounds were favored by tourists, with sea waves showing the highest PFS, followed by birdsong. By contrast, construction noise showed the lowest PFS, followed by traffic sound. The SHD of natural sounds showed higher values than that of other sound sources, and water sound was the highest. The lowest SHD appeared mainly with human sounds, especially sales calling and surrounding speech, which were less preferred.
Figure 3 shows the differences in the SHD of each sound source in different functional zones. It is obvious that the SHD values of the same type of sound source were different among different functional zones. Most of the natural sounds showed positive SHD values, with the highest one appearing with water sound in the musical zone, and limited negative values appearing in the natural landscape and historical building zones. More than half of the SHD values of human sounds were negative in different zones, with sales calling being the lowest one and playing children the highest, both appearing in the tourist service zone. In terms of mechanical sounds, they all showed relatively low SHD values, with a higher value of traffic sound in the cultural and artistic zone, and a lower value of broadcasting music in the historical building zone.

3.2. Relationships between the SHD and Visiting Experience Indicators

Spearman’s rho correlation analysis results between the SHD of each of the 12 sound sources and visiting experience indicators are shown in Table 3. The harmonious status of nearly all the sound sources showed significant and positive relationships with at least one visiting experience indicator, except for surrounding speech. In terms of soundscape perception (SSP), pleasant soundscapes were more related to the SHD of 4 natural sounds, tour guide sound, and broadcasting music (6 out of 12), followed by varied soundscapes showing close relationships with all three mechanical sounds and insects sounds (4 out of 12). The SHD of broadcasting music showed the most significant asscociation with soundscape perception indicators (4 out of 6).
There are notable correlations between the SHD and the satisfaction degree of the visual landscape (SVL). The findings showed that the SHD of all natural sounds was correlated with the SVL, especially water sound (fountain) (all the 5 indicators) and birdsong (4 out of 5). Pavement conditions showed relatively more relationships with the SHD (5 out of 12), followed by natural scenery and architectural style (both 4).
In terms of the relationships between the SHD and comprehensive impression evaluation (CIE), the SHD of sea waves, water sound (fountain), and broadcasting music all showed significant relationships with 3 of the 5 indicators. The fascinating characteristic of the place was most related to the SHD (5 out of 12), followed by harmonious and distinctive (both 4).
In summary, it is clear that the SHD of nearly all the major sound sources in Kulangsu showed significant relationships with the visiting experience indicators. It is necessary to reveal how these indicators could interact with each other and contribute to the comprehensive visiting experience. Thus, in the next section, their relationships were further revealed by structural equation modeling.

3.3. Modeling the Effect of the SHD on Visiting Experience

3.3.1. Measurement Model

The reliability and validity of the measurement models were assessed using individual item reliability, construct reliability, convergent validity, and discriminant validity, respectively. The results showed that the standardized factor loads of playing children (0.188) and sales calling (0.418) were less than 0.5 and failed to pass the significance test, which suggested that these two indicators should be removed. Then, we conducted a re-testing after removing these variables. As shown in Table 4, the standardized factor loads for all observed variables were significantly greater than 0.5 and all passed the significance test, indicating that these variables were acceptable. Meanwhile, the CR (construct reliability) of each latent variable ranged from 0.795 to 0.894, which was greater than 0.7, indicating that the latent variables had good construct reliability [34].
The validity tests for the latent variables were further examined to include mainly convergent validity and discriminant validity. As shown in Table 4, the AVE (average variance extracted) values for all latent variables were between 0.585 to 0.705, which was greater than the threshold of 0.5 [35], indicating that the convergent validity of the latent variables was acceptable. While the discriminant validity was mainly tested by the Fornell–Larcker criterion and the Heterotrait–Monotrait ratio of correlations (HTMT) criterion [36]. The results showed that all latent variables could meet the Fornell–Larker criterion as the square root of AVE of each latent variable was higher than its correlation with other latent variables. Meanwhile, the HTMTs between the pairwise latent variables were all less than 0.9, indicating that there was good discriminant validity between each latent variable (See Table 5).

3.3.2. Conceptual Structural Equation Model

Based on the results of exploratory and confirmatory factor analysis and previous research [23,28], 5 main hypotheses and 12 sub-hypotheses were proposed as follows:
Ha: 
SHD-NS has a significant effect on each of visiting experience indicators, with specific hypotheses including: Ha1: SHD-NS has a positive effect on SSP; Ha2: SHD-NS has a positive effect on SVL; Ha3: SHD-NS has a positive effect on CIE;
Hb: 
SHD-HS has a significant effect on each of the visiting experience indicators, with specific hypotheses including: Hb1: SHD-HS has a positive effect on SSP; Hb2: SHD-HS has a positive effect on SVL; Hb3: SHD-HS has a positive effect on CIE;
Hc: 
SHD-MS has a significant effect on each of visiting experience indicators, with specific hypotheses including: Hc1: SHD-MS has a positive effect on SSP; Hc2: SHD-MS has a positive effect on SVL; Hc3: SHD-MS has a positive effect on CIE;
Hd: 
SSP has a significant effect on SVL and CIE, with specific hypotheses including: Hd1: SSP has a positive effect on SVL; Hd2: SSP has a positive effect on CIE;
He: 
SVL has a significant effect on CIE, with specific hypotheses includingHe1: SVL has a positive effect on CIE.
A concept model of the SHD influencing visiting experience was proposed based on the hypotheses (Figure 4).

3.3.3. Evaluation of Structural Equation Model

We tested the validity of the structural equation model using bootstrap with 5000 replicate samples in SmartPLS 3.3 software [37], and the modified model is shown in Figure 5. As shown in Table 6 and Table 7, the pathways passed the significance test, including Ha1, Ha2, Hb1, Hc1, Hd1, Hd2, and He1. All significant paths had a value of f² (effect size) greater than 0.02, which suggested that the measure of each path was statistically significant [38]. The effectiveness of the model was also verified through three indices, i.e., coefficient of determination, predict relevance, and goodness of fit [39], as shown in Table 7. The results indicated that the SHD of natural sounds (β = 0.195, p < 0.01), human sounds (β = 0.147, p < 0.05), and mechanical sounds (β = 0.234, p < 0.01) all showed significant positive effects on SSP. In addition, among the sound sources, only the SHD of natural sounds could directly affect the SVL (β = 0.127, p < 0.05). Among the three types of visiting experience indicators, both the SSP and SVL could positively affect the CIE, and the SSP could also contribute to the SVL.

3.3.4. Comparison among Different Multi-Group Models

Based on the results of the previous part, we conducted a multi-group analysis across the functional zones’ modeling (see Table 8). In terms of the SHD affecting visiting experience, the results suggested that only limited but different significant paths existed in different functional zones. Specifically, in the tourist service zone, the SHD showed the most significant effects on visiting experience, with natural sounds and human sounds showing opposite effects on the CIE, but the latter also showing positive effects on the SVL. In the cultural and artistic zone, only the SHD of natural and human sounds showed positive effects on SSP. The SHD of mechanical sounds affecting the SSP was the only significant path in the historical building zone, while the SHD of natural sounds affecting the CIE was also the only one in the natural landscape zone, and there was no significant path in the musical zone. In terms of the relationships among the three types of visiting experience indicators, audio-visual effects were more significant in the cultural and artistic zone and musical zone. The effects of the SSP on the CIE were significant in three different zones, including the musical zone, historical building zone, and natural landscape zone. In addition, the effects of the SVL on the CIE were only significant in the cultural and artistic zone and natural landscape zone.
Furthermore, we analyzed the differences in effectiveness of the same path between different functional zones. The results in Table 9 showed that the most differences were reflected in the effects of the SHD-NS on the CIE, followed by the audio-visual effects.

4. Discussion

4.1. Perception Characteristics of Typical Sound Sources

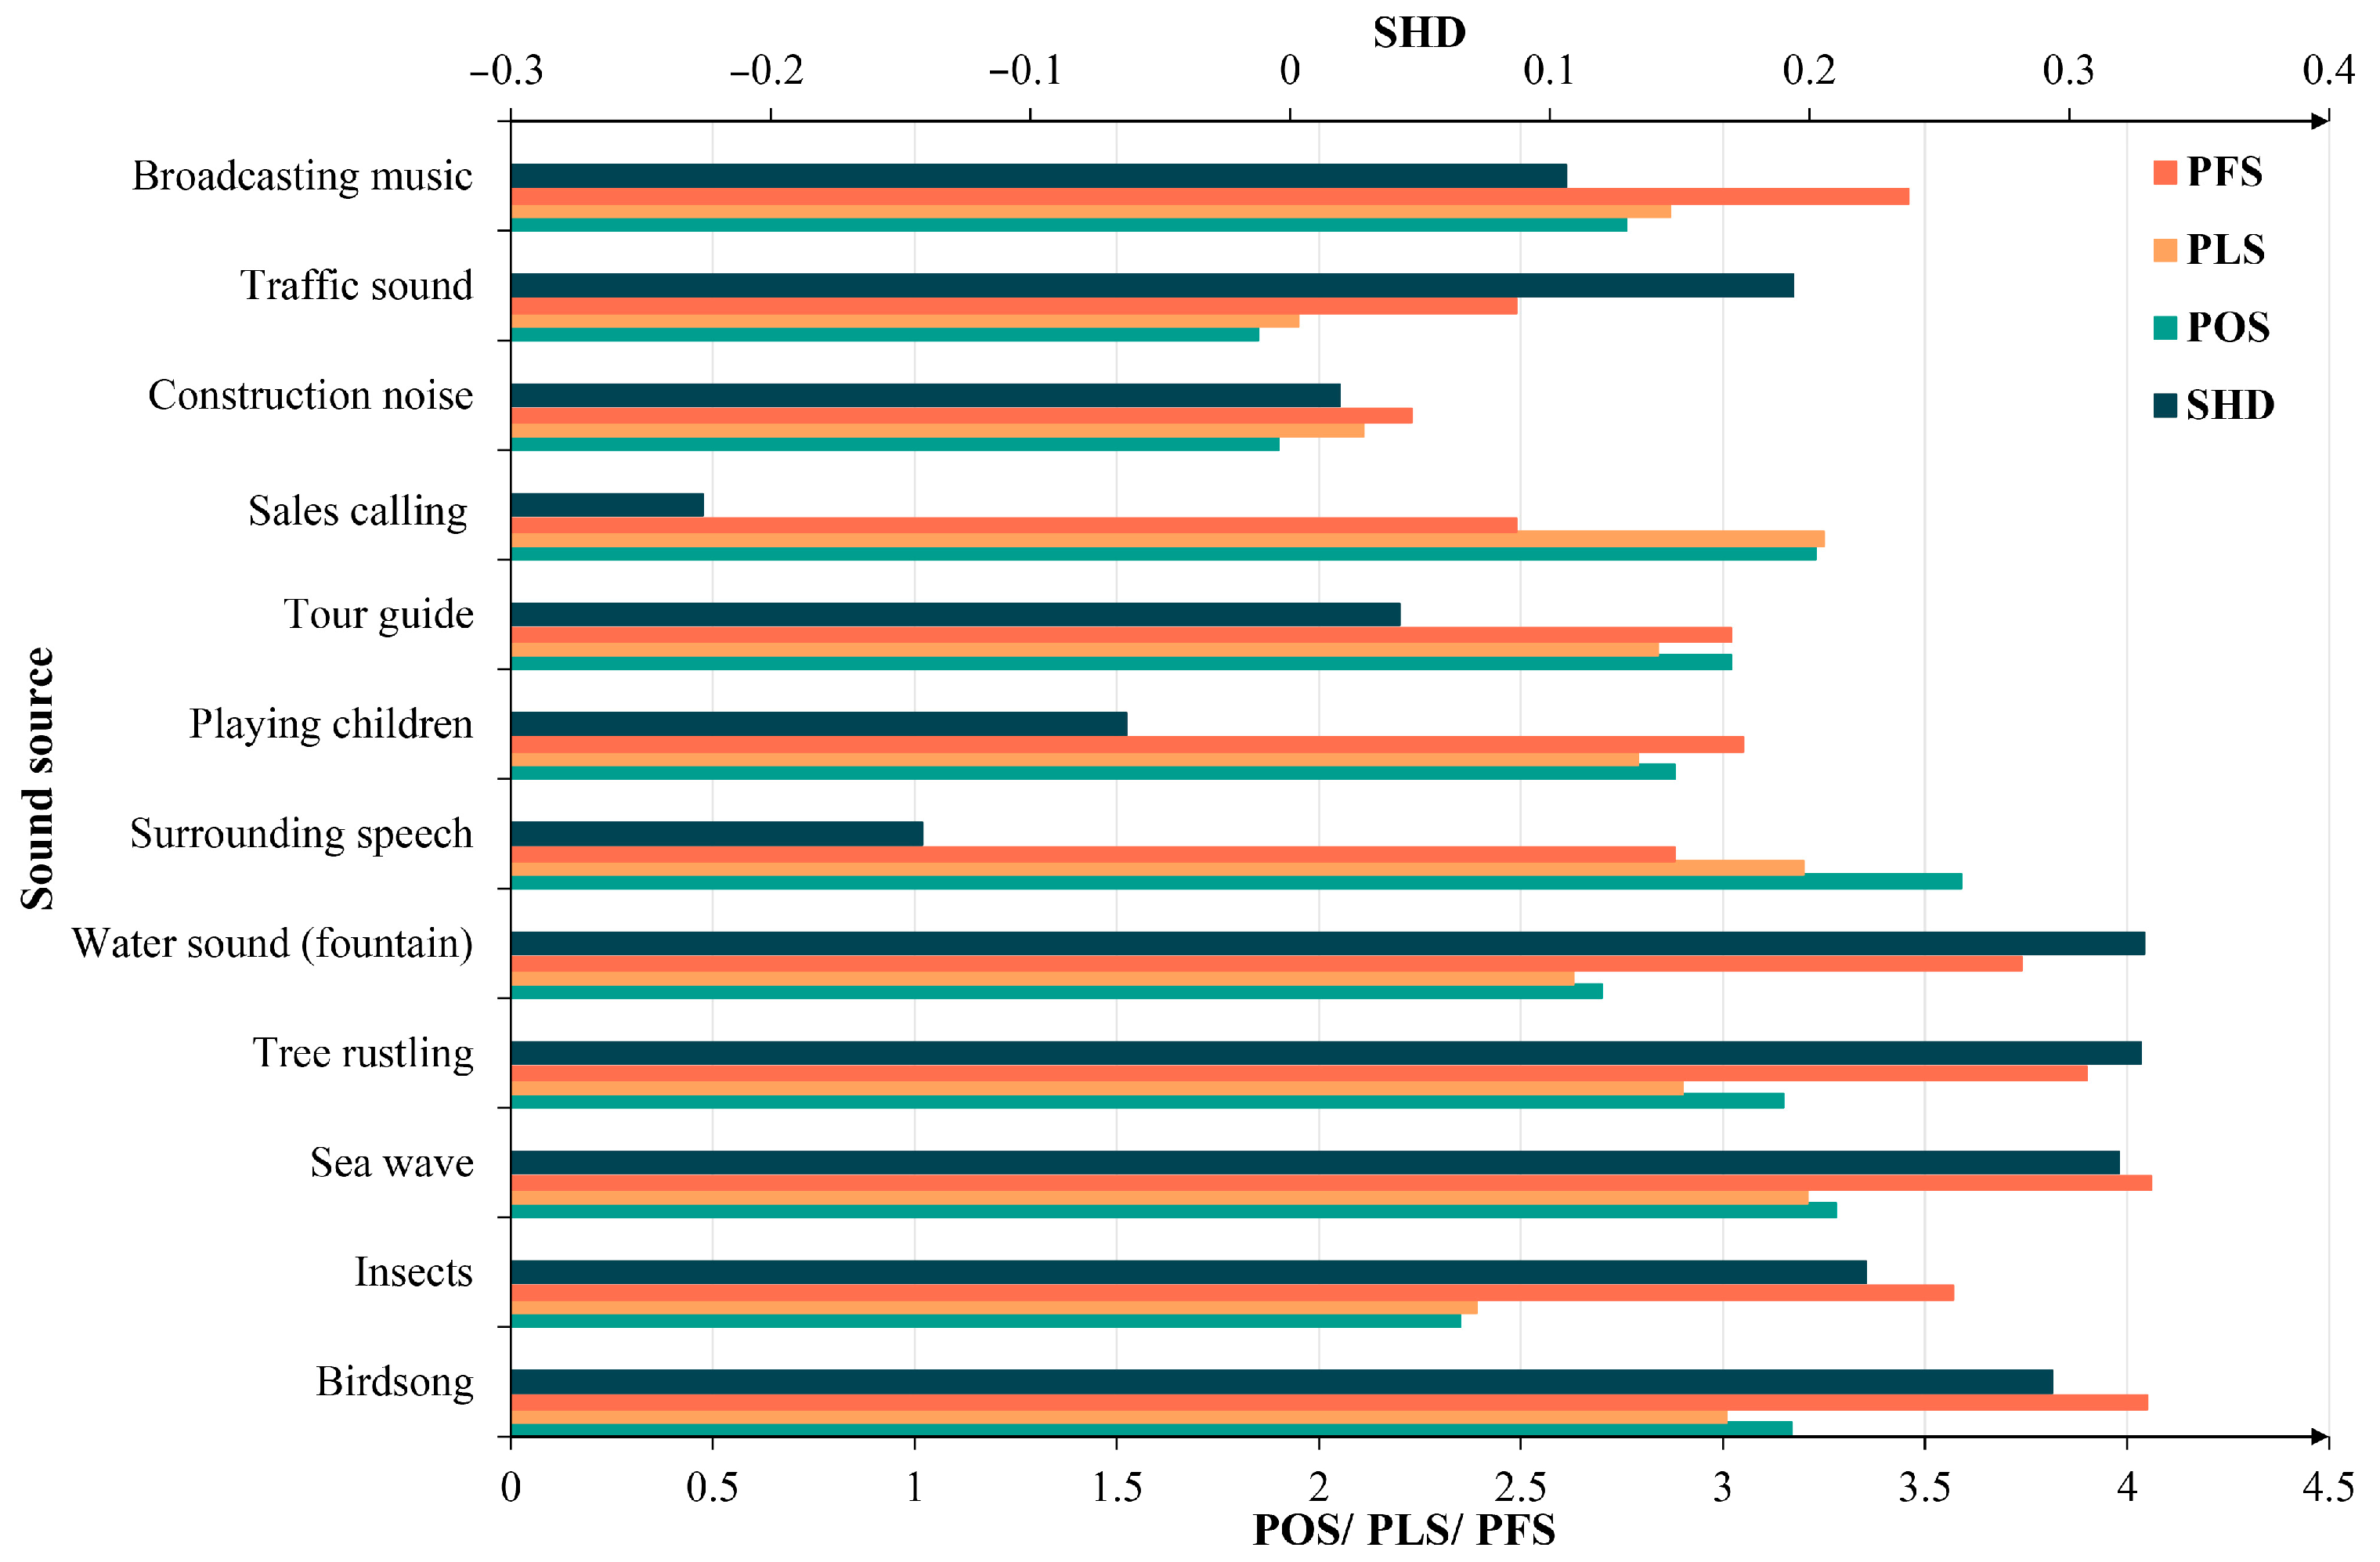
The context, including location, landscape function and environmental characteristics of a landscape, contributes to a potential impact on the composition of sound sources in soundscapes (see Figure 3). In this case, certain human sounds (like surrounding speech) and natural sounds (like sea wave) occupied dominant positions than other sound sources, which was fitting with the environmental characteristics and functions of the Kulangsu scenic area. Mechanical sounds including construction sound and traffic sound showed a relatively weak dominating degree, which suggested effective noise control in Kulangsu. The preference values of all natural sounds were more than other sound sources [40,41], which suggested that tourists had a significantly higher preference for natural sounds that showed positive effects on visiting experience [41,42,43]. Furthermore, we found that broadcasting music also had a relatively high preference, which may be related to the personal information of the participants, such as cultural background, age, etc. [44].
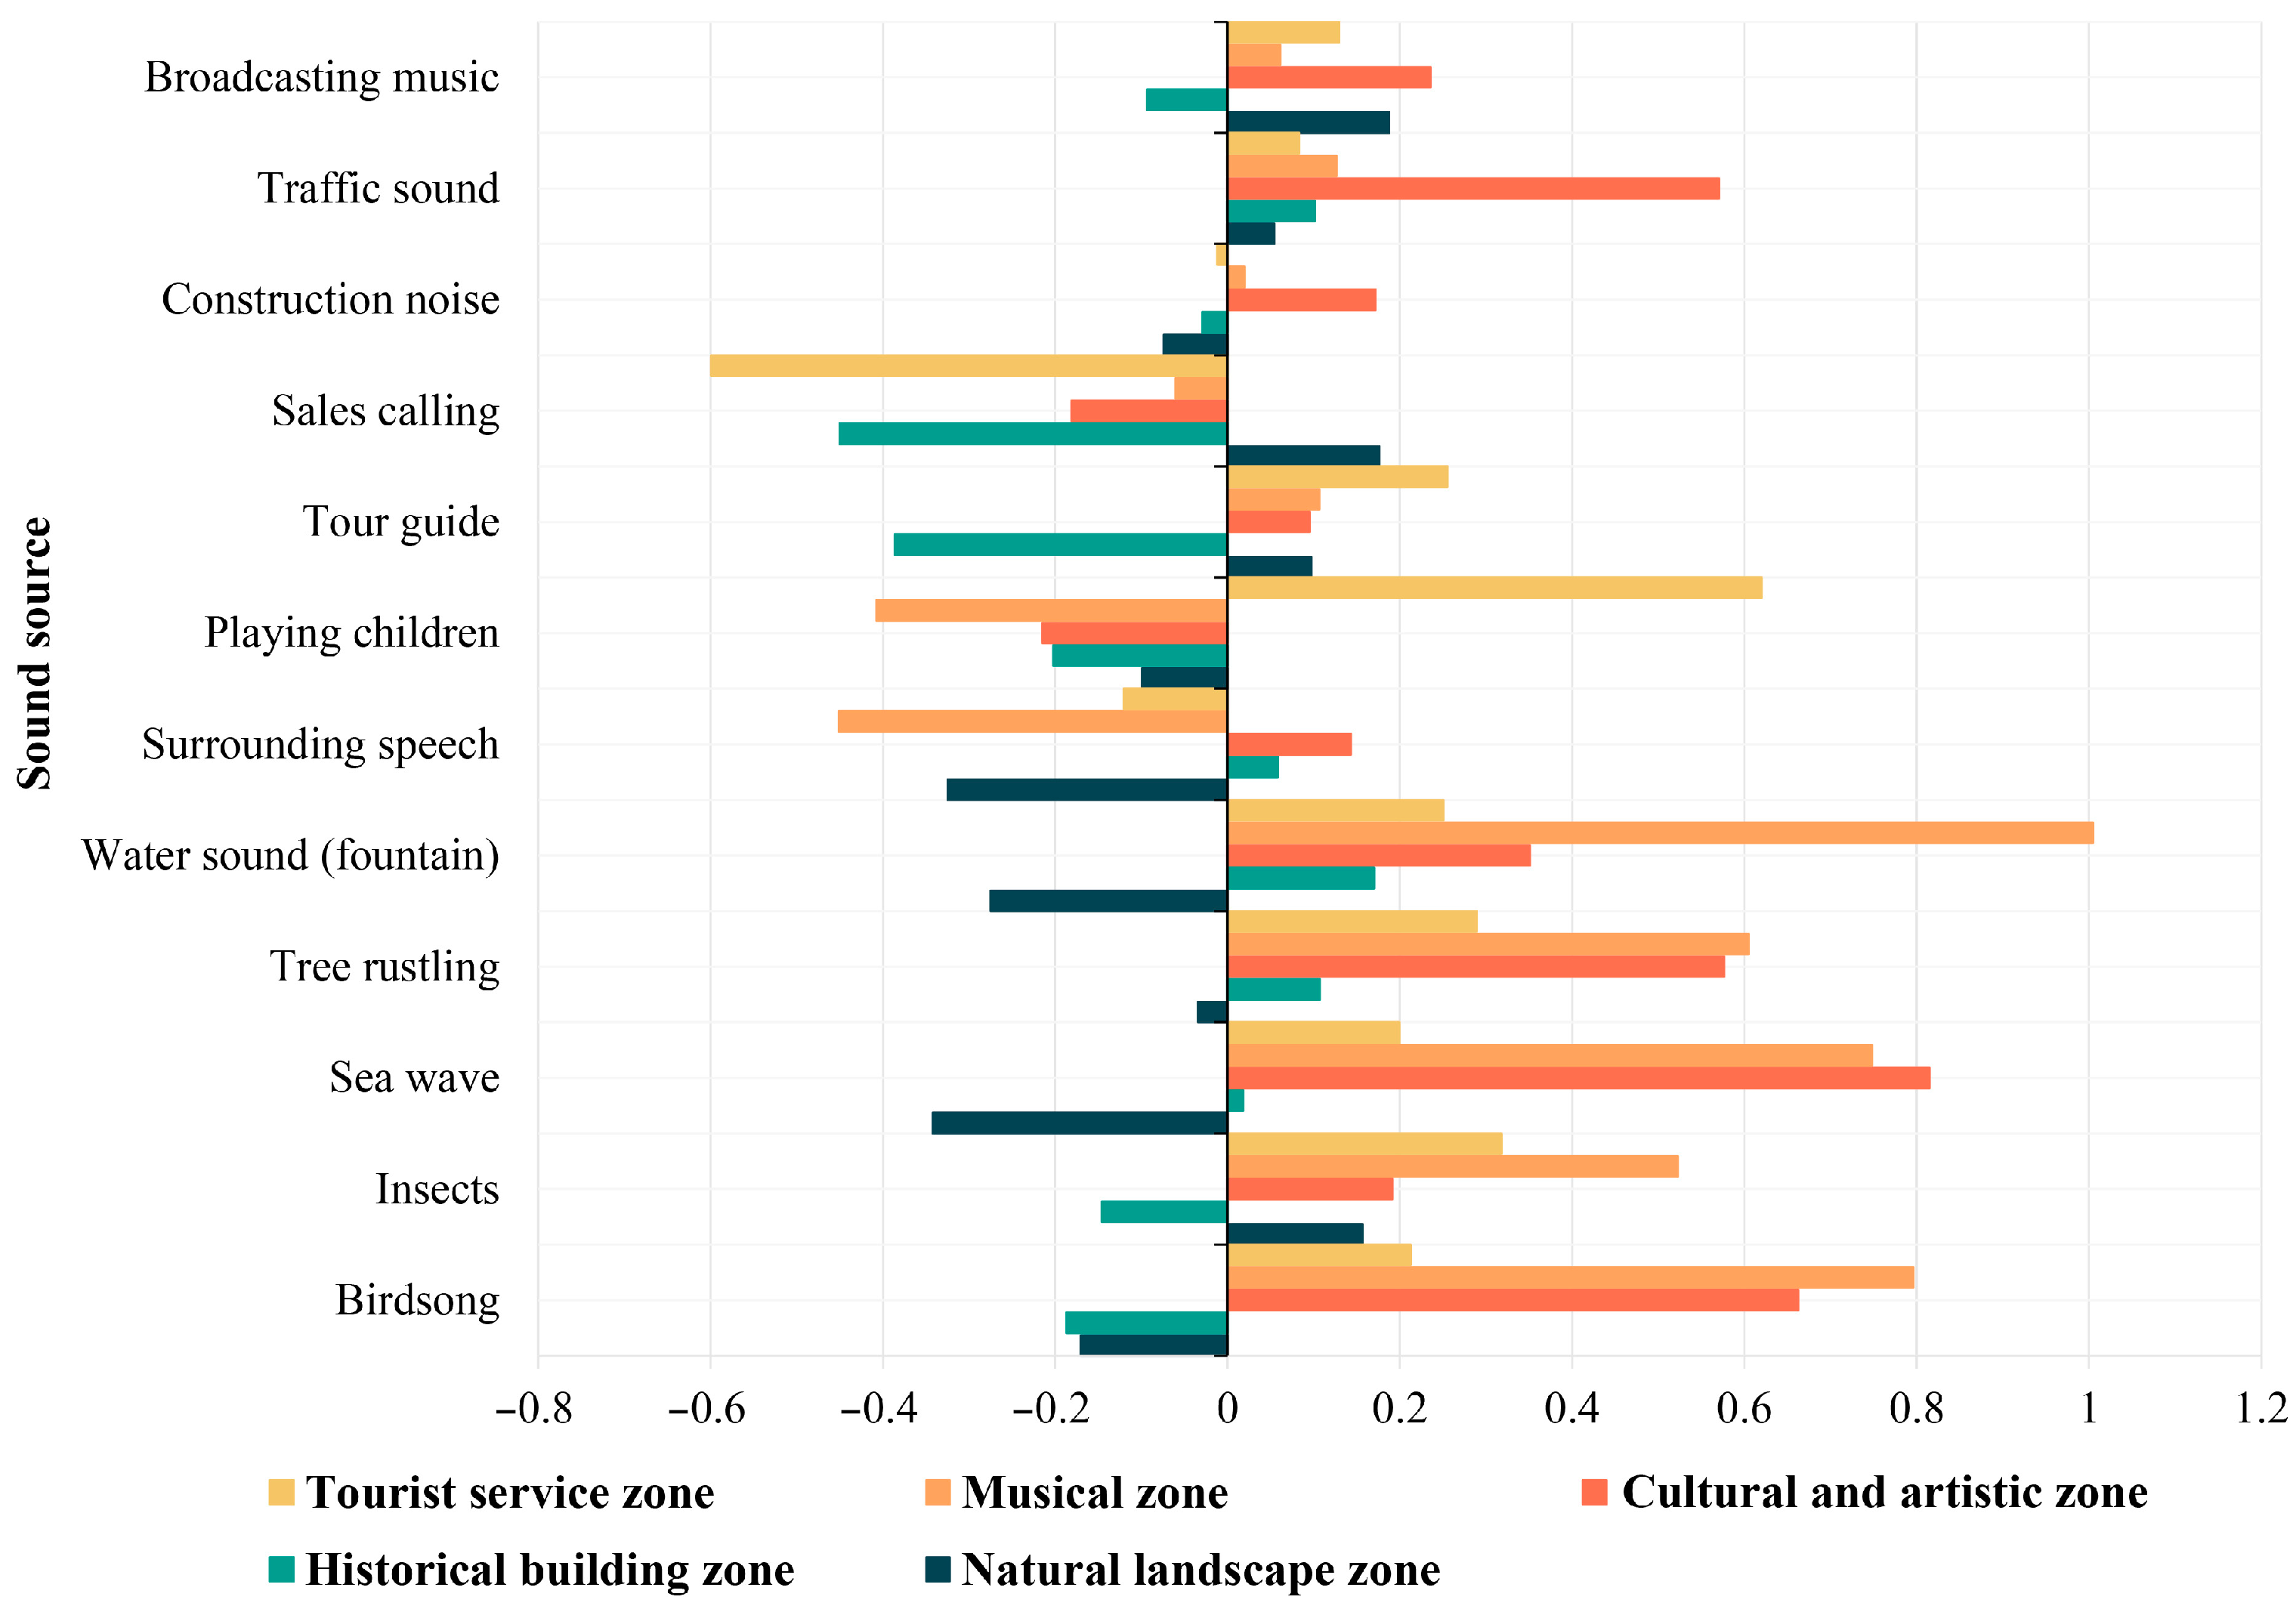
In terms of the SHD, as a comprehensive sound source perception indicator, it can reflect the status of how could the dominating degree of certain sounds matches the visitors’ preference for it. In this case, the dominating positions of natural sounds in Kulangsu matched the preference of the visitors, thus resulting their high SHDs. However, as a popular tourist resort that attracts a large number of tourists and resulted many human sound sources that are not always preferred simultaneously, the SHD of human sounds were the lowest ones. Especially, surrounding speech reflecting the crowd density, and sales calling reflecting extensive commercial promotion, could impair soundscape quality. Thus, in a scenic area (and a world heritage), it is necessary to control the daily amount of tourists and the volume of especially electronic equipment of the merchants for commercial promotion. In addition, it is noted in this study, the SHDs of each sound source in different functional zones were different. This is reasonable, as in different functional zones, the “context” for sound/soundscape perception is changing, and people could also have different expectations when they visit the different thematic zone.

4.2. The SHD Influencing Soundscape Perception

Visiting experience is influenced by various factors during the comprehensive experience in a scenic area, but from a perception perspective, visual and auditory perception characteristics are the most influential ones [22,23]. As sound perception is an essential process of soundscape perception, the SHD of all sound sources showed significant relationships with at least one soundscape perception indicator, except for surrounding speech. The contribution of natural sounds to positive soundscape perception was more obvious, especially to pleasant soundscapes. In Kulangsu, natural sounds including water sound (fountain), tree rustling, sea waves and birdsong were with the highest SHD values, and all significantly related to pleasant soundscape experience, which is similar to previous studies [45,46,47]. A number of studies have shown that natural sounds have more positive effects on people’s physical and mental health, including physiological indicators and psychological feelings, than other sounds [48,49,50,51,52]. Thus, the preservation of the natural and ecological environment through thoughtful landscape planning and management is necessary for scenic areas, such as protecting the habitats of birds and insects, increasing berry fruit trees to attract birds, and building leisure trails near the coastal line [53].
Usually, artificial sounds are dominating sound sources in urbanized areas. The results suggest that all human sound sources except surrounding speech were related to soundscape perception indicators. Thus, it is necessary to control the amount of tourists to weaken the dominance of human sounds for a better soundscape experience. As the most preferred artificial sound sources, the SHD of broadcasting music showed the most significant relationships with soundscape perception indicator, especially pleasant and eventful. The results suggest that a potential match between the natural and cultural sound sources could contribute to higher soundscape quality, considering the rich musical resources in Kulangsu as a “Piano island”. In addition, the SHD of mechanical sounds like construction noise and traffic sound were closely related to varied soundscape perception. This result confirms previous research that the dominance of mechanical sound such as traffic sound in the environment had a significant negative correlation with positive soundscape perception [28,54]. As the objective presence of such sounds in the environment increases in line with people’s subjective preference, the people’ positive soundscape perception can also increase. Therefore, there is a considerable need to control these sounds in the landscape, either by restricting relatively activities or by using vegetation or installing noise barriers to directly eliminate the presence of these sounds [55,56].
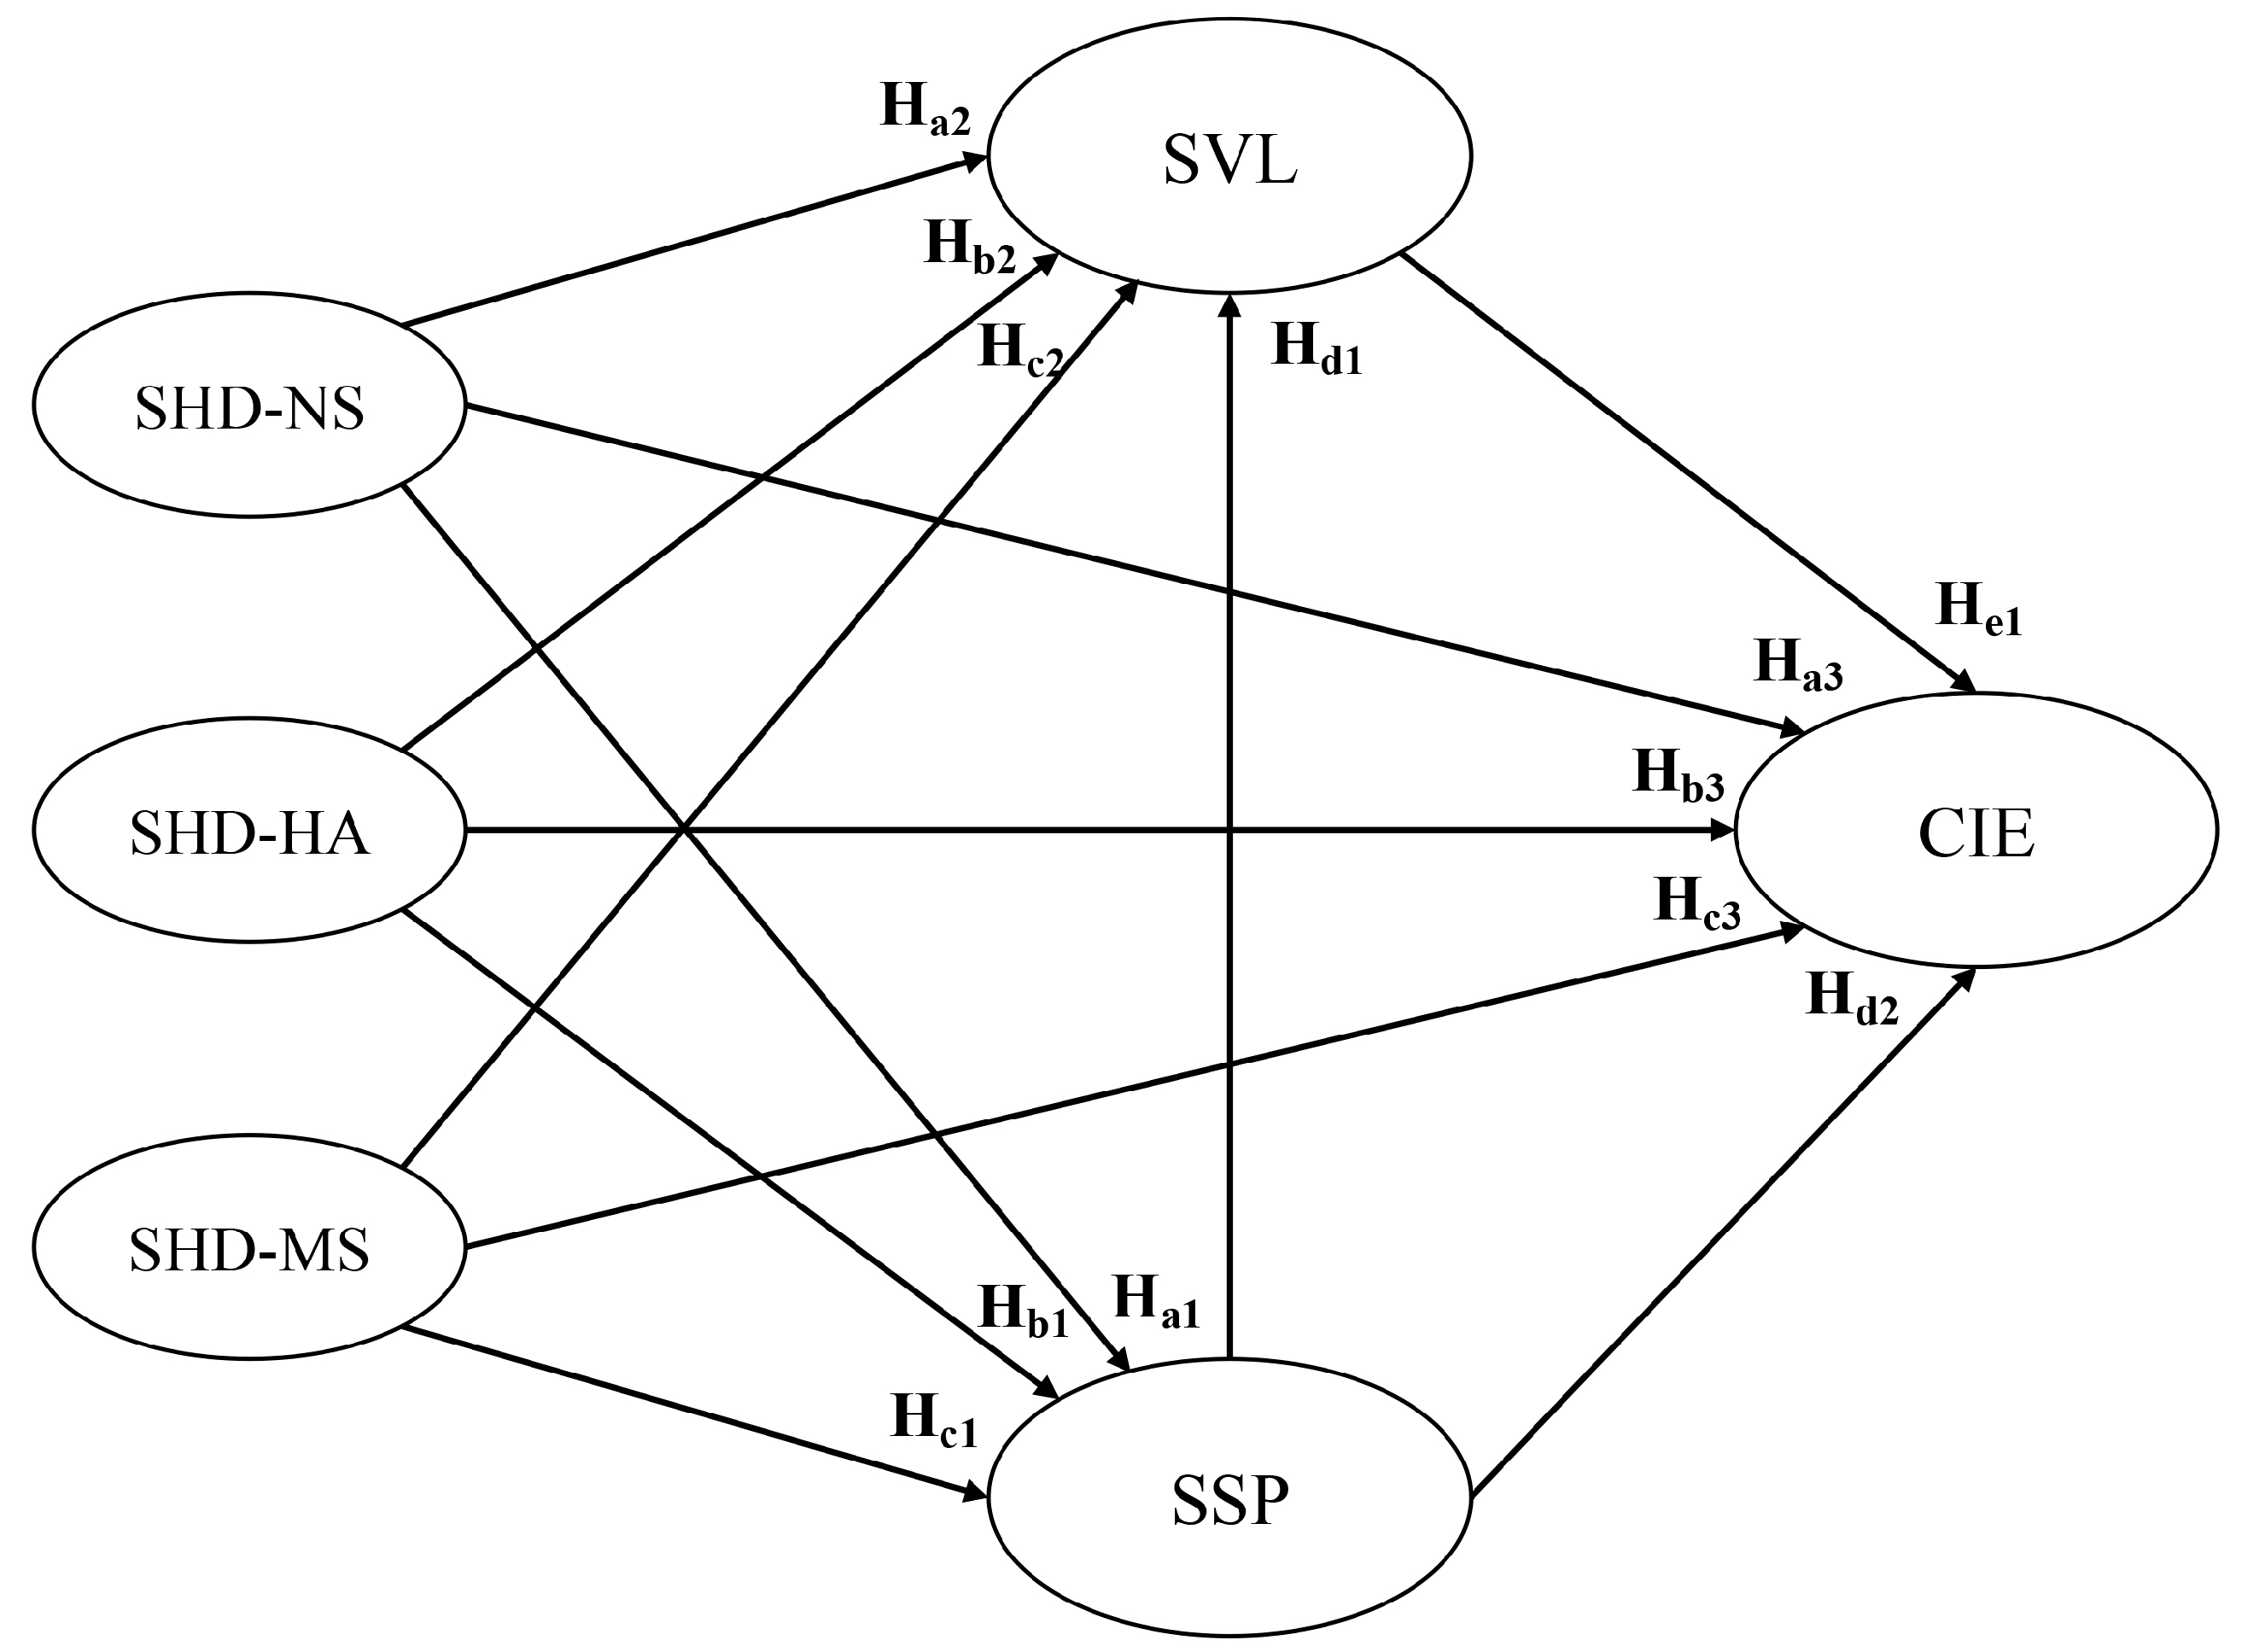
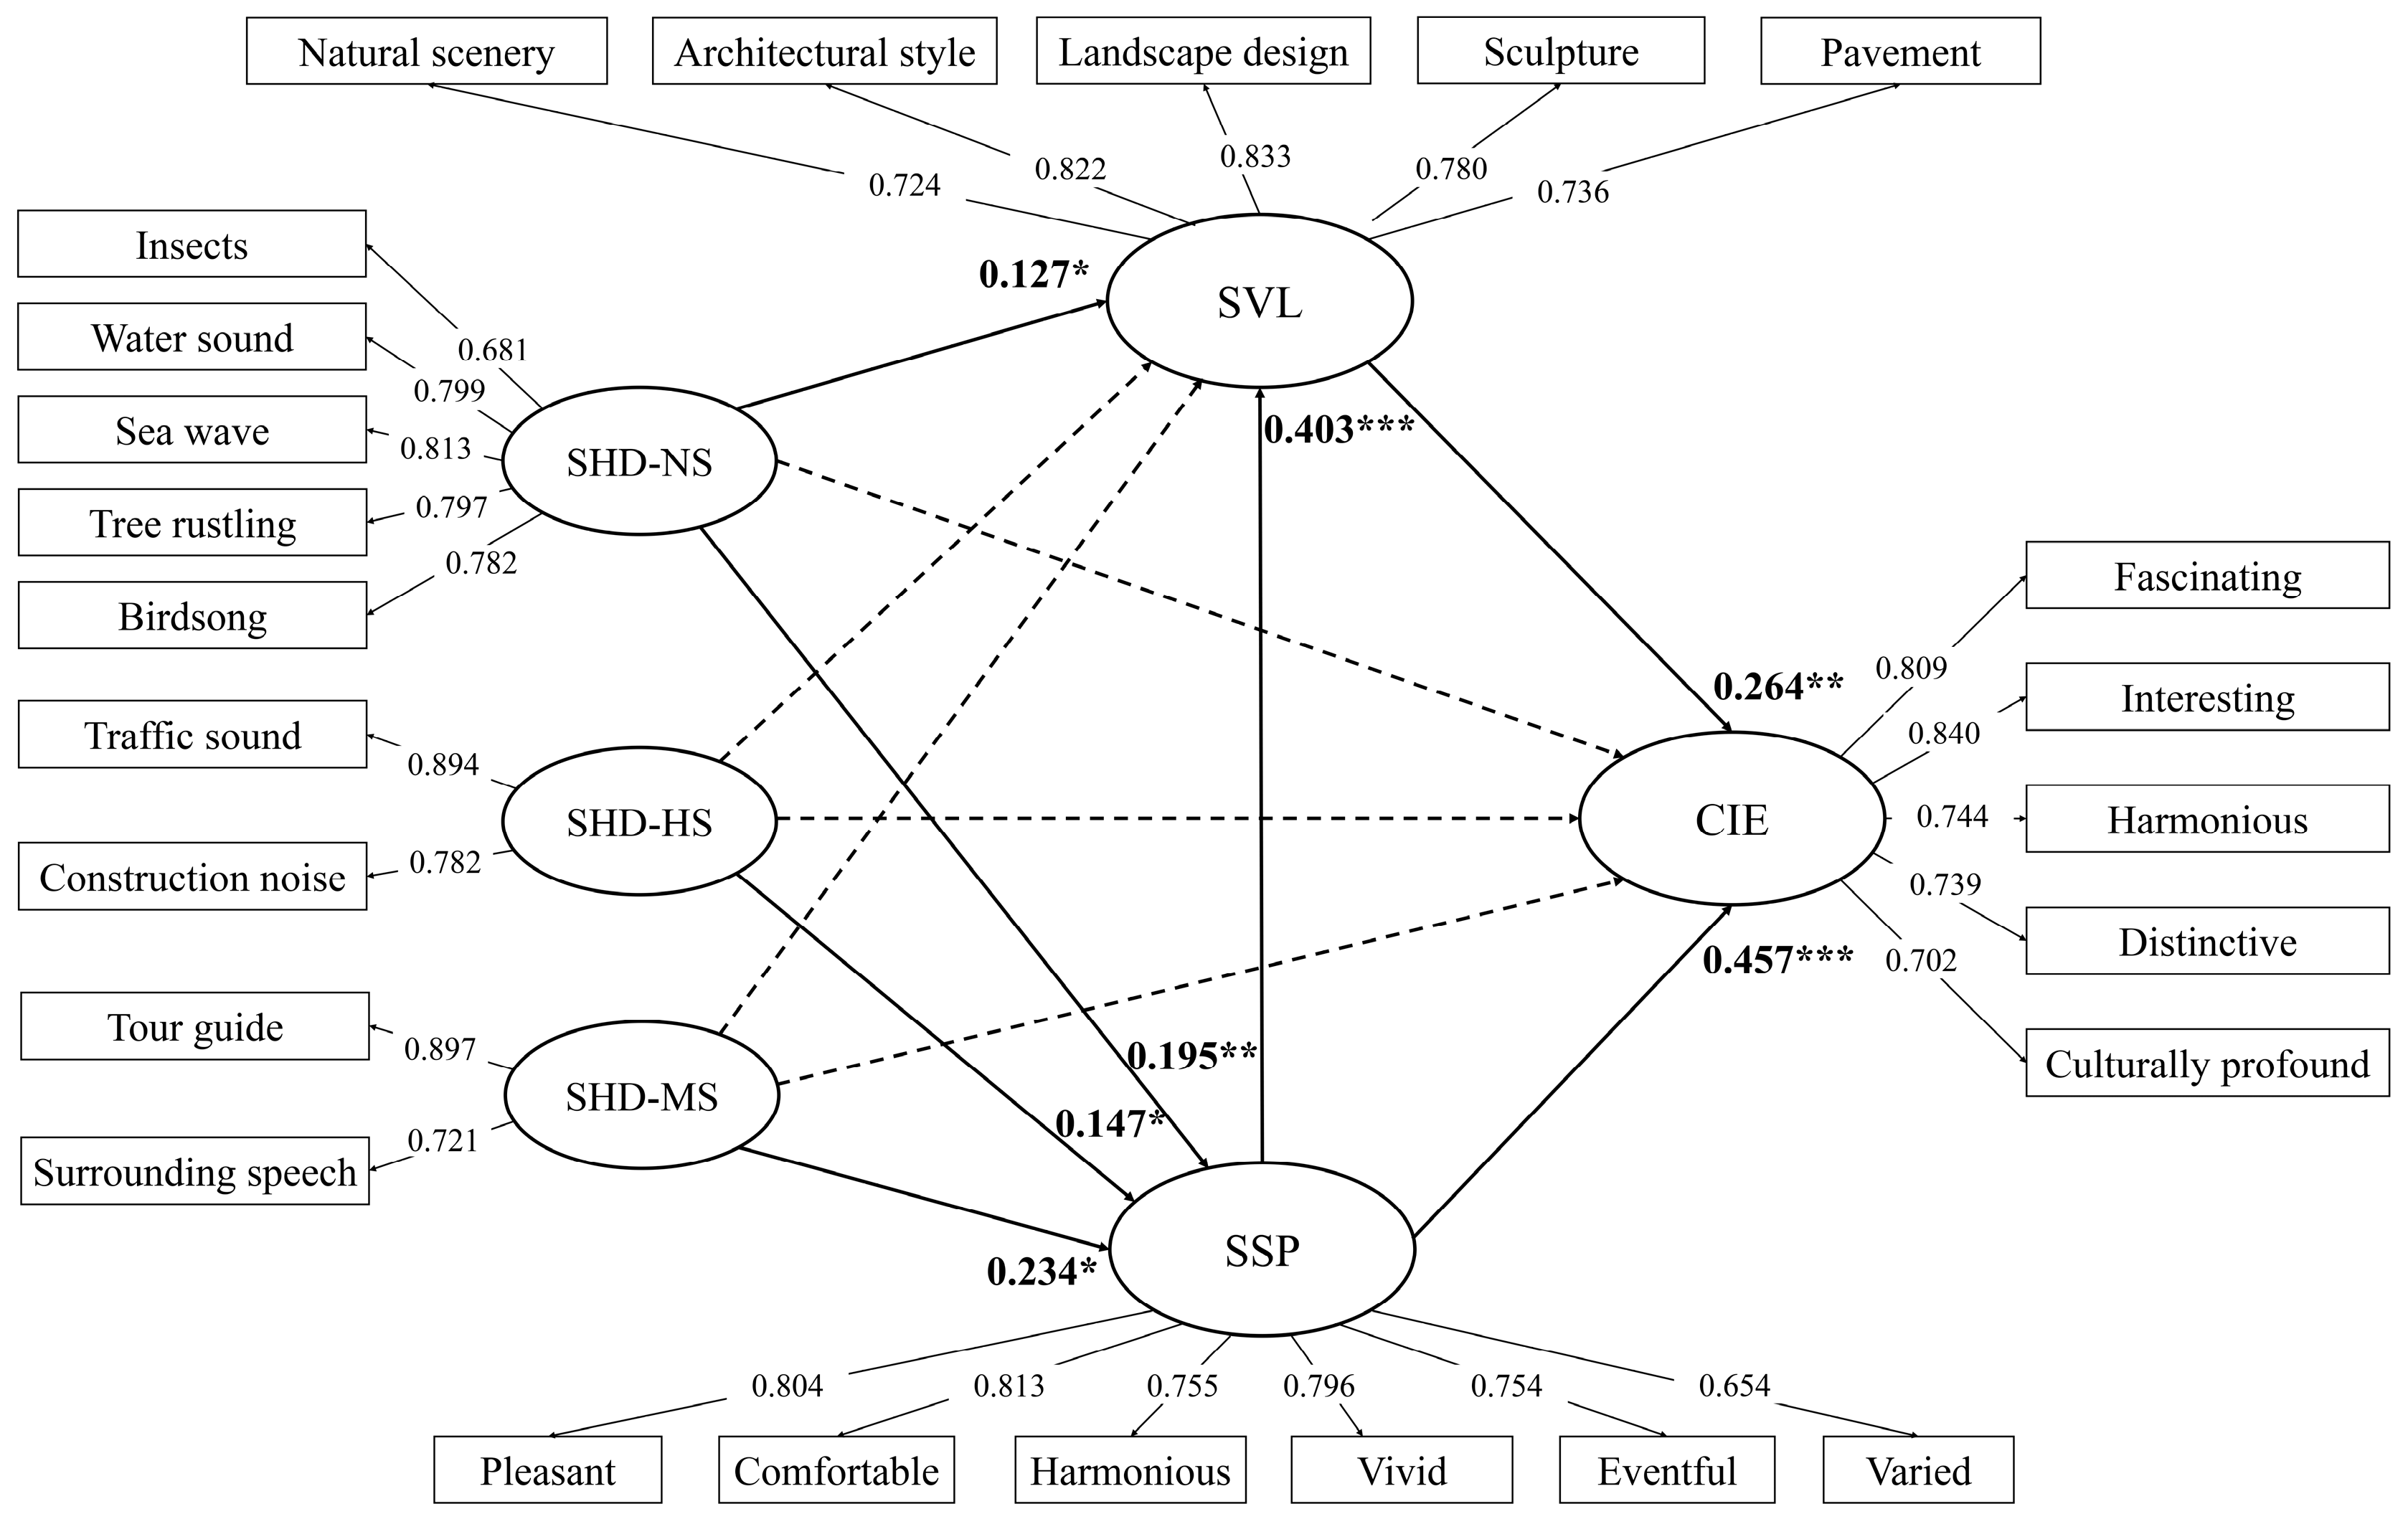
Furthermore, as indicated by the SEM in Figure 5, the SHD of all the three sound source types could positively affect the SSP. According to their preference characteristics, maintaining the dominance of natural sounds, rational controlling the dominance of human sounds and eliminating undesirable mechanical sounds such as construction sounds and traffic sounds, and properly introducing music are effective approaches to improve soundscape quality. Considering about the functional difference in different zones, only the SHD of natural and human sounds showed significant effects on the SSP in the cultural and artistic zone, and only mechanical sounds showed significant effects on the SSP in the historical building zone.

4.3. The SHD Influencing Visual Landscape Experience and Comprehensive Impression

The research results highlight the importance of natural sounds in visiting experience as reflected by the close relationships of their SHD and indicators of SVL as well as CIE [23,57]. This was further confirmed in the analysis of SEM, that only the SHD of natural sounds had significant and positive effects on the SVL, which verifies the existence of the audio–visual interaction in the scenic area [22,58,59]. In addition, the results also indicated the most effective landscape elements interacting with the SHD, such as pavement, natural scenery, and architecture. However, there is a relatively weak relationship between the SHD of both human and mechanical sounds and the SVL. Specific attention should be paid to tour guide sound and traffic sound in order to improve the SVL.
The CIE indicated by “fascinating” was most significantly related to the SHD of several sound sources, including insect, tree rustling, water sound (fountain), broadcasting music, and traffic sound. Although different sound sources could contribute to different comprehensive impression, sea waves, water (fountain), and broadcasting music together could be the most crucial sound sources in forming all the five comprehensive impressions, including fascinating, harmonious, distinctive, interesting, and culturally profound. In addition, as indicated by the SEM results, there was no direct effect of any sound source types on the CIE. However, they could indirectly affect it through the SSP which showed significant and even more effects than the SVL on the CIE [60,61].
In different functional zones, only the SHD of human sounds showed a significant and positive effect on the SVL in the tourist service zone, and it also showed a negative effect on the CIE in this zone. The SHD of natural sounds showed both significant and positive effects on the CIE in the tourist service zone and natural landscape zone. The relationships among the SSP, the SVL, and the CIE were changing in different functional zones as well. The results indicated that soundscape design or management strategies in different functional zones should be flexible, especially in targeting crucial sound sources and taking advantage of the audio–visual interaction, to contribute to a high-quality and comprehensive visiting experience [28,54,62].

4.4. Practical Implications

In this study, we found that the proposed indicators, harmonious degree of sound sources could better reflect the extent to which the dominance of sound sources in the environment matched the preferences of visitors and had a significant impact on the visiting experience. In practice, the research results could help designers, planners, managers to develop more detailed and effective management of soundscapes in the scenic area, and a better understanding of soundscape value and its role in visiting experience. Based on the findings of this study, we make the following proposals for the management of soundscapes in scenic areas.
(1)
Identify major negative sound sources
Until today, noise control has been the major focus of acoustic environment management. In this study, however, we can find that noise such as traffic sound and construction noise have been better controlled in Kulangsu. Instead, certain dominating human sounds have deviated significantly from the preferences of visitors. For example, surrounding speech and sales calling showed the lowest harmonious degree of sound sources. These sound sources, while reflecting the vitality of the scenic area to a certain extent, could actually blur or obscure the perception of other soundscapes such as natural soundscapes, so as to impair the soundscape quality in the scenic area. Therefore, effective control of certain human sounds is necessary in the Kulangsu scenic area, including fine-grained control of the daily number of visitors to the scenic area and some regulation of the volume and playing time of electronic devices by vendors, etc.
(2)
Emphasize the resource attributes of the positive soundscapes
The results of this study showed that the harmonious degree of sound sources could significantly enhance visiting experience, particularly that of natural sounds. Therefore, it's necessary to take steps to highlight the role of these soundscapes, thereby enhancing the attractiveness of the scenic area. For example, positive soundscapes could be labeled through a soundscape map and included in marketing materials such as brochures and tourist maps, so that visitors have sufficient information to know about these positive soundscapes and experience them better. In conjunction with the soundscape map, special routes such as recreational trails around the coastline can be created to guide visitors to experience these positive soundscapes. In addition, during this process, introductions by guides can also be used to enhance visitors’ awareness of these positive soundscapes. It is also worth noting that the ability to make the most of these positive soundscapes to enhance the visiting experience and quality of the scenic area is based on the availability of adequate soundscape resources. This is reflected in the management of the soundscape on Kulangsu by actively creating more positive soundscape resources while protecting existing ones. For example, through thoughtful landscape planning and management to protect bird and insect habitats, adding berry species or trees with larger leaves, etc. In addition, the specific sound sources of Kulangsu can be increased through specific time and place events, such as the sound of various music sources, including pianos and live music, etc. These measures will help to increase soundscape resources to support an enhanced visiting experience.
(3)
Concern for the impact of context on soundscapes and visiting experience
This study has noted that different sound sources have different levels of harmony in different contexts and have different levels of impact on visiting experience. Therefore, when using soundscapes to stimulate positive emotions and promote visiting experience, attention needs to be paid to the impact of the context. For example, in the natural environment, it's necessary to pay more attention to the natural soundscapes, highlighting their dominant position and enhancing the visitor’s perception of them. Whereas, in the human environment, more attention needs to be paid to cultural soundscapes. In certain contexts, there is also a potential for collaboration between different types of soundscapes. This suggests that soundscape management in scenic areas needs to be contextualised in order to develop appropriate solutions.

4.5. Limitations and Future Research

Although this study contributes to the understanding of the impact of soundscapes on visiting experience in scenic areas and how to conduct soundscape management accordingly, there are still some interesting questions for further research. Firstly, while the respondents in this study were all people with normal perceptual functions, sound is in fact the most important way for people with special needs, such as the blind, to perceive the environment. It is therefore essential to understand the impact of soundscape on their visiting experience in scenic areas. Secondly, we need more specific approaches and measures to achieve soundscape quality improvement in scenic areas. This type of research can be conducted through small-scale field experiments to modify the soundscapes of specific sites in a scenic area and to compare the visiting experience before and after the modification for validation, thus enabling evidence-based design and management.

5. Conclusions

The effective management of sound sources, as a crucial landsense element, is a reliable way of achieving soundscape quality control and landsense creation. However, this requires an in-depth understanding of how landsense elements interact with human senses, i.e., how sound source perception affects soundscape perception and other visiting experiences. In this study, based on a public investigation of 195 interviewees in the Kulangsu scenic area, we established a new sound source perception indicator, the harmonious degree of sound sources (SHD), integrating the perceived occurrences and loudness, and preference for sound sources. A statistical method was used to explore the relationships between the SHDs of different sound sources and visiting experience indicators, and a structural equation model was further constructed. The results indicate the following:
(1)
Natural sounds had higher SHD values in the Kulangsu scenic area, with water sound (fountain) being the highest one, while human sounds, especially sales calling, surrounding speech, and playing children, showed lower SHD values. The SHD values of the same type of sound source were different among different functional zones. While most of the natural sounds showed positive SHD values in different zones, more than half of the SHD values of human sounds had negative values, and mechanical sounds normally had small but positive SHD values.
(2)
The SHD, as a comprehensive sound perception indicator, is effective in building relationships with visiting experience. The harmonious status of nearly all the sound sources showed significant and positive relationships with at least one of the visiting experience indicators, except for surrounding speech. The SHD of natural sounds showed the most significant relationships with pleasant soundscape perception, while all three mechanical sounds were closely related to varied soundscapes, and human sounds showed the least but four different significant relationships with SSP indicators. Among all the sound sources, broadcasting music could be the most crucial sound source related to the SSP.
(3)
The SHD of natural sounds also showed close relationships with the SVL, with water sound (fountain) and birdsong as the most prominent sounds, and pavement, natural scenery, and architecture as the most influential visual landscape elements. Although the SHD of both human and mechanical sounds showed relatively weak relationships with the SVL, certain sounds like tour guide sound and traffic sound could be influential to the SVL.
(4)
Crucial sound sources related to the CIE were sea waves, water sound (fountain), and broadcasting music in Kulangsu. The SHD showed the most influence on the fascinating characteristic of the place, followed by harmonious and distinctive, but the effects could be indirectly through the SSP. In addition, audio-visual effects existed in the visiting experience in the scenic area, and the SSP showed more significant effects than the SVL on the CIE.
(5)
The mechanism of the SHD affecting visiting experience was verified to be different according to the function of an area, reflected by different crucial sound sources, the significance of audio–visual interaction effects, as well as the contribution of the SSP and the SVL to the CIE. Thus, flexible soundscape design or management strategies should be adopted to promote a high-quality visiting experience in scenic areas.

Author Contributions

Conceptualization, J.L.; methodology, J.L. and X.G.; formal analysis, J.L. and X.G.; investigation, J.L., X.G, and Z.C.; writing—original draft preparation, J.L. and X.G.; writing—review and editing, J.L., X.-C.H. and Z.C.; supervision, J.L. All authors have read and agreed to the published version of the manuscript.

Funding

This research was funded by the National Key R&D Program of China, grant number 2022YFF1301303, National Natural Science Foundation of China, grant number 52208052 and the Program of Humanities and Social Science Research of Ministry of Education of China (21YJCZH038).

Institutional Review Board Statement

Ethical review and approval were waived for this study due to there is no direct or potential hazards of the questionnaire investigation to the subjects, and they were all informed of the purpose of this research and approved us to collect the data provided by them.

Informed Consent Statement

Informed consent was obtained from all subjects involved in the study.

Data Availability Statement

Data available on request due to restrictions, e.g., privacy or ethical.

Acknowledgments

The authors appreciate the valuable comments of editors.

Conflicts of Interest

The authors declare no conflict of interest.

References

  1. Chen, Z.; Zhu, T.-Y.; Liu, J.; Hong, X.-C. Before Becoming a World Heritage: Spatiotemporal Dynamics and Spatial Dependency of the Soundscapes in Kulangsu Scenic Area, China. Forests 2022, 13, 1526. [Google Scholar] [CrossRef]
  2. Xiong, Y.; Yang, L.; Wang, X.; Liu, J. Mediating effect on landscape experience in scenic area: A case study in Gulangyu Island, Xiamen City. Int. J. Sustain. Dev. World Ecol. 2020, 27, 276–283. [Google Scholar] [CrossRef]
  3. Hu, F.; Wang, Z.-J.; Sheng, G.-H.; Lia, X.; Chen, C.; Geng, D.-H.; Hong, X.-C.; Xu, N.; Zhu, Z.-P.; Zhang, Z.-F.; et al. Impacts of national park tourism sites: A perceptual analysis from residents of three spatial levels of local communities in Banff national park. Environ. Dev. Sustain. 2022, 24, 3126–3145. [Google Scholar] [CrossRef]
  4. Dong, R.; Liu, X.; Liu, M.; Feng, Q.; Su, X.; Wu, G. Landsenses ecological planning for the Xianghe Segment of China’s Grand Canal. Int. J. Sustain. Dev. World Ecol. 2016, 23, 298–304. [Google Scholar] [CrossRef]
  5. Zhao, J.; Yan, Y.; Deng, H.; Liu, G.; Dai, L.; Tang, L.; Shi, L.; Shao, G. Remarks about landsenses ecology and ecosystem services. Int. J. Sustain. Dev. World Ecol. 2020, 27, 196–201. [Google Scholar] [CrossRef] [Green Version]
  6. Zhao, J.; Liu, X.; Dong, R.; Shao, G. Landsenses ecology and ecological planning toward sustainable development. Int. J. Sustain. Dev. World Ecol. 2016, 23, 293–297. [Google Scholar] [CrossRef] [Green Version]
  7. Zheng, T.; Yan, Y.; Lu, H.; Pan, Q.; Zhu, J.; Wang, C.; Zhang, W.; Rong, Y.; Zhan, Y. Visitors’ perception based on five physical senses on ecosystem services of urban parks from the perspective of landsenses ecology. Int. J. Sustain. Dev. World Ecol. 2020, 27, 214–223. [Google Scholar] [CrossRef]
  8. Dong, R.; Yu, T.; Ma, H.; Ren, Y. Soundscape planning for the Xianghe Segment of China’s Grand Canal based on landsenses ecology. Int. J. Sustain. Dev. World Ecol. 2016, 23, 343–350. [Google Scholar] [CrossRef]
  9. Buzova, D.; Sanz-Blas, S.; Cervera-Taulet, A. “Sensing” the destination: Development of the destination sensescape index. Tour. Manag. 2021, 87, 104362. [Google Scholar] [CrossRef]
  10. Jiang, J. The role of natural soundscape in nature-based tourism experience: An extension of the stimulus–organism–response model. Curr. Issues Tour. 2020, 25, 707–726. [Google Scholar] [CrossRef]
  11. An, W.; Alarcón, S. Exploring rural tourism experiences through subjective perceptions: A visual Q approach. Span. J. Agric. Res. 2020, 18, e0108. [Google Scholar] [CrossRef]
  12. Fairweather, J.R.; Swaffield, R.S. Visitor Experiences of Kaikoura, New Zealand: An interpretative study using photographs of landscapes and Q method. Tour. Manag. 2001, 22, 219–228. [Google Scholar] [CrossRef]
  13. Pérez, J.G. Ascertaining Landscape Perceptions and Preferences with Pair-wise Photographs: Planning rural tourism in Extremadura, Spain. Landsc. Res. 2002, 27, 297–308. [Google Scholar] [CrossRef]
  14. Conniff, A.; Craig, T. A methodological approach to understanding the wellbeing and restorative benefits associated with greenspace. Urban For. Urban Green. 2016, 19, 103–109. [Google Scholar] [CrossRef]
  15. Jo, H.I.; Jeon, J.Y. Overall environmental assessment in urban parks: Modelling audio-visual interaction with a structural equation model based on soundscape and landscape indices. Build. Environ. 2021, 204, 108166. [Google Scholar] [CrossRef]
  16. Agapito, D.; Valle, P.; Mendes, J. The sensory dimension of tourist experiences: Capturing meaningful sensory-informed themes in Southwest Portugal. Tour. Manag. 2014, 42, 224–237. [Google Scholar] [CrossRef] [Green Version]
  17. ISO 12913-1:2014; Acoustics—Soundscape—Part 1: Definition and Conceptual Framework. ISO: Geneva, Switzerland, 2014.
  18. Watts, G.R.; Pheasant, R.J. Tranquillity in the Scottish Highlands and Dartmoor National Park–The importance of soundscapes and emotional factors. Appl. Acoust. 2015, 89, 297–305. [Google Scholar] [CrossRef] [Green Version]
  19. Qiu, M.; Zhang, J.; Zhang, H.; Zheng, C. Is looking always more important than listening in tourist experience? J. Travel Tour. Mark. 2018, 35, 869–881. [Google Scholar] [CrossRef]
  20. He, M.; Li, J.; Li, J.; Chen, H. A comparative study on the effect of soundscape and landscape on tourism experience. Int. J. Tour. Res. 2019, 21, 11–22. [Google Scholar] [CrossRef] [Green Version]
  21. Kang, J.; Zhang, M. Semantic differential analysis of the soundscape in urban open public spaces. Build. Environ. 2010, 45, 150–157. [Google Scholar] [CrossRef]
  22. Liu, J.; Xiong, Y.; Wang, Y.; Luo, T. Soundscape effects on visiting experience in city park: A case study in Fuzhou, China. Urban For. Urban Green. 2018, 31, 38–47. [Google Scholar] [CrossRef]
  23. Liu, J.; Yang, L.; Xiong, Y.; Yang, Y. Effects of soundscape perception on visiting experience in a renovated historical block. Build. Environ. 2019, 165, 106375. [Google Scholar] [CrossRef]
  24. Liu, J.; Wang, Y.; Zimmer, C.; Kang, J.; Yu, T. Factors associated with soundscape experiences in urban green spaces: A case study in Rostock, Germany. Urban For. Urban Green. 2019, 37, 135–146. [Google Scholar] [CrossRef]
  25. Zhao, J.; Xu, W.; Ye, L. Effects of auditory-visual combinations on perceived restorative potential of urban green space. Appl. Acoust. 2018, 141, 169–177. [Google Scholar] [CrossRef]
  26. Deng, L.; Luo, H.; Ma, J.; Huang, Z.; Sun, L.-X.; Jiang, M.-Y.; Zhu, C.-Y.; Li, X. Effects of integration between visual stimuli and auditory stimuli on restorative potential and aesthetic preference in urban green spaces. Urban For. Urban Green. 2020, 53, 126702. [Google Scholar] [CrossRef]
  27. Chen, Z.; Hermes, J.; Liu, J.; von Haaren, C. How to integrate the soundscape resource into landscape planning? A perspective from ecosystem services. Ecol. Indic. 2022, 141, 109156. [Google Scholar] [CrossRef]
  28. Hong, J.Y.; Jeon, J.Y. Comparing associations among sound sources, human behaviors, and soundscapes on central business and commercial streets in Seoul, Korea. Build. Environ. 2020, 186, 107327. [Google Scholar] [CrossRef]
  29. Hong, X.-C.; Wang, G.-Y.; Liu, J.; Song, L.; Wu, E.T. Modeling the impact of soundscape drivers on perceived birdsongs in urban forests. J. Clean. Prod. 2021, 292, 125315. [Google Scholar] [CrossRef]
  30. Guo, X.; Liu, J.; Albert, C.; Hong, X.-C. Audio-visual interaction and visitor characteristics affect perceived soundscape restorativeness: Case study in five parks in China. Urban For. Urban Green. 2022, 77, 127738. [Google Scholar] [CrossRef]
  31. Hong, J.Y.; Jeon, J.Y. Influence of urban contexts on soundscape perceptions: A structural equation modeling approach. Landsc. Urban Plan. 2015, 141, 78–87. [Google Scholar] [CrossRef]
  32. Hair, J.F.; Ringle, C.M.; Sarstedt, M. PLS-SEM: Indeed a Silver Bullet. J. Mark. Theory Pract. 2011, 19, 139–152. [Google Scholar] [CrossRef]
  33. Jia, Y.; Ma, H.; Kang, J. Characteristics and evaluation of urban soundscapes worthy of preservation. J. Environ. Manag. 2020, 253, 109722. [Google Scholar] [CrossRef] [PubMed]
  34. Wetzels, M.; Odekerken-Schröeder, G.; Van Oppen, C. Using PLS Path Modeling for Assessing Hierarchical Construct Models: Guidelines and Empirical Illustration. MIS Q. 2009, 33, 177–195. [Google Scholar] [CrossRef]
  35. Bagozzi, R.P.; Yi, Y. On the evaluation of structural equation models. J. Acad. Mark. Sci. 1988, 16, 74–94. [Google Scholar] [CrossRef]
  36. Henseler, J.; Ringle, C.M.; Sarstedt, M. A new criterion for assessing discriminant validity in variance-based structural equation modeling. J. Acad. Mark. Sci. 2015, 43, 115–135. [Google Scholar] [CrossRef] [Green Version]
  37. Tenenhaus, M.; Vinzi, V.E.; Chatelin, Y.-M.; Lauro, C. PLS path modeling. Comput. Stat. Data Anal. 2005, 48, 159–205. [Google Scholar] [CrossRef]
  38. Ketchen, D.J. A primer on partial least squares structural equation modeling. Long Range Plan. 2013, 46, 184–185. [Google Scholar] [CrossRef]
  39. Shmueli, G.; Ray, S.; Estrada, J.M.V.; Chatla, S.B. The elephant in the room: Predictive performance of PLS models. J. Bus. Res. 2016, 69, 4552–4564. [Google Scholar] [CrossRef]
  40. Yang, W.; Kang, J. Soundscape and Sound Preferences in Urban Squares: A Case Study in Sheffield. J. Urban Des. 2005, 10, 61–80. [Google Scholar] [CrossRef]
  41. Sharifnejad, M.; Montazerolhodjah, M.; Montazerolhodjah, M. Soundscape preferences of tourists in historical urban open spaces. Int. J. Tour. Cities 2019, 5, 465–481. [Google Scholar]
  42. Brown, A.; Kang, J.; Gjestland, T. Towards standardization in soundscape preference assessment. Appl. Acoust. 2011, 72, 387–392. [Google Scholar] [CrossRef]
  43. Patón, D.; Delgado, P.; Galet, C.; Muriel, J.; Méndez-Suárez, M.; Hidalgo-Sánchez, M. Using acoustic perception to water sounds in the planning of urban gardens. Build. Environ. 2020, 168, 106510. [Google Scholar] [CrossRef]
  44. Steele, D.; Tarlao, C.; Bild, E.; Rice, J.; Guastavino, C. How does activity affect soundscape assessments? Insights from an urban soundscape intervention with music. J. Acoust. Soc. Am. 2017, 141, 3622. [Google Scholar] [CrossRef]
  45. Ma, K.W.; Mak, C.M.; Wong, H.M. Effects of environmental sound quality on soundscape preference in a public urban space. Appl. Acoust. 2021, 171, 107570. [Google Scholar] [CrossRef]
  46. Liu, J.; Kang, J.; Behm, H. Birdsong as an Element of the Urban Sound Environment: A Case Study Concerning the Area of Warnemünde in Germany. Acta Acust. United Acust. 2014, 100, 458–466. [Google Scholar] [CrossRef]
  47. Zhao, W.; Li, H.; Zhu, X.; Ge, T. Effect of Birdsong Soundscape on Perceived Restorativeness in an Urban Park. Int. J. Environ. Res. Public Health 2020, 17, 5659. [Google Scholar] [CrossRef]
  48. Li, Z.; Kang, J. Sensitivity analysis of changes in human physiological indicators observed in soundscapes. Landsc. Urban Plan. 2019, 190, 103593. [Google Scholar] [CrossRef]
  49. Alvarsson, J.J.; Wiens, S.; Nilsson, M.E. Stress Recovery during Exposure to Nature Sound and Environmental Noise. Int. J. Environ. Res. Public Health 2010, 7, 1036–1046. [Google Scholar] [CrossRef] [PubMed]
  50. Krzywicka, P.; Byrka, K. Restorative Qualities of and Preference for Natural and Urban Soundscapes. Front. Psychol. 2017, 8, 1705. [Google Scholar] [CrossRef] [PubMed] [Green Version]
  51. Li, Z.; Ba, M.; Kang, J. Physiological indicators and subjective restorativeness with audio-visual interactions in urban soundscapes. Sustain. Cities Soc. 2021, 75, 103360. [Google Scholar] [CrossRef]
  52. Annerstedt, M.; Jönsson, P.; Wallergård, M.; Johansson, G.; Karlson, B.; Grahn, P.; Hansen, Å.M.; Währborg, P. Inducing physiological stress recovery with sounds of nature in a virtual reality forest—Results from a pilot study. Physiol. Behav. 2013, 118, 240–250. [Google Scholar] [CrossRef] [PubMed]
  53. Jeon, J.Y.; Lee, P.J.; You, J.; Kang, J. Acoustical characteristics of water sounds for soundscape enhancement in urban open spaces. J. Acoust. Soc. Am. 2012, 131, 2101–2109. [Google Scholar] [CrossRef] [PubMed]
  54. Hong, J.Y.; Jeon, J.Y. Relationship between spatiotemporal variability of soundscape and urban morphology in a multifunctional urban area: A case study in Seoul, Korea. Build. Environ. 2017, 126, 382–395. [Google Scholar] [CrossRef]
  55. Li, W.; Zhai, J.; Zhu, M. Characteristics and perception evaluation of the soundscapes of public spaces on both sides of the elevated road: A case study in Suzhou, China. Sustain. Cities Soc. 2022, 84, 103996. [Google Scholar] [CrossRef]
  56. Fan, Q.-D.; He, Y.-J.; Hu, L. Soundscape evaluation and construction strategy of park road. Appl. Acoust. 2021, 174, 107685. [Google Scholar] [CrossRef]
  57. Jiang, J.; Zhang, J.; Zhang, H.; Yan, B. Natural soundscapes and tourist loyalty to nature-based tourism destinations: The mediating effect of tourist satisfaction. J. Travel Tour. Mark. 2018, 35, 218–230. [Google Scholar] [CrossRef]
  58. Jeon, J.Y.; Hong, J.Y. Classification of urban park soundscapes through perceptions of the acoustical environments. Landsc. Urban Plan. 2015, 141, 100–111. [Google Scholar] [CrossRef]
  59. Hong, J.Y.; Jeon, J.Y. Designing sound and visual components for enhancement of urban soundscapes. J. Acoust. Soc. Am. 2013, 134, 2026–2036. [Google Scholar] [CrossRef]
  60. Kanngieser, A. A sonic geography of voice: Towards an affective politics. Prog. Hum. Geogr. 2012, 36, 336–353. [Google Scholar] [CrossRef]
  61. Falahatkar, H.; Aminzadeh, B. The sense of place and its influence on place branding: A case study of Sanandaj natural landscape in Iran. Landsc. Res. 2020, 45, 123–136. [Google Scholar] [CrossRef]
  62. Tan, J.K.A.; Hasegawa, Y.; Lau, S.-K.; Tang, S.-K. The effects of visual landscape and traffic type on soundscape perception in high-rise residential estates of an urban city. Appl. Acoust. 2022, 189, 108580. [Google Scholar] [CrossRef]
Figure 1. Aerial photo of Kulangsu scenic area (source: elaborated by the authors with Google earth).
Forests 14 00138 g001
Figure 2. Mean values of sound source perception indicators, perceived occurrences (POS), perceived loudness (PLS), preference (PFS), harmonious degree of sound source (SHD).
Forests 14 00138 g002
Figure 3. Mean values of harmonious degree of sound sources in different functional zones.
Forests 14 00138 g003
Figure 4. A conceptual model of the SHD influencing visiting experience in Kulangsu, SHD-NS: harmonious degree of natural sound, SHD-MS: harmonious degree of mechanical sound, SHD-HS: harmonious degree of human sound, SPE: soundscape perception, SVL: satisfaction degree of visual landscape, CIE: comprehensive impression evaluation.
Forests 14 00138 g004
Figure 5. The modified model of the SHD influencing visiting experience in Kulangsu, SHD-NS: harmonious degree of natural sound, SHD-MS: harmonious degree of mechanical sound, SHD-HS: harmonious degree of human sound, SPE: soundscape perception, SVL: satisfaction degree of visual landscape, CIE: comprehensive impression evaluation, significant paths are marked with * (p < 0.05), ** (p < 0.01) or *** (p < 0.001).
Forests 14 00138 g005
Table 1. Identified sound sources in Kulangsu.
Sound CategorySound Source
Human soundsurrounding speech, playing children, sales calling, tour guide
Mechanical soundbroadcasting music, construction noise, traffic sound,
Natural soundbirdsong, insects, sea waves, tree rustling, water sound (fountain)
Table 2. Sample information of the questionnaire database, N = 195.
VariableCategorySample SizeProportion (%)
GenderMale8845.1
Female10754.9
Age≤247538.5
25–306030.8
31–403316.9
41–50168.2
51–5984.1
≥6031.5
Education backgroundPrimary10.5
Secondary73.6
High school3015.4
University14272.8
Postgraduate157.7
OccupationStudent5528.2
Enterprise and public institution6432.8
Self-employed2713.8
Retiree73.6
Other4221.5
Residential statusKulangsu resident73.6
Xiamen resident178.7
Tourist15780.5
Local merchant42.1
Foreign merchant73.6
Student31.5
Visit frequencyFirst time10654.4
Second–third time3216.4
Once a day2110.8
Once a month10.5
Once a week94.6
Other2613.3
Length of residenceLess than a week16986.7
Less than a month10.5
Less than a year31.5
Less than 5 years73.6
Permanent residents157.7
Table 3. The correlation coefficients between the SHD of each of the sound sources and the visiting experience indicators, SSP: soundscape perception, SVL: satisfaction degree of visual landscape, CIE: comprehensive impression.
Sound CategorySHDSSPSVLCIE
Natural soundBirdsongPleasant (0.146 *)Natural scenery (0.159 *)/
Architectural style (0.159 *)
Landscape design (0.196 **)
Pavement (0.155 *)
InsectsVaried (0.164 *)Pavement (0.151 *)Fascinating (0.148 *)
Sea wavesPleasant (0.186 **)Natural scenery (0.195 **)Harmonious (0.197 **)
Comfortable (0.165 *)Architectural style (0.215 **)Distinctive (0.176 *)
Pavement (0.172 *)Culturally profound (0.155 *)
Tree rustlingPleasant (0.176 *)Architectural style (0.176 *)Fascinating (0.164 *)
Harmonious (0.165 *)
Water sound (fountain)Pleasant (0.278 **)Natural scenery (0.228 **)Fascinating (0.226 **)
Comfortable (0.196 **)Architectural style (0.249 **)Harmonious (0.227 **)
Landscape design (0.227 **)Distinctive (0.198 *)
Sculpture (with other sketches) (0.144 *)
Pavement (0.175 *)
Human soundSurrounding speech///
Playing childrenHarmonious (0.149 *)//
Tour guidePleasant (0.142 *)Natural scenery (0.179 *)Distinctive (0.153 *)
Eventful (0.143 *)Pavement (0.169 *)
Sales callingVivid (0.164 *)/Interesting (0.204 **)
Mechanical soundConstruction noiseVaried (0.154 *)/Interesting (0.173 *)
Traffic soundEventful (0.216 **)Landscape design (0.143 *)Fascinating (0.162 *)
Varied (0.174 *) Distinctive (0.141 *)
Broadcasting musicPleasant (0.168 *)/Fascinating (0.153 *)
Comfortable (0.170 *) Interesting (0.187 **)
Eventful (0.234 **) Harmonious (0.169 *)
Varied (0.198 **)
Note: Significant correlations are marked with * (p < 0.05) and ** (p < 0.01).
Table 4. Modified measurement model, SHD-NS: harmonious degree of natural sound, SHD-MS: harmonious degree of mechanical sound, SHD-HS: harmonious degree of human sound, SSP: soundscape perception, SVL: satisfaction degree of visual landscape, CIE: comprehensive impression evaluation.
Latent VariablesObserved VariablesStandardized Factor LoadingCRAVE
SHD-NSInsects0.681 ***0.8830.602
Water sound (fountain)0.799 ***
Sea waves0.813 ***
Tree rustling0.797 ***
Birdsong0.782 ***
SHD-MSTraffic sound0.894 ***0.8270.705
Construction noise0.782 ***
SHD-HSTour guide0.897 ***0.7950.662
Surrounding speech0.721 ***
SSPPleasant0.804 ***0.8940.585
Comfortable0.813 ***
Harmonious0.755 ***
Vivid0.796 ***
Eventful0.754 ***
Varied0.654 ***
SVLNatural scenery0.724 ***0.8860.609
Architectural style0.822 ***
Landscape design0.833 ***
Sculpture (with other sketches)0.780 ***
Pavement0.736 ***
CIEFascinating0.809 ***0.8780.591
Interesting0.840 ***
Harmonious0.744 ***
Distinctive0.739 ***
Culturally profound0.702 ***
Note: significant factors are marked with *** (p < 0.001)
Table 5. The test of discrimination validity of the variables, SHD-NS: harmonious degree of natural sound, SHD-MS: harmonious degree of mechanical sound, SHD-HS: harmonious degree of human sound, SPE: soundscape perception, SVL: satisfaction degree of visual landscape, CIE: comprehensive impression evaluation.
Fornell–Larcker Criterion
SHD-NSSHD-MSSHD-HSSSPESVLCIE
SHD-NS0.776
SHD-MS−0.1620.84
SHD-HS0.0580.3050.813
SPE0.1660.2470.2290.765
SVL0.2030.1270.2630.4610.78
CIE0.1950.110.1420.5780.4780.768
HTMT Criterion
SHD-NSSHD-MSSHD-HSSPESVLCIE
SHD-NS
SHD-MS0.226
SHD-HS0.2080.618
SPE0.1910.340.353
SVL0.2470.1650.370.52
CIE0.2290.1730.2210.6820.563
Note: values (bold) on the diagonal represent the square root of the AVE while the off-diagonals are correlations.
Table 6. Testing of hypothesis paths in the structural equation model.
Hypothesis PathβMeanS.ET-Valuep-Value95% CI
2.50%97.50%
Ha1: SHD-NS → SPE0.1950.2060.0692.8160.005 **0.0240.3110.042
Ha2: SHD-NS → SVL0.1270.1310.0552.2830.022 *0.0040.2260.02
Ha3: SHD-NS → CIE0.0650.0660.0621.0580.29−0.060.180.006
Hb1:SHD-HS → SPE0.1470.1560.0712.0550.04 *−0.0120.2690.022
Hb2:SHD-HS → SVL0.1640.1580.0981.6640.096−0.0270.360.032
Hb3:SHD-HS → CIE−0.031−0.0290.0690.4480.655−0.1740.0960.001
Hc1: SHD-MS → SSP0.2340.2230.0992.360.018 *0.0360.4160.055
Hc2: SHD-MS → SVL−0.0010.0020.0810.0180.986−0.1510.1670
Hc3: SHD-MS → CIE−0.016−0.0040.1000.1580.874−0.2220.1570
Hd1: SSP → SVL0.4030.4120.0924.3880 ***0.2130.5680.191
Hd2: SSP → CIE0.4570.4510.0865.320 ***0.2770.6130.255
He1: SVL → CIE0.2640.2760.0863.0740.002 **0.0940.4180.086
Note: Significant paths are marked with *(p< 0.05), **(p< 0.01) or ***(p<0.001).
Table 7. The validity of the structural equation model.
ConstructSSPSVLCIE
Adjusted R2 (coefficient of determination)0.1100.2380.381
Q2 (predict relevance) a0.0590.1250.222
GoF (goodness of fit) b0.38
Note: a: Q2 > 0 exhibiting predictive relevance; b: 0.1 ≤ GoF small < 0.25, 0.25 ≤ GoF medium < 0.36, GoF large ≥ 0.36)
Table 8. Results of multiple-group analysis in different functional zones.
Hypothesis pathType ⅠType ⅡType ⅢType ⅣType Ⅴ
Ha1: SHD-NS → SSP0.028−0.2770.443 **0.3060.15
Ha2: SHD-NS → SVL−0.1630.0710.2070.2760.282
Ha3: SHD-NS → CIE0.433 *0.099−0.132−0.1370.369 *
Hb1:SHD-HS → SSP0.1290.1770.362 *0.093−0.034
Hb2:SHD-HS → SVL0.444 ***0.1140.1750.207−0.076
Hb3:SHD-HS → CIE−0.491 *0.1250.104−0.037−0.132
Hc1: SHD-MS → SSP0.3280.179−0.0650.297 *0.328
Hc2: SHD-MS → SVL0.132−0.2−0.105−0.051−0.126
Hc3: SHD-MS → CIE−0.0880.1870.0110.2440.061
Hd1: SSP → SVL0.1780.789 ***0.423 *0.1490.158
Hd2: SSP → CIE0.5490.566 **0.2530.576 ***0.387 *
He1: SVL → CIE0.3410.1310.656 ***0.3280.352 *
Note: β value of each path is shown in the table, Type Ⅰ: tourist service zone, Type Ⅱ: musical zone, Type Ⅲ: cultural and artistic zone, Type Ⅳ: historical building zone, Type Ⅴ: natural landscape zone, significant paths are marked with * (p < 0.05), ** (p < 0.01) or *** (p < 0.001).
Table 9. The coefficient difference between the same path in different functional zones.
Hypothesis PathPath Coefficient-Differencep Value
Type Ⅰ vs. Type ⅡSHD-HS → CIE−0.6150.034
SSP → SVL−0.6110.014
Type Ⅰ vs. Type ⅢSHD-HS → CIE−0.5950.018
SHD-NS → CIE0.5650.02
Type Ⅰ vs. Type ⅣSHD-NS → CIE0.570.032
Type Ⅱ vs. Type ⅢSHD-NS → SSP−0.720.022
SVL → CIE−0.5260.021
Type Ⅱ vs. Type ⅣSSP → SVL0.640.015
Type Ⅱ vs. Type ⅤSSP → SVL0.630.022
Type Ⅲ vs. Type ⅤSHD-NS → CIE−0.5010.013
SSP → SVL−0.630.022
Type Ⅳ vs. Type ⅤSHD-NS → CIE−0.5060.024
Note: Type Ⅰ: tourist service zone, Type Ⅱ: musical zone, Type Ⅲ: cultural and artistic zone, Type Ⅳ: historical building zone, Type Ⅴ: natural landscape zone.
Disclaimer/Publisher’s Note: The statements, opinions and data contained in all publications are solely those of the individual author(s) and contributor(s) and not of MDPI and/or the editor(s). MDPI and/or the editor(s) disclaim responsibility for any injury to people or property resulting from any ideas, methods, instructions or products referred to in the content.

