
Assessment of Carbon Productivity Dynamics in Aspen Stands under Climate Change Based on Forest Inventories in Central Siberia

Abstract
:1. Introduction
2. Materials and Methods
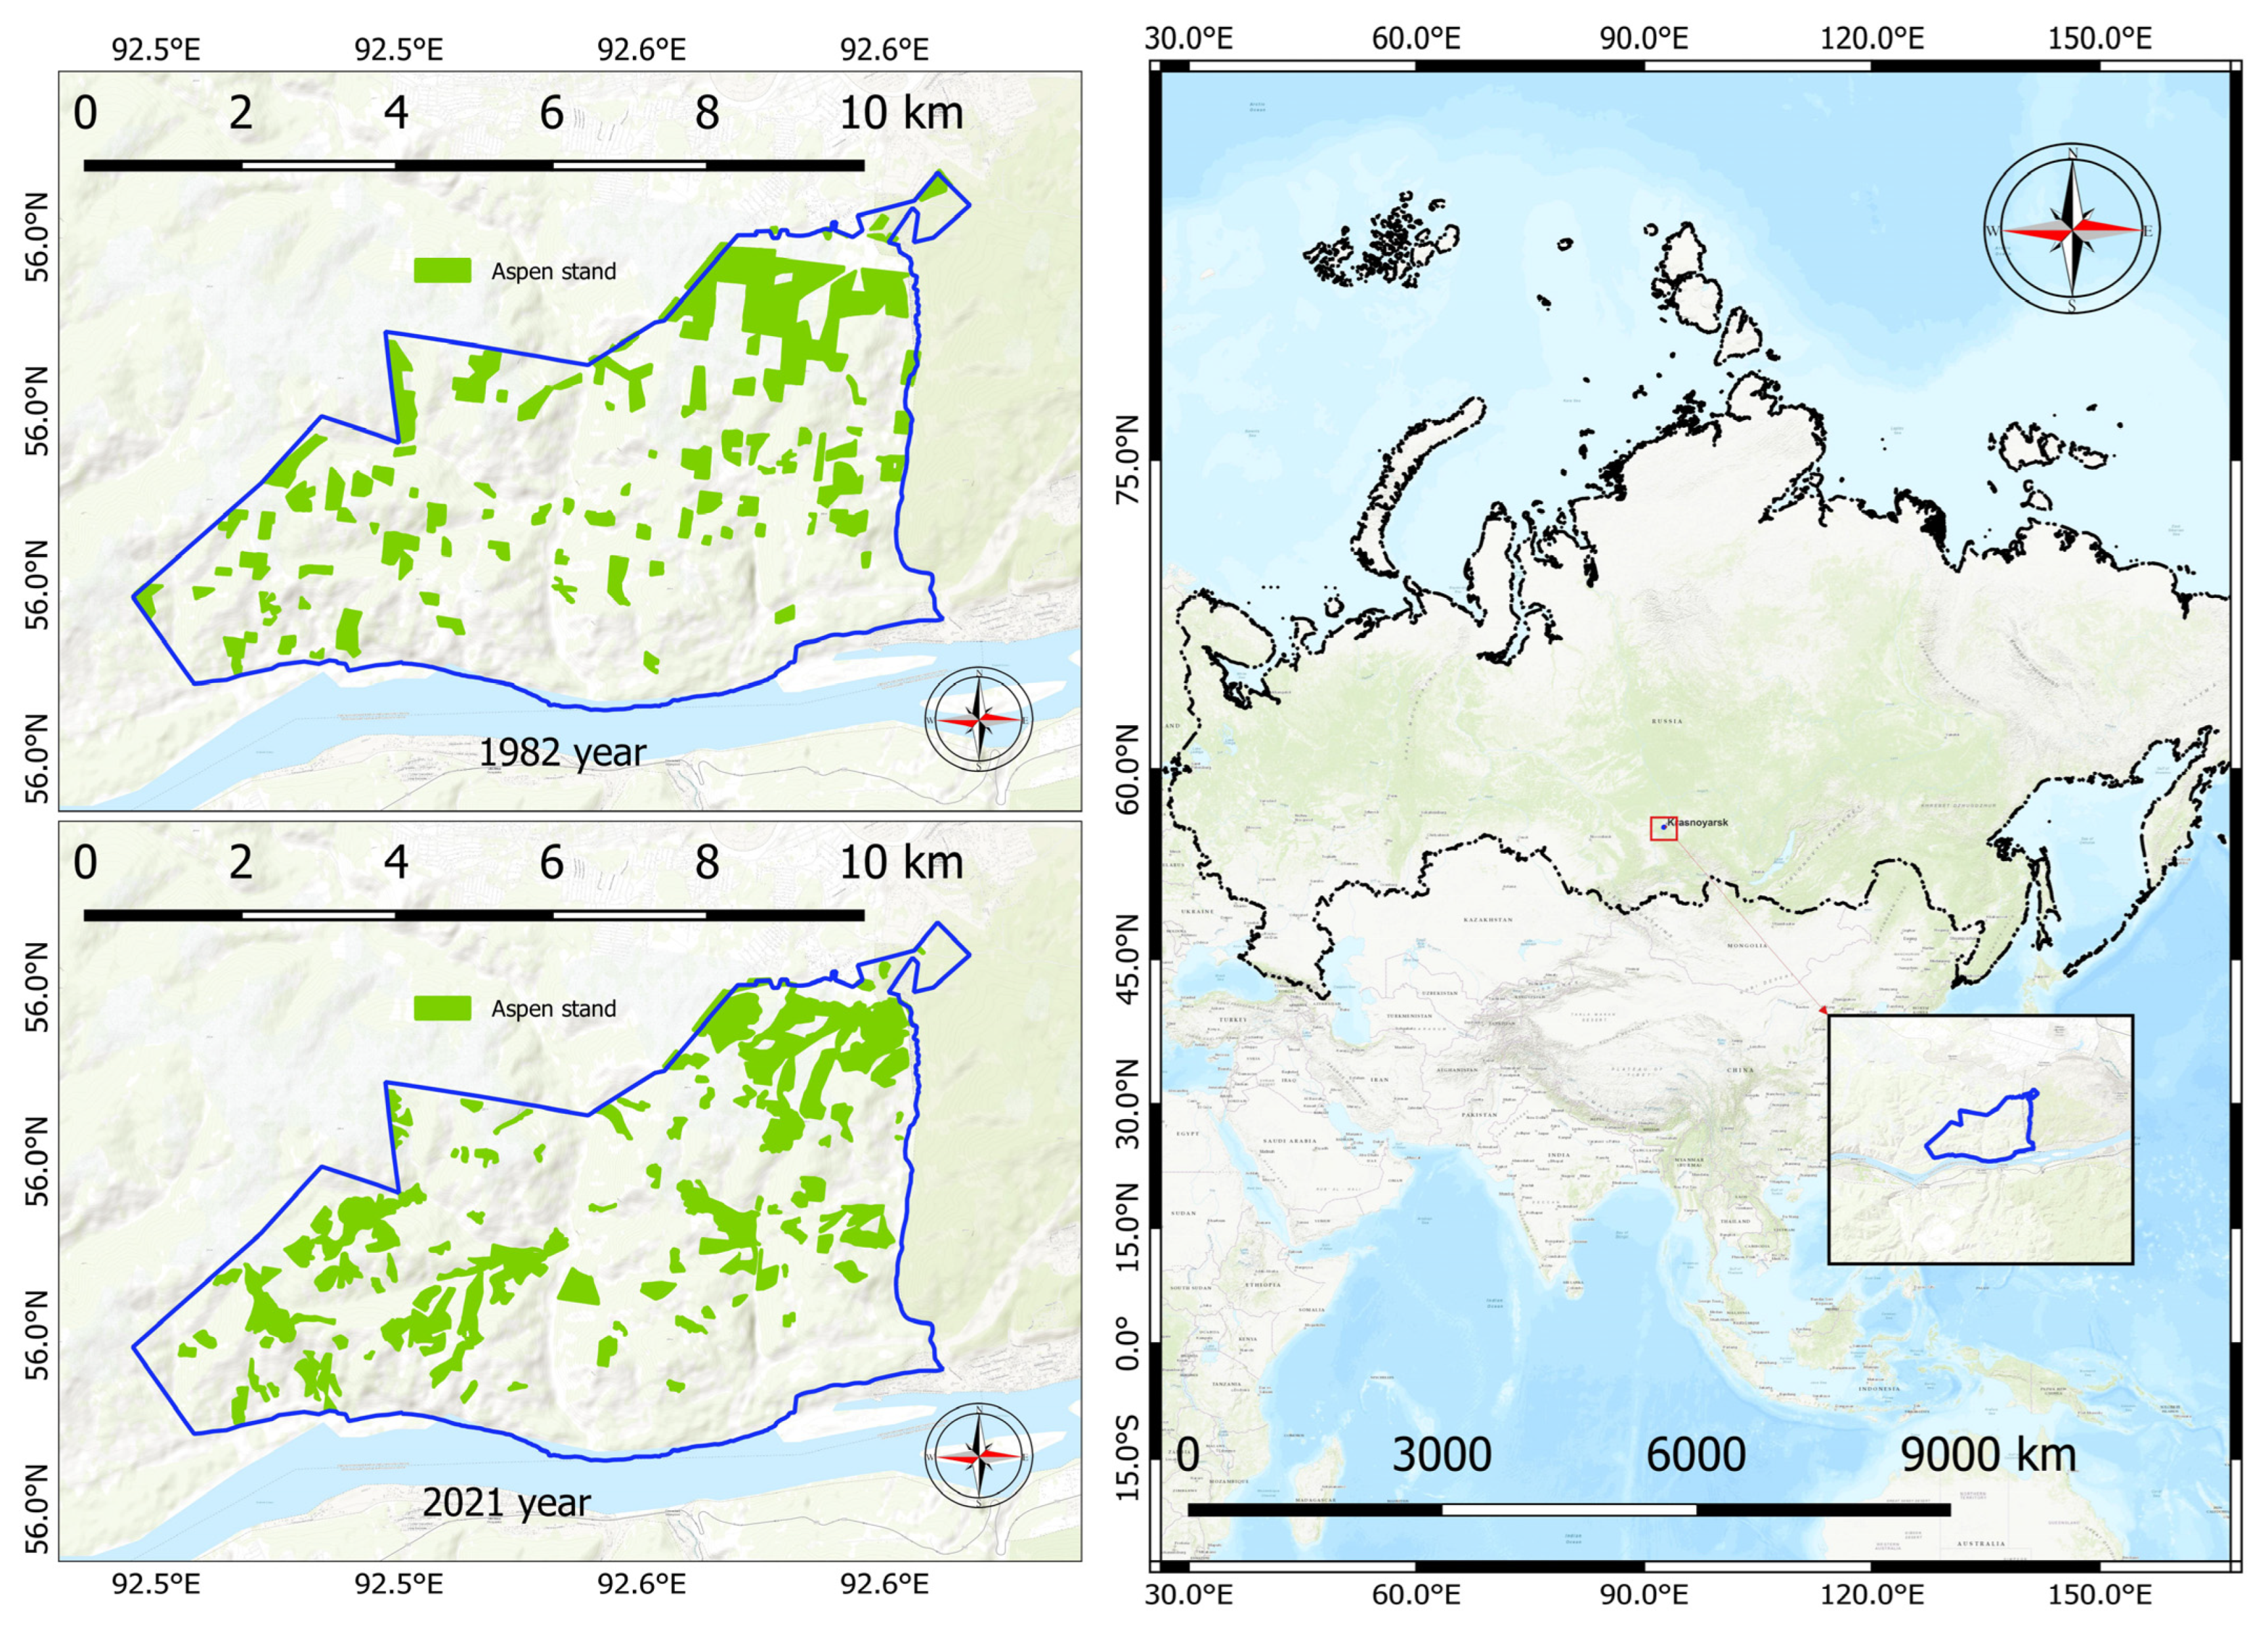
2.1. Study Area
2.2. Data Collection Methods
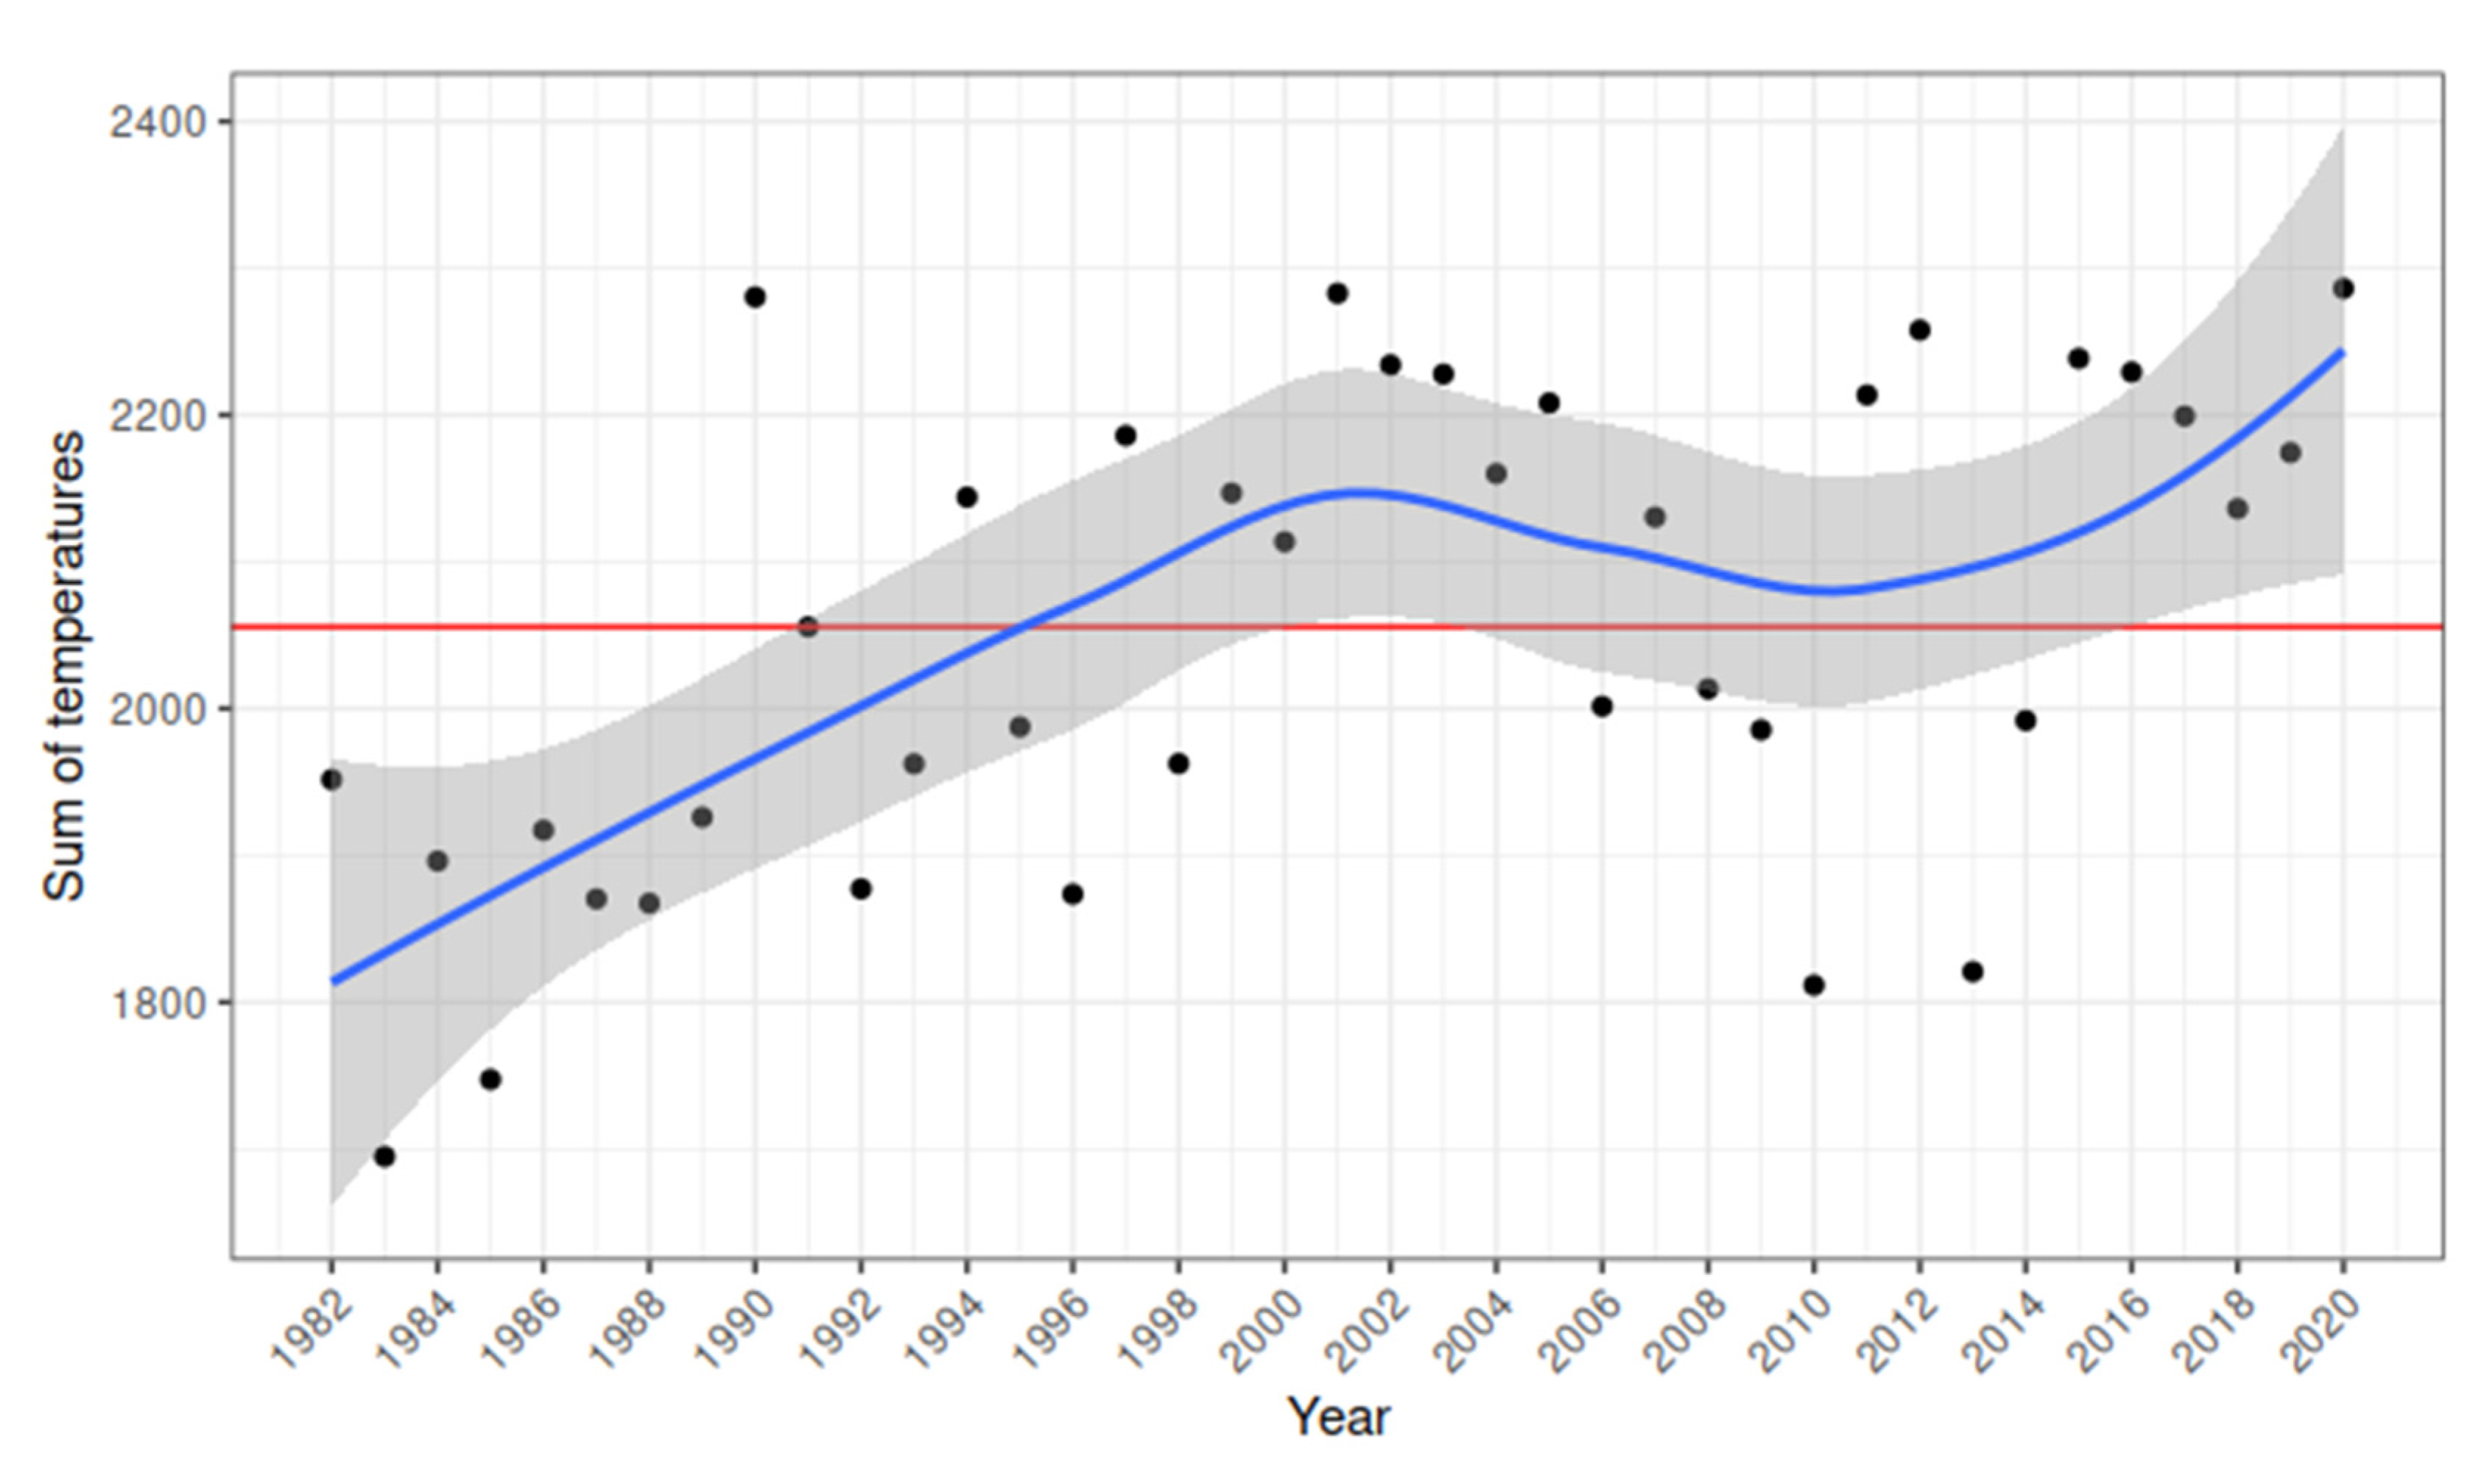
2.3. Data Analysis
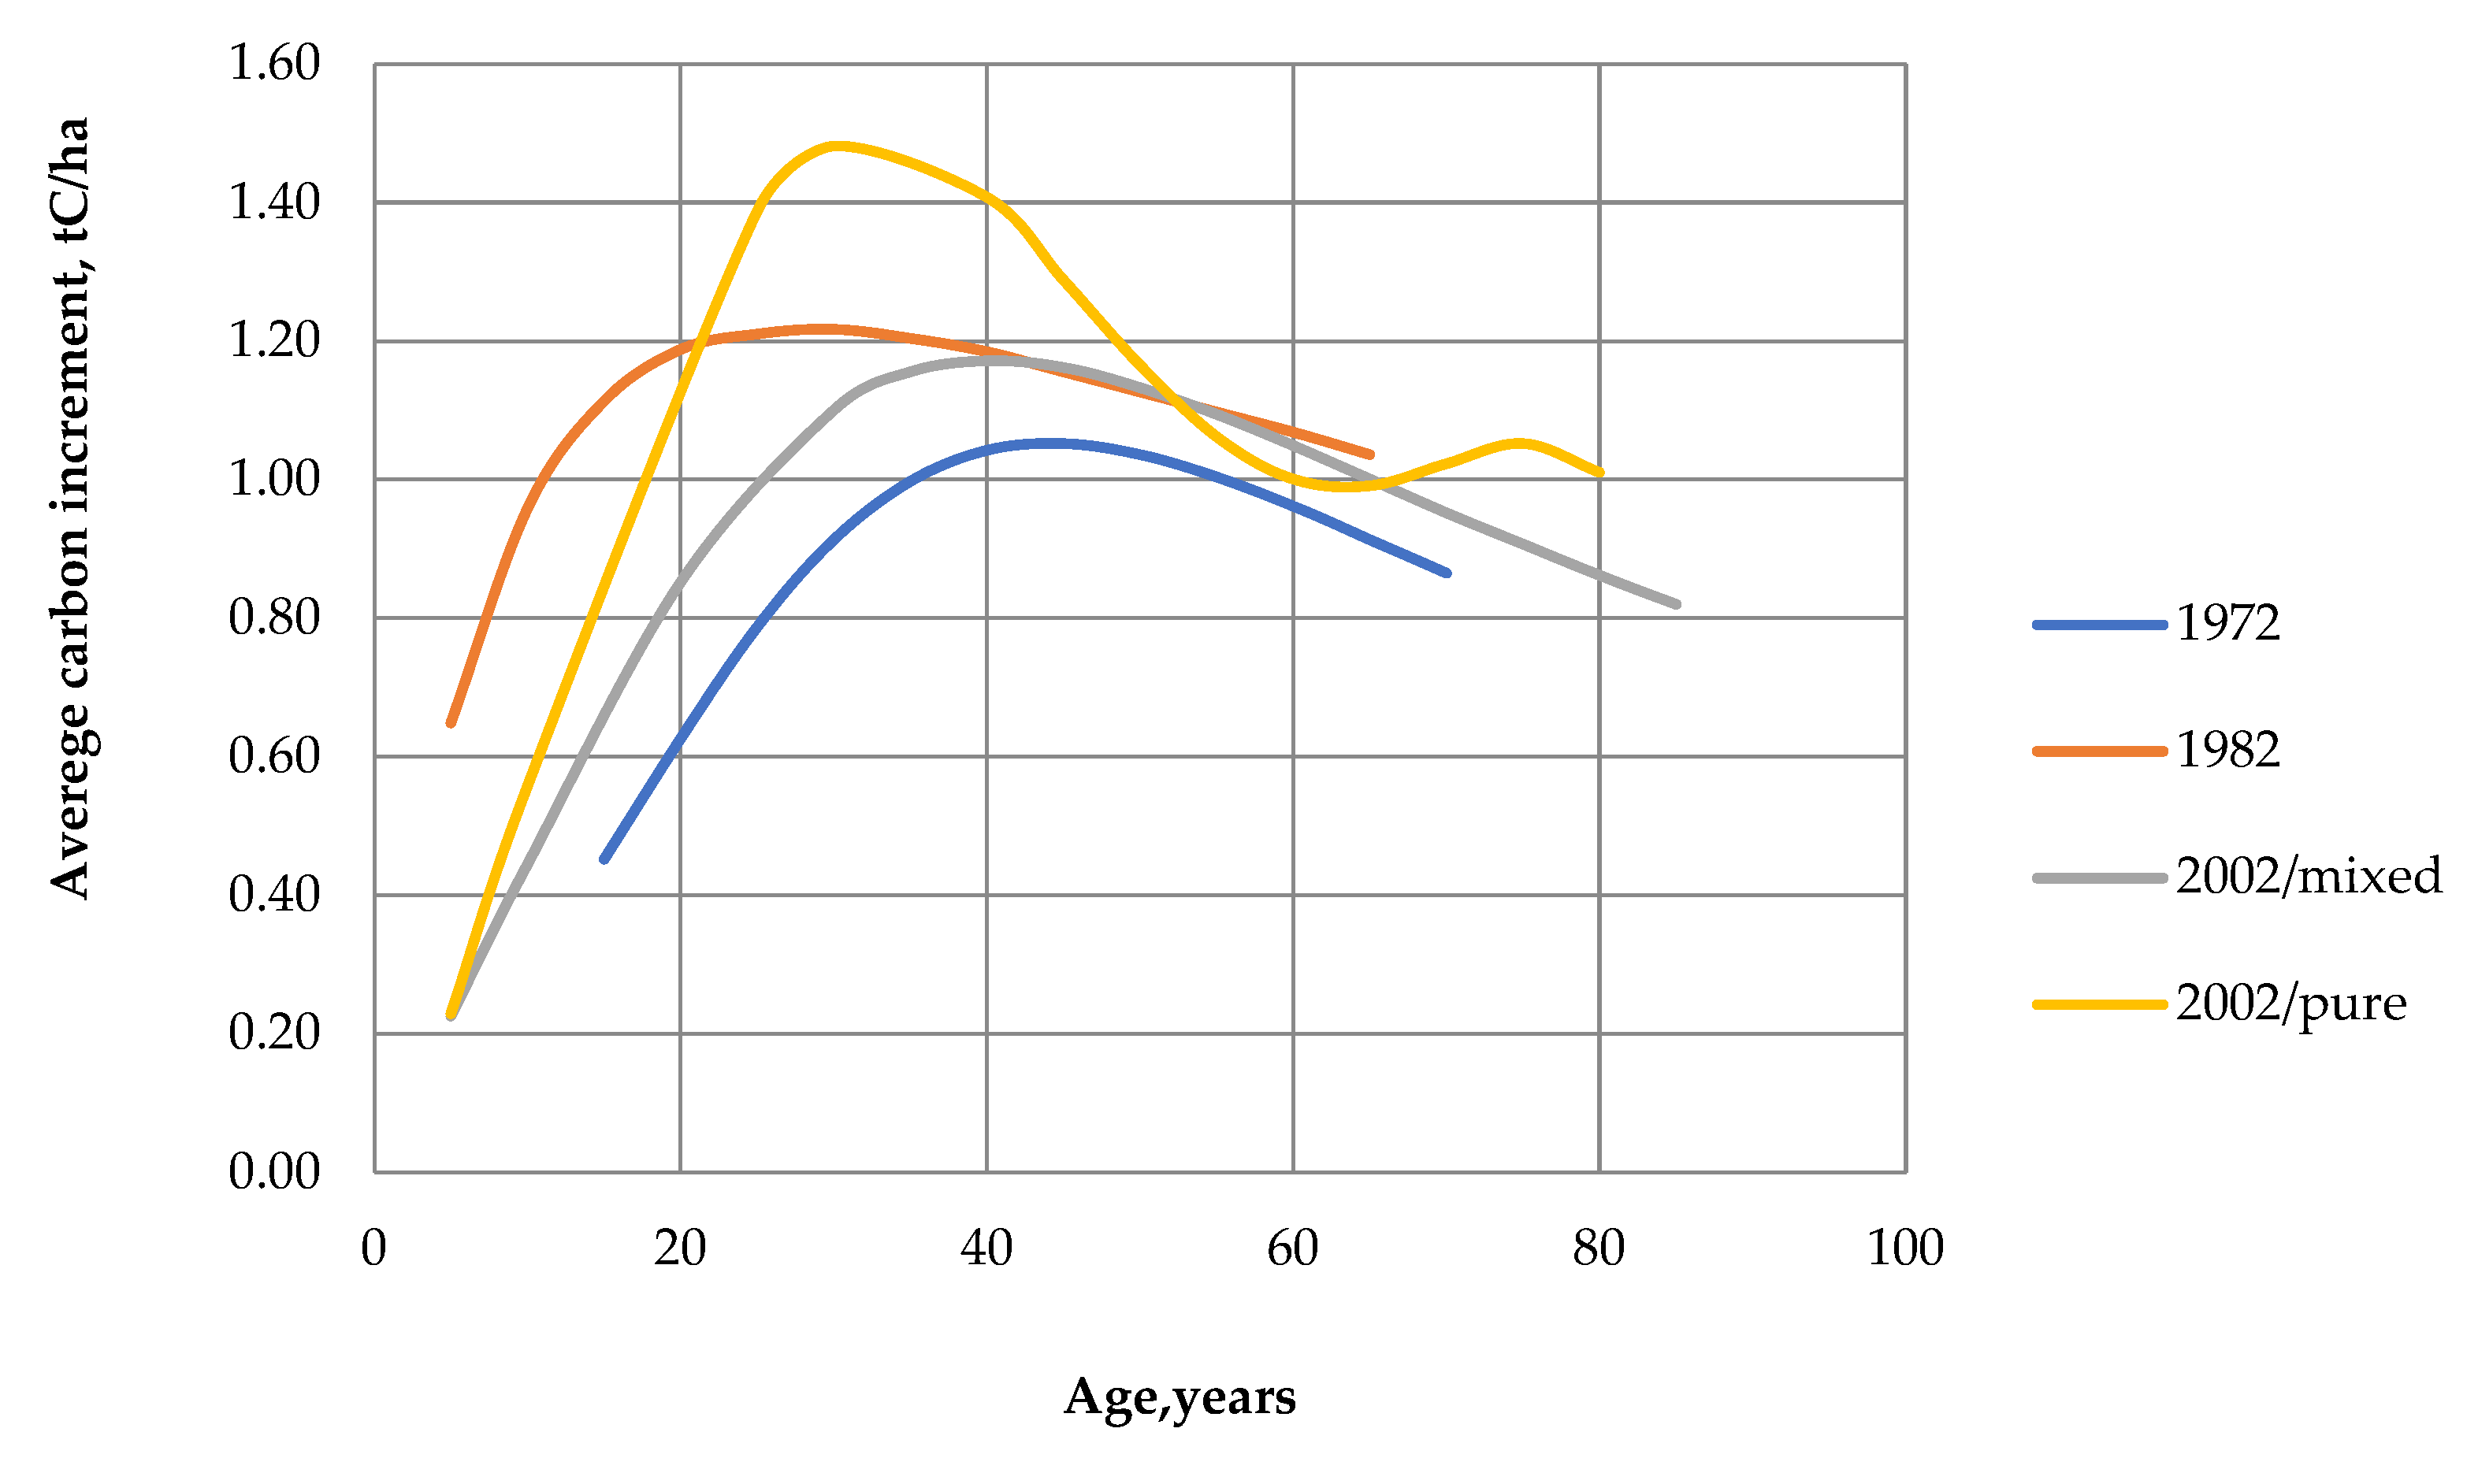
3. Results
4. Discussion
5. Conclusions
Author Contributions
Funding
Data Availability Statement
Conflicts of Interest
References
- Kashkarov, E.P.; Pomortsev, O.A. Global warming: The rhythmic basis of the forecast and its practical role in the protection of forests in the northern hemisphere. Conifers Boreal Zone 2007, XXIV, 207–216. [Google Scholar]
- Koroleva, T.S.; Konstantinov, A.V.; Shunkina, E.A. Threats and socio-economic impacts of climate change for the forest sector. Proc. St. Petersburg Res. Inst. 2015, 3, 55–77. [Google Scholar]
- Kurganova, I.N.; de Gerenyu, V.O.L.; Myakshina, T.N.; Sapronov, D.V.; Shorohova, E.V.; Savin, I.Y. Carbon balance in forest ecosystems of southern part of Moscow region under a rising aridity of climate. Contemp. Probl. Ecol. 2017, 10, 748–760. [Google Scholar] [CrossRef]
- Alekseev, V.A.; Markov, M.V. Statistical Data on the Forest Fund and Changes in Forest Productivity in Russia in the Second Half of the Twentieth Century; St. PetersburgSaint-Petersburg Forest Ecological Center (SPLEC): St. Petersburg, Russia, 2003; 270p. [Google Scholar]
- McMahon, S.M.; Parker, G.G.; Miller, D.R. Evidence for a recent increase in forest growth. Proc. Natl. Acad. Sci. USA 2010, 107, 3611–3615. [Google Scholar] [CrossRef] [Green Version]
- Zamolodchikov, D.G. Carbon cycle and climate change. Environ. Energy Sci. 2021, 2, 53–69. [Google Scholar]
- Zamolodchikov, D.G.; Kobyakov, K.K.; Kokorin, A.O.; Aleinikov, A.A.; Shmatkov, N.M. Forest and Climate; World Wildlife Fund: Moscow, Russia, 2015; 40p. [Google Scholar]
- Torzhkov, I.O.; Koroleva, T.S.; Konstantinov, A.V.; Kushnir, E.A. Analysis of the adaptation measures complex to expected climate changes in the forest-based sector of the Russian Federation. Proc. St. Petersburg Res. Inst. 2017, 3, 13–22. [Google Scholar] [CrossRef]
- Sychev, V.G.; Naliukhin, A.N. Climate change and carbon neutrality: Modern challenges facing agricultural science. Fertility 2021, 5, 3–7. [Google Scholar]
- Morkovina, S.S.; Panyavina, E.A.; Shanin, I.I.; Avdeeva, I.A. Economic aspects of carbon farms organization on forest lands. Curr. Dir. Sci. Res. XXI Century Theory Pract. 2021, 9–1, 17–25. [Google Scholar]
- Danilin, M.A. Tables for the Inventory of Aspen Plantations in Sibieria; Krasnoyarsk State Agrarian University: Krasnoyarsk, Russia, 1994; 65p. [Google Scholar]
- Kolomyts, E.G.; Surova, N.A. Methods for calculating the carbon balance of forest ecosystems under global climate change. Samar. Luka Probl. Reg. Glob. Ecol. 2019, 28, 189–218. [Google Scholar]
- Sergienko, V.G. The expected impact of climate change on carbon balance and ecosystem productivity in the forest sector of the Russian Federation. Proc. St. Petersburg Res. Inst. 2018, 1, 74–90. [Google Scholar] [CrossRef]
- Loudermilk, L.E.; Scheller, R.M.; Weisberg, P.J.; Yang, Y.; Dilts, T.E.; Karam, S.L.; Scinner, C. Carbon dynamics in the future forest: The importance of long-term successional legacy and climate-fire interactions. Glob. Chang. Biol. 2013, 19, 3502–3515. [Google Scholar] [CrossRef]
- Licshstein, J.W.; Wirth, C.; Horn, H.S.; Pacala, S.W. Biomass chronosequences of United States forests: Implications for carbon storage and forest management. Old Growth For. Funct. Fate Value 2009, 2009, 301–341. [Google Scholar]
- Zamolodchikov, D.G.; Utkin, A.I.; Chestnykh, O.V. Conversion coefficients of plantation stocks into phytomass for the main forest-forming species of Russia. For. Inventory For. Manag. 2003, 1, 119–127. [Google Scholar]
- Vedrova, E.F. Biogenic carbon fluxes in the boreal forests of Central Siberia. Proc. Russ. Acad. Sciences. Biol. Ser. 2011, 1, 77–89. [Google Scholar]
- Fedorov, B.G. Russian Carbon Balance; Scientific Consultant: Moscow, Russia, 2017; 82p. [Google Scholar]
- Filipchuk, A.N.; Malysheva, N.V.; Moiseev, B.N. The Main Provisions of the Methodology for Accounting for CO2 Absorption in the Forests of the Russian Federation; All-Russian Research Institute for Silviculture and Mechanization of Forestry (VNIILM): Moskow, Russia, 2019; pp. 1–12. [Google Scholar]
- Filipchuk, A.N.; Malysheva, N.V.; Zolina, T.A.; Yugov, A.N. Boreal Forests of Russia: Opportunities for Climate Change Mitigation. For. Inf. Electron. Online J. 2020, 1, 92–113. [Google Scholar] [CrossRef]
- Mozolevskaya, E.G.; Kataev, O.A.; Sokolova, E.S. Methods of Forest Pathological Examination of Foci of Stem Pests and Forest Diseases; Lesnaya Promyshlennost: Moscow, Russia, 1984; p. 152. [Google Scholar]
- Rules for Sanitary Safety in Forests: Approved by the Decree of the Government of the Russian Federation of 9 December 2020 N 2047. p. 24. Available online: http://publication.pravo.gov.ru/Document/View/0001202012110016 (accessed on 20 October 2022).
- Eggleston, S.; Buendia, L.; Miwa, K. IPCC Guidelines for National Greenhouse Gas Inventories [Recurso Electrónico]: Waste; Institute for Global Environmental Strategies: Kanagawa, Japan, 2006. [Google Scholar]
- Efimov, O.; Gura, D.; Makar, S.; Mustafin, R. Potential for carbon sequestration and the actual forest structure: The case of Krasnodar Krai in Russia. Cent. Eur. For. J. 2022, 68, 15–22. [Google Scholar] [CrossRef]
- Poudel, A.; Sasaki, N.; Abe, I. Assessment of carbon stocks in oak forests along the altitudinal gradient: A case study in the Panchase Conservation Area in Nepal. Glob. Ecol. Conserv. 2020, 23, e01171. [Google Scholar] [CrossRef]
- Podpirigora, I.A.; Tuvyshkina, M.A.; Revin, A.I. Growth progress and commodity structure of aspen plantations of Ostrogozhsk forestry in Voronezh region. Curr. Dir. Sci. Res. XXI Century Theory Pract. 2020, 8–3, 327–332. [Google Scholar]
- Vyvodcev, N.V.; Vahnin, A.V.; Vyvodceva, A.N. Age structure and performance of David aspen (Populus davidiana dode) on the Northern limit of their distribution. For. Inventory For. Manag. 2010, 2, 37–42. [Google Scholar]
- Schmidt, V.M. Mathematical Methods in Botany. Leningrad State University: St. Petersburg, Russia, 1984; 288p. [Google Scholar]
- Vorster, A.G.; Evangelista, P.H.; Stovall, A.E.L.; Ex, S. Variability and uncertainty in forest biomass estimates from the tree to landscape scale: The role of allometric equations. Carbon Balance Manag. 2020, 15, 1–20. [Google Scholar] [CrossRef]
- Shu-Qin, L.; Zhen, B.; Chao-Zong, X.; Ahmad, B.; Ming, Z.; Jian, C.; An, T.-Y.; Zhang, K.-B. Forest biomass carbon pool dynamics in Tibet Autonomous Region of China: Inventory data 1999–2019. PLoS ONE 2021, 16, e0250073. [Google Scholar] [CrossRef]
- Palchikov, S.B.; Ytkina, E.S. Indication of aspen forest stands condition by dendrochronological methods. For. Bull. 2014, 18, 122–124. [Google Scholar]
- Knott, J.; Domke, G.; Woodall, C.; Walters, B.; Jenkins, M.; Fei, S. Shifting Forests and Carbon: Linking Community Composition and Aboveground Carbon Attributes. Ecosystems 2022, 2022, 1–16. [Google Scholar] [CrossRef]
- Laganière, J.; Boča, A.; Van Miegroet, H.; Paré, D. A Tree Species Effect on Soil That Is Consistent across the Species’ Range: The Case of Aspen and Soil Carbon in North America. Forests 2017, 8, 113. [Google Scholar] [CrossRef]


| Relationship | Equation | Function Coefficients | R | mx | |||
|---|---|---|---|---|---|---|---|
| a | b | c | d | ||||
| Δc = f(A) 1972 | Rational Function Δc = (a + b × A)/ (1 + c × A + d × A2) | −3.37 × 10⁻² | 7.45 × 10⁻² | −2.29 × 10⁻² | 5.17 × 10⁻⁴ | 0.94 | 0.41 |
| Δc = f(A) 1982 | −2.79 × 10⁻³ | 5.81 × 10⁻¹ | 8.23 × 10⁻² | 1.28 × 10⁻³ | 0.98 | 0.30 | |
| Δc = f(A) 2002 pure | −3.63 × 10⁻³ | 1.38 × 10⁻¹ | −2.14 × 10⁻² | 7.40 × 10⁻⁴ | 0.95 | 0.52 | |
| Age, Years | 1972 | 1982 | 2002 Mixed Stands | 2002 Pure Stands | ||||
|---|---|---|---|---|---|---|---|---|
| m3/ha | Increment, Tons C/Year | m3/ha | Increment, Tons C/Year | m3/ha | Increment, Tons C/year | m3/ha | Increment, Tons C/Year | |
| 5 | 1.40 | 0.45 | 2.01 | 0.65 | 0.70 | 0.23 | 0.71 | 0.23 |
| 10 | 1.94 | 0.63 | 2.97 | 0.96 | 1.38 | 0.45 | 1.73 | 0.56 |
| 15 | 2.44 | 0.79 | 3.45 | 1.11 | - | - | - | - |
| 20 | 2.83 | 0.91 | 3.68 | 1.19 | 2.64 | 0.85 | - | - |
| 25 | 3.09 | 1.00 | 3.75 | 1.21 | - | - | 4.30 | 1.39 |
| 30 | 3.23 | 1.04 | 3.77 | 1.22 | 3.41 | 1.10 | 4.59 | 1.48 |
| 35 | 3.26 | 1.05 | 3.73 | 1.20 | 3.58 | 1.16 | - | - |
| 40 | 3.21 | 1.04 | 3.67 | 1.18 | 3.63 | 1.17 | 4.36 | 1.41 |
| 45 | 3.11 | 1.00 | 3.58 | 1.16 | 3.60 | 1.16 | 3.99 | 1.29 |
| 50 | 2.98 | 0.96 | 3.49 | 1.13 | 3.51 | 1.13 | 3.61 | 1.17 |
| 55 | 2.83 | 0.91 | 3.40 | 1.10 | 3.39 | 1.09 | 3.29 | 1.06 |
| 60 | 2.68 | 0.87 | 3.31 | 1.07 | 3.25 | 1.05 | 3.10 | 1.00 |
| 65 | - | - | 3.21 | 1.04 | 3.10 | 1.00 | 3.07 | 0.99 |
| 70 | - | - | - | - | 2.95 | 0.95 | 3.17 | 1.02 |
| 75 | - | - | - | - | 2.81 | 0.91 | 3.26 | 1.05 |
| 80 | - | - | - | - | 2.67 | 0.86 | 3.13 | 1.01 |
| 85 | - | - | - | - | 2.54 | 0.82 | - | - |
| Age, Years | M, m3/ha | Natural Mortality | Pathogens-Induced Mortality | ||||||
|---|---|---|---|---|---|---|---|---|---|
| % | Growing Stock, m3/ha | Phytomass, t/ha | Carbon, tc/ha | % | Growing Stock, m3/ha | Phytomass, t/ha | Carbon, tc/ha | ||
| 50 | 179 | 3 | 5.4 | 3.59 | 1.20 | 5 | 9.0 | 5.99 | 2.01 |
| 55 | 192 | 3 | 5.8 | 4.20 | 1.41 | 5 | 9.6 | 7.01 | 2.35 |
| 60 | 204 | 5 | 10.2 | 7.45 | 2.49 | 10 | 20.4 | 14.89 | 4.99 |
| 65 | 216 | 5 | 10.8 | 7.88 | 2.64 | 10 | 21.6 | 15.77 | 5.28 |
| 70 | 227 | 10 | 22.7 | 16.57 | 5.55 | 15 | 34.1 | 24.86 | 8.33 |
| 75 | 237 | 10 | 23.7 | 17.30 | 5.80 | 15 | 35.6 | 25.95 | 8.69 |
| 80 | 247 | 15 | 37.1 | 27.05 | 9.06 | 20 | 49.4 | 36.06 | 12.08 |
Disclaimer/Publisher’s Note: The statements, opinions and data contained in all publications are solely those of the individual author(s) and contributor(s) and not of MDPI and/or the editor(s). MDPI and/or the editor(s) disclaim responsibility for any injury to people or property resulting from any ideas, methods, instructions or products referred to in the content. |
© 2023 by the authors. Licensee MDPI, Basel, Switzerland. This article is an open access article distributed under the terms and conditions of the Creative Commons Attribution (CC BY) license (https://creativecommons.org/licenses/by/4.0/).
Share and Cite
Vais, A.A.; Popova, V.V.; Andronova, A.A.; Nemich, V.N.; Nepovinnykh, A.G.; Mikhaylov, P.V. Assessment of Carbon Productivity Dynamics in Aspen Stands under Climate Change Based on Forest Inventories in Central Siberia. Forests 2023, 14, 109. https://doi.org/10.3390/f14010109
Vais AA, Popova VV, Andronova AA, Nemich VN, Nepovinnykh AG, Mikhaylov PV. Assessment of Carbon Productivity Dynamics in Aspen Stands under Climate Change Based on Forest Inventories in Central Siberia. Forests. 2023; 14(1):109. https://doi.org/10.3390/f14010109
Chicago/Turabian StyleVais, Andrey Andreevich, Valentina Valerievna Popova, Alina Andreevna Andronova, Viktor Nikolaevich Nemich, Artem Gennadievich Nepovinnykh, and Pavel Vladimirovich Mikhaylov. 2023. "Assessment of Carbon Productivity Dynamics in Aspen Stands under Climate Change Based on Forest Inventories in Central Siberia" Forests 14, no. 1: 109. https://doi.org/10.3390/f14010109